A solar optical hyperspectral library of rare-earth-bearing minerals, rare-earth oxide powders, copper-bearing minerals and Apliki mine surface ...
←
→
Page content transcription
If your browser does not render page correctly, please read the page content below
Earth Syst. Sci. Data, 13, 923–942, 2021
https://doi.org/10.5194/essd-13-923-2021
This work is distributed under
the Creative Commons Attribution 4.0 License.

       A solar optical hyperspectral library of rare-earth-bearing
          minerals, rare-earth oxide powders, copper-bearing
               minerals and Apliki mine surface samples
         Friederike Koerting1 , Nicole Koellner1 , Agnieszka Kuras1 , Nina Kristin Boesche1 , Christian Rogass1 ,
                                Christian Mielke1 , Kirsten Elger1 , and Uwe Altenberger2
                         1 GFZ   German Research Centre for Geosciences, Potsdam, 14473, Germany
                         2 Universityof Potsdam, Institute of Geosciences, Potsdam, 14476, Germany
                              Correspondence: Friederike Körting (koerting@gfz-potsdam.de)
                                        and Nicole Koellner (nicolek@gfz-potsdam.de)
                                Received: 19 November 2019 – Discussion started: 9 December 2019
                          Revised: 1 February 2021 – Accepted: 2 February 2021 – Published: 9 March 2021

       Abstract. Mineral resource exploration and mining is an essential part of today’s high-tech industry. Elements
       such as rare-earth elements (REEs) and copper are, therefore, in high demand. Modern exploration techniques
       from multiple platforms (e.g., spaceborne and airborne), to detect and map the spectral characteristics of the ma-
       terials of interest, require spectral libraries as an essential reference. They include field and laboratory spectral
       information in combination with geochemical analyses for validation. Here, we present a collection of REE- and
       copper-related hyperspectral spectra with associated geochemical information. The libraries contain reflectance
       spectra from rare-earth element oxides, REE-bearing minerals, copper-bearing minerals and mine surface sam-
       ples from the Apliki copper–gold–pyrite mine in the Republic of Cyprus. The samples were measured with the
       HySpex imaging spectrometers in the visible and near infrared (VNIR) and shortwave infrared (SWIR) range
       (400–2500 nm). The geochemical validation of each sample is provided with the reflectance spectra. The spectral
       libraries are openly available to assist future mineral mapping campaigns and laboratory spectroscopic analyses.
       The spectral libraries and corresponding geochemistry are published via GFZ Data Services with the follow-
       ing DOIs: https://doi.org/10.5880/GFZ.1.4.2019.004 (13 REE-bearing minerals and 16 oxide powders, Koerting
       et al., 2019a), https://doi.org/10.5880/GFZ.1.4.2019.003 (20 copper-bearing minerals, Koellner et al., 2019), and
       https://doi.org/10.5880/GFZ.1.4.2019.005 (37 copper-bearing surface material samples from the Apliki copper–
       gold–pyrite mine in Cyprus, Koerting et al., 2019b). All spectral libraries are united and comparable by the
       internally consistent method of hyperspectral data acquisition in the laboratory.

1   Introduction                                                    geochemical analyses of the sampled minerals and materials.
                                                                    The geochemical analyses can be used to check and inter-
Reflectance spectroscopy is based on measuring the reflected        pret the hyperspectral spectra. Spectral libraries are essential
solar radiation from a material of interest. It uses photosen-      in the field of imaging reflectance spectroscopy for mapping
sitive detectors to record and analyze light reflected or scat-     purposes. For example, the spatial distribution of ore-related
tered from the surface. The spectrum of the reflected light is      mineral phases can be mapped by comparing unknown re-
unique for each material and acts like a spectral fingerprint.      flectance pixel spectra with known reflectance material spec-
Spectral libraries are comprehensive collections representing       tra from a spectral library. The data that are being analyzed
optical properties of materials in a specific wavelength range.     are hyperspectral data cubes that are collected by, e.g., satel-
In this data collection, hyperspectral spectra were collected       lite, unmanned aerial vehicle (UAV) or tripod platforms to
under standardized laboratory or field conditions and include

Published by Copernicus Publications.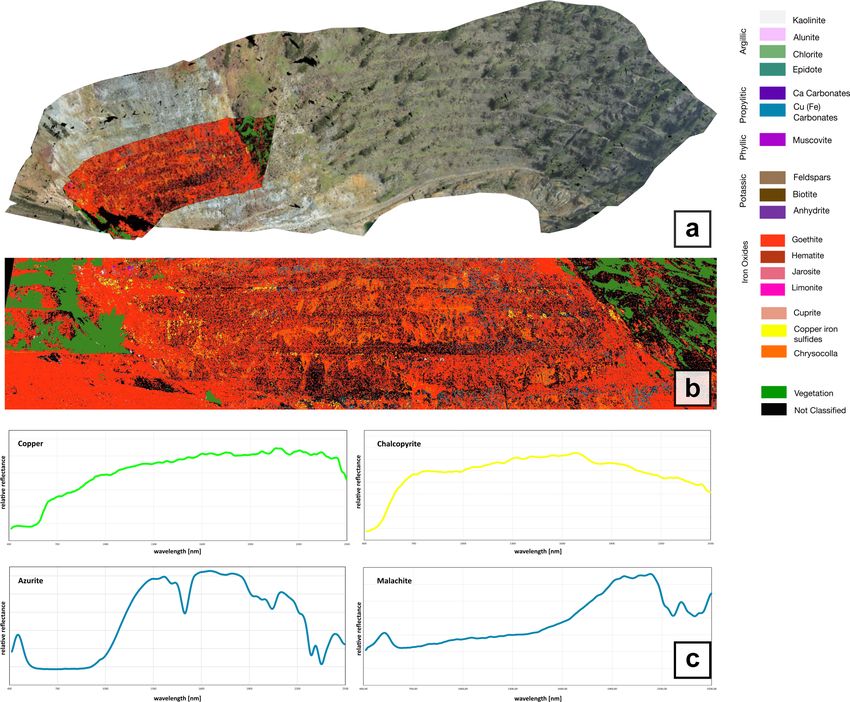
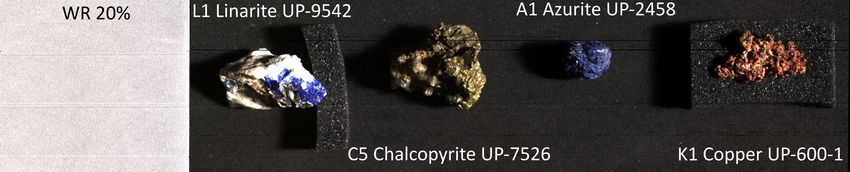
924                                       F. Koerting et al.: Hyperspectral library of rare-earth- and copper-bearing samples

detect and map element or mineral occurrences in natural and       missions (Guanter et al., 2015; Iwasaki et al., 2011; Tong
in man-made surfaces.                                              et al., 2014). For those missions, the imaging spectroscopy
   The distinction of different surface materials or minerals      community is currently developing methodologies, e.g., for
is based on the nature of their reflectance spectral charac-       the detection of REEs in the image spectra (Boesche et al.,
teristics. The recorded reflectance spectral information is a      2015; Boesche et al., 2017; Bösche, 2015; Herrmann, 2019;
function of the chemical and physical properties of the target     van der Meer et al., 2012; Turner et al., 2014a, b; Turner,
material which cause different reactions to the incoming light     2015).
on a molecular and atomic level (Clark, 1999; Hunt, 1989).            We aim to contribute to the already existing, accredited
   Spectral sensors collect the number of photons that are         libraries, e.g., the USGS and the ECOSTRESS Spectral Li-
emitted or reflected per wavelengths by the material in each       brary and various others (Baldridge et al., 2009; Clark et al.,
measured ground pixel. The interaction of the incoming light       2007; Hunt, 1977; Kokaly et al., 2017; Meerdink et al., 2019;
or radiant flux in a specific wavelength with the matter can       Percival et al., 2016). The available reflectance spectral li-
reveal important information about the matter itself (Jensen,      braries are commonly based on powdered natural or synthetic
2010). This interaction can be the absorption of a photon of a     samples that are spectrally pure. The spectral data are usu-
discrete energy state by an isolated atom or ion. This changes     ally collected by point spectroradiometers, e.g., the Analyt-
the atom’s or ion’s energy state. During this process energy is    ical Spectral Devices (ASD) FieldSpec® 3. Our contributed
emitted that is not equal to the discrete energy of absorption     reflectance spectra are based on imaging spectroscopy data
which causes emissions at a different wavelength and creates       from the HySpex classic series scanning samples in a natu-
absorption bands or absorption features (Clark, 1999; Hunt,        ral and a powdered state. Reflectance spectral libraries like
1989). The absorption feature position, depth and width de-        the here presented, based on HySpex imaging data and un-
pend on the different absorption processes taking place, the       treated samples, are not yet freely available for the hyper-
kind of chemical bond, the elements involved, and the ab-          spectral community.
sorbing ion or molecule and its position in the crystal lattice.      The spectral and geochemical information of samples pre-
Absorption features in the visible and near infrared (VNIR:        sented here belongs to three different mineral assemblages
400 to 1000 nm) and shortwave infrared (SWIR: 1000 to              and corresponds to three different types of deposits. The sam-
2500 nm) wavelength region are caused by electronic and            ple’s spectral information is provided within four spectral li-
vibrational processes within the molecule or crystal lattice.      brary files and their corresponding geochemical composition
The position and cause of these reflectance absorption fea-        files. The four spectral library files represent (1) REE-bearing
tures are discussed in detail, e.g., in Clark (1999, 2003) and     minerals, (2) synthetic REE oxide powders (Koerting et al.,
Hunt (1989).                                                       2019a), (3) copper-bearing minerals (Koellner et al., 2019)
   Hyperspectral data of geological surfaces can be acquired       and (4) powders of copper-bearing surface material from the
by ground- or UAV-based outcrop scans to map an ore body’s         Apliki copper–gold–pyrite mine in the Republic of Cyprus
surface mineral distribution by using spectral references li-      (Koerting et al., 2019b). Spectrally, the libraries cover the full
braries. An example of a hyperspectral surface mapping is          wavelength range of the solar optical range (414–2498 nm).
shown in Fig. 1. Here, the outcrop of former copper–gold–          The corresponding geochemical analyses are explained in the
pyrite mine Apliki in the Republic of Cyprus was scanned           methods for each sample type. The two REE libraries (Koert-
hyperspectrally and mapped utilizing a spectral library of         ing et al., 2019a) consist of the spectra of 16 rare-earth oxide
expected surface minerals. The analysis is based on United         (REO) powders and 13 REE-bearing minerals (REMin). In
States Geological Survey (USGS) reflectance spectra. As the        addition, the spectra of niobium- and tantalum-oxide pow-
USGS spectral library entries do not originate from the same       ders are provided, which will not be mentioned further indi-
sensor as the mine face scan (HySpex data), they need to be        vidually but be included in the term REO. The third spectral
spectrally adapted to the HySpex sensor properties.                library includes 20 copper-bearing minerals (Koellner et al.,
   In the case of minerals reflectance spectra, only hyper-        2019), and the fourth spectral library contains 37 surface
spectral sensors with a spectral bandwidth resolution of ap-       samples from the Apliki copper–gold–pyrite mine site in the
proximately 10 nm or less can capture the fine differences         Republic of Cyprus (Koerting et al., 2019b). All spectral li-
in reflectance at certain wavelength positions (Jensen, 2010).     braries are united and comparable by the internally consistent
Future hyperspectral imaging satellites will provide the nec-      method of hyperspectral data acquisition in the laboratory.
essary data quality requirements to successfully map rare-         An extensive list of the samples can be found in the technical
earth elements (REEs), copper deposits and other resources         reports provided with each dataset.
from space. These satellites will play an important role in           The samples are presented as reflectance spectral libraries
the future of geological exploration to help map large miner-      and their geochemical composition. Sample nominations are
alized areas in remote regions (Mielke et al., 2016; Swayze        based on the geological collection of origin or sample abbre-
et al., 2014). Several global mapping satellite missions will      viations from the field sampling. The sample nomination is
be launched in the next few years. Among them are the Ger-         not an interpretation of the presented geochemical data. The
man EnMAP, the Chinese CCRSS-A and the Japanese HISUI              datasets are independent of each other, and the reflectance

Earth Syst. Sci. Data, 13, 923–942, 2021                                             https://doi.org/10.5194/essd-13-923-2021
F. Koerting et al.: Hyperspectral library of rare-earth- and copper-bearing samples                                                    925

Figure 1. Example for the application of a spectral library. (a) Three-dimensional model of the open-pit Apliki mine in the Republic of
Cyprus based on RGB images and a superimposed analysis result of a hyperspectral HySpex scan. The hyperspectral map of the spatial
mineral distribution from panel (b) is stacked on the 3D model for visualization purposes. (b) Analysis of a HySpex scan using a custom-
made spectral library from USGS spectra (Clark et al., 2007). (c) Example of hyperspectral spectra from copper-bearing minerals as presented
in Koellner et al. (2019).

spectra can be seen as a spectral expression of the exist-              separate data description and the geochemical analysis re-
ing geochemical data. Neither the geochemistry nor the re-              sults are included as data reports in the three different data
flectance spectra are interpreted or correlated to each other.          publications (Koellner et al., 2019; Koerting et al., 2019a, b).
   The outline of this document follows the necessary line
of knowledge to successfully make use of the here presented             2   Materials
spectral libraries. Section 2 includes a description of the an-
alyzed materials, and Sect. 3 informs about the methods, in-            The REE sample material includes 16 REO powders (REO)
cluding the sample preparation and spectra collection, the              and 13 REE-bearing minerals (REMin). The REO pow-
hyperspectral data acquisition, covering the processing of the          ders belong to a series of rare-earth metals and compounds
data and spectral measurement parameters, and the geochem-              (REacton® ) and were purchased from Alfa Aesar. All REO
ical analyses of the samples. Section 4 lists the samples that          powders contained at least 99.9 % of the REE oxide, as per
were measured spectrally and geochemically and the data of              the seller-supplied concentration certificates. The concentra-
which can be accessed via the GFZ Data Services platform.               tion certificate information can be found in the data descrip-
Section 5 discusses the parameters influencing the data. A              tion of Koerting et al. (2019a). The REO powders were ob-

https://doi.org/10.5194/essd-13-923-2021                                                    Earth Syst. Sci. Data, 13, 923–942, 2021
926                                       F. Koerting et al.: Hyperspectral library of rare-earth- and copper-bearing samples

tained as high-purity materials with a grain size of < 63 µm.
The REMin samples (ore minerals) were purchased from
Gunnar Färber Minerals, an online trader of mineral speci-
mens. The mineral notation is based on the sample name pro-
vided by Gunnar Färber Minerals. The supplier offers analyt-
ical services with a modern scanning electron microscopy–
energy-dispersive X-ray spectroscopy (SEM-EDX) technol-
ogy, and therefore we assume the specimens are analyzed
and the mineral species is validated before the sale. The X-
ray fluorescence (XRF) data presented in the data description
of Koerting et al. (2019a) should be consulted to validate the
given mineral nomination noted by Gunnar Färber Minerals.
   The 20 copper-bearing minerals belong to collections of        Figure 2. Holmium-oxide powder in the laboratory HySpex setting
the University of Potsdam (UP) and the Federal Institute for      in a quartz glass petri dish underlain by black cellular rubber. Ge-
Geosciences and Natural Resources (BGR); a samples list           ometric markers for the pre-processing were placed alongside the
can be found in Koellner et al. (2019). The minerals were         sample.
measured hyperspectrally with no sample preparation; the
sample photos and geochemical analysis are provided in the
data description for Koellner et al. (2019). The 37 Apliki
mine surface samples were collected (Koerting et al., 2019b)
in March 2018 during a field campaign of the Geological Sur-
vey Department of the Republic of Cyprus (GSD) and the
GFZ German Research Centre for Geosciences (GFZ). Sur-
face material in the mine was collected and prepared (crushed
and pulverized) for the geochemical analysis by Bureau Ver-
itas Minerals (BVM). The powdered samples were measured
hyperspectrally as powder tablets; a sample list including
photos from the in situ conditions of the samples can be          Figure 3. Xenotime embedded in quartz as an example for the
found in the technical report (Koerting et al., 2019b).           REE-bearing mineral samples.

3     Methods
                                                                  ple preparation on black cellular rubber, as is shown for the
3.1    Sample preparation and spectra collection
                                                                  copper-bearing minerals in Fig. 4. For all measurements, the
                                                                  final reflectance spectral analyses were spatially reduced to
The sample preparation varies by sample type and depends          the center pixels of each identified REE-bearing mineral or
on the material and the information of interest. This is based    a 5 pixel × 5 pixel average reflectance spectrum centered on
on the research projects that the samples stem from and for       the REO powder sample. Shadow effects from the sidewalls
which the spectral and geochemical data were acquired.            of the boxes could thus be minimized. One representative re-
   The reflectance spectra for each sample were manually ex-      flectance spectrum of every REMin and REO sample was
tracted from the processed hyperspectral image scenes by av-      collected for the spectral library (Herrmann, 2019).
eraging a number of pixels over a central sample area. The re-       The copper-bearing mineral samples were measured with-
sulting spectra were compiled in a spectral library. Thereby,     out any sample preparation as the variable surface of the
each reflectance spectrum of a spectral library represents an     minerals and the influence of the mineral structure were of
average reflectance spectrum of the material, depending on        interest. Figure 4 shows an example scan of some of the
the sample size and spectral homogeneity. The extraction of       copper-bearing minerals. The full sample list including sam-
the reflectance spectra is explained in detail in each data de-   ple photos and the marked area of the geochemical sam-
scription (Koellner et al., 2019; Koerting et al., 2019a, b).     pling can be found in the technical report (Koellner et al.,
   The REO powders were measured in 100 % quartz glass            2019). The area used to obtain the spectrum, averaging over
petri dishes underlain by black cellular rubber; each powder      a 5 pixel × 5 pixel window, was sampled afterwards for the
was measured separately. Figure 2 shows the measurement           geochemical analysis.
setup of holmium-oxide powder as an example for the REO              The Apliki mine samples were crushed and powdered so
powders. The REE-bearing minerals were measured sepa-             that ≥ 85 % of the sample was below 75 µm. Homogenized
rately. Figure 3 shows the xenotime sample (brownish single       powders were measured as pressed powder tablets (Fig. 5).
crystal embedded in quartz) as an example for the REMin           The area to obtain the sample’s reflectance spectrum was
samples. The REMin samples were measured without sam-             chosen over a 5 pixel × 5 pixel window in the center of the

Earth Syst. Sci. Data, 13, 923–942, 2021                                             https://doi.org/10.5194/essd-13-923-2021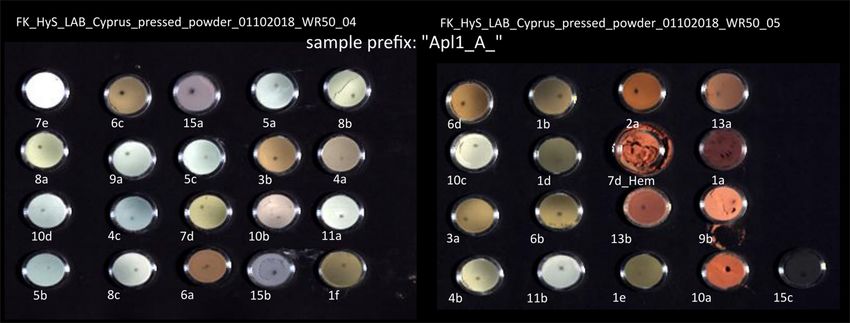
F. Koerting et al.: Hyperspectral library of rare-earth- and copper-bearing samples 927
Figure 4. Showing HySpex scan MH_FK_LAB_Cudetect_008_09012018_WR20 as an example to highlight the lack of sample preparation.
powder tablet to minimize influences from the tablet’s metal Table 1. HySpex sensor parameters of the VNIR-1600 (VNIR) and
frame. The dark spots in each tablet were caused by previous SWIR-320m-e (SWIR).
measurements with a laser-induced breakdown spectrometer
(LIBS). The hyperspectral sample spots were chosen in order HySpex sensor parameters
to exclude the measurement points of the LIBS in the spectral Lamp arrangement 45◦
footprint. In the case of broken powder tablets like 7d_Hem, VNIR SWIR
the shadowed, rough surface areas were excluded from the Wavelength range [nm] 414–993 967–2498
spectral sampling, and an even powder surface was favored. Pixels per line 1600 320
Sampling interval [nm] 3.7 6
Radiometric resolution 12 bit 14 bit
3.2 HySpex data recording Light source Halogen GX6.35, 2 × 1000 W
The HySpex VNIR-1600 and SWIR-320m-e (technical
description available at http://hyspex.no/products/disc.php,
last access: 18 June 2019) are two line-scanning cameras 45◦ between the incident light and the vertical plane. The dis-
mounted in parallel. They cover the range of the visi- tance between the lamp and the HySpex cameras was higher
ble to near infrared (VNIR, 414–993 nm) and the short- compared to the distance between the samples and the sensor
wave infrared (SWIR, 967–2498 nm) wavelength region. The to ensure diffuse illumination and to avoid thermal influence
sensors record an array line of 1600 pixels (VNIR) and on the cameras and the samples. The integration time (mean-
320 pixels (SWIR) (push-broom scanning). Every pixel con- ing measurement time for each image line) was tested to be
tains a spectrum with a total spectral sampling number of 408 as high as possible to suppress the impact of signal uncor-
bands in total. related Gaussian white noise and at the same time as low
The HySpex cameras are provided with two acquisition as needed to avoid detector saturation. For all measurements
modes: one for airborne data collection and one for labo- the integration time was chosen with respect to the sample
ratory measurements. In laboratory mode, the cameras are albedo. The HySpex sensor characteristics are listed in Ta-
combined with a trigger pulse-moving sleigh (translation ble 1. The settings used for the REMin and REOs are listed
stage) of a definable frame period (depending on the integra- in Table 2, the settings for the copper-bearing minerals in
tion time of every array-line acquisition). The configuration Table 3 and the settings for the Apliki mine samples in Ta-
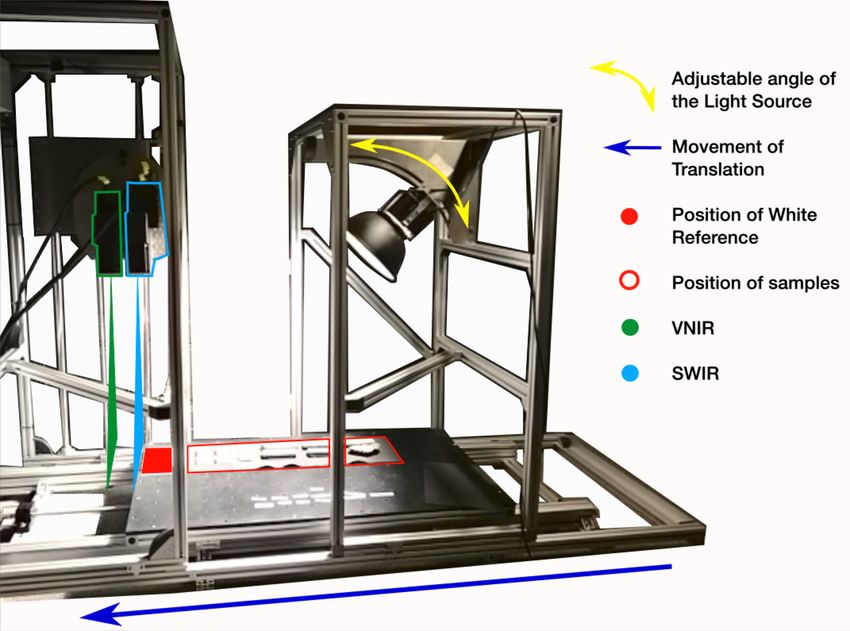
of the translation stage framework, the cameras and the light ble 4. The laboratory is equipped with black-painted walls
source (Halogen GX6.35, 2 × 1000 W, 45◦ illumination an- and doors, as well as black curtains to avoid reflected light
gle) are fixed, while the sleigh and the samples are moving from surfaces other than the sample; an example setup of the
through the focal plane (Rogass et al., 2017). sensors, the translation stage and the samples can be seen
The reflectance level of a white reference panel, placed in in Fig. 6. The laboratory conditions were kept stable, the air
line with the samples, is chosen according to the albedo of the temperature was regulated to 21 ± 0.5 ◦ C and the humidity
samples. The higher the albedo of the sample, the higher is was below 70 % for all measurements. Black cellular rubber
the diffuse reflectance factor of the white reference panel that is used as a base material for all samples for hyperspectral
is chosen. For the REE samples (REMin and REO), a white data acquisition. It reflects less than 5 % on average of the
reference panel of 95 % reflectance was used because most incoming radiation.
of the REO samples were bright, white powders of a high Detailed descriptions for the GFZ standard measurements
albedo; this is based on test measurements of Bösche (2015), and the process chain can be found in Rogass et al. (2017).
Herrmann (2019). The Apliki samples required a 50 % re-
flectance white reference panel, whereas the copper-bearing 3.3 Hyperspectral data processing
minerals were measured using a 20 % reflectance white refer-
ence panel. Both the geometrical setup and the heat-up time Each measurement run produces one VNIR and one SWIR
of the lamp influence the configuration of the light source. 3D data cube. The three dimensions are the two spatial x
The maximum illumination was obtained with an angle of and y dimensions and the spectral z dimension. The 3D im-
https://doi.org/10.5194/essd-13-923-2021 Earth Syst. Sci. Data, 13, 923–942, 2021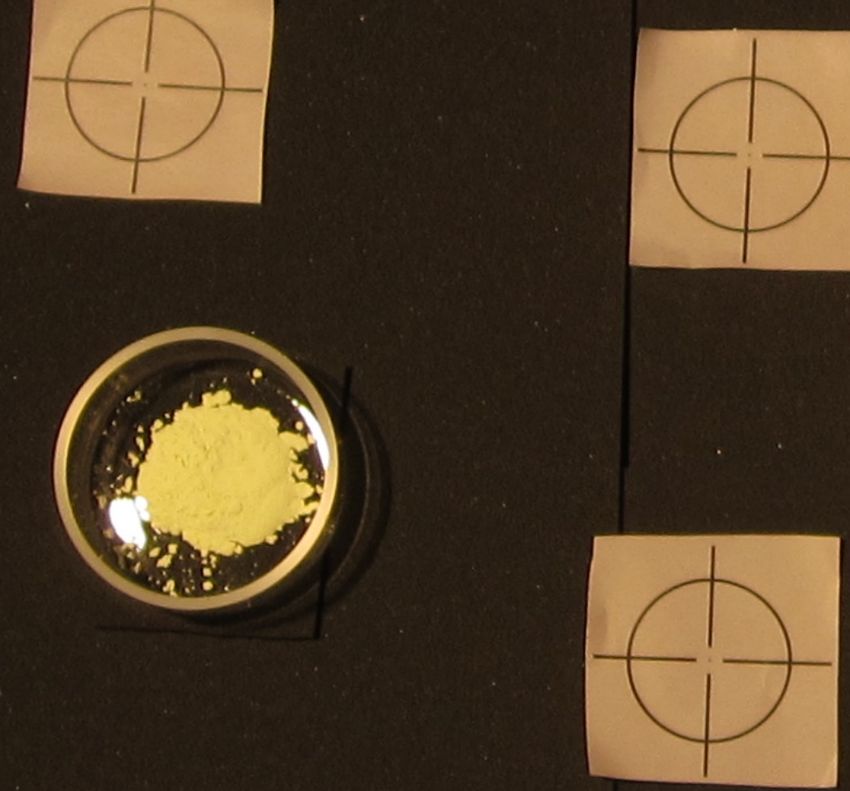
928                                         F. Koerting et al.: Hyperspectral library of rare-earth- and copper-bearing samples

Figure 5. Showing the Apliki mine samples prepared as powder tablets.

Table 2. HySpex settings for laboratory measurements of the REO and REMin (Koerting et al., 2019a, modified following Bösche, 2015;
Herrmann, 2019). “eq” stands for CCD equalization filter; “px” stands for pixels.

                                  HySpex settings
                                  Distance, sample to sensor          1m
                                  Sensor arrangement head to head     1 m lenses, eq on VNIR
                                                                      VNIR (1600 px) SWIR (320 px)
                                  Integration time [µs]               30 000             5000
                                  Frame period [µs]                   31 000             123 506

                                                                        line reference spectrum. The reflectance was calculated by
                                                                        dividing every image line spectrum by its reference spectrum
                                                                        from the reflecting white reference panel. The resulting re-
                                                                        flectance data are scaled from 0–10 000. A detailed descrip-
                                                                        tion for the laboratory setup and processing can be found in
                                                                        Rogass et al. (2017). The software HySpex Ground was used
                                                                        to perform the measurements, and the software HySpex Rad
                                                                        was used to perform the radiometric calibration on the image
                                                                        data.

                                                                        3.4     Geochemical sample analysis for sample
                                                                                characterization
                                                                        Depending on the sample type, the geochemical analysis
                                                                        methods differ. The methods used for each sample type are
                                                                        listed in Table 5.
Figure 6. The HySpex translation stage setup (Körting, 2019).

                                                                        3.4.1       Thermo Niton XL3t (XRF)
                                                                        REMin
age cubes are produced by moving a homogeneous reflect-
ing white reference panel and the samples through the fo-               The geochemical measurements for the REMin samples were
cal plane of the two sensors. The VNIR image cube is re-                performed using an X-ray fluorescence (XRF) instrument –
sized to the spatial dimensions of the SWIR data cube, co-              Thermo Niton XL3t (Fisher Scientific, 2002). The XL3t is
registered and stacked with the SWIR data cube, resulting               a lightweight, hand-held XRF analyzer. The measurement
in a continuous image cube with the spectral range of 414–              principle follows the principle of X-ray fluorescence, where
2498 nm. In order to produce a reflectance image, the image             the sample inbound X-rays excite electrons to a higher en-
pixels that show the white standard were averaged to a one-             ergy level in the sample material. Energy in the form of XRF

Earth Syst. Sci. Data, 13, 923–942, 2021                                                   https://doi.org/10.5194/essd-13-923-2021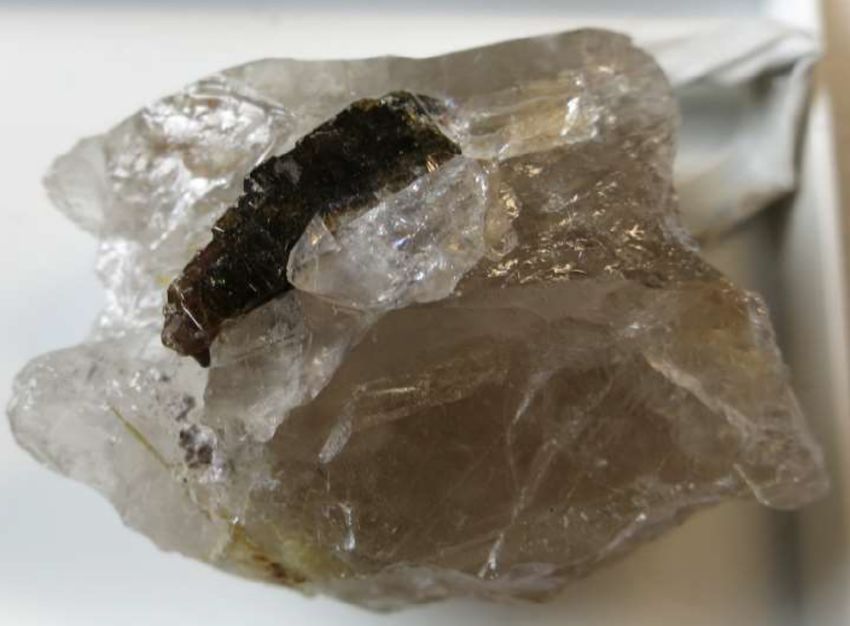
F. Koerting et al.: Hyperspectral library of rare-earth- and copper-bearing samples                                                  929

Table 3. HySpex settings for laboratory measurements of the copper-bearing minerals (Koellner et al., 2019).

                                HySpex settings
                                Distance, sample to sensor          30 cm
                                Sensor arrangement head to head     30 cm lenses, eq on VNIR
                                                                    VNIR (1600 px)      SWIR (320 px)
                                Integration time [µs]               120 000–140 000 15 000–20 000
                                Frame period [µs]                   120 062–141 004 478 334–561 768

Table 4. HySpex settings for laboratory measurements of Apliki mine powdered samples (Koerting et al., 2019b).

                                 HySpex settings
                                 Distance, sample to sensor          1m
                                 Sensor arrangement head to head     1 m lenses, eq on VNIR
                                                                     VNIR (1600 px) SWIR (320 px)
                                 Integration time [µs]               60 000             10 000
                                 Frame period [µs]                   60 060             239 282

Table 5. Sample type and corresponding geochemical characterization method.

                          Sample type                        Geochemical analysis
                          REO                                Laboratory certificates
                          (Koerting et al., 2019a)
                          REMin                              X-ray fluorescence (XRF),
                          (Koerting et al., 2019a)           electron probe microanalyzer (EPMA) analyses
                          Copper-bearing minerals            Scanning electron microscope (SEM), EPMA
                          (Koellner et al., 2019)
                          Apliki mine samples                Bureau Veritas Mineral analysis,
                          (Koerting et al., 2019b)           ICP-MS and ES

radiation is released when these electrons return to their orig-       Table 6. Settings used for the Thermo Niton XL3t X-ray fluores-
inal state. The frequency of this radiation is characteristic for      cence device (Bösche, 2015).
the measured chemical element, and its intensity is correlated
to the concentration level. The intensity of each element is                    Thermo Niton XL3t setting
detected as counts per second by the detector, a geometrically                  Measurement mode            Test “all geo”
optimized large area drift detector (GOLDD). The maximum                        Filter                      Main, low, high, light
excitation voltage of the XL3t device is 50 kV, which means                     Filter measurement time     30 s each
out of the full REE suite only four light REEs can be detected
(lanthanum, cerium, praseodymium and neodymium).
   The XL3t spectrometer is attached to a lead-shielded sam-           represents counts per seconds that could not be attributed
ple chamber, in which samples with a diameter smaller than             to one of the measured elements. Table 6 shows the mea-
3.3 cm can be placed. Mineral samples can be directly placed           surement modes and filters used. In-depth description of the
in the chamber; powdered samples have to be placed in sam-             XL3t and the XL3t results for each sample can be found in
ple tubes (2.5 cm diameter). The sample tubes are made of              Bösche (2015) and Herrmann (2019).
plastic with a plastic foil on the bottom. The plastic cannot
be detected by XRF and therefore does not interfere with the
measurements. A built-in camera of the XL3t enables the
precise location of the measuring spot. The software used
for the measurements is named “NDTr” and the measure-
ment mode was “mining and exploration”. The concentration
levels are provided along with a balance value. “Balance”

https://doi.org/10.5194/essd-13-923-2021                                                  Earth Syst. Sci. Data, 13, 923–942, 2021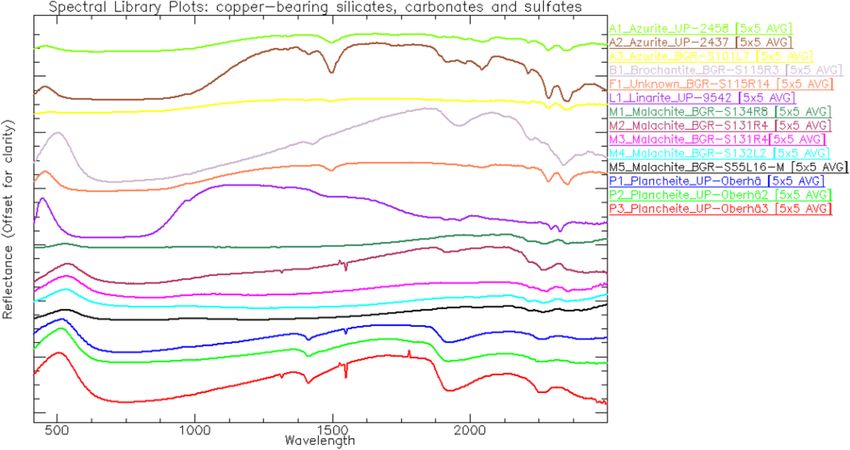
930                                         F. Koerting et al.: Hyperspectral library of rare-earth- and copper-bearing samples

Figure 7. Sample C1_Chalcopyrite SEM and EPMA analysis.

Table 7. Sample C1_Chalcopyrite EPMA analysis results, from three sample points on the sample. Element concentrations reported in wt %
or as below detection limit (bdl).

        Sample point          Al [wt %]   Hg [wt %]   Fe [wt %]   Cu [wt %]   Si [wt %]   S [wt %]    Mn [wt %]    Total [wt %]
        C1_Chalcopyrite-1     bdl         bdl            30.00        33.98   bdl            34.81    bdl                 98.79
        C1_Chalcopyrite-2     bdl         bdl            30.19       34.108   bdl            34.94    bdl                 99.23
        C1_Chalcopyrite-3     bdl         bdl            30.08       34.194   bdl            35.09    bdl                 99.36

3.4.2    Scanning electron microscope (SEM) and electron               An example SEM analysis for copper-bearing mineral
         probe microanalyzer (EPMA)                                  sample C1_Chalcopyrite can be seen in Fig. 7; the EPMA
                                                                     analysis of the mineral is listed in Table 7. The full SEM and
Copper-bearing minerals
                                                                     EPMA results are documented in Koellner et al. (2019).
In order to obtain information about the zonation and in-
ternal fabrics of the copper-bearing minerals, a fully au-           REE-bearing minerals
tomated JEOL JSM-6510 scanning electron microscope
(SEM) (20 kV acceleration voltage) at the University of Pots-        Some of the REMin (xenotime, bastnaesite, fluorapatite,
dam was used. A back-scattered electron detector displays            synchysite and ilmenite) were additionally analyzed by using
compositional variation in the imaging area based on the             a JEOL JXA-8200 electron microprobe (EPMA) at the Uni-
mean atomic number of the pixel. An energy dispersive X-             versity of Potsdam based on a method developed by Lorenz
ray spectrometer (EDX, Oxford Instruments INCAx-act) at-             et al. (2019). The conditions used for the analysis were 20 kV
tached to the instrumentation provides quantitative elemental        acceleration voltage, 20 nA beam current and a beam size of
analysis of single spots. After calibrating with pure copper, a      2 µm. Counting times were between 10–20 s on peak for ma-
wide spectrum of elements can be identified. Based on pre-           jor elements and 50 s for REE and other trace elements.
vious results, divergences of up to 5 wt % can be expected,             The following spectral lines and mineral standards from
which for quantitative analysis is acceptable.                       Smithsonian and Astimex were used: fluorapatite (F Kα,
   In order to approximate the values for copper a JEOL              P Kα, Ca Kα), albite (Na Kα), fayalite (Fe Kα, Mn Kα),
JXA-8200 electron probe microanalyzer (EPMA) at the Uni-             wollastonite (Si Kα), omphacite (Al Kα), LaPO4 (La Lα),
versity of Potsdam was used. The electron microprobe is              PrPO4 (Pr Lβ), CePO4 (Ce Lα), NdPO4 (Nd Lβ), YPO4
equipped with five wavelength-dispersive X-ray spectrome-            (Y Lα), EuPO4 (Eu Lα), SmPO4 (Sm Lβ), LuPO4 (Lu Lα),
ters (WDX) and was operated with a 20 kV accelerating volt-          GdPO4 (Gd Lα), ErPO4 (Er Lβ), DyPO4 (Dy Lβ), YbPO4
age, a 20 nA current and a beam diameter of 2 µm. The ana-           (Yb Lα), HoPO4 (Ho Lβ), uranothorite (U Mβ), and crocoite
lytical counting times were 20/10 s for the element peak and         (Pb Mβ). The EPMA data were reduced using the software-
10/5 s for background positions. Analyses were calibrated            implemented PRZ-XXP data-correction routine, which is
using silicates/sulfides obtained from the Smithsonian Insti-        based on the ϕ(ρz) method (Heinrich and Newbury, 1991).
tution and Astimex. Quantifying elements of a lower atomic
mass than boron is not possible; carbon cannot be measured           3.4.3    Apliki mine surface sample analysis
either.
                                                                     The Apliki mine samples were analyzed by Bureau Veritas
                                                                     Minerals’ (BVM) Canadian laboratory using their standard

Earth Syst. Sci. Data, 13, 923–942, 2021                                               https://doi.org/10.5194/essd-13-923-2021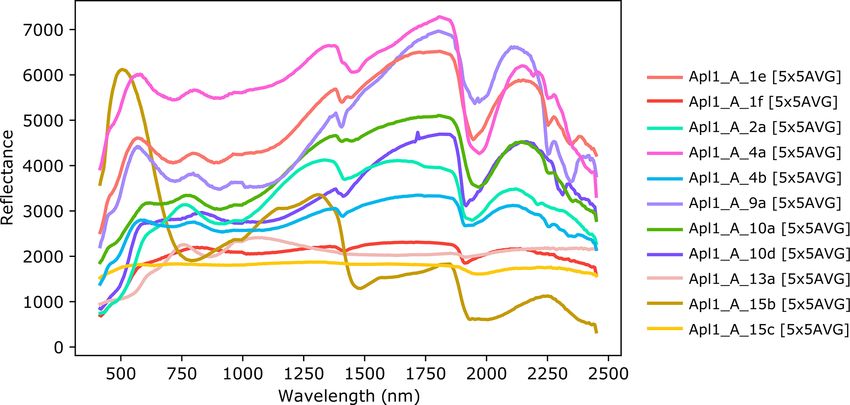
F. Koerting et al.: Hyperspectral library of rare-earth- and copper-bearing samples                                                 931

Table 8. Samples, sample names and locality, and spectral library filenames of REE-bearing minerals.

  Sample    Original sample name                       Sample locality                                                  Spectrum name
  Aeg       Aegirine, acmite                           Rundemyr, Øvre Eiker, Buskerud, Norway/TYP                       REMin_Aeg
  Bar       Bariopyrochlore, fluorapatite              Mina Boa Vista, Catalão, Goiás, Brazil                           REMin_Bar
  Bst       Bastnaesite (Ce)                           Zagi Mountain, Warzal Dam, Peshawar, Khyber Pakhtunkhwa          REMin_Bst
                                                       (formerly North-West Frontier Province), Pakistan
  Fap       Fluorapatite, albite                       Golconda Mine, Governador Valadares, Doce Valley, Minas          REMin_Fap
                                                       Gerais, Brazil
  Flt       Fluorite                                   Arbegona, Shashemanne                                            REMin_Flt
  Gdl       Gadolinite (Y), synchysite (Y), fluorite   White Cloud Pegmatite, South Platte, Jefferson County, Col-      REMin_Gdl
                                                       orado, USA
  Ilm       Ilmenite                                   Mogok, Sagaing District, Mandalay, Myanmar                       REMin_Ilm
  Pcr       Polycrase (Y)                              Puoutevare pegmatite, Tjalmijaure Lake, Jokkmokk Lappland,       REMin_Pcr
                                                       Northern Sweden
  Prs       Parisite (Nd) including parisite (Ce)      Mountain Pass Mine, Ivanpah Mountains, San Bernardino            REMin_Prs
                                                       County, California, USA
  Syn       Synchysite (Y), microcline, quartz         White Cloud Pegmatite, South Platte, Jefferson County, Col-      REMin_Syn
                                                       orado, USA
  Xtm1      Xenotime (Y) (a)                           Novo Horizonte, Ibitiara, Bahia, Brazil                          REMin_Xtm1
  Xtm2      Xenotime (Y) (b)                           Novo Horizonte, Ibitiara, Bahia, Brazil                          REMin_Xtm2
  Zrn       Zircon                                     Peixe Alkaline complex, Monteirópolis, Jaú do Tocantins, To-     REMin_Zrn
                                                       cantins, Brazil

Table 9. Sample name and supplier, product and lot number, and spectral library filenames of the rare-earth oxide powders.

                       Sample name, supplier                 Product number       Lot number     Spectrum name
                       Yttrium (III) oxide, Sigma-Aldrich            204927     MKBL2030V        REO_Yttrium
                       Niobium (V) oxide, Alfa Aesar                  11366       L18Y022        REO_Niobium
                       Lanthanum (III) oxide, Alfa Aesar              11272       B08X015        REO_Lanthanum
                       Cerium (IV) oxide, Alfa Aesar                  11372        L07S057       REO_Cerium
                       Neodymium (III) oxide, Alfa Aesar              11250       C02W029        REO_Neodymium
                       Samarium (III) oxide, Alfa Aesar               11229       61200836       REO_Samarium
                       Europium (III) oxide, Alfa Aesar               11299       A16Z001        REO_Europium
                       Gadolinium (III) oxide, Alfa Aesar             11290       A13W016        REO_Gadolinium
                       Terbium (III.IV) oxide, Alfa Aesar             11208        J24Q019       REO_Terbium
                       Dysprosium (III) oxide, Alfa Aesar             11319       61300733       REO_Dysprosium
                       Holmium (III) oxide, Alfa Aesar                11280        J11X030       REO_Holmium
                       Erbium (III) oxide, Alfa Aesar                 11310       61000356       REO_Erbium
                       Thulium (III) oxide, Alfa Aesar                11198        F25S060       REO_Thulium
                       Ytterbium (III) oxide, Alfa Aesar              11191       61201069       REO_Ytterbium
                       Lutetium (III) oxide, Alfa Aesar               11255       G14X082        REO_Lutetium
                       Tantalum (V) oxide, Alfa Aesar                 14709        I14Y039       REO_Tantalum

https://doi.org/10.5194/essd-13-923-2021                                                   Earth Syst. Sci. Data, 13, 923–942, 2021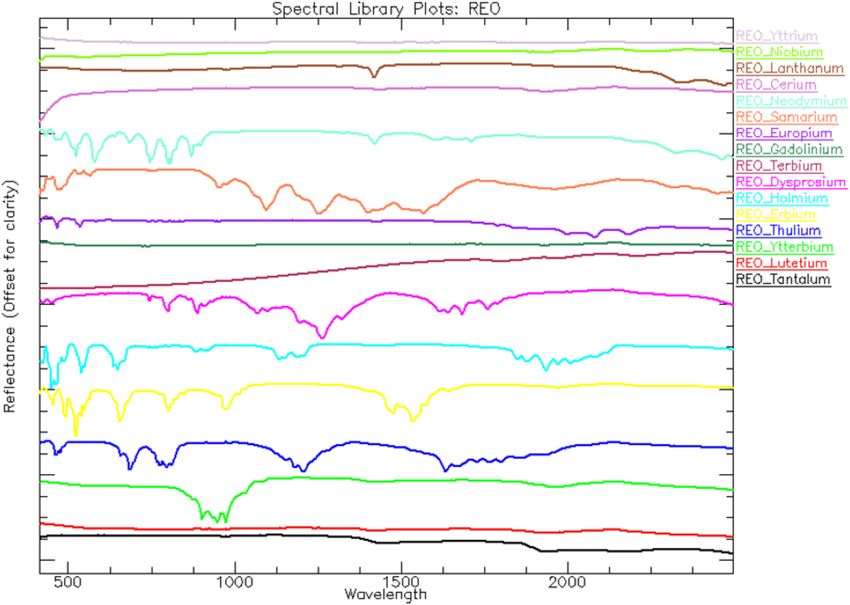
932                                          F. Koerting et al.: Hyperspectral library of rare-earth- and copper-bearing samples

Figure 8. Spectral library plot of the REE -bearing minerals.

Figure 9. Spectral library plot of the rare-earth oxide powders.

packages (Bureau Veritas, 2020). The samples were pulver-            associated analysis method, type and internal BVM analysis
ized below 75 µm and analyzed for major, minor and trace             codes can be found in the technical report of the Apliki mine
elements using inductively coupled plasma mass spectrom-             surface sample data (Koerting et al., 2019b).
etry (ICP-MS) and emission spectrometry (ICP-ES). The
results are grouped by the internal BVM sample prepara-
tion/analysis method types. Those analysis method types
were namely aquatic, rock and soil. The sample numbers,

Earth Syst. Sci. Data, 13, 923–942, 2021                                              https://doi.org/10.5194/essd-13-923-2021
F. Koerting et al.: Hyperspectral library of rare-earth- and copper-bearing samples                                                     933

Table 10. Sample names, collection, original sample name, locality, alteration, mineral formula, spectral library filenames and geochemical
composition of the copper-bearing sulfides and native copper.

    Sample name       Collection   Original    Sample locality       Visible        Spectra names              Geochemical composition
                                   sample                            alteration                                (EPMA mean, n = 3, wt %)
                                   name
    C1_Chalcopyrite   BGR          S55L16 C    Füsseberg Mine,       strongly       C1_Chalcopyrite_BGR-       S: 34.941; Fe: 30.091;
                                               Siegerland,           altered        S55L16-C [5x5 AVG]         Cu: 34.094
                                               Germany
    C2_Chalcopyrite   BGR          S115R12     Erzgebirge,           slightly       C2_Chalcopyrite_BGR-       S: 34.903; Fe: 30.068;
                                               Slovakia              altered        S115R12 [5x5 AVG]          Cu: 33.95
    C3_Chalcopyrite   BGR          S131L5 C    Henderson Mine,       tarnished      C3_Chalcopyrite_BGR-       S: 35.039; Fe: 30.106;
                                               Clear Creek                          S131L5-C [5x5 AVG]         Cu: 33.965
                                               County, USA
    C4_Chalcopyrite   UP           7534        Cornwall, England,    slightly       C4_Chalcopyrite_UP-7534    S: 35.007; Fe: 30.156;
                                               GB                    altered        [5x5 AVG]                  Cu: 34.044
    C5_Chalcopyrite   UP           7526        Clausthal, Harz,      altered        C5_Chalcopyrite_UP-7526    S: 35.053; Fe: 30.007;
                                               Germany                              [5x5 AVG]                  Cu: 34.177
    K1_Copper         UP           600-1       Furnace, Lübeck,      slightly       K1_Copper_UP-600-1         Cu: 98.577
                                               Germany               altered        [5x5 AVG]

4     Results                                                           5       Data availability

All samples are provided and described in detail in the corre-          The spectral libraries are published under the Creative
sponding technical reports that are available upon download             Commons Attribution International 4.0 License (CC BY
of the datasets. For clarity purposes, all provided samples             4.0) via GFZ Data Services. Due to the different types
and corresponding spectra names are listed in Tables 8–12,              of samples, we present the following three data pub-
including a short sample description and, where applicable,             lications: (1) Mineral reflectance of 29 rare-earth min-
the sampling location, geochemistry or mineralogy. For each             erals and rare-earth oxide powders including niobium-
file collection a plot of the spectral library is shown (Figs. 8–       and tantalum-oxide powder, V. 2.0 GFZ Data Services,
13).                                                                    https://doi.org/10.5880/GFZ.1.4.2019.004 (Koerting et al.,
                                                                        2019a); (2) Mineral reflectance spectra and chemistry of
4.1    REE-bearing minerals and rare-earth oxide powders                20 copper-bearing minerals, V. 2.0 GFZ Data Services,
                                                                        https://doi.org/10.5880/GFZ.1.4.2019.003 (Koellner et al.,
The REE-bearing minerals are listed in Table 8. Figure 8                2019) and (3) Mineral reflectance spectra and chemistry
shows a plot of the corresponding spectral library. Table 9             of 37 copper-bearing surface samples from Apliki copper–
lists the rare-earth oxide powders, and Fig. 9 shows the plot           gold–pyrite mine in the Republic of Cyprus, V. 2.0 GFZ Data
of the spectral library.                                                Services, https://doi.org/10.5880/GFZ.1.4.2019.005 (Koert-
                                                                        ing et al., 2019b).
4.2    Copper-bearing minerals
The copper-bearing minerals are listed in Tables 10 (copper-            6       Validation and discussion
bearing sulfides and native copper) and 11 (copper-bearing
silicates, carbonates and sulfates). The plots of the corre-            Technical validation of the results in terms of sample material
sponding spectral libraries are shown in Fig. 10 (copper-               properties, systematic errors and variation of measurements
bearing sulfides and native copper) and 11 (copper-bearing              (experimental error) are given below.
silicates, carbonates and sulfates).
                                                                        6.1       Sample material properties
4.3    Apliki mine samples
                                                                        The REO powders were certified to contain at least 99.9 % of
The Apliki mine samples are listed in Table 12, and the plots           the corresponding REO. The certificates are listed in Koert-
of the corresponding spectral library are shown in Figs. 12             ing et al. (2019a). The REE mineral samples were geochem-
and 13.                                                                 ically analyzed using the Thermo Niton XL3t (Fisher Scien-
                                                                        tific, 2002) device. The resulting element concentrations and

https://doi.org/10.5194/essd-13-923-2021                                                     Earth Syst. Sci. Data, 13, 923–942, 2021
934 F. Koerting et al.: Hyperspectral library of rare-earth- and copper-bearing samples
Table 11. Sample names, collection, original sample name, locality, alteration, mineral formula, spectral library filenames and geochemical
composition of the copper-bearing silicates, carbonates and sulfates.
Sample name Collection Original Sample locality Visible Spectra name Geochemical composition
sample alteration (EPMA mean, n = 3, wt %)
name
A1_Azurite UP 2458 Chéroy near Lyon, altered, nodular A1_Azurite_UP-2458 CuO: 65.344; HgO: 0.091
France [5x5 AVG]
A2_Azurite UP 2437 Tsumeb near Otavi, altered A2_Azurite_UP-2437 CuO: 65.194
Namibia [5x5 AVG]
A3_Azurite BGR S101L7 Cornberg by Fulda, strongly altered A3_Azurite_BGR-S101L7 CuO: 63.87; SO3 : 0.127;
Germany [5x5 AVG] FeO: 0.179
B1_Brochantite BGR S115R3 Altenberg, Slovakia slightly altered, B1_Brochantite_BGR-S115R3 Al2 O3 : 0.18; SiO2 : 0.069;
powdered [5x5 AVG] SO3 : 16.262; CuO: 80.334
F1_Unknown BGR S115R14 Kotterbach near slightly altered F1_Unknown_BGR-S115R14 SiO2 : 2.588; FeO: 69.042;
Witków, Poland [5x5 AVG] CuO: 0.25; SO3 : 0.161;
MnO 0.292
L1_Linarite UP 9542 Unknown location slightly altered, L1_Linarite_UP-9542 SO3 : 64.18; CuO: 24.184;
acicular [5x5 AVG] HgO: 0.439
M1_Malachite BGR S134R8 L’Etoile du Congo altered, nodular M1_Malachite_BGR-S134R8 CuO: 67.609
Mine, Katanga, [5x5 AVG]
Congo
M2_Malachite BGR S131L5 M Henderson Mine, strongly altered M2_Malachite_BGR- S131L5-M CuO: 66.917
Clear Creek [5x5 AVG]
County, USA
M3_Malachite BGR S131R4 Tsumeb near Otavi, altered M3_Malachite_BGR-S131R4 CuO: 65.176; SO3 : 0.458
Namibia [5x5 AVG]
M4_Malachite BGR S132L2 Ogonja Mine strongly altered M4_Malachite_BGR-S132L2 CuO: 67.051
in Okahandja, [5x5 AVG]
Namibia
M5_Malachite BGR S55L16 M Siegen, Germany slightly altered, M5_Malachite_BGR-S55L16-M CuO: 67.885
acicular [5x5 AVG]
P1_Plancheite UP Oberhä Jordan slightly altered P1_Plancheite_UP-Oberhä Al2 O3 : 2.951; SiO2 : 42.079;
[5x5 AVG] CuO: 51.782; SO3 : 0.061;
MnO: 0.243
P2_Plancheite UP Oberhä2 Jordan slightly altered P2_Plancheite_UP-Oberhä2 Al2 O3 : 3.727; SiO2 : 44.12;
[5x5 AVG] CuO: 48.902; SO3 : 0.282;
MnO: 0,247
P3_Plancheite UP Oberhä3 Jordan slightly altered P3_Plancheite_UP-Oberhä3 Al2 O3 : 2.74; SiO2 : 43.25;
[5x5 AVG] CuO: 51.37; SO3 : 0.266;
MnO: 0.085
the measurement error (2σ ) are provided in Koerting et al. standards are factory calibrated once per year. Measurements
(2019a). The validation for the copper-bearing minerals can used for the final reflectance spectral library were collected
be found in Koellner et al. (2019), and the Apliki mine sam- within one calibration time span to ensure equal acquisition
ple validation, analyzed by BVM, can be found in Koerting conditions. For HySpex, averaging multiple measurements
et al. (2019b). minimizes variations in the data. An average (median) of 500
to 800 pixel reflectance spectrum was taken for the HySpex
REE and REO reflectance spectra. This number relates to
6.2 Systematic errors of hyperspectral data acquisition the maximum number of non-disturbed pixels per sample re-
Systematic errors are discussed based on instrument drift, gion of interest (e.g., pixels that were not shadowed from the
calibration and optimization of measurements. Initializing a sample holder side walls). For the copper-bearing minerals
warm-up phase of optical components, detectors and lamps and the Apliki mine powders, a 5 × 5 average pixel window
reduced influences due to instrument drift. Additionally, lab- was chosen over the area of interest. For these samples us-
oratory conditions were monitored to ensure a stable temper- ing a smaller pixel number for the average was necessary, as
ature and humidity. The HySpex cameras and the reference the sampling of the copper-bearing minerals for geochemical
Earth Syst. Sci. Data, 13, 923–942, 2021 https://doi.org/10.5194/essd-13-923-2021F. Koerting et al.: Hyperspectral library of rare-earth- and copper-bearing samples 935
Figure 10. Spectral library plot of the copper-bearing sulfides and native copper.
Figure 11. Spectral library plot of the copper-bearing minerals – silicates, carbonates and sulfates.
validation occurred over a small area of the sample, and the 6.3 Measurements variation
Apliki mine powder tablets were too small to ensure a larger
homogenous area. Variations of measurements were not only based on instru-
ment calibrations or drift. They can also occur due to the de-
tector geometry or geochemical properties of the minerals.
These variations may appear as a shift of the peak positions
of the absorption bands. This means that different hyperspec-
tral sensors will show variations in the spectrum of the same
https://doi.org/10.5194/essd-13-923-2021 Earth Syst. Sci. Data, 13, 923–942, 2021936 F. Koerting et al.: Hyperspectral library of rare-earth- and copper-bearing samples
Table 12. Sample names, spectral library filenames, description and mineralogy of Apliki mine sample collection.
Sample ID, “spectra name” Description Mineralogy based on qualitative XRD analysis (in no particular
order) from Koerting (2021)
Apl1_A_1a, “Apl1_A_1a [5x5 AVG]” Grey-green fresh surface Not available
Apl1_A_1b, “Apl1_A_1b [5x5 AVG]” Hematite colored weathering crust Andesine (anorthic), quartz, magnetite, montmorillonite
Apl1_A_1d, “Apl1_A_1d [5x5 AVG]” Fresh, dark-green weathering crust Anorthite, magnetite, diopside, quartz, montmorillonite
Apl1_A_1e, “Apl1_A_1e [5x5 AVG]” Yellowish orange weathering crust Magnetite, quartz, montmorillonite, diopside, anorthite
Apl1_A_1f, “Apl1_A_1f [5x5 AVG]” Soil formation, gravel Magnetite, anorthite, quartz, montmorillonite, pyrite
Apl1_A_2a, “Apl1_A_2a [5x5 AVG]” Waste, soil Goethite, quartz, clinochlore, jarosite-natrojarosite, Andesine,
gypsum
Apl1_A_3a, “Apl1_A_3a [5x5 AVG]” Yellowish weathered, soil Andesine (anorthic), quartz, gypsum, clinochlore, jarosite,
montmorillonite
Apl1_A_3b, Apl1_A_3b [5x5 AVG] Brownish weathered, soil Quartz, andesine, clinochlore, gypsum, jarosite, montmoril-
lonite
Apl1_A_4a, “Apl1_A_4a [5x5 AVG]” White, small-grained gravel Gypsum, quartz, clinochlore, rozenite
Apl1_A_4b, “Apl1_A_4b [5x5 AVG]” Grey, small-grained gravel Quartz, clinochlore, andesine, gypsum, montmorillonite
Apl1_A_4c, “Apl1_A_4c [5x5 AVG]” Grey-green weathering crust Quartz, clinochlore
Apl1_A_5a, “Apl1_A_5a [5x5 AVG]” Medium-grey weathering crust Gypsum, quartz, clinochlore
Apl1_A_5b, “Apl1_A_15b [5x5 AVG]” Dark-grey weathering crust Gypsum, quartz, clinochlore
Apl1_A_5c, “Apl1_A_5c [5x5 AVG]” Light-grey weathering crust Quartz, gypsum, clinochlore, goethite, hexahydrite
Apl1_A_6a, “Apl1_A_6a [5x5 AVG]” Reddish brown, soil, gravel Quartz, pyrite, analcime, goethite, montmorillonite,
clinochlore, anorthite
Apl1_A_6b, “Apl1_A_6b [5x5 AVG]” Reddish brown, soil Anorthite, quartz, magnetite, diopside, montmorillonite, gyp-
sum, goethite
Apl1_A_6c, “Apl1_A_6c [5x5 AVG]” Reddish brown Quartz, clinochlore, analcime, gypsum, calcite, jarosite, pyrite,
montmorillonite
Apl1_A_6d, “Apl1_A_6d [5x5 AVG]” Reddish brown, soil Quartz, pyrite, anorthite, analcime, clinochlore, montmoril-
lonite
Apl1_A_7d, “Apl1_A_7d [5x5 AVG]” Grey, crust unstable Quartz, hexahydrite, clinochlore, gypsum, pyrite
Apl1_A_7d_Hem, “Apl1_A_7d_Hem [5x5 AVG]” Red, hematite Pyrite, hematite, quartz, gypsum, clinochlore
Apl1_A_7e, “Apl1_A_7e [5x5 AVG]” Blue crystal Rozenite, goethite, quartz, apjohnite, ferrohexahydrite
Apl1_A_8a, “Apl1_A_8a [5x5 AVG]” Grey, small-grained gravel Quartz, clinochlore, pyrite, ajoite
Apl1_A_8b, “Apl1_A_8b [5x5 AVG]” Grey, small-grained gravel Quartz, clinochlore, pyrite, ajoite
Apl1_A_8c, “Apl1_A_8c [5x5 AVG]” Grey, soilish, Quartz, clinochlore, pyrite, ajoite
Apl1_A_9a, “Apl1_A_9a [5x5 AVG]” Light-green weathering crust Quartz, clinochlore (Mn), clinochlore
Apl1_A_9b, “Apl1_A_9b [5x5 AVG]” Hematite vein Quartz, clinochlore, pyrite, hematite
Apl1_A_10a, “Apl1_A_10a [5x5 AVG]” White-with-pink weathering crust Clinochlore, hematite, quartz
Apl1_A_10b, “Apl1_A_10b [5x5 AVG]” White-with-purple weathering crust Quartz, clinochlore
Apl1_A_10c, “Apl1_A_10c [5x5 AVG]” Greenish veins Quartz, clinochlore
Apl1_A_10d, “Apl1_A_10d [5x5 AVG]” White evaporitic crust Quartz, clinochlore, pyrite
Apl1_A_11a, “Apl1_A_11a [5x5 AVG]” Grey weathering crust Quartz, clinochlore, gypsum, bassanite
Apl1_A_11b, “Apl1_A_11b [5x5 AVG]” Green weathering crust Quartz, clinochlore, sphalerite
Apl1_A_13a, “Apl1_A_13a [5x5 AVG]” Red, rock Andesine, quartz, magnetite, montmorillonite-
chlorite, diopside
Apl1_A_13b, “Apl1_A_13b [5x5 AVG]” Red, gravel, weathered hillside rock Clinochlore, quartz, montmorillonite
Apl1_A_15a, “Apl1_A_15a [5x5 AVG]” Dark-blue crystalline crust Quartz (82.6 %), Pyrite (7.5 %), Chalcopyrite (0.8 %), pentahy-
drate (cuprian) (9.1 %)
Apl1_A_15b, “Apl1_A_15b [5x5 AVG]” Light-blue rock and blue crust Quartz (86.1 %), pyrite (4.5 %), pentahydrate (cuprian) (7.1 %),
covellite (2.4 %)
Apl1_A_15c, “Apl1_A_15c [5x5 AVG]” Black pyrite Covellite (18.9 %), quartz (39.9 %), chalcanthite (21.8 %),
pyrite (20.0 %)
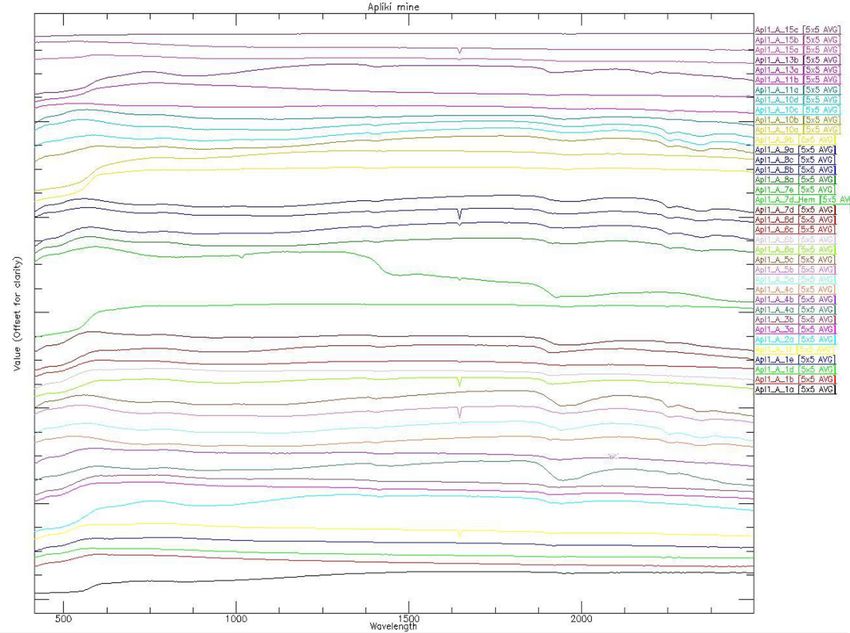
Earth Syst. Sci. Data, 13, 923–942, 2021 https://doi.org/10.5194/essd-13-923-2021F. Koerting et al.: Hyperspectral library of rare-earth- and copper-bearing samples 937 Figure 12. Spectral library of the 37 different Apliki mine samples; spectra stacked with offset. Figure 13. Detailed, unstacked view of a selection of spectra. Reflectance scaled from 0–10 000, modified from Koerting (2021). material. By only using one set of hyperspectral sensors, the sample reflectance spectra also differ when comparing dif- HySpex VNIR and SWIR, these shifts will not appear in our ferent samples of the same mineral species (e.g., malachite) data sets. They might show when comparing our reflectance to each other. The spectral signal differs, for example, due spectra of a material with reflectance spectra taken from a to changes in geochemistry and physical appearance, e.g., different instrument. For the copper-bearing minerals, the crystallization and degree of weathering (Clark, 1999; Hunt, https://doi.org/10.5194/essd-13-923-2021 Earth Syst. Sci. Data, 13, 923–942, 2021
938                                       F. Koerting et al.: Hyperspectral library of rare-earth- and copper-bearing samples

1989; Hunt and Ashley, 1979). To avoid measurement varia-
tions caused by different sensors, imaging data from the same
sensors as the spectral library should to be used for the anal-
ysis. An example for an application can be using the here
provided spectral library of the Apliki mine samples for an
analysis of the HySpex hyperspectral imaging data of the Ap-
liki mine face to be published in 2021 (Koerting et al., 2021).

6.4   XL3t systematic errors
The XL3t is internally calibrated and provides an internal
warm-up phase to guarantee stable measurement conditions.
Unlike the spectrometer measurements, experimental error
was only provided for the XL3t. In order to reduce the exper-
imental error, a long duration measurement time of 120 s was
set. The XL3t collects the emitted radiation from the sample
using four different filters. While the sample was irradiated,
each filter measures counts per second within a time span
of 30 s. Next, the average counts per second were internally
transformed to parts per million. The irradiation of, in total,
120 s per sample was empirically tested to enable short mea-
surement duration in combination with the lowest achievable
standard deviation of concentration level.

Earth Syst. Sci. Data, 13, 923–942, 2021                                          https://doi.org/10.5194/essd-13-923-2021
F. Koerting et al.: Hyperspectral library of rare-earth- and copper-bearing samples                                                                         939

Appendix A

Table A1. List of less commonly known terms and their abbreviations used throughout the paper.

      Terms                   Abbreviation              Description
      Abbreviation            REE                       Rare-earth element
                              REO                       Rare-earth oxide
                              REMin                     Rare-earth element-bearing mineral
                              VNIR                      Visible light and near infrared
                              SWIR                      Shortwave infrared
                              XRF                       X-ray fluorescence
                              EnMAP                     Environmental Mapping and Analysis Program: future earth observation satellite mission (http:
                                                        //www.enmap.org, last access: 2 March 2021)
                              CCRSS-A                   China Commercial Remote-sensing Satellite System: future earth observation satellite mission
                              HISUI                     Hyperspectral Imager Suite: future earth observation satellite mission
      Instruments             HySpex VNIR-1600          HySpex push-broom spectrometer, VNIR camera
                              HySpex SWIR-320m-e        HySpex push-broom spectrometer, SWIR camera
                              HySpex ground             HySpex operational software for laboratory and near-field application
                              HySpex rad                HySpex calibration software to transform raw digital number into radiance data
                              Thermo Scientific         Thermo Scientific Inc. X-ray fluorescence analyzer (NITON TM XL3t)
                              Niton XL3t
                              NDTr                      Thermo Scientific Inc. NITON TM operational software

                              JEOL JXA-8200             Electron probe microanalyzer (EPMA)
                              JEOL JSM-6510             Scanning electron microscope (SEM)
                              Oxford Instruments        Energy dispersive X-ray spectrometer (EDS)
                              INCAx-act
      Registered brands,      REacton®                  Series of rare-earth metals and compounds
      copyrights and/or
      other protected terms
                              Alfa Aesar                Manufacturer and supplier of chemicals for research and development (today Thermo Scientific
                                                        Inc.)
                              Gunnar Färber             Supplier of mineral specimen
                              Minerals
                              REEMAP                    Rare Earth Element Mapping: research project for the development of a modular multi-sensor
                                                        processing chain for modern imaging spectrometers to detect REEs
                              Smithsonian Institution   Smithsonian Institution Department of Mineral Sciences, reference material from the Smithso-
                                                        nian Microbeam Standards
                              Astimex Standards Ltd.    Astimex produces standards suitable for electron probe and scanning electron microscope X-ray
                                                        analysis.
                              BVM                       Bureau Veritas Minerals is an industry leader in the analysis of minerals for the exploration and
                                                        mining industries. BVM is a service-provider company that provides mineral preparation and
                                                        laboratory testing services.
      Research and federal    BGR                       Federal Institute for Geosciences and Natural Resources
      institutes
                              GSD                       Geological Survey Department, Ministry of Agriculture, Rural Development and Environment,
                                                        Republic of Cyprus
                              UP                        University of Potsdam
                              GFZ                       German Research Centre for Geosciences
      Registered trademarks   Excel™                    Microsoft Excel™

https://doi.org/10.5194/essd-13-923-2021                                                               Earth Syst. Sci. Data, 13, 923–942, 2021
940 F. Koerting et al.: Hyperspectral library of rare-earth- and copper-bearing samples
Sample availability. The samples provided by the BGR Financial support. This research has been supported by the Bun-
are available through the collection of the BGR Span- desministerium für Bildung und Forschung (grant no. 033R135) un-
dau by their sample and collection name in the techni- der the scope of the REEMAP project.
cal report (https://gewis.bgr.de/pages/MainApp.aspx?_sys_
params=Nr8PDn_4fNCQfZiUX8sxJCnDDD2DVQI33NH0wD_
jl45IzRSaIuClUEeLIBIzpWXeJ7K73GZUfKk, last access: Review statement. This paper was edited by Birgit Heim and re-
2 March 2021). The samples provided by the GFZ and UP belong viewed by Jeanne Percival and David Turner.
to projects and have to be requested separately.
Supplement. The supplement related to this article is available References
online at: https://doi.org/10.5194/essd-13-923-2021-supplement.
Baldridge, A. M., Hook, S. J., Grove, C. I., and Rivera, G.: The
ASTER spectral library version 2.0, Remote Sens. Environ., 113,
711–715, https://doi.org/10.1016/j.rse.2008.11.007, 2009.
Author contributions. FK designed the Apliki-sample-related
Boesche, N., Rogass, C., Lubitz, C., Brell, M., Herrmann, S.,
study, performed the measurements of the Apliki samples and wrote
Mielke, C., Tonn, S., Appelt, O., Altenberger, U., and Kaufmann,
the manuscript. NK designed the copper sample study, supervised
H.: Hyperspectral REE (Rare Earth Element) Mapping of Out-
the measurements and performed the geochemical analysis at the
crops – Applications for Neodymium Detection, Remote Sens.-
University of Potsdam. CM and AK prepared parts of the spectral
Basel, 7, 5160–5186, https://doi.org/10.3390/rs70505160, 2015.
libraries. NKB designed the REE study, performed some measure-
Boesche, N. K., Rogass, C., Mielke, C., Herrmann, S., Kört-
ments and supervised the REE measurements. SH prepared the sam-
ing, F., Papenfuß, A., Lubitz, C., Brell, M., Tonn, S., and
ples and conducted most of the measurements. CR developed and
Altenberger, U.: Hyperspectral Rare Earth Element Mapping
applied the HySpex post-processing chain. CM and KE helped re-
of Three Outcrops at the Fen Complex, Norway: Calcitic,
vise the manuscript. UA supervised the studies and gave valuable
Dolomitic, and Ankeritic Carbonatites, chap. 16, in: Rare Earths
comments on the manuscript.
Industry – Technological, Economic, and Environmental Impli-
cations, Elsevier Inc., 235–265, https://doi.org/10.1016/B978-0-
12-802328-0.00016-4, 2016.
Competing interests. The authors declare that they have no con- Bösche, N. K.: Detection of Rare Earth Elements and Rare
flict of interest. Earth Oxides with Hyperspectral Spectroscopy, University of
Potsdam, available at: http://nbn-resolving.de/urn:nbn:de:kobv:
517-opus4-85363 (last access: 2 March 2021), 2015.
Acknowledgements. We would like to thank the Helmholtz Cen- Bureau Veritas: Bureau Veritas Metals, Minerals & Envi-
tre Potsdam GFZ German Research Centre for Geosciences for pro- ronmental Schedule of Services & Fees 2020, available
viding the infrastructure and personnel support to conduct our re- at: http://acmelab.com/wp-content/uploads/2020/02/BV_
search. Our gratitude also goes to the German Federal Ministry of Fees-Schedule-2020_USD_v3_07Feb2020.pdf (last access:
Education and Research and the r4 subsidy program for innovative 2 March 2021), 2020.
technologies for resource efficiency, which supported the REEMAP Clark, R. N.: Spectroscopy of rocks and minerals, and principles of
scientific project. We also want to express our gratitude to Sel- spectroscopy, in: Remote sensing for the earth sciences: Manual
tenerdmetalle24, in person Manuel Schultz, for his friendly service of remote sensing, Vol. 3, 3–58, https://doi.org/10.1111/j.1945-
when providing laboratory standards and negative control sample 5100.2004.tb00079.x, 1999.
holder. Thanks to the support by the GSD we were able to con- Clark, R. N.: Imaging spectroscopy: Earth and planetary remote
duct a study and sample in the Republic of Cyprus and our thanks sensing with the USGS Tetracorder and expert systems, J.
go to our colleagues there for their help and directions in the un- Geophys. Res., 108, 1–2, https://doi.org/10.1029/2002JE001847,
known terrain. All the work in the Republic of Cyprus was con- 2003.
ducted under the Permit to conduct a Geological Survey, reference Clark, R. N., Swayze, G. A., Wise, R. A., Livo, K. E., Hoe-
no. 02.13.005.002.005.022, from 19 March 2018, granted by the fen, T. M., Kokaly, R. F., and Sutley, S. J.: USGS Spectral Li-
Geological Survey Department, Ministry of Agriculture, Rural De- brary splib06a: U.S. Geological Survey, Digital Data Series 231,
velopment and Environment (GSD) and the director Costas Con- available at: http://speclab.cr.usgs.gov/spectral.lib06 (last access:
stantinou. After the termination of the permit, a memorandum of 23 June 2009), 2007.
understanding (MoU) and framework for cooperation in the area Fisher Scientific:. Thermo Scientific NITON ™ XL3t NI-
of geo-science between the GSD and the GFZ was agreed upon in TON XL3t Specifications, Analysis, available at: https:
March 2019; the publication of the Apliki mine surface data is as- //www.thermofisher.com/content/dam/LifeTech/Documents/
sociated with this MoU. Constantin Hildebrand and Friederike Klos PDFs/china/Niton-XL3t-GOLDD-Spec-Sheet-2013Jan15.pdf
prepared parts of the spectral libraries for the data publications and (last access: 18 June 2019), 2002.
contributed insight into the spectral interpretation. Pia Brinkman Guanter, L., Kaufmann, H., Segl, K., Foerster, S., Rogass, C.,
prepared the Apliki sample powder tablets. Marcel Horning per- Chabrillat, S., Kuester, T., Hollstein, A., Rossner, G., Chlebek,
formed most of the measurements on the copper samples and pre- C., Straif, C., Fischer, S., Schrader, S., Storch, T., Heiden, U.,
pared the spectral copper library during his BS thesis. We thank our Mueller, A., Bachmann, M., Mühle, H., Müller, R., Habermeyer,
colleagues for their input and insights. M., Ohndorf, A., Hill, J., Buddenbaum, H., Hostert, P., Van Der
Earth Syst. Sci. Data, 13, 923–942, 2021 https://doi.org/10.5194/essd-13-923-2021You can also read