Real-time infection prediction with wearable physiological monitoring and AI: Aiding military workforce readiness during COVID-19
←
→
Page content transcription
If your browser does not render page correctly, please read the page content below
Real-time infection prediction with wearable
physiological monitoring and AI: Aiding military
workforce readiness during COVID-19
Bryan Conroy
Philips Research North America
Ikaro Silva
Philips Research North America
Golbarg Mehraei
Philips Research North America
Robert Damiano
Philips Research North America
Brian Gross
Philips Research North America https://orcid.org/0000-0001-9830-5459
Emmanuele Salvati
Philips Research North America
Ting Feng
Philips Research North America
Jeffrey Schneider
Defense Innovation Unit https://orcid.org/0000-0002-5886-5707
Niels Olson
Defense Innovation Unit
Anne Rizzo
The Guthrie Clinic
Catherine Curtin
Palo Alto Veteran Affairs Healthcare System
Joseph Frassica
Philips Research North America
Daniel Mcfarlane ( dan.mcfarlane@philips.com )
Philips Research North America
Article
Keywords: COVID-19, wearable physiological monitoring, real-time machine learning
Page 1/23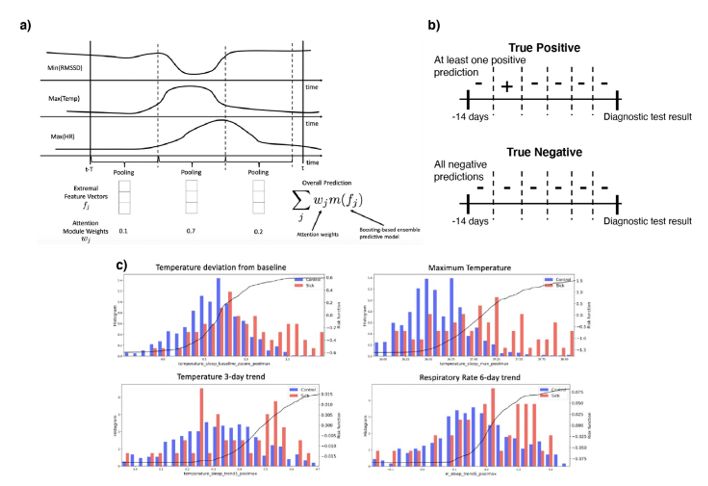
DOI: https://doi.org/10.21203/rs.3.rs-802605/v1
License: This work is licensed under a Creative Commons Attribution 4.0 International License.
Read Full License
Page 2/23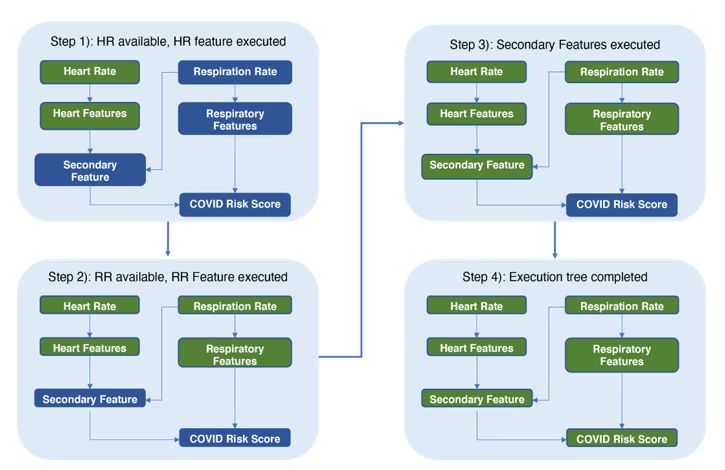
Abstract
Infectious threats, like the COVID-19 pandemic, hinder maintenance of a productive and healthy
workforce. If subtle physiological changes precede overt illness, then proactive isolation and testing can
reduce labor force impacts. This study hypothesized that an early infection warning service based on
wearable physiological monitoring and real-time machine learning could be developed and deployed. We
developed a prototype tool, first deployed June 23, 2020, that delivered continuously updated scores of
infection risk for SARS-CoV-2. Data were acquired from 9381 United States Department of Defense (US
DoD) personnel wearing Garmin and Oura devices, totaling 599,174 user-days of service and 201 million
hours of data. There were 491 COVID-19 positive cases. A predictive algorithm identified infection before
diagnostic testing with an AUC of 0.82. Barriers to implementation included adequate data capture (at
least 48% data was needed) and delays in data transmission. We observe increased risk scores as early
as 6 days prior to diagnostic testing (2.3 days average). This study showed feasibility of a real-time risk
prediction score to minimize workforce impacts of infection.

Introduction
Global threats to public health1, like the ongoing COVID-19 pandemic, complicate efforts to maintain
workforce productivity and can severely impact commerce and national security2. One estimate
quantified the disruption of the COVID-19 pandemic to the United States (US) economy at $16 trillion
(about 90% of the annual US gross domestic product (GDP))3. These projected costs include: $7.6 trillion
in direct losses to GDP; $4.4 trillion for premature death; $2.6 trillion for long-term health impairment; and
$1.6 trillion for mental health impairment3. The negative effects on workforces are widespread4,5,
including hardships for: global economies6, business7,8, small businesses9, agriculture10, rural
economies11, mental health in the workplace12, healthcare13, and worsened domestic violence14.

The risk to workforce productivity from infection is especially troublesome for those organizations
responsible for providing essential services. During the current pandemic, staffing was further
complicated by a high percentage of mildly symptomatic and pre-symptomatic infected individuals with
sufficient viral load to unknowingly infect others in their community. 15–17. The US DoD is a key example,
with commitments to be ‘on location,’ and ‘in person,’ during public health crises18. The US DoD invests
heavily in maintaining the readiness of its workforce to conduct essential missions19,20,21. In particular,
the risk of infectious diseases has long been a concern for military operations22. During public health
crises, the US DoD uses multiple methods to collect information about the health of servicemembers,
including: surveys23, formal readiness reporting21, and frequent monitoring and testing24.

The present article reports on US DoD-sponsored research to investigate use of wearable physiological
monitoring for early prediction of infection and real-time notification of potential exposures via predictive
machine learning. It is hypothesized that a physiologically-based informatics solution is possible, and
that delivery of an early warning "check engine light" service could alert organizations and individuals of

                                                   Page 3/23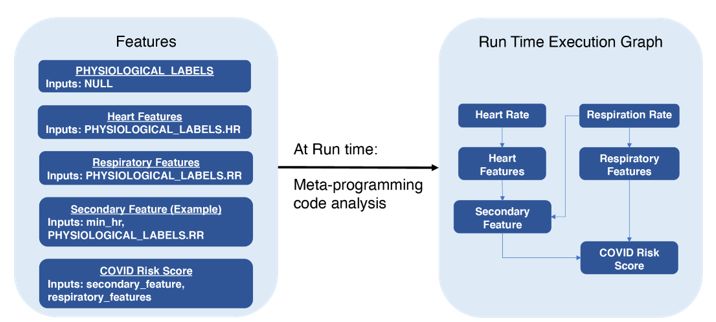
possible early cases of infection. Literature shows compelling evidence of the potential to predict COVID-
19 using a variety of wearables25–31. Supplementary Table 1 contrasts this approach with other
common methods and highlights the potential superiority for enabling early and proactive action to
minimize exponential outbreaks. This approach could deliver a powerful new practical control over
global threats to workforce readiness from infectious diseases.

A large prospective study (9381 participants, including 491 COVID-19 positive cases) was conducted to
explore this potential directly in an active workforce. A prototype system integrated with multiple
commercially off-the-shelf (COTS) wearable devices delivered a real-time service for inference of infection
risk with US military personnel working during the COVID-19 pandemic. The initial version of this real-time
machine learning system with continual wearable physiological monitoring was deployed with active
military users starting June 23, 2020. Through intense co-creation with the US military, the deployment
was iteratively updated for improved technical maturity and usability (the main objectives) and service
utility.

Results
Study Description
The data collection for this project was initiated only after the study received approvals from the
overseeing review committees (Clinical Investigation Department Naval Medical Center, San Diego CIP
#NMCSD.2020.0027; Air Force Research Laboratory Wright-Patterson Air Force Base, Ohio
#WR20200175H; and Stanford University Investigational Review Board, Stanford CA, eProtocol#55805).
The goal of this effort was to rapidly operationalize the Rapid Analysis of Threat Exposure (RATE)
         [1]
algorithm 32 to support healthcare personnel and critical DoD staff to maintain mission readiness
during the COVID-19 pandemic.

Participants were recruited from multiple US DoD sites. Study participants were distributed a Garmin
watch (Fenix 6 or Vivoactive 4 models) and an Oura ring. Oura sizing kits were used to properly fit the ring
based on participant preference. No modifications to the manufacturers’ labeling or ‘instructions for use’
were made for the purpose of this study, and participants initialized and configured their devices per the
manufacturer’s instructions. Almost all participants (98.6%) wore Garmin smartwatches, and 89.8% wore
Oura smart rings (with 88.4% wearing both). The predictive service was delivered to all through web UIs.
Participants were asked to wear the device(s) continuously for the duration of the study, except during
battery recharging, when the subject’s job required removing the wearable(s) to perform a job function, or
whenever the participant was uncomfortable wearing the device.

The study platform was designed to avoid collection of any trackable location or personally identifiable
information (PII) at any time, even during enrollment. This was achieved through a tight collaboration
with the DoD and a unique one-time registration process. Randomly-generated login credentials were
shared with principal investigators, who distributed these to participants for the purpose of accessing the

                                                 Page 4/23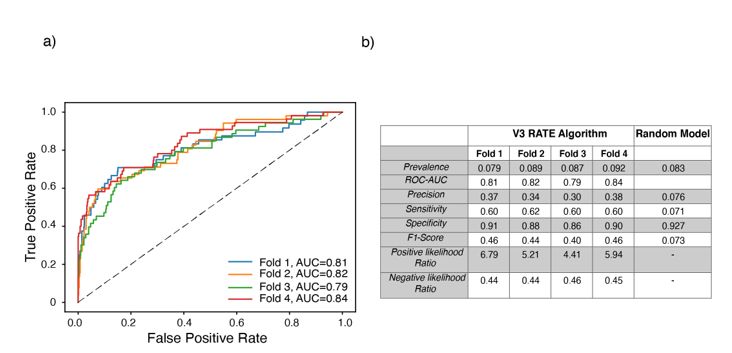
study website to pair their wearable devices with the study. During this one-time registration, basic
demographic categories were collected for: age, height, weight, and pre-existing medical conditions.
From that point forward, wearable data uploaded to the manufacturer’s cloud via the vendor app was
made accessible to the study platform for calculating a continuously updated infection risk score.
In addition to wearing the COTS devices, participants were asked to complete a daily survey, lasting
typically 30 seconds or less in duration. The survey collected self-reported symptoms, over-the-counter
medications taken, and fiducial points for vaccination or positive diagnostic results for
infection, including COVID-19 (see Supplementary Table 3 for the list of survey questions).
Study Platform Description
The platform for prediction of infection was comprised of four components: (1) a wearable data
ingestion module that interfaces with COTS wearable vendors to collect and convert physiological data
into a standardized format; (2) a runtime execution environment that implements the predictive model of
infection and is asynchronously triggered by the incoming data from '1'; (3) a web-based UI that displays
the resulting infection risk score and collects daily surveys for the purpose of generating ground-truth
labels for retrospective machine learning; and (4) an offline research environment that allows data
scientists to adapt the models based on incremental data acquired over the course of the study.
The original RATE research (2018-2019)32 identified the most predictive physiological data types of
infection, which informed the selection of wearable devices for the current system. The platform currently
supports wearable devices from three COTS vendors: Garmin watch (Fenix 6 and Vivoactive 4), Oura ring,
and Empatica E4 wristband. The raw physiological measurement types made available by these devices
included heart rate (HR), inter-beat interval (IBI), respiration rate (RR), pulse oxygenation, skin temperature,
and accelerometer data (see Supplementary Table 2 for a breakdown by device). For purposes of
subsequent data analyses, Empatica data (including photoplethysmograph (PPG) and galvanic skin
response (GSR)) were excluded due to the small number of participants assigned this device.
The end-to-end pipeline to generate a predictive infection score was subdivided into a set of modular
units, each of which performed signal processing and/or prediction tasks based on the input from one or
more physiological data feeds. Modular units could also feed as input to other modular units, resulting in
a hierarchy of processing that culminated in the calculation of an infection prediction score. At runtime,
these units were combined into a directed acyclic graph (DAG) based on input/output relations, which
defines the sequential ordering of execution. This architecture enabled several efficiencies based on the
specifics of the application: (1) modular units were triggered as soon as their input dependencies became
available, which mitigated latencies that may arise due to the asynchronous arrival of data from the
wearable vendors; and (2) intermediate outputs in the processing DAG were cached to avoid
recalculation.
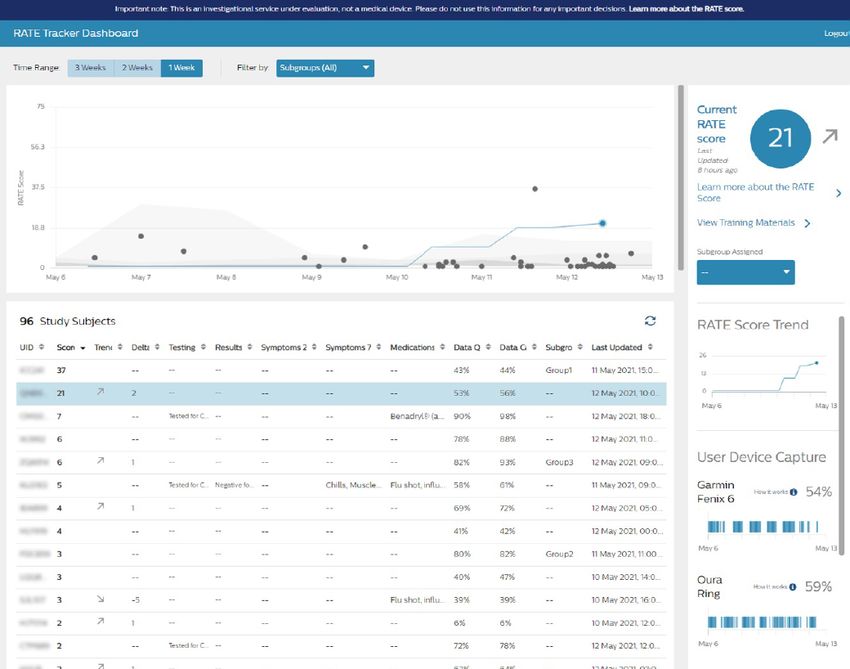
Page 5/23A web-based user interface (UI) called “RATE Tracker” was developed to facilitate interactions with study
participants and principal investigators. On a daily basis, the participant UI prompted study participants
to submit their surveys, after which they were re-directed to a dashboard that displayed the current
infection risk score and weekly trend, wearable device(s) data capture quality, and summary of survey
responses. To assist with wearable device integration issues, links to troubleshooting guides were made
available alongside the data capture graphs. A second UI, accessible only to principal investigators
(Figure 1), allows them to view the RATE score for all participants assigned to them, along with the trend
over time. Principal investigators can sort participants by RATE score and select an individual participant
to visualize the participant’s RATE Tracker summary.
System Prototype Performance
We deployed the first system prototype on June 23, 2020, and over the next 10 months, continuously
enrolled participants and maintained the system for collection and processing of wearables data. At the
conclusion of the study in early April 2021, a total of 9381 users had enrolled, with 491 participants
reporting a COVID-19 diagnosis. A graph of the total number of study participants and COVID-19 positive
subjects over time is shown in Figure 2. The total number of participants (blue line) increased
considerably during the period of early October 2020 to late November 2020. In addition, the total number
of COVID-19 positive subjects (Figure 2 red line) sharply increased during the period of early November
2020 to late January 2021. In total, our system collected 201 million hours of wearables data files and
delivered 599,174 total user-days of predictive service (median of 62 days of service per participant).
Over the 10-month study period, our system was operational over 99% of the time. System downtime was
primarily due to 2 major system upgrades that we deployed in December 2020 and April 2021 to help
maintain system stability with the increasing number of study participants. We also released periodic
updates to the user UI and user daily surveys that resulted in brief system downtime. Additionally, some
updates experienced unforeseen run-time problems that were caught by study principal investigators and
that had to be quickly diagnosed and repaired. Other reasons for lapses in predictive service that were
not related to system upgrades included delays in data synchronization from the COTS device vendors to
our system.
Predictive Algorithm Performance
For the purposes of model training and validation, we created labels for the positive and negative classes.
The user inclusion criteria were based on data availability and device usage: users were required to have
≥ 10 days of sleep data within a 21-day period (48% of sleep periods) prior to COVID-19 test and have
used both the Garmin watch and Oura ring. A 14-day observation window was then defined prior to the
COVID-19 test. The positive class was defined as users with a positive COVID-19 diagnosis who reported
symptoms within the observation window (Figure 3a). The negative class were users with only negative
Page 6/23COVID-19 test results with no reported symptoms. In the case of multiple negative results, the test date
with the largest amount of physiological data was chosen.
A machine learning dataset was fixed on February 18th (approximately 1.5 months before the conclusion
of the study) that included 1,415 control users and 128 COVID-19 positive and symptomatic users (Figure
3b). Users were split into five stratified folds with the 5th fold being a vaulted test set. The model was
trained on the first four folds using four-fold cross-validation. Study principal investigators suggested
reporting performance at a threshold of 60% sensitivity. Thresholds achieving this sensitivity from the
cross-validation folds were averaged to yield a single threshold and tested on a vaulted 5th fold dataset.
The reported results were from the four-fold cross validation in addition to the 5th fold held out test.
The RATE algorithm (see Methods) demonstrated a viable performance with a mean cross-validated ROC-
AUC of 0.82 ±0.02 (Figure 4a). As shown in Figure 4b, the precision of the model is 4.4x better and F1
score 6.3x better than a random approach (in which COVID-19 positive predictions are made randomly in
proportion to the class prevalence). The RATE predictive score was presented on a normalized scale in
the range of 0 to 100, with larger scores indicating a higher likelihood of infection. A sensitivity of 60%
corresponded to a RATE score threshold of 11, which is more than 5 times greater than the population
baseline score of 2. Note, reported performance is for the field-deployed prototype, not a hypothetical
exploration, assuming imaginary implementation or ideal data conditions.
Between February 18th (when the machine learning dataset was frozen) and April 1st (the conclusion of
the study), an additional 51 COVID-19 positive events were captured in the study, which we used for
validation of the RATE score threshold selected in the above analysis. Of the 51 COVID-19 positive
participants, 29 (57%) exhibited a threshold crossing of their RATE score above 11, which closely mirrors
the 60% sensitivity target. We then combined these COVID+ participants with the original 128 included in
the machine learning training analysis to obtain a total cohort of 179 COVID+ participants, and we
examined the temporal pattern of the risk score of this group (Figure 5). We found that the risk score
begins to rise as early as 6 days prior to COVID testing, with the highest risk scores at the time of the
COVID-test and 2 days following the test.
To estimate the overall lead time of positive classification, we identified the days in which the RATE score
exceeded the defined threshold within the 14-day window prior to COVID testing. The lead time was then
defined as the average across these positive days for each user and then aggregated across the cohort
for the final mean estimate of the lead time for COVID classification. Based on a cut-off risk threshold of
11 (yielding 60% sensitivity), the RATE algorithm successfully predicted COVID, on average, 2.3 days prior
to testing. Note that this lead time neglects data arrival latencies that were experienced by the study
platform deployment, which effectively eroded some of the early warning power.
Page 7/23[1] RATE was developed by Philips under a Defense Threat Reduction Agency (DTRA) and Defense
Innovation Unit (DIU)-sponsored program (2018-2019) to predict hospital-acquired infection from
retrospective analysis of large hospital data.
Discussion
Maintaining workforce readiness and productivity during a pandemic is complicated, especially for
essential workers. To address this critical challenge, US DoD has invested in exploring a novel approach.
This is, for each member of a workforce to serve as their own "early warning sentinel" with automation
that dynamically monitors their changing health status. A unique aspect of this study—to arrive at a
prototype of the sentinel—was the consistent sense of urgency, fostered by the COVID-19 pandemic, to
seize the opportunity for data collection, prospective testing and validation, and iterative development of
the study platform. The tight collaboration (typically daily) between the research team and the DoD
informed a series of rapid incremental improvements to the prototype system, evolution of the web-based
UI, and new predictive machine learning models. Results showed fast progress in: system maturity; real-
time service delivery; usability; and design of usage workflow within operational deployments (the
objectives of the project), and also utility of the predictions.
This study was able to:
Design and develop an operational system that delivers an early warning real-time service for
prediction of infection;
Evaluate the feasibility and performance of the system (technical, usability, and utility) while it was
being used for operational work (as opposed to solely an academic retrospective assessment of its
potential under ideal laboratory conditions).
We demonstrated feasibility. The algorithm predicted symptomatic SARS-CoV-2 from physiological data
alone with an AUC of 0.82 on average 2.3 days prior to COVID test amongst participants with at least 48%
wearable data available during sleep periods. At an operating point of 60% sensitivity, the false positive
rate was observed to be 11%, which is evaluated over a 14-day period. When considered as a daily testing
rate, this amounts toto mitigate the impact of data quality on the prediction. These included leveraging the available activity
and hypnogram data to extract physiological data during resting periods and using ensembles of
predictive models for adapting to missing features. As the use of activity data was found to be very
important in resolving a clean physiological signal, better accounting for this meta-information is an
ongoing and active area of work. In addition, although a viable predictive performance was achieved
from 48% wearable data available (as calculated based on the number of sleep periods with
physiological data), a better characterization of the tradeoff in data availability versus predictive
performance is an area of future work.
Another data integration factor that was identified over the course of the study was latencies in data
arrival to the study platform (observed to sometimes be as large as 24-48 hours). This directly impacted
the timeliness of the predictive score and eroded some of the predictive lead time of the algorithm. Upon
further investigation, this proved to be a complex issue with multiple causes: frequency of device syncing
by participants, data processing and queueing by COTS vendors, and transfer and processing by the
study platform. Although the latency issues will likely improve over time with enhancements to software
and infrastructure, better standards and protocols, possibly through a consortium of commercial parties,
may also streamline and accelerate this progress. At present, the study platform has limited control and
awareness of software and firmware updates made on the wearable devices, which may negatively
impact the data integration and overall functioning of the platform.
Several learnings were derived from the training and validation of the infection prediction models. First,
the supervised labels for training the predictive models were derived from self-reported daily surveys,
which may introduce errors in the ground-truth labels. To mitigate this effect, fiducial points were derived
from the administration of COVID-19 tests, which was perceived to be more objective and specific than
self-reported symptoms. Second, participant feedback recommended enhancing the UI with
visualizations to explain the causes of an infection prediction score made by the model; this will be
pursued in future work. This point drove the model training to focus on interpretable predictive models
over deep learning techniques. Field testing showed that graphs of a participant’s infection risk score
over 1-, 2-, and 3-week periods proved to be useful in allowing principal investigators to properly baseline
a participant’s current score. Our testing corroborates findings from this study and others in the
literature25–31,33, that suggest that relative changes in physiological signals as compared to an earlier
baseline estimate are very important in capturing the predictive signal. Finally, the logic that is applied to
detect a COVID19 case (e.g., selecting a threshold on the infection risk score) involves a complicated
trade-off between sensitivity, specificity, and the predictive lead time of the algorithm. As the threshold is
increased, one expects specificity to increase at the expense of decreased sensitivity and decreased
predictive lead time. Better visualizations of this trade-off are required to calibrate the algorithm to the
requirements of the intended use case.
The algorithm development proceeded iteratively as more wearables data became available via the study.
The initial predictive model, trained in the early stages of the study when few COVID+ cases had been
acquired, was bootstrapped from a Philips proprietary dataset of hospitalized patients32. Although the
Page 9/23considered physiological inputs in the hospital data were constrained to match those acquired via
wearables, a number of significant differences limited the translation of the model to this study. Firstly, a
significant covariate shift was identified between the skin temperature measurements acquired from the
Oura ring and the temperature measurements acquired in the hospital (many of which were core body
temperature measurements). Secondly, some features like oxygen saturation that were found to be
predictive in hospitalized patients showed limited predictive power in the wearables study, which was due
to quality degradation in the wearables data or potentially demographic differences between the
participants in the wearables study and the hospitalized patients. Future work will further explore the
source of differences and methodologies to transfer models between these two domains.
Separate from the normal daily surveys, a one-time summative questionnaire was administered to 24
principal investigators (not individual participants) near the end of the project. Subjective results
regarding future usage of the RATE predictive service are summarized in Supplemental Material Figures
3a-f. Large individual differences in responses highlight broad future applicability and the need for a
flexible application approach.
In December 2020, nine months into our data collection study, the Food and Drug Administration (FDA)
issued an emergency use authorization (EUA) of COVID-19 vaccines. Although the daily survey
questionnaire was modified shortly thereafter to include questions about dates of vaccine doses received,
these data have not yet been fully analyzed at the time of writing this article. Preliminary analysis
suggests that on average, the cohort infection score increases on the night of the second vaccination,
peaks between 1-3 days after, and returns to baseline levels by the fifth day. However, fully characterizing
the similarities and differences between the physiological patterns of COVID-19 and vaccine
administration is future work.
Methods
COTS Wearable Device Integration
Each of the wearable device vendors has a different secure protocol for data sharing, and they are briefly
summarized here.
Garmin
Integration with Garmin watches was achieved by creating a Garmin Connect Developer account that
enabled Garmin watch participants to enroll in the data sharing study via an OAuth authentication
process. Once authenticated, an access token linked to that participant was shared with the study
platform. Data sharing was then enabled via a “push” mechanism, in which the Garmin cloud pushes
data to the study platform when participants synchronized their watches via the native Garmin mobile
application. A RESTful API over HTTPS was deployed on the study platform to receive these data pushes
from Garmin.
Page 10/23Oura Ring
Integration with Oura rings was achieved by creating an Oura Teams account that enabled Oura ring
participants to consent to share their data with the study via a secure authentication step during
registration. Due to the lack of a push mechanism available at the time of the initial deployment,
participant data were automatically downloaded from the Oura cloud without the collection of any
personally identifiable information via custom software that was scheduled to run frequently on the study
platform. A 24-48-hour delay in data collection via this method was observed that impacted the overall
predictive lead time of the infection risk score. The Oura engineering team collaborated to develop a
"push" mechanism for data sharing that vastly improves the observed delays in data availability. As of
the time of this writing, this new mechanism is being integrated into the research prototype platform.
Incoming data from the devices were stored in an intermediate landing zone on the platform to await
processing. Newly arrived data were batch processed at 10-minute intervals to convert the device-specific
data into a standardized and compressed format, extract and persist pertinent meta-data to a database
for efficient querying and retrieval, and to instantiate a real-time pipeline trigger that coordinates the
extraction of features from the data to update the time-based state model that is used by the infection
prediction model. The feature extraction pipeline is described in further detail in the following section.
Study Platform Implementation
The wearable data processing pipeline was implemented in Python, along with an API for data scientists
to conform their algorithm to the execution pipeline. Specifically, modular units (also called features)
were implemented as standard Python functions, and the corresponding meta-data associated with the
feature (e.g., required inputs and temporal window size, output type and frequency, etc.) were specified
[2]
using Python decorators . Figure 6 provides a toy example of features defined in the pipeline, and Figure
7 shows the resulting DAG based on processing the input/output relations from the meta-data at runtime.
Note that the deployed machine learning algorithm (COVID Risk Score) is treated as a standard feature in
the pipeline. Once a feature is executed in the pipeline, its outputs are cached in a database or a file
(depending on configuration) for later retrieval.
The study platform also has an offline environment that allows researchers and data scientists to
efficiently explore and develop with any new incoming data in a Python framework (Supplementary
Figure 2). This research environment has a clone of the deployed system, with databases and wearable
data being synced daily and COVID-19 positive labels for machine learning training. Researchers and
data scientists were able to take advantage of this environment to: 1) perform exploratory feature
engineering, 2) explore several data quality and missingness metrics, 3) perform automatic labeling for
model training or updating, and 4) test next generation machine learning models and compare them with
the current deployment.
Page 11/23The research and development environment also provides researchers with five folded batches, based on
user id, for machine learning model training and testing. These folds were made consistent across the
data collection process (users were uniformly inserted into each fold with respect to time in the study).
Label files for the five folds were also updated based on any new input survey data.
Feature Extraction for Predictive Models
To minimize the impact of everyday activities and other contextual factors on physiology, the
physiological data were extracted from the raw wearables data only during sleep periods. Plausibility
filters were applied so that outlier values outside of a pre-set range (depending on the physiological
measurement type) were discarded. This action resulted in a segmented time-series for each
physiological measurement type (e.g., heart rate or temperature), with each segment corresponding to a
distinct sleep period (see Supplementary Figure 1 for an example).
The core features extracted from the sleep period physiological data can be categorized into three
groups: (1) sleep period statistics; (2) trend statistics; and (3) deviations from personal baseline. All three
categories of features attempt to capture abnormal physiological attributes, albeit in different ways.
Statistics on the sleep period features captured distributional information of the physiological data from
the last available sleep period, including derived features like maximum, minimum, median, mean,
standard deviation and inter-quartile range.
The trend statistics and deviations from personal baseline features attempted to capture distributional
shifts of the physiological data over multiple sleep periods. The trend statistics used a variation of the
Mann-Kendall test[3] to robustly estimate monotonic increasing and decreasing trends. For a given
physiological input (e.g., temperature), let denote the sleep period segmented time-series over
the past N nights, with a vector of measurements collected during the ith sleep period. The estimated
monotonic trend over the past k sleep periods, is given by the following:
where p and q range over the measurements in each sleep period and m is the total number of sign
comparisons made in the above calculation. The above trend statistic is bound to the range [-1, 1], with -1
indicating a perfectly monotonic decreasing trend, +1 indicating a perfectly monotonic increasing trend,
and 0 indicating no trend at all. For feature extraction purposes, we calculate the above for k=1,2,…,7.
The deviations from personal baseline features were calculated by means of z-score distributions for
features of interest over an observation window with respect to the corresponding baseline values. A
rolling baseline was estimated for each participant based on data from a 10-day period with a gap of 7
Page 12/23days from the present time. Within the 10-day baseline period, we looked for a group of seven
consecutive days in which the following two criteria were met:
There were at least 5 good sleep periods over days;
A good sleep period occurred, as characterized by a minimum of three hours of data collection.
Once the baseline window was established, we computed mean and standard deviation for every feature
of interest over this period to be used in the z-score calculations. We then used mean and standard
deviation from these z-score distributions as input to the classification model.
Predictive Model Training
A multi-resolution sliding window-based technique was used to extract a set of extremal feature vectors
to capture abnormal physiological features over a given time window by using max- or min-pooling. An
attention module was employed to localize the most discriminative time window within the 14-day
observation period prior to COVID diagnostic test for each example. This was achieved by learning a
weighted model prediction over sliding windows within the 14-day period that concentrated the weights
[4]
on the best performing sliding window using a SoftMax function (see Figure 8a). This was combined
with a training objective adapted from multiple instance learning that treats sliding windows from a given
example as a collective unit. For COVID-19 positive cases, the training objective considered a true
positive prediction if at least one of the sliding windows predicted COVID positivity. For COVID-negative
cases, the training objective considered a true negative prediction if all of the sliding windows predicted
COVID-negative status – see Figure 8b for an example.
The underlying predictive model utilized by the technique was based on a custom gradient boosting
ensemble learning method coded in Python that enabled the model predictions to be interpretable. For
each physiological feature, a directionality constraint was imposed on its utilization that forced the
estimated model prediction to be monotonically increasing or decreasing with respect to that feature. For
example, it is well known that temperature is expected to rise in response to an infection; as a result, the
model was constrained so that its output was monotonically increasing functions of features based on
temperature (including statistics, trends, and deviations from baseline). Similar constraints were applied
to the other physiological inputs (increasing constraint for respiration rate and heart rate features,
decreasing constraint for heart rate variability features). Figure 8c illustrates a number of features
included in the model; notice that the black risk curves in each plot exhibit a monotonic pattern.
[2] For details on function decorators, see Python Enhancement Proposals (PEP) 318
https://www.python.org/dev/peps/pep-0318/
[3] Mann, H.B. (1945), Nonparametric tests against trend, Econometrica, 13, 245-259.
Page 13/23[4] SoftMax function: https://en.wikipedia.org/wiki/Softmax_function
Declarations
Acknowledgements
This research was developed with funding from the Defense Threat Reduction Agency (DTRA), Defense
Innovation Unit (DIU), and Defense Advanced Research Projects Agency (DARPA) under contract
HDTRA1-20-C-0041. The views, opinions and/or findings expressed are those of the author(s) and should
not be interpreted as representing the official views or policies of the Department of Defense or the U.S.
Government. We appreciate the vision, leadership, and sponsorship from the US Department of Defense
and the U.S. Government: Edward Argenta, Christopher Kiley, Christian Whitchurch, Mark Wrobel,
Nathanael Higgins, Heather Ichord, Katherine Delaveris, and John Cusano. We recognize our Philips
North America colleagues for, software development, user interface design and implementation, systems
architecture, data science, and other topics: Roman Jaquez, Altemar Melendez, Brian De Guzman, Joey
Liu, Juan Diaz Rodriguez, Vladimir Ivashin, Michael Tavilla, Alex Tan, Ali Samadani, Sara Mariani, Kiran
Challapali, Joe Rock, Jason Shiepe, Kristen Tgavalekos, Balaji Gurumoorthy, and Kim Lawson, and
formerly with Philips North America: Joseph Marturano, James Blackwell, Shruti Vij. We acknowledge the
contribution of multiple collaborators from Texas A&M University (TAMU) for integration, registration
instructions/training, and provisioning for the wearable common-off-the-shelf (COTS) devices used in the
study We acknowledge the efforts of our DoD partners and colleagues, including the study institutional
review board (IRB) team: James Christensen, Monika Lunn, Luaren Kuennen, and Kristie Williams; the
study principal investigators (PIs): Robert Fenequito, James Chung, Bryan Striffolino, Judith Generoso,
Grant Kidd, David Ryan, Roderick Borgie, Anne Rizzo, Robert Kent, Nyssa Wratschko, Stephen Baffic,
Christian Hofer, Matt Goldman, Niels Olson, Ian Eishen, Jennifer Mitchum, Ken Wickiser, Donald Kennedy,
Michael Riggins, Andrew Ellis, Trey Bell, Joseph Call, Rick Pierson, Keith Boyer, Noah Irons, Christina Keith,
Simon Ritchie, and Bryan Anderson; and the study associate investigators (AIs): Andrew Miller, Daria Lee,
Kimberly Woods, Kaya Khan, Ryanrommel Noriega, Juan Barajas, Edward Guevara, Gricel Rodriguez,
John Fang, Holly Schmidt, David Gloria, Jamie Stull, Aaron McIntire, Blake Marshall, Brian Gawlik,
Christopher Johnson, John O'Boyle, Leigh Prevatte, Edgar Ramirez, Paul Antony, Scott Williams, Jeffrey A
Jones, Thomas Doker, Nicholas Brumm, Erika Schwankl, Franklin Meyers, Debra Mulder, Elzadia Kaina,
William Takashima, Ernest Vasquez, Jason Pienta, Alvin Freshwater III, Jeffrey Schmidt, Daniel Tenhagen,
Joseph Cooper, Nathanael Higgins, Jeffrey Schneider, Dustin Yee, Heather Ichord, John Hollingsworth,
Kristen DeWilde, Chad Hardesty, Erin Milner, Nicholas Barringer, Gregory Freisinger, Vikram Mittal, Donald
Lafleur, Vincent Young, Kalen Sanchez, James Turvy, Justin Salinas, Ryan Bobzin, Zachary Pennington,
Ashley Fitzpatrick, Ernest Haney, Nathan Shepard, Wayne Goode, Esther Baynes, Kimberly Janicek, Tantra
Peyton, Dione Alston, James Ashley, Ariel Venne, Charisa Carkhuff, Hector Romero, Ivan Mora, Lauren
Kuennen, Delisa Hernton, Kathryn Dannecker, Neil Rettedal, Duane Sanabria, Jodie Fox, Shelly Rowlett,
Natalie Redmon-Howard, Laura Hemer, Horecia Williams, Awal Tura, Giulia Vernati, Grace Tolson, Nicole
McCarthy, Michelle Tarasen, Hope Soliz, Adam Celia, Joseph Abrams, Joseph Eastman, and James
Thompson. We acknowledge contribution to the study from our partners at the Veterans Affairs Hospital,
Page 14/23Palo Alto, CA, and Palo Alto Veterans Institute for Research (PAVIR): Deborah Ellen Kenney, and Thomas
Osborne, M.D. The views expressed in this article are those of the authors and do not necessarily reflect
the position or policy of the Department of Veterans Affairs or the United States government.
References
1. Morens, D. M., Folkers, G. K. & Fauci, A. S. The challenge of emerging and re-emerging infectious
diseases. Nature 430, 242–249 (2004).
2. Baldwin, R. E., Weder, B., & Centre for Economic Policy Research (Great Britain). Economics in the
time of COVID-19. (Centre for Economic Policy Research (CEPR) Press, 2020).
3. Cutler, D. M. & Summers, L. H. The COVID-19 Pandemic and the $16 Trillion Virus. JAMA 324,
1495–1496 (2020).
4. Kaushik, M. & Guleria, N. The Impact of Pandemic COVID -19 in Workplace. Eur. J. Bus. Manag. 12,
(2020).
5. Nicola, M. et al. The socio-economic implications of the coronavirus pandemic (COVID-19): A
review. Int. J. Surg. Lond. Engl. 78, 185–193 (2020).
6. OECD, D. O. The impact of the COVID-19 pandemic on jobs and incomes in G20 economies.
http://www.ilo.org/global/about-the-ilo/how-the-ilo-works/multilateral-
system/g20/reports/WCMS_756331/lang--en/index.htm (2020).
7. Meyer, B. H., Prescott, B. & Sheng, X. S. The impact of the COVID-19 pandemic on business
expectations. Int. J. Forecast. (2021) doi:10.1016/j.ijforecast.2021.02.009.
8. Donthu, N. & Gustafsson, A. Effects of COVID-19 on business and research. J. Bus. Res. 117, 284–
289 (2020).
9. Bartik, A. W. et al. The impact of COVID-19 on small business outcomes and expectations. Proc.
Natl. Acad. Sci. 117, 17656–17666 (2020).
10. Bochtis, D. et al. Agricultural Workforce Crisis in Light of the COVID-19 Pandemic. Sustainability
12, 8212 (2020).
11. Mueller, J. T. et al. Impacts of the COVID-19 pandemic on rural America. Proc. Natl. Acad. Sci. 118,
(2021).
12. Giorgi, G. et al. COVID-19-Related Mental Health Effects in the Workplace: A Narrative Review. Int.
J. Environ. Res. Public. Health 17, 7857 (2020).
Page 15/2313. Garzaro, G. et al. COVID-19 infection and diffusion among the healthcare workforce in a large
university-hospital in northwest Italy. Med. Lav. 111, 184–194 (2020).
14. Campbell, A. M. An increasing risk of family violence during the Covid-19 pandemic: Strengthening
community collaborations to save lives. Forensic Sci. Int. Rep. 2, 100089 (2020).
15. Leung, C. The difference in the incubation period of 2019 novel coronavirus (SARS-CoV-2)
infection between travelers to Hubei and nontravelers: The need for a longer quarantine period. Infect.
Control Hosp. Epidemiol. 41, 594–596 (2020).
16. Jiang, X., Rayner, S. & Luo, M.-H. Does SARS-CoV-2 has a longer incubation period than SARS and
MERS? J. Med. Virol. 92, 476–478 (2020).
17. Kalish, H. et al. Undiagnosed SARS-CoV-2 Seropositivity During the First Six Months of the COVID-
19 Pandemic in the United States. Sci. Transl. Med. eabh3826 (2021) doi:10.1126/scitranslmed.abh3826.
18. Kapp, L. & Jansen, D. J. The Role of the Department of Defense During a Flu Pandemic. 18
www.crs.gov (2009).
19. Junor, L. J. Managing Military Readiness, INSS Strategic Perspectives No 23. (2017).
20. Herrera, G. J. The Fundamentals of Military Readiness. https://crsreports.congress.gov (2020)
doi:10.13140/RG.2.2.32215.29606.
21. Trunkey, D. Implications of the Department of Defense Readiness Reporting System.
https://www.cbo.gov/sites/default/files/cbofiles/attachments/44127_DefenseReadiness.pdf (2013).
22. Thompson, D., Swerdlow, J. & Loeb, C. The Bug Stops Here: Force Protection and Emerging
Infectious Diseases. (2005).
23. Meadows, S. O. et al. 2015 Department of Defense Health Related Behaviors Survey (HRBS). RAND
Health Q. 8, (2018).
24. Murray, C. K. et al. Operation United Assistance: infectious disease threats to deployed military
personnel. Mil. Med. 180, 626–651 (2015).
25. Quer, G. et al. Wearable sensor data and self-reported symptoms for COVID-19 detection. Nat. Med.
27, 73–77 (2021).
26. Mishra, T. et al. Pre-symptomatic detection of COVID-19 from smartwatch data. Nat. Biomed. Eng.
4, 1208–1220 (2020).
27. Hirten, R. P. et al. Use of Physiological Data From a Wearable Device to Identify SARS-CoV-2
Infection and Symptoms and Predict COVID-19 Diagnosis: Observational Study. J. Med. Internet Res. 23,
e26107 (2021).
Page 16/2328. Hasty, F. et al. Heart Rate Variability as a Possible Predictive Marker for Acute Inflammatory
Response in COVID-19 Patients. Mil. Med. 186, e34–e38 (2021).
29. Smarr, B. L. et al. Feasibility of continuous fever monitoring using wearable devices. Sci. Rep. 10,
21640 (2020).
30. Miller, D. J. et al. Analyzing changes in respiratory rate to predict the risk of COVID-19 infection.
PLOS ONE 15, e0243693 (2020).
31. Shapiro, A. et al. Characterizing COVID-19 and Influenza Illnesses in the Real World via Person-
Generated Health Data. Patterns N. Y. N 2, 100188 (2021).
32. Feng, T. et al. Machine Learning-based Clinical Decision Support for Infection Risk Prediction.
Manuscr. Submitt. Publ. (2021).
33. Natarajan, A., Su, H.-W. & Heneghan, C. Assessment of physiological signs associated with COVID-
19 measured using wearable devices. Npj Digit. Med. 3, 1–8 (2020).
34. Sharma, O., Sultan, A. A., Ding, H. & Triggle, C. R. A Review of the Progress and Challenges of
Developing a Vaccine for COVID-19. Front. Immunol. 11, 585354 (2020).
35. Mohan, S. V., Hemalatha, M., Kopperi, H., Ranjith, I. & Kumar, A. K. SARS-CoV-2 in environmental
perspective: Occurrence, persistence, surveillance, inactivation and challenges. Chem. Eng. J. Lausanne
Switz. 1996 405, 126893 (2021).
36. Mooney, G. “A Menace to the Public Health” — Contact Tracing and the Limits of Persuasion. N.
Engl. J. Med. 383, 1806–1808 (2020).
37. Hashmi, H. A. S. & Asif, H. M. Early Detection and Assessment of Covid-19. Front. Med. 7, (2020).
38. Koehlmoos, T. P., Janvrin, M. L., Korona-Bailey, J., Madsen, C. & Sturdivant, R. COVID-19 Self-
Reported Symptom Tracking Programs in the United States: Framework Synthesis. J. Med. Internet Res.
22, e23297 (2020).
39. Yu, F. et al. Quantitative Detection and Viral Load Analysis of SARS-CoV-2 in Infected Patients.
Clin. Infect. Dis. Off. Publ. Infect. Dis. Soc. Am. 71, 793–798 (2020).
40. Tang, Y.-W., Schmitz, J. E., Persing, D. H. & Stratton, C. W. Laboratory Diagnosis of COVID-19:
Current Issues and Challenges. J. Clin. Microbiol. 58, (2020).
41. Praharaj, I. et al. Pooled testing for COVID-19 diagnosis by real-time RT-PCR: A multi-site
comparative evaluation of 5- & 10-sample pooling. Indian J. Med. Res. 152, 88–94 (2020).
42. Toniolo-Barrios, M. & Pitt, L. Mindfulness and the challenges of working from home in times of
crisis. Bus. Horiz. 64, 189–197 (2021).
Page 17/2343. Quilty, B. J., Clifford, S., Flasche, S., Eggo, R. M., & CMMID nCoV working group. Effectiveness of
airport screening at detecting travellers infected with novel coronavirus (2019-nCoV). Euro Surveill. Bull.
Eur. Sur Mal. Transm. Eur. Commun. Dis. Bull. 25, (2020).
44. Tirupathi, R., Bharathidasan, K., Palabindala, V., Salim, S. A. & Al-Tawfiq, J. A. Comprehensive
review of mask utility and challenges during the COVID-19 pandemic. Infez. Med. 28, 57–63 (2020).
45. Eykelbosh, A. Physical Barriers for COVID-19 Infection Prevention and Control in Commercial
Settings. http://ncceh.ca/content/blog/physical-barriers-covid-19-infection-prevention-and-control-
commercial-settings (2020) doi:10.13140/RG.2.2.32336.33283.
46. Chen, X. et al. Hand Hygiene, Mask-Wearing Behaviors and Its Associated Factors during the
COVID-19 Epidemic: A Cross-Sectional Study among Primary School Students in Wuhan, China. Int. J.
Environ. Res. Public. Health 17, (2020).
47. Sum, Z. Z. & Ow, C. J. W. Community pharmacy response to infection control during COVID-19. A
cross-sectional survey. Res. Soc. Adm. Pharm. 17, 1845–1852 (2021).
48. Xie, W., Campbell, S. & Zhang, W. Working memory capacity predicts individual differences in
social-distancing compliance during the COVID-19 pandemic in the United States. Proc. Natl. Acad. Sci. U.
S. A. 117, 17667–17674 (2020).
49. Baker, M. G., Peckham, T. K. & Seixas, N. S. Estimating the burden of United States workers
exposed to infection or disease: A key factor in containing risk of COVID-19 infection. PloS One 15,
e0232452 (2020).
50. Ives, J. et al. Healthcare workers’ attitudes to working during pandemic influenza: a qualitative
study. BMC Public Health 9, 56 (2009).
Figures
Page 18/23Figure 1
The admin UI allows site coordinators to monitor the infection risk at a site level. Selecting an individual
on the scatter plot shows the infection score trend for that user.
Page 19/23Figure 2
Timeline of total users and COVID+ users through April 1, 2021
Figure 3
a) Graphical summary of True Positive and True Negative labels for classification over time. D0 indicates
the date of a COVID-19 test (True positive=date of testing associated with positive results and True
negative=date of testing associated with negative results). If the user did not report when they were
tested, then the date of the diagnosis is used. D0-14 indicates the 14 days prior to the test and is
considered the observation window for model classification. Note that we only considered symptomatic
COVID positive users who reported symptoms during the observation window; D0-21 represents the 21
days prior to the test date in which filtering for data availability is evaluated. b) Cohort size breakdown
with each filtering step.
Page 20/23Figure 4
a) ROC curve of the algorithm for each fold. Dash line represents guessing. AUC is indicated for each fold
in the legend. b) Infection predictive model performance. Random model results based on dummy
classifier using stratified approach with random guessing proportional to the class
distribution/prevalence (~9%).
Figure 5
Mean RATE risk score in 179 COVID-19 positive+ users as a function of day relative to COVID testing (red
line). Grey region depicts 95% confidence interval (standard error).
Page 21/23Figure 6
Example of an execution graph calculated at runtime. The PHYSIOLOGICAL_LABELS feature represents
the standardized wearables data inputs and acts as source nodes in the DAG
Figure 7
Page 22/23Example of the feature pipeline orchestrated by the triggering mechanism on the runtime execution DAG.
The trigger maintains the state of the execution graph and its requirements at each step of the process. In
this example, the machine learning prediction (COVID risk score) gets first reported as soon as the
respiratory feature becomes available. As additional features (e.g., those from heart rate) become
available, the prediction is updated with the new information.
Figure 8
a) Illustration of sliding window-based feature extraction. b) Example of true positive and true negative
classification under multiple instance learning training objective. c) Illustration of learned feature risk
scores included in the infection prediction mode.
Supplementary Files
This is a list of supplementary files associated with this preprint. Click to download.
SupplementalMaterial.docx
Page 23/23You can also read