Understanding Potential Exposure of Bicyclists on Roadways to Traffic-Related Air Pollution: Findings from El Paso, Texas, Using Strava Metro Data ...
←
→
Page content transcription
If your browser does not render page correctly, please read the page content below

International Journal of
           Environmental Research
           and Public Health

Article
Understanding Potential Exposure of Bicyclists on
Roadways to Traffic-Related Air Pollution: Findings
from El Paso, Texas, Using Strava Metro Data
Kyuhyun Lee 1          and Ipek N. Sener 2, *
 1    Texas A&M Transportation Institute, College Station, TX 77843, USA; k-lee@tti.tamu.edu
 2    Texas A&M Transportation Institute, Austin, TX 78752, USA
 *    Correspondence: i-sener@tti.tamu.edu; Tel.: +1-512-407-1119

 Received: 30 November 2018; Accepted: 24 January 2019; Published: 29 January 2019

 Abstract: As bicycling on roadways can cause adverse health effects, there is an urgent need to
 understand how bicycle routes expose bicyclists to traffic emissions. Limited resources for monitoring
 reveal that bicycle travel patterns may constrain such understanding at the network level. This study
 examined the potential exposure of bicyclists to traffic-related air pollution in El Paso, Texas, using
 Strava Metro data that revealed bicycle patterns across the city networks. An initial spatial mapping
 analysis was conducted to explore the spatial patterns of bicycling and traffic pollutant emission,
 followed by exploratory descriptive statistics. A spatial bicycle model was then developed to explore
 factors influencing bicycling activity in El Paso. Analysis results indicated significant associations
 between greater bicycle volume and both higher levels of particulate matter (PM2.5 ) emissions
 and more frequent bus services, implying adverse health concerns related to traffic-related air
 pollution. The results also indicated significant effects of various environmental characteristics
 (e.g., roadway, bicycle infrastructure, topography, and demographics) on bicycling. The findings
 encourage extending this study to provide guidance to bicyclists whose regular trips take place on
 heavily trafficked roads and during rush hours in this region and to evaluate the net health impacts
 of on-road bicycling for the general population.

 Keywords: bicycle; fitness tracking app; crowdsourced data; Strava; traffic emission; PM2.5 ; health
 effects; public health; spatial effects

1. Introduction

1.1. Background
      Bicycling has numerous benefits that justify efforts to encourage daily bicycling as a desirable
transportation and health benefit, but direct exposure to the environment makes bicyclists on the
road more vulnerable to traffic-related collisions and emissions. Exposure to traffic emissions is less
visible than the risk of traffic collisions, which has probably contributed to the relatively little attention
paid to such exposure. While a person is physically active, breathing and ventilation rates increase,
and thus the amount of air pollutant inhaled is likely to increase [1]. Even with the expected health
benefits of bicycling, poor air quality may generate health trade-offs, such as acute decrements in
respiratory function [2–4], decreased heart rate variability [5,6], decreased microvascular function [7],
and increased risk of myocardial infarction [8]. It has also become widely believed that exposure to
traffic-related air pollutants, such as particulate matter with an aerodynamic diameter below 2.5 µm
(PM2.5 ), can cause respiratory and chronic diseases [9,10]. Bicyclists who make a daily trip mostly
alongside busy routes with heavy traffic and maintain this travel behavior are likely to be at risk of
such health problems. However, the levels of exposure to air pollution can vary depending on which

Int. J. Environ. Res. Public Health 2019, 16, 371; doi:10.3390/ijerph16030371    www.mdpi.com/journal/ijerph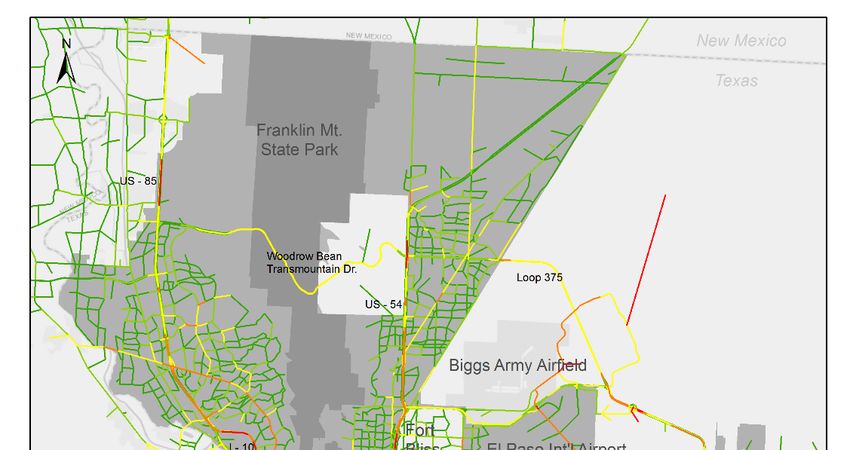
Int. J. Environ. Res. Public Health 2019, 16, 371                                                     2 of 20

routes are taken. Studies comparing different routes revealed that proper route choices play a key role
in reducing the levels of exposure to traffic emissions [11–13]. Bicycle commuting that takes routes with
lower proximity to vehicle traffic could facilitate a reduction in the inhaled particle count in comparison
with the counterpart routes of higher proximity [14,15]. Given the risk of exposure to air pollution and
possible prevention of the risk, a holistic approach is needed in planning bicycle networks that are
accessible, convenient, and safe based on a solid understanding of bicycle travel patterns.

1.2. Influential Factors on Bicycling
     Cycling is a human behavior that is a convergence of a myriad of individual (e.g., age, gender,
physical abilities, and confidence level), situational (e.g., trip purpose, distance, time, and cost), and
environmental (e.g., infrastructure, traffic conditions, and topography) factors [16,17]. Individual
sociodemographic features are a major determinant in decisions of which routes to take or whether to
ride a bicycle to get to a destination [18–20], and psychological factors (such as attitudes and perception)
are also important [21–23]. Bicyclists generally prefer routes with bicycle infrastructure that can
separate and protect them from vehicle traffic [18,20,24–28]. Upslopes, high speeds, and vehicle traffic
are often reported as deterrents [18,19,25,26,28,29], but not always [20]. When it comes to situational
factors, travel decisions are sensitive to trip time and distance [18,20,30], cost [18,22], and reasons for
making the trip [26]. In addition to insights into such factors, an increasing attention to the adverse
health effects of exposure to air pollution has encouraged investigating the impacts of air pollution
on bicycling decisions. For example, Anowar et al. [30], using stated preference survey data from 695
commuter cyclists, identified how exposure information influences bicyclists’ route choice decisions.
While the study results indicated that “travel time and traffic volume remain the most important
attributes for commuter cyclists in their route decision”, the authors found that information about
air pollution negatively affected route preferences [30]. In an intercept survey of 625 real-world
cyclists, 51 percent of survey participants replied that they consider air quality in routing decisions [23].
Stated behavior studies by Cole-Hunter et al. [31] emphasized that bicyclists are willing to avoid air
pollution risks during cycling. While stated preferences can capture motivators and deterrents for
travel decisions, there may be an information gap between those preferences and real-world travels.
Global position system (GPS)-based experiments can minimize the gap by monitoring actual trip
patterns, but limited resources hardly permit network-level analysis for the population level [24,26].
Difficulties in acquiring adequate data may be a barrier to studies investigating how revealed bicycle
trip patterns are associated with air pollution at the network system level.

1.3. Bicycle Data Collection and Strava
      Traditionally, transportation planners and practitioners have relied on several monitoring tools
to obtain active travel data. The most traditional monitoring method is counting and surveys.
Both manual and automated counting are still primarily used to collect active traffic volumes, but
they are typically available at a limited number of points and do not provide detailed information
(e.g., individual and situational information). By contrast, surveys are preferred when collecting
individual and situational information because subjects are asked to describe the information of
interest, such as demographic features and experience level. Recently, GPS-based surveys have become
more popular because GPS data reveal real-world trip information. Traditional data collection methods
are still valuable in monitoring active travelers, but intensive resources, time, and effort frequently
limit sample sizes and time/spatial coverage, leading to poor understanding of active travel behavior
(for a review of data collection methods for active travelers, see [32]).
      The proliferation of smartphones has created an emerging monitoring method. In their recent
study, Lee and Sener [33] conducted a detailed review and evaluation of currently available data
collected by various emerging methods and crowdsourced data that take advantage of mobile devices
and their current use. As discussed by the authors, GPS-based fitness tracking apps where people
upload their physical activities provide new opportunities to obtain revealed travel patterns with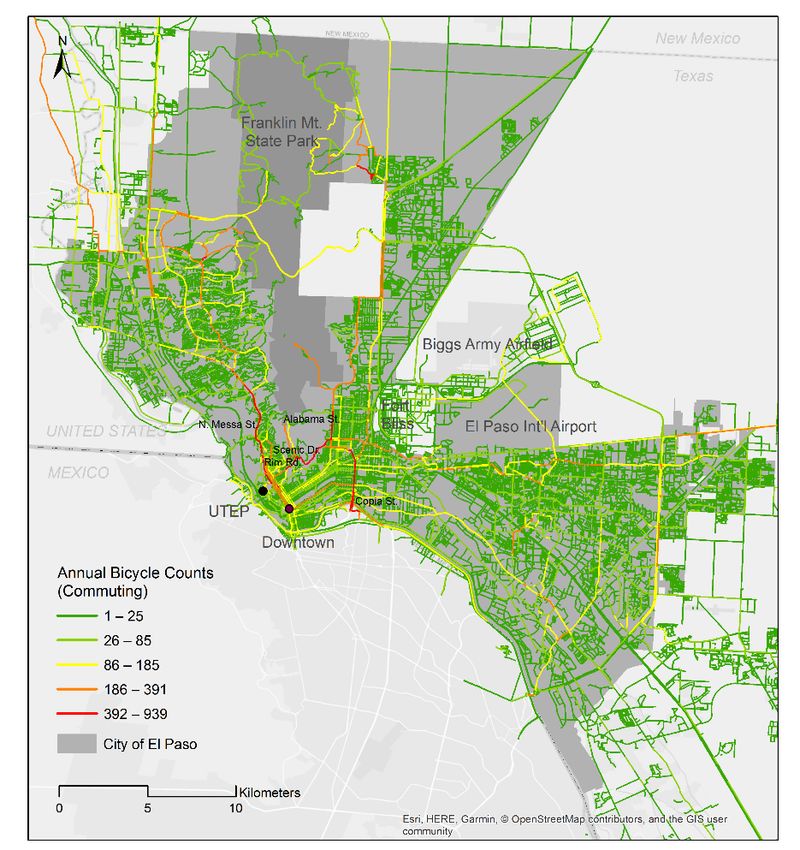
Int. J. Environ. Res. Public Health 2019, 16, 371                                                     3 of 20

relatively less effort than traditional data collection methods. A popular fitness app, Strava, collects
users’ mobility information, and its data service, Strava Metro, initially processes the raw data and
sells them to data consumers. Because Strava Metro provides spatially and temporally continuous
physical activity counts at different geographic units (point, segment, and polygon), these data are
useful in capturing interactions between environmental settings and bicyclists across broad regions
over a long period. Strava Metro data have been used for different bicycle studies, including, for
example, visually depicting cycling patterns [29,34], evaluating the effects of new bike facilities on
cycling behaviors [35], analyzing accident risk exposure [36,37], and investigating the associations
between environmental characteristics and recreational cycling [38].

1.4. Strava and Air Pollution
      Despite the growing number of application cases, only a few studies have used Strava Metro
data to examine ambient pollutant exposure during physical activities. Sun and Mobasheri [39]
estimated the instantaneous air pollution exposure of riders using Strava Metro’s node (point) data
in Glasgow, Scotland, United Kingdom. The authors calculated the average exposure of commuting
and non-commuting cyclists to PM2.5 and particulate matter with an aerodynamic diameter below
10 µm (PM10 ) at the node. The outcomes showed that the amount of instantaneous air pollution
exposure of commuters was higher than that of non-commuters for both pollutants. A study by Sun
et al. [40] assessed the inhaled dose of pollutants for Strava users (bicyclists and pedestrians) in the
same area. In this study [40], bicyclists’ average inhaled dose of PM2.5 was four times greater than
that of pedestrians. The study also located areas that need investment priority (with high-level PM2.5
concentration and high-volume cycles/walks). These two studies exemplify the potential of the fitness
app data in evaluating the air pollution exposure of active travelers at the area level.

1.5. Study Purpose
      The current study aimed to contribute to the growing necessity of considering traffic emission
exposure in planning bicycle networks. While researchers are interested in how bicyclists are associated
with the risk of exposure to traffic-related air pollution, limited resources for data collection are likely
to restrict population-level examination across the networks. This study demonstrates how data from
Strava can be used to detect potential exposure to traffic air pollution at the street level while bicycling
(the prior two studies on air pollution using Strava data are at the area level). This study further
examined which environmental characteristics are associated with higher cycling trip volume in El
Paso, Texas, using Strava Metro data and is the first trial to look into citywide bicycling patterns in
this region. Cities like El Paso, where other data on bicycling are unavailable, may replicate this study
since Strava globally collects data anywhere Strava users exist.

2. Materials and Methods

2.1. Study Area
     The study area was El Paso, the sixth largest city in Texas (by population), situated on the border
between the United States and Mexico (Figure 1). This borderland has unique characteristics in
geographical, economical, transportation, and public health contexts that need special attention from
policy makers. A prominent geographic feature, Franklin Mountains State Park, extends from the
northern part of El Paso to the downtown area, nearly dividing the northern part of the El Paso region
into the west and east sides. This state park provides the local community with the largest urban
park in the El Paso region in which to spend time in nature, doing activities such as bicycling, hiking,
and rock climbing.
Int. J. Environ. Res. Public Health 2019, 16, 371                                                                           4 of 20
     Int. J. Environ. Res. Public Health 2019, 16, x FOR PEER REVIEW                                                            4 of 20

                                           Figure 1. Study
                                              Figure        areaarea
                                                      1. Study   (El Paso, Texas).
                                                                     (El Paso, Texas).

       Since    the enactment
             Since               of the North
                     the enactment       of theAmerican        Free TradeFree
                                                   North American            Agreement
                                                                                   Trade in    1993, El Paso
                                                                                            Agreement       in has
                                                                                                                1993,experienced
                                                                                                                         El Paso has
rapid    industrial    development,      urbanization,     economic     growth,      and
    experienced rapid industrial development, urbanization, economic growth, and surface  surface   trade  expansion     between  trade
the expansion
     United States       and  Mexico.     While   providing      various   opportunities      for  the
                     between the United States and Mexico. While providing various opportunities for theregion,   the  significant
increase
    region,  in international
                  the significantborder    crossings
                                       increase     in has  also yieldedborder
                                                         international       several transportation
                                                                                       crossings has problems,
                                                                                                            also yieldedincluding
                                                                                                                               several
increased      auto   dependency     and    air pollution   at  the  cross-border     and   surrounding
    transportation problems, including increased auto dependency and air pollution at the cross-border       areas.   El Paso  has
failed   to  meet   the National   Ambient      Air Quality   Standards     [41],  and its annual
    and surrounding areas. El Paso has failed to meet the National Ambient Air Quality Standards     particle  pollution   (PM      )
                                                                                                                                2.5[41],
level
    and was itsranked
                annualeighth
                          particleworst   out of(PM
                                   pollution      2772.5metropolitan     areas eighth
                                                        ) level was ranked        in the United
                                                                                           worst outStates  [42].metropolitan
                                                                                                        of 277     Arid weather,  areas
sustained      temperature    inversions,     and  occasional    sandstorms       contribute
    in the United States [42]. Arid weather, sustained temperature inversions, and occasional  to deteriorating     air quality   in
                                                                                                                          sandstorms
the contribute
     region [43].to deteriorating air quality in the region [43].
       In conjunction
             In conjunction with  air pollution
                               with   air pollution issues,  sedentary
                                                        issues,   sedentarylifestyles   andand
                                                                                lifestyles    related   health
                                                                                                  related        problems
                                                                                                            health   problemshave  have
required      interventions.    According      to national   and   regional    surveys,    El Paso   has
    required interventions. According to national and regional surveys, El Paso has lower rates of active lower    rates of active
travel
    travelthan    many
               than      other
                      many      similarly
                             other           sized
                                     similarly        urban
                                                  sized       areas
                                                          urban       in the
                                                                   areas      United
                                                                          in the        States
                                                                                    United       [44,45].
                                                                                             States        Over
                                                                                                      [44,45].  Over31 percent   of of
                                                                                                                        31 percent
adults     in  El Paso   reported   no   leisure-time     physical    activities   or exercise   in
    adults in El Paso reported no leisure-time physical activities or exercise in the preceding monththe  preceding     month    in in
2015    [46].   Overweight     (a  body   mass    index   (BMI)    between     25   and  29.9)  or
    2015 [46]. Overweight (a body mass index (BMI) between 25 and 29.9) or obese (a BMI above 29.9) obese   (a BMI    above   29.9)
adults
    adultsin theinregion   accounted
                    the region          for about
                                  accounted      for67about
                                                        percent67 of  the adult
                                                                   percent    of population     [47]. These figures
                                                                                   the adult population                  highlight
                                                                                                               [47]. These     figures
the highlight
     importance       of  combined    tactics   to encourage      this community       to  make   more
                   the importance of combined tactics to encourage this community to make more active     active   travel  choices
                                                                                                                                 travel
andchoices
      to improve and toenvironmental      conditions. conditions.
                         improve environmental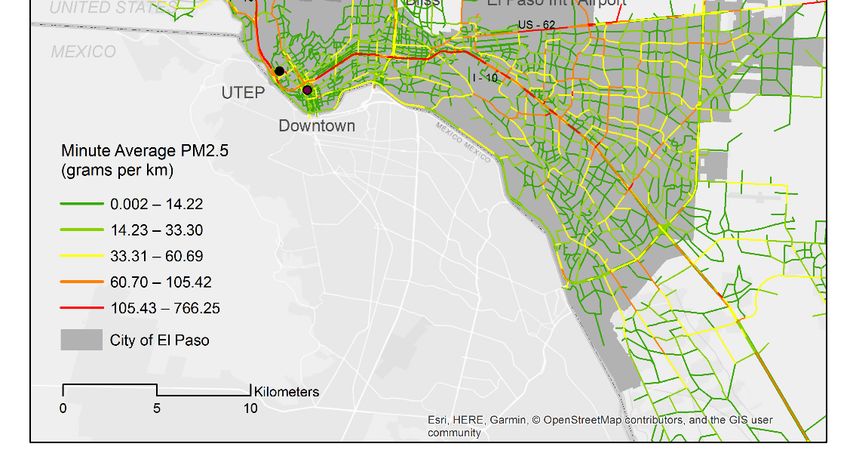
Int. J. Environ. Res. Public Health 2019, 16, 371                                                                          5 of 20

2.2. Data and Variables

2.2.1. Bicycle Count Data
      The outcome variable of this study was bicycle counts at street segments for a year. The primary
data set, bicycle counts, was obtained from Strava Metro through the Texas Department of
Transportation (TxDOT). Strava is a mobile app upon which individuals track their physical activities
(e.g., riding, running, walking, and hiking). Bicyclist and pedestrian activities uploaded to the app
can be accessed via its data service, Strava Metro. Strava Metro aggregates bicycling and walking
records (except records Strava users have made private) to street segments, nodes, and origin and
destination polygons, and anonymizes personal information (e.g., which athletes were on the street is
de-identified) [48]. This service is commercially available and provides information about physical
activity patterns with high temporal and spatial coverage (e.g., wider areas, longer periods, continuous
time, and geometry) (https://metro.strava.com). Since “the data provided through Strava Metro has
been aggregated and has had individual identifiers removed” [48], the use of this data does not require
an institutional review board (IRB) approval.
      Tables 1 and 2 present statistics of bicycling records and profiles generated by Strava users in the
TxDOT El Paso District. From 1 July 2016 to 30 June 2017, 67,824 activities were recorded across the
district (on average, one unique user reported about 15 cycling activities). Among the total rides, about
21 percent of trips were made for commuting, and 79 percent were non-commuting trips. The median
cycling distance was 32.2 km, and the median time spent riding was 102 min. The majority of the data
contributors were male (approximately 81 percent), and most contributors were adults aged 25 to 54
(around 63 percent). According to demographic information from Census data (American Community
Survey 2017 (five-year estimates)), 49 percent of residents in El Paso County are male, while 51 percent
of all residents are between 25 and 54 [49]. While this comparison shows a bias in Strava users in the
El Paso region, the data show similar trip and demographic patterns to other districts in Texas.

                            Table 1. Bicycle trip summary within the TxDOT El Paso District.

                                         Category                           Summary
                                   Rider Ids   1                              4459
                                   Activities 2                         67,824 (100.0%)
                                     Commute                             14,259 (21.0%)
                                     Non-commute                         53,565 (79.0%)
                                   Average distance                         32.2 km
                                   Median distance                          26.0 km
                                   Average time                       118 min (16.4 km/h)
                                   Median time                        102 min (15.4 km/h)
      1The number of unique user IDs that had a ride start in the El Paso District.       2   The number of unique bicycling
      activity IDs that had a ride start in the El Paso District.

                           Table 2. Bicycle rider summary within the TxDOT El Paso District.

                        Age                          Male                    Female                     Total
Int. J. Environ. Res. Public Health 2019, 16, 371 6 of 20
Several data processing steps were undertaken to obtain the final analytical sample used for the
statistical analysis. In terms of data extraction, street segments within the El Paso city boundary were
extracted, and bicycle counts were aggregated for the given year. The street segments delivered
by Strava Metro ranged in length from 1 m to 1.5 km (the median was 81 m). To avoid the
over-representativeness of very short segments (e.g., 1 m of segments), continuous short segments
that had the same features (e.g., speed limit, bus routes, and bike lanes) were merged as one segment
(bicycle counts on these segments were averaged). In terms of data cleaning, interstate highways,
freeways, and expressways were removed from the sample set for statistical analysis because of the
concern about noisy data (e.g., Strava users carrying their phones in their bags or cloth pockets may
have forgotten to turn off the app even after reaching their destination, and the app recorded trips in
vehicles). In addition, segments matched with traffic emission layers (for PM2.5 ) were only included
in the analytical sample set. Since the traffic emission layers were generated based on links that are
mostly major thoroughfares, bicycling on trails, most local streets, and no-roads (e.g., parking lots)
were excluded in the matching process. The final analytical data included 3501 roadway segments
with an average length of 366 m.
Two caveats are important to note. First, because Strava Metro provided the trip and rider
profiles at the district level only, these characteristics were not available to be examined for the
final (segment-level) analytical sample. Second, the study was not able to explore the gaps in the
general bicycling population or compare the app-based samples with other sources (e.g., automated
bicycle counts) due to the lack of adequate bike count data in the El Paso region. As Teri Kaplan,
the TxDOT bicycle and pedestrian statewide coordinator, noted in an interview, “There’s actually
virtually no real data that’s consistently maintained for bicycles and pedestrians” [50]. On the other
hand, when compared with other Strava-based studies, the demographic composition of Strava users
in the current study region showed similarity in terms of skewedness toward males and a younger
population [29,34,36,38,51].
2.2.2. Explanatory Variables
Several variables were considered in this study to examine the potential emission exposure and
measure the influence of various environmental factors on variations of bicycle volume. Specifically,
the variables included roadway characteristics, bicycle infrastructure characteristics, neighborhood
demographics, topographical attributes, and emission exposure measures. The variables were selected
based on the synthesis of the relevant literature and data availability. Most of the explanatory variables
were collected from open sources, such as the City of El Paso, the United States Geological Surveys’
National Elevation Dataset (NED), TxDOT, the U.S. Census Bureau, and the General Transit Feed
Specification (GTFS).
Roadway characteristics included posted speed limits and functional classifications [20,24–27].
To reflect actual speed limits and eliminate missing values, the posted speed limit information was
collected from Google Street View. To the best of our knowledge, there were no major changes in
speed limits (that would impact the current analysis) between the year of Google Street View (mostly
ranging from 2015 to 2018) and when Strava data were collected (2016–2017). Bicycle infrastructure
was classified into two categories: existing or planned. These variables can evaluate not only the
effectiveness of current infrastructure but also proposed ones. The values of demographics at the
block group level were assigned to the road segments [38]. When no demographic data were available,
nearby block group values were applied to avoid generating missing data. As a vertical topographical
attribute, maximum elevations and average segment slopes were calculated from the NED digital
elevation model at a resolution of 30 m [26,29]. City representative districts where segments belonged
served as a horizontal attribute in this analysis. Using the districting map in the current analysis context
may seem unusual because this map is not necessarily for bicycle-related policy-making purposes.
However, the districting map can be used as an indicator of areas where more or fewer bicyclistsInt. J. Environ. Res. Public Health 2019, 16, 371 7 of 20
make a trip and therefore can be useful for policy decision-making at the district scale (see Figure 1).
To examine propensity toward parks, a 61 m buffer from parks was generated [19,44].
To measure potential exposure to traffic emissions, two variables were developed: bus service
frequency and PM2.5 emission [30]. Bus routes and service schedules were identified from the GTFS
and calculated as the total bus service frequency per day. In terms of traffic pollutant, PM2.5 was used
as a surrogate measure of exposure to near-roadway traffic emissions. While there is no definitive
agreement about which pollutant is the best surrogate for traffic air pollution, the main source of
PM2.5 is vehicle emissions, and PM2.5 has been widely used as a proxy for traffic-related air pollution,
as discussed earlier [38,39,52,53]. The PM2.5 emission data were generated using hourly activity data
from the El Paso travel demand model and from the Environmental Protection Agency’s Motor Vehicle
Emission Simulator emission factors (2020 analysis year). The hourly PM2.5 emissions were then
post-processed to be converted to the minute average PM2.5 emission per km in gram for 2017.
All the explanatory variables were attributed to each Strava street segment using ArcGIS software
(ArcMap 10.5.1) by ESRI (http://www.esri.com/).
2.3. Data Analysis
The data analysis started with a spatial mapping analysis using the raw (unprocessed) data.
Three maps were developed to explore the spatial patterns of bicycling and traffic pollutant emissions.
The first two maps provided visual indications of variations in total bicycle counts for the given
year for commuting and non-commuting trips in the study area. Using the minute average PM2.5
(in grams per km) variable, the third map showed where high traffic emission networks were located.
The Jenks natural breaks classifier was used to divide data into five classes to cluster ridership and
PM2.5 emission levels on the maps.
Next, exploratory descriptive statistics were examined using the final analytical data
(N = 3501 segments). Finally, using averaged (aggregate) bicycle counts at the segment level, a bicycle
demand model was developed to examine the factors influencing bicycle activity (of Strava users)
within the study area. Since averaged bicycle counts (for the merged segments) are not (positive)
integers and had a non-Gaussian distribution, a least square model was first estimated with
log-transformed bicycle counts. Then, a spatial weighting matrix was developed to test spatial
autocorrelation statistics (Moran’s I). For spatial correlation analysis, the most typically used matrices
are the contiguity matrix and the inverse-distance matrix. To define spatial lags between neighboring
roadways that share nodes (ends of a segment), a binary contiguity matrix (W) for first-order neighbors
was created (if segments are adjacent, weighting is 1; otherwise 0) [54]. The Moran’s I test result
rejected the null hypothesis of the independent residuals, indicating a positive and significant spatial
correlation among bicycle counts in street segments. More advanced forms of model specifications
were examined, and different variable specifications and alternative functional forms were considered
to find the best data fit. Several models were estimated in a stepwise approach by adding the spatial
lag of the dependent variable, an autoregressive spatial error, and terms representing the spatial lags of
the independent variables using the contiguity matrix W with two generalized spatial stages [55–57].
After iterating the model estimation with differently combined explanatory variables, the final variables
were selected based on statistical considerations (at the 0.01 level of statistical significance), insights
from the literature, intuitiveness, and parsimonious considerations. The modeling efforts were
conducted using STATA, Version 15.0 [57].
3. Results
3.1. Spatial Patterns of Bicycling and PM2.5
Figure 2 shows the overall spatial patterns of annual bicycling volumes for non-commuting and
commuting trip purposes in El Paso. For the distribution of non-commuting trips (Figure 2a), the most
popular routes for Strava bicyclists were trails in the Franklin Mountains State Park (east side ofInt. J. Environ. Res. Public Health 2019, 16, 371 8 of 20
the park). Moving to the west side of the mountains, roadways that provide access to the Franklin
Mountains (North Resler Drive and Redd Road) and trails going up the mountain from Redd Road
had a high density of bicycle activities for leisure and recreational purposes. The other busiest routes
were on the roadways located in the southern end of the mountain range (Rim Road, Scenic Drive,
and Alabama Street). Copia Street, which connects to a border-crossing bridge (a port of entry between
the United States and Mexico), had a significant volume of cycling activities, implying that many
bicyclists use this path to cross the border. The second highest non-commute trip clusters included
segments neighboring the busiest roads and arterials (e.g., Joe Battle Boulevard).
Compared to non-commuting trips, commuting patterns showed differences such that commuting
routes were more saturated in the center of the city (Figure 2b). While roadways in and around the
Franklin Mountains were the most popular routes for non-commuters, ridership for commuting was
highly skewed toward the inner city (particularly North Mesa Street toward downtown). The analysis
also indicated high bicycling activity at the border crossing, especially for commute purposes.Int. J. Environ. Res. Public Health 2019, 16, x FOR PEER REVIEW 9 of 20
Int. J. Environ. Res. Public Health 2019, 16, 371 9 of 20
(a) (b)
Figure 2. Distribution of bicycle activities by trip purpose (data licensed by Strava (Base map: OpenStreetMap)). (a) Annual bicycle counts (non-commuting);
Figure 2. Distribution of bicycle activities by trip purpose (data licensed by Strava (Base map: OpenStreetMap)). (a) Annual bicycle counts (non-commuting); (b) Annual
(b) Annual bicycle counts (commuting).
bicycle counts (commuting).Int. J.J. Environ.
Int. Environ. Res.
Res.Public
PublicHealth
Health2019, 16,x371
2019,16, FOR PEER REVIEW 1010of
of 20
20
Figure 3 illustrates road networks with estimated minute-level PM2.5 emission per unit (grams
Figure 3 illustrates road networks with estimated minute-level PM2.5 emission per unit (grams
per km) across the El Paso region. Roadways reporting the highest levels of PM2.5 are observed among
per km) across the El Paso region. Roadways reporting the highest levels of PM2.5 are observed
major roads with high vehicle volume (including US Highway 85, Interstate Highway 10, US
among major roads with high vehicle volume (including US Highway 85, Interstate Highway 10,
Highway 54, US Highway 62, and Loop 375). Arterials show the second highest levels of PM2.5
US Highway 54, US Highway 62, and Loop 375). Arterials show the second highest levels of PM2.5
emissions. Somewhat surprisingly, roadways passing through the Franklin Mountains (Woodrow
emissions. Somewhat surprisingly, roadways passing through the Franklin Mountains (Woodrow
Bean Transmountain Drive) are depicted as among the routes with moderate emissions despite low
Bean Transmountain Drive) are depicted as among the routes with moderate emissions despite low
levels of traffic volume.
levels of traffic volume.
Figure
Figure 3. Minute average
3. Minute average PM
PM2.5 emissions.
2.5 emissions.
3.2. Descriptive Statistics
3.2. Descriptive Statistics
Table 3 shows the descriptive statistics for the variables considered in the statistical analysis of
Table 3 shows the descriptive statistics for the variables considered in the statistical analysis of
this study. As mentioned earlier, the final analytical data used for the statistical analysis included
this study. As mentioned earlier, the final analytical data used for the statistical analysis included
3501 street segments where, on average, approximately 321 bike trips occurred throughout the year
3501 street segments where, on average, approximately 321 bike trips occurred throughout the year
(including both commuting and non-commuting trips).
(including both commuting and non-commuting trips).Int. J. Environ. Res. Public Health 2019, 16, 371 11 of 20
Table 3. Descriptive statistics of key variables.
Continuous Categorical
Category Variable Descriptions
Mean STD Min. Max. Obs. (%)
Annual bicycle counts for analytic sample (N = 3501
Bicycle count 321.42 452.24 1 4371 —
street segments)
48 km/h (30 mph) or less — — — — 1293 (36.9%)
56 km/h (35 mph) — — — — 592 (17.0%)
Posted speed
64 km/h (40 mph) — — — — 731 (20.9%)
limit
72 km/h (45 mph) — — — — 646 (18.5%)
Roadway 80 km/h (50 mph or over) — — — — 237 (6.8%)
characteristics Principal arterial — — — — 1358 (38.8%)
Minor arterial — — — — 993 (28.4%)
Roadway type
Collector — — — — 1089 (31.1%)
Local street — — — — 61 (1.7%)
Segment length (m) 366.51 327.11 31.15 3661.98 —
Planned bike facilities — — — — 1954 (55.8%)
Bicycle No bike facility — — — — 2837 (81.0%)
infrastructure Bike lane — — — — 309 (8.8%)
Existing bike
characteristics Shared lane marking — — — — 52 (1.5%)
facilities
Buffered bike lane — — — — 128 (3.7%)
Off-street path — — — — 175 (5.0%)
Elevation (m) 1183.49 48.11 1117.06 1599.75 —
Segment slope (%) 1.79 2.03 0.10 30.43 —
Park within 61 m (200 ft) — — — — 385 (10.0%)
Topographical West Franklin Mt. — — — — 369 (10.5%)
attributes East Franklin Mt. — — — — 371 (10.6%)
South Franklin Mt. — — — — 529 (15.1%)
Downtown area — — — — 817 (23.3%)
District
East downtown — — — — 452 (12.9%)
East El Paso — — — — 225 (6.4%)
South El Paso — — — — 319 (9.1%)
East-South El Paso — — — — 419 (12.0%)
People aged 25–34 (%) 0.14 0.06 0.01 0.41 —
People aged 35–44 (%) 0.12 0.05 0 0.27 —
Age/gender
People aged 45–54 (%) 0.12 0.05 0 0.34 —
Male (%) 0.49 0.08 0.26 0.84 —
Hispanic (%) 0.80 0.17 0.16 1 —
White (%) 0.14 0.12 0 0.65 —
Neighborhood Race/ethnicity
African American (%) 0.03 0.05 0 0.35 —
demographics
Asian (%) 0.01 0.03 0 0.19 —
Median household income ($10,000) 4.34 2.30 0.95 14.29 —
Below poverty level (%) 0.24 0.19 0 0.81 —
College graduate/above (%) 0.51 0.20 0.02 0.95 —
Socio-economics
Single unit housing (%) 0.60 0.30 0 1
Employment density (per sq. km) 669.39 468.27 4.95 3146.70 —
Retail job density (per sq. km) 169.61 352.76 0 3543.27 —
Emission Bus frequency (times per day) 26.24 47.58 0 873 —
exposure Bus routes (count) 1.21 1.73 0 22 —
measures PM 2.5 (gram/min/km) 33.52 48.18 2.3 × 10⁻³ 766.25 —
Posted speed limits were classified into five categories, as listed in Table 3. The biggest proportion
was found in the first speed category (i.e., ≤48 km/h), about 37 percent. As for roadway types based
on functional classification, principal arterials accounted for the highest portion of the street segments,
about 39 percent. Minor arterials and collectors took up most of the rest, with about 30 percent.
The data indicated future plans for new bike facilities for more than half of the street segments in
the final analytical sample. When it came to existing bicycle infrastructure, roadways were categorized
into five types to evaluate the existing facility performance: no bike facility, bike lane, buffered bike
lane, off-street path, and shared lane marking. Approximately 19 percent of the street segments
were equipped with bike infrastructure. Nearly 9 percent of the street segments had bike lanes,
and 5 percent were off-street paths. Buffered bike lanes and shared lane marking constituted about
5 percent when combined.Int. J. Environ. Res. Public Health 2019, 16, 371 12 of 20
In terms of topography, the average elevation was 1183 m, and the mean slope was 1.79 degrees.
The highest elevations were observed in the Franklin Mountains and surrounding areas. Around
10 percent of segments were inside or within 61 m of a park, and segments were relatively evenly
dispersed across the eight districts (on average, 438 segments per district).
Regarding neighborhood demographics, the percentage of people between age 25 and 54 was,
on average, almost 40 percent. Hispanics made up the highest proportion of residents in El Paso—at
about 80 percent—followed by Whites and African Americans. The median household income was
about $43,400 (in 2015 inflation-adjusted dollars), and on average 24 percent of people were in poverty.
Employment density was 699 per square km, and retail job density was 170 per square km.
The mean minute-level PM2.5 emissions (per km) were about 34 grams, and on average buses ran
26 times a day.
3.3. Bicycle Model
Table 4 presents the results of the final bicycle model at the roadway-segment level. As mentioned
earlier, the final specification included variables statistically significant at the 0.01 level except for two
variables (that were statistically significant at the 0.1 level of significance) because of their intuitive
effects and potential to guide future research efforts in the field. In addition, the assessment of variation
inflation factors indicated no collinearity problems. Model estimation considered two types of bicycle
activities (non-commuting and commuting), but statistically significant differences in the variables
were not noteworthy between the two model results. The final model specification was made for total
bicycle trips.
The final model includes three types of spatial terms: spatial lags of dependent variables, spatial
lags in error terms, and spatial lags of two explanatory variables (bus frequency and elevation).
Adding these spatial lags indicated the best model fit and best controlled the spatial effects of the given
data according to the pseudo R-squared and Wald test of spatial terms. The model results showed
that sampled cyclists in El Paso preferred certain environmental characteristics and were potentially
exposed to traffic emissions.
For the first category of roadway characteristics, posted speed limits and roadway types were
captured as important factors that matter in route choices of Strava users. Strava cyclists preferred
roadways with a high speed limit (72 km/h or over) over roadways with a lower speed limit
(i.e., 48 km/h or less, 56 km/h, and 64 km/h). The negative signs on the variables of the functional
classifications indicate that both principal arterials and minor arterials were preferred over collectors
and local streets.
In terms of bicycle infrastructure characteristics, Strava cyclists favored routes with any type of
bike facility over routes with no facilities, with off-street paths having the highest likelihood of use,
followed by buffered bike lanes. Such positive and significant associations were found not only for
existing infrastructure but also for planned ones. That is, bicycle volumes were significantly higher on
the road segments currently having a future plan to install bike facilities.
For Strava riders in El Paso, vertical topographic characteristics were important factors in
predicting their route preferences. Roadways located in higher altitudes had more bicycle trips.
In terms of city representative districts, the West Franklin Mountain district had more bicyclists than
any other district. This result is quite expected given the potential attractiveness of this area providing
access routes to the west side of the mountains, as also indicated by spatial patterns of bicycling in
the region. This district also covers the University of Texas-El Paso (UTEP), and the popular cycling
routes in the region (see Figures 1 and 2). On the other hand, the East Franklin Mountain district,
which is in the northeast part of El Paso, including the east side of the mountains and the desert,
was associated with the least amount of bicycling activity in the region. The three districts covering
the east downtown, south El Paso, and east-south El Paso parts of the region also had fewer bicycle
trips than other districts.Int. J. Environ. Res. Public Health 2019, 16, 371 13 of 20
Table 4. Bicycle model results.
Category Variable Name Estimate T-Stat.
48 km/h (30 mph) or less −0.327 −5.56
Posted speed limit 56 km/h (35 mph) −0.481 −7.22
Roadway
64 km/h (40 mph) −0.298 −4.84
characteristics
Collector −0.569 −10.39
Roadway type
Local street −1.361 −8.05
Planned bike facilities 0.678 12.44
Bicycle Off-street path 1.474 13.54
infrastructure Buffered bike lane 1.340 11.16
Existing bike
characteristics Shared lane marking 1.047 6.10
facilities
Bike lane 0.886 10.19
Elevation (100 m) 0.402 6.77
Segment slope (%) 0.017 1.85
Topographical West Franklin Mt. 0.424 4.93
attributes East Franklin Mt. −0.796 −8.84
District East downtown −0.492 −6.59
South El Paso −0.585 −6.67
East-South El Paso −0.697 −8.50
People aged 35–44 (%) 0.702 1.75
Age
People aged 45–54 (%) 2.030 4.23
Neighborhood
demographics Ethnicity Hispanic (%) 0.465 2.72
Median household income ($10,000) 0.096 7.06
Socioeconomics
Retail job density (1000 per sq. km) −0.259 −3.94
Emission exposure Bus frequency (100 times per day) 0.339 7.32
measures (Natural log of) PM2.5 (gram/min/km) 0.146 9.11
Constant −1.496 −2.13
Spatial error 0.900 12.06
Spatial lag parameter of bike counts 0.381 4.62
Spatial terms
Spatial lag parameter of bus frequency −0.532 −3.41
Spatial lag parameter of elevation −0.123 −3.60
Notes: (1) Sample size is 3501; (2) Pseudo R-sq. is 0.40; (3) Chi-sq. statistic for Moran’s I is 1107.66 (p-value = 0.0000);
(4) Chi-sq. statistic for Wald test of spatial terms is 747.52 (p-value = 0.0000).
Certain neighborhood demographic characteristics were associated with variations in the number
of bicycle trips. The results indicated a positive tendency of bicycling among the block groups, with a
higher percentage of the age groups of 35–45 and 45–54 (with the highest positive association among
adults aged 45–54). Neighborhoods with higher median household income levels had a greater number
of bicycle trips, whereas higher retail job density was associated with fewer bicycle trips.
Lastly, regarding a central focus of this study, the results of exposure to traffic emission attributes
provide valuable insights into the potential adverse health impacts of exposure to traffic-related
air pollution while riding along highly trafficked streets. Bicycle trip counts were higher on streets
with more frequent bus services. Since buses serve, in general, busy routes with high traffic density,
this finding implies that Strava riders take the routes with heavy traffic. The results also indicated
that PM2.5 emission, one of the primary indicators of air pollution resulting from motorized traffic,
was significantly (positively) associated with bicycle activity volumes.
4. Discussion
4.1. Factors Influencing Bicycle Activity of Strava Users
The bicycle model findings provide revealed preference toward certain environmental settings,
including higher speed limits, principal/minor arterials, steepness, high altitudes, and bicycle
infrastructure. Since increasing cycling rates can be an integral component of strategies that generateInt. J. Environ. Res. Public Health 2019, 16, 371 14 of 20
synergistic effects on multiple social issues in El Paso, the findings should be carefully considered in
efforts to promote bicycle activities.
Preferences to higher speed and arterials (rather than collectors and local streets) may first seem
counterintuitive since many other bicycle studies indicate that bicyclists tend to feel uncomfortable
with high traffic speeds [25,26,28]. However, considering that the samples were opt-in Strava users who
willingly track their physical activities, it can be inferred that the sampled riders are likely to be more
experienced/enthusiastic and do not generally escape/avoid high speeds. Rather than feeling safe
and comfortable in low-velocity and low-traffic situations, confident riders may be attracted by other
variables, such as shorter routes and less pedestrian traffic [21,25]. Such attitudes were also supported
in a study that analyzed bicycle route choice preferences in Texas; experienced bicyclists favored
relatively higher speed routes over lower speed routes [20]. In addition, Hankey and Lindsey [24]
found that principal arterials were associated with increased bicycle traffic volume. In another study
by Hankey and colleagues, arterials had more bicycle volume compared to local streets, which might
be because this type of road offers travelers efficiency in terms of travel time and distance to their trip
destinations [27].
Topographic attributes (e.g., steeper slopes and high elevation) were important parameters and
are likely associated with characteristics of self-selected Strava riders who tend to physically challenge
themselves. While this finding is inconsistent with some previous studies in which sloping segments
were found to be deterrents for bicyclists [19,25,26,28,29], it was supported by some other studies and
consistent with the sample bias of Strava users (males and younger individuals). For instance, a study
by Sener et al. [20] showed that non-commute male riders had a higher inclination for routes with
moderate hills over flat terrains and steep hills over moderate hills. Another study that used Strava
data [51] also indicated that cyclists may prefer sloping routes due to greater exercise benefits and
the potential for rest periods while traveling downhill. Positive correlations with high altitudes can
be understood in the same context. The highest landforms in the city are in the Franklin Mountains
and adjoining basins, which are major generators of leisure activities (e.g., hiking, biking, and rock
climbing) in this region. Strava bicyclists are more likely to be recreational/fitness riders and probably
favor the enjoyment of visual and scenic views offered by the mountains and hills.
As expected from previous studies [18,20,24–28], bike infrastructure had positive effects on
increased bicycle volume. Higher bicycle volumes on routes with a proposed bike infrastructure plan
support future investment in the proposed plan. When deciding which type of bike facilities should be
prioritized, planners and practitioners can use the information about different magnitude of preference
by type. The most favored type was off-street paths, followed by buffered bike lanes, shared lane
marking, and bike lanes.
Compared to route characteristics, sociodemographic features in neighborhoods were less
determinant factors. Among a rich set of sociodemographic variables, only age, income level, ethnicity,
and retail job density were significant. The positive associations with certain age groups (35–45
and 45–54) and Hispanics were in line with the popularity of Strava to people aged 25–54 and the
ethnicity composition of the El Paso region. High-income neighborhoods had a greater number
of bicycle trips, which is supported by previous findings [24,34] and the fact that health app users
tend to have relatively higher income [58]. The negative impact of retail job density was an inverse
result from other studies [27,38], but this finding is perhaps again a result of Strava users being
recreational/fitness-oriented and seeking networks in more scenic, less crowded, and lower job-activity
density areas.
4.2. Potential Exposure to Traffic-Related Air Pollution
The results of positive correlations of bicycle volume with exposure to traffic emission attributes
provide insights into the potential adverse health impacts of riding along highly trafficked streets.
Buses serve, in general, busy routes with high traffic density. Travel time on such streets is likely
to be longer, and frequent stops and departures at bus stops contribute to increased combustionInt. J. Environ. Res. Public Health 2019, 16, 371 15 of 20
byproducts in the exhaust [11]. As extensively discussed in a Congestion Mitigation and Air Quality
Improvement program study [59], PM concentrations can build up, particularly when the bus doors
are open and when a line of buses is loading and/or unloading. Therefore, bicycling along busy
bus routes raises a concern about increased levels of traffic emission exposure. New technologies or
regulatory measures can help reduce vehicle emissions (along these busy bus routes or at bus locations),
such as replacing conventional vehicles with alternative fuel vehicles, diesel retrofits, idle reduction,
and extreme low-temperature cold-start programs [59]. For effective multimodal transportation
systems, transit-bicycle integration is often suggested. A significant relationship between busy routes
with frequent bus services and dense bicycle volume implies increased risks of Strava bicyclists in the
region being involved in vehicle collisions and inhaling traffic exhaust. The findings highlight the
importance of a careful approach to integration of bus networks with bicycling.
Another worry arises for bicyclists who regularly travel along roadways with heavy traffic in
terms of more deleterious effects of accumulated vehicle-related pollution exposure. Previous studies
suggested that riding alongside low-traffic routes can significantly reduce air pollution exposure [12,13].
Stated behavior studies indicated bicyclists’ willingness to avoid air pollution risks during cycling.
For example, in a questionnaire-based study by Cole-Hunter et al. [31], most of the survey participants
indicated a willingness “to adopt risk management strategies (with desired features) if shown to be
appropriate and effective.” Thus, bicyclists in the El Paso region need urgent guidance to choose
alternative routes if their regular trips take place on heavily trafficked roads and during rush hours.
For instance, providing public information about spatial-temporal pollution hot spots and alternative
routes to avoid excessive traffic emissions is worth implementing (e.g., [30]).
In addition to PM2.5 , five other traffic-related air pollutants were tested (PM10 , carbon monoxide,
nitrogen dioxide, oxides of nitrogen, and volatile organic compounds), and similar results were
obtained (every pollutant had a positive/significant association with higher bicycle volume). Although
they were not included in the final model estimation due to collinearity issues, the results imply that
bicyclists are highly likely to be exposed to a mixture of multiple traffic-emitted pollutants. Intuitively,
other vulnerable road users (e.g., pedestrians and runners) are likely to be at the same risk. It is
important to continuously monitor and analyze vulnerable road users to create appropriate initiatives
for sustainable and healthy transport networks.
4.3. Commuting and Non-Commuting Patterns
The examination of spatial patterns of bicyclists provided additional understanding of bicycling
behavior. For example, while Franklin Mountains State Park was the greatest trip generator for
non-commute bicycling, roadways in the inner city were popular routes for commuting. Such
spatial variations in bicycle ridership by trip purpose are similar to the results of a study of Strava
bicycle activities by Sun and Mobasheri [39]. In their study, commute cycling activities were more
densely located in the center of the city (in Glasgow) as opposed to non-commute cycling activities.
The recognition of the spatial variations by trip type may help develop strategies to improve bicycle
environments in a more targeted manner (for instance, if the goal is to promote regular bicycling as
part of daily exercise routines, the park may be prioritized for bicycle infrastructure investment).
Even though spatial patterns showed differences in popular routes between commuters and
non-commuters, the modeling approach was not separated by trip type; striking contrasts were not
found between the separated estimation results in terms of signs and significance (that might be related
to characteristics of Strava data and users of the Strava app). Though not reported here, the commuting
counts model showed a larger magnitude of the coefficient on bus frequency and PM2.5 emission
variables than the non-commuting count model did. As Sun and Mobasheri [39] suggested, bicyclists
are likely to be differently exposed to air pollution by trip purpose. Different levels of being exposed to
traffic-related air pollution will need to be considered in order to implement more effective strategies.Int. J. Environ. Res. Public Health 2019, 16, 371 16 of 20
4.4. Limitations and Future Work
Although providing valuable insights, the results gained from Strava bicyclists may not be
generalized to the general bicycle population because of the inherent sample bias of Strava athletes
(e.g., recreational riders rather than utilitarian riders and males rather than females). Developing
robust data fusion techniques will help supplement the bias issue and remove the uncertainty in
representing the total population. In spite of the limitations, Strava data can significantly improve
research capabilities for transportation and public health agencies having limited data. For instance,
examining Strava bicycle footprints can be a preliminary step in identifying bicycle patterns throughout
a city or county and for setting a counting system, especially for cities like El Paso that have few
options for data collection.
Analysis results indicate the necessity for further study of public health implications. Although
air pollution may negate the health benefits from bicycling, studies argue that health and societal
gains greatly outweigh the risks [60,61], and physical activity may alleviate the detrimental impact
of traffic-related air pollution on respiratory health [4,6]. Given that inhaled doses of pollutants are
the product of ventilation rate, duration of exposure, and pollutant concentration [61] and that other
factors can influence the level of exposure of bicyclists to traffic-related air pollution (e.g., individual
health conditions, proximity to vehicle emissions, wearing mask or helmet when riding), it will
also be valuable to extend this study with a focus on evaluating the net health impacts of bicycling.
Another objective of future research can be drawn from the context of the border region between the
United States and Mexico. Future work may consider cross-border travel patterns with a focus on
non-motorized modes of travel (walking and biking) using Strava data. How the patterns change
in relation to relevant policy efforts (e.g., developing a multimodal transportation system to reduce
automobile dependency) across time can be of future interest since Strava data are being updated
every day. Finally, future research may delve into trade-offs between air pollution exposure and other
important attributes (e.g., travel time and distance) in route decisions (and by different trip purposes).
Evaluating “value of clean ride” [30]—in other words, whether and to what extent cyclists are willing
to take routes with less traffic-generated pollution—could provide valuable and practical insights into
route choices.
5. Conclusions
Despite the health benefits of exercise, bicycling in a polluted atmospheric environment can
cause adverse health impacts. Understanding how people make bicycle trips and how much they are
exposed to the less visible threats of traffic is a critical part of decision-making, especially for cities
faced with public health and environmental issues like the El Paso region. However, with limited
data resources on bicycle users, such efforts might be constrained. This study examined the potential
exposure of bicyclists to traffic-emitted pollutants and the influential factors affecting link-level bicycle
volume in El Paso using fitness tracking app data. The findings of significant associations of bicycle
volume with higher levels of PM2.5 emissions and more frequent bus services imply the possible health
trade-offs of bicycling in this region. Transportation and public health authorities in the El Paso region
should consider guiding bicyclists to alternative routes if their regular trips take place on heavily
trafficked roads or during rush hours. The study results can also be a basis of future work for policy
makers to design safer, healthier, and better adopted bicycle networks. An evaluation of traffic-related
air pollution, integrated with a knowledge of influential factors on bicycle trip-making decisions and
patterns, will play a key role in the development and calibration of regional network models.
Author Contributions: Conceptualization, I.N.S.; Methodology and formal analysis, K.L. and I.N.S.;
Writing—original draft preparation, K.L.; Writing—review and editing, I.N.S.; Supervision and project
administration, I.N.S. Both authors have read and approved the final manuscript.
Funding: This research was funded by a grant from the U.S. Department of Transportation through the Center for
Advancing Research in Transportation Emissions, Energy, and Health (CARTEEH). The contents of this paperInt. J. Environ. Res. Public Health 2019, 16, 371 17 of 20
reflect the views of the authors, who are responsible for the facts and the accuracy of the information presented
herein. The U.S. Government assumes no liability for the contents or use thereof.
Acknowledgments: The authors would like to thank TxDOT’s Public Transportation Division (PTN) for making
the Strava Metro data available to the Texas A&M Transportation Institute (TTI) researchers. The authors would
also like to acknowledge Madhusudhan Venugopal for providing the emission data used in the analysis, Dawn
Herring for her editorial review, and two anonymous reviewers for their insightful feedback.
Conflicts of Interest: The authors declare no conflicts of interest.
References
1. Zuurbier, M.; Hoek, G.; van den Hazel, P.; Brunekreef, B. Minute ventilation of cyclists, car and bus
passengers: An experimental study. Environ. Health 2009, 8, 48. [CrossRef]
2. Park, H.Y.; Gilbreath, S.; Barakatt, E. Respiratory outcomes of ultrafine particulate matter (UFPM) as a
surrogate measure of near-roadway exposures among bicyclists. Environ. Health 2017, 16, 6. [CrossRef]
[PubMed]
3. Laeremans, M.; Dons, E.; Avila-Palencia, I.; Carrasco-Turigas, G.; Orjuela-Mendoza, J.P.; Anaya-Boig, E.;
Cole-Hunter, T.; de Nazelle, A.; Nieuwenhuijsen, M.; Standaert, A.; et al. Black carbon reduces the beneficial
effect of physical activity on lung function. Med. Sci. Sports Exerc. 2018, 50, 9. [CrossRef] [PubMed]
4. Matt, F.; Cole-Hunter, T.; Donaire-Gonzalez, D.; Kubesch, N.; Martínez, D.; Carrasco-Turigas, G.;
Nieuwenhuijsen, M. Acute respiratory response to traffic-related air pollution during physical activity
performance. Environ. Int. 2016, 97, 45–55. [CrossRef] [PubMed]
5. Weichenthal, S.; Kulka, R.; Dubeau, A.; Martin, C.; Wang, D.; Dales, R. Traffic-related air pollution and acute
changes in heart rate variability and respiratory function in urban cyclists. Environ. Health Perspect. 2011,
119, 1371–1378. [CrossRef]
6. Cole-Hunter, T.; Weichenthal, S.; Kubesch, N.; Foraster, M.; Carrasco-Turigas, G.; Bouso, L.; Martínez, D.;
Westerdahl, D.; de Nazelle, A.; Nieuwenhuijsen, M. Impact of traffic-related air pollution on acute changes
in cardiac autonomic modulation during rest and physical activity: A cross-over study. J. Expo. Sci.
Environ. Epidemiol. 2016, 26, 133–140. [CrossRef] [PubMed]
7. Weichenthal, S.; Hatzopoulou, M.; Goldberg, M.S. Exposure to traffic-related air pollution during physical
activity and acute changes in blood pressure, autonomic and micro-vascular function in women: A cross-over
study. Part. Fibre Toxicol. 2014, 11, 70. [CrossRef] [PubMed]
8. Peters, A.; von Klot, S.; Heier, M.; Trentinaglia, I.; Hormann, A.; Wichmann, H.E.; Lowel, H. Exposure to
traffic and the onset of myocardial infarction. N. Engl. J. Med. 2004, 351, 1721–1730. [CrossRef] [PubMed]
9. Lelieveld, J.; Evans, J.S.; Fnais, M.; Giannadaki, D.; Pozzer, A. The contribution of outdoor air pollution
sources to premature mortality on a global scale. Nature 2015, 525, 367–371. [CrossRef]
10. Leclercq, B.; Kluza, J.; Antherieu, S.; Sotty, J.; Alleman, L.Y.; Perdrix, E.; Loyens, A.; Coddeville, P.;
Lo Guidice, J.M.; Marchetti, P.; et al. Air pollution-derived PM2.5 impairs mitochondrial function in
healthy and chronic obstructive pulmonary diseased human bronchial epithelial cells. Environ. Pollut. 2018,
243, 1434–1449. [CrossRef]
11. Hertel, O.; Hvidberg, M.; Ketzel, M.; Storm, L.; Stausgaard, L. A proper choice of route significantly reduces
air pollution exposure—A study on bicycle and bus trips in urban streets. Sci. Total Environ. 2008, 389, 58–70.
[CrossRef] [PubMed]
12. Good, N.; Mölter, A.; Ackerson, C.; Bachand, A.; Carpenter, T.; Clark, M.L.; Fedak, K.M.; Kayne, A.;
Koehler, K.; Moore, B.; et al. The Fort Collins commuter study: Impact of route type and transport mode on
personal exposure to multiple air pollutants. J. Expo. Sci. Environ. Epidemiol. 2016, 26, 397–404. [CrossRef]
[PubMed]
13. MacNaughton, P.; Melly, S.; Vallarino, J.; Adamkiewicz, G.; Spengler, J.D. Impact of bicycle route type on
exposure to traffic-related air pollution. Sci. Total Environ. 2014, 490, 37–43. [CrossRef] [PubMed]
14. Cole-Hunter, T.; Morawska, L.; Stewart, I.; Jayaratne, R.; Solomon, C. Inhaled particle counts on bicycle
commute routes of low and high proximity to motorised traffic. Atmos. Environ. 2012, 61, 197–203. [CrossRef]You can also read