Basel AML Index 2019 A country ranking and review of money laundering and terrorist financing risks around the world
←
→
Page content transcription
If your browser does not render page correctly, please read the page content below
Basel AML Index 2019
A country ranking and review of money
laundering and terrorist financing risks
around the world

International Centre for Asset Recovery | August 2019

Basel Institute on Governance
Steinenring 60 | 4051 Basel, Switzerland | +41 61 205 55 11
info@baselgovernance.org | www.baselgovernance.org

BASEL INSTITUTE ON GOVERNANCE

Table of contents
1 Introduction                                                                                                                          1

2 What does the Basel AML Index measure?                                                                                                1

3 Scores and ranking                                                                                                                    4

4 Analysis of results                                                                                                                   6

5 Comparison of countries across five domains                                                                                          12

6 Special indicator focus - analysis of FATF data                                                                                      19

7 Special regional focus – post-Soviet countries                                                                                       22

8 Looking ahead                                                                                                                        24

9 Subscription details                                                                                                                 25

10 About and contact                                                                                                                   26

11 Annex I: Methodology                                                                                                                27

12 Annex II: Indicators                                                                                                                32

Table of tables
Table 1: Basel AML Index 2019 - Public Edition .................................................................................... 6
Table 2: Top 5 improving countries ..................................................................................................... 11
Table 3: Top 5 deteriorating countries ................................................................................................ 12
Table 4: Top performing countries in Domain 1................................................................................... 13
Table 5: Top performing countries in Domain 1 with an FATF fourth-round evaluation.......................... 14
Table 6: Lowest performing countries in Domain 1 ............................................................................. 14
Table 7: Top performing countries in Domain 2................................................................................... 15
Table 8: Lowest performing countries in Domain 2 ............................................................................. 15
Table 9: Top performing countries in Domain 3................................................................................... 16
Table 10: Lowest performing countries in Domain 3 ........................................................................... 16
Table 11: Lowest performing countries in Domain 4 ........................................................................... 17
Table 12: Top performing countries in Domain 5................................................................................. 18
Table 13: Lowest performing countries in Domain 5 ........................................................................... 18
Table 14: Basel AML Index risk scores since 2012 ............................................................................. 23
Table 15: FATF evaluations according to the fourth-round methodology .............................................. 23
BASEL INSTITUTE ON GOVERNANCE

Table of figures
Figure 1: Global distribution of ML/TF risks (Domain 1) ...................................................................... 15
Figure 2: Global distribution of corruption and bribery risks (Domain 2)............................................... 16
Figure 3: Global distribution of financial transparency risks (Domain 3) ............................................... 17
Figure 4: Global distribution of public transparency risks (Domain 4) .................................................. 18
Figure 5: Global distribution of political and legal risks (Domain 5) ...................................................... 19
Figure 6: Sample of FATF data available in the Expert Edition Plus package......................................... 20
Figure 7: Overview of the methodological process behind the Basel AML Index ................................... 27
Figure 8: Factors contributing to a high risk score .............................................................................. 28
Figure 9: Simple diagram of the expert weighting system .................................................................... 30

Acronyms
AML/CFT              Anti-Money Laundering / Countering the Financing of Terrorism
FATF                 Financial Action Task Force
FATF MERs            FATF Mutual Evaluation Reports

FIU                  Financial Intelligence Unit
FSI                  Financial Secrecy Index

IDEA                 Institute for Democracy & Electoral Assistance
IMF                  International Monetary Fund
IO                   Immediate Outcome (FATF)

ML/TF                Money Laundering / Terrorist Financing
NGO                  Non-governmental organisation
OCCRP                Organized Crime and Corruption Reporting Project

OECD                 Organisation for Economic Co-operation and Development
R.                   Recommendation (FATF)
TI CPI               Transparency International Corruption Perceptions Index

US INCSR             United States State Department International Narcotics Control Strategy Report
WEF                  World Economic Forum
WJP                  World Justice Project
BASEL INSTITUTE ON GOVERNANCE
1 Introduction
This report accompanies the eighth edition of the Basel AML Index, which has been published by the
Basel Institute on Governance since 2012.
The Basel AML Index is the only independent, research-based index issued by a not-for-profit organisation
ranking countries according to their risk of money laundering and terrorist financing (ML/TF). It provides
risk scores based on the quality of a country’s anti-money laundering and countering the financing of
terrorism (AML/CFT) framework and related factors such as perceived levels of corruption, financial
sector standards and public transparency.
The Public Edition of the Basel AML Index 2019, and the analysis in this report, covers 125 countries with
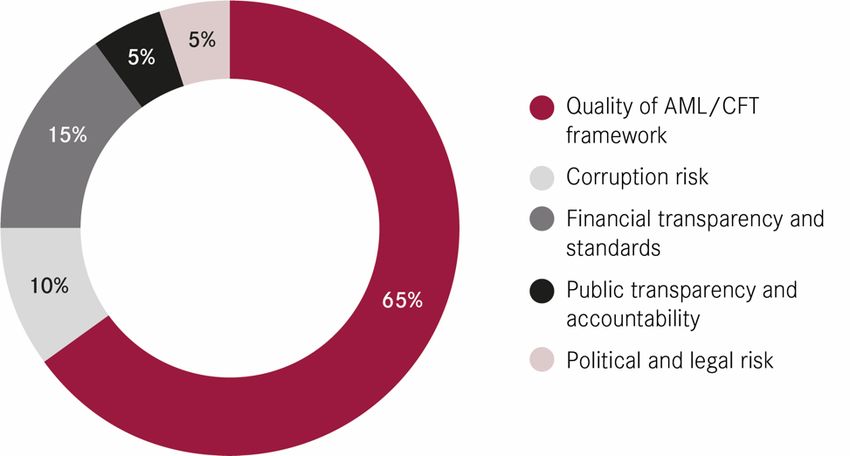
sufficient data to calculate a reliable ML/TF risk score. It focuses on five domains:
1. Quality of AML/CFT Framework
2. Bribery and Corruption
3. Financial Transparency and Standards
4. Public Transparency and Accountability
5. Legal and Political Risks
The Expert Edition interface, which includes a customisable interactive ranking and world map, covers
203 countries. This subscription-based service is used by companies and financial institutions as an
ML/TF country risk-rating tool for compliance and risk assessment purposes. In the public sector, it is
used by regulatory bodies and Financial Intelligence Units, as well as NGOs and academia, for research
and policy measures in the area of AML/CFT.
Additional services and resources this year include an upgraded, in-depth analysis of FATF Mutual
Evaluation Reports as part of the Expert Edition Plus package (see Chapter 6) and a detailed analysis of
ML/TF risks in a particular region (see Chapter 7 for a special regional focus on post-Soviet countries).
The Basel Institute has conducted extensive research in calculating the risk scores following academic
best practices. The methodology is reviewed every year by an international and independent panel of peer
reviewers to ensure that the ranking is accurate, plausible and continues to capture the latest
developments in ML/TF risks.
The Basel AML Index is developed and maintained by the Basel Institute’s International Centre for Asset
Recovery (ICAR).
2 What does the Basel AML Index
measure?
The Basel AML Index measures the risk of ML/TF in countries using data from publicly available sources
such as the Financial Action Task Force (FATF), Transparency International, the World Bank and the World
1BASEL INSTITUTE ON GOVERNANCE
Economic Forum. A total of 15 indicators of countries’ adherence to AML/CFT regulations, levels of
corruption, financial standards, political disclosure and the rule of law are aggregated into one overall risk
score. By combining these data sources, the overall risk score represents a holistic assessment
addressing structural as well as functional elements of the country’s resilience against ML/TF.
The scores are aggregated as a composite index using a qualitative and expert-based assessment in order
to form the final country ranking in Chapter 3. They should be read in conjunction with the analysis and
descriptions of the methodology and indicators in the rest of the report. Without this background, the
results may easily be misunderstood or misrepresented, and this may have unwanted consequences for
any policy or compliance decision that is taken as a result.
The Basel AML Index does not measure the actual amount of money laundering or terrorist financing
activity, but rather is designed to assess the risk of such activity. ML/TF risk is understood as a broad
risk area in relation to a country’s vulnerability to ML/TF and its capacities to counter it.
The Basel AML Index ranks countries based on their overall scores, capturing the complex global nature
of ML/TF risks and providing useful data for comparative purposes. However, the primary objective is not
to rank countries superficially in comparison with each other, but to provide an overall picture of different
countries’ risk levels and serve as a solid basis for examining progress over time.
2.1 Notes and limitations
Simplifying a complex issue: The Basel AML Index Public Edition is a composite index, meaning it
provides a simplified comparison of countries’ risks of ML/TF. Each country's risk score is calculated
from available data and does not represent an opinion or subjective assessment by the Basel
Institute. The scores summarise a complex and multidimensional issue, and should not be viewed as a
factual or quantitative measurement of ML/TF activity or as a specific policy recommendation for
countries or institutions. For a more thorough understanding of where exactly the risks lie, or to verify
overall scores that look implausible, users should look at the individual results of underlying indicators
available in the Expert Edition.
Methodological choices: There is no objective standard in creating a composite index, which is why
choices and judgments on indicators and their weight have to be made when developing and evolving the
Basel AML Index. See Annex I (Methodology) for more information.
Perception-based indicators: The Index relies heavily on perception-based indicators such as the
Transparency International Corruption Perceptions Index (TI CPI). In contrast to financial risk models
based purely on statistical calculations, the Basel AML Index evaluates structural factors by quantifying
regulatory, legal, political and financial indicators that influence countries’ vulnerability to ML/TF.
Transforming qualitative data into quantitative data does not fully overcome the limitations of perception-
based indicators. Unlike financial risk models, country risk models cannot be used as a solid basis for
prediction or for calculating potential loss connected to ML/TF.
FATF fourth-round evaluations: The Financial Action Task Force (FATF) Mutual Evaluation Reports
(MERs), a key indicator in the Basel AML Index, assess a country’s legal and institutional AML/CFT
framework and its implementation of AML/CFT measures in line with the 40 FATF Recommendations
(see Annex I (Methodology) and II (Indicators)). The FATF methodology was revised in 2013 (fourth round
of evaluations) in order to emphasise not only technical compliance with the Recommendations but the
2BASEL INSTITUTE ON GOVERNANCE
effectiveness of AML/CFT systems according to 11 Immediate Outcomes.1 The overwhelming majority
of countries assessed in the fourth round of evaluations so far – marked by an asterisk in the Basel AML
Index – have received dramatically lower scores for effectiveness than for technical compliance. This has
also had a major impact on their performance in the Basel AML Index, which weighs countries’ results in
effectiveness as twice as important as their results in technical compliance.
Data collection: Data collection for the 2019 Public Edition of the Basel AML Index was finished in June
2019. The results of Cape Verde, Haiti, Senegal, Trinidad and Tobago, and Zimbabwe do not include the
latest FATF reports, published in late July and August 2019. The Expert Edition is updated throughout the
year.
Insufficient data for some countries: Only countries with sufficient data to calculate a reliable ML/TF
risk score are included in the Public Edition of the Basel AML Index. See Annex I (Methodology) for the
definition of "sufficient data". The Expert Edition contains a more comprehensive overview of all 203
countries with their risk scores and details of the available data.
Comparability of results: The Basel AML Index methodology evolves each year to more accurately
capture ML/TF risks. The addition this year of one extra indicator with a 5% weighting, the TRACE Bribery
Risk Matrix, may slightly influence comparability of the results between 2018 and 2019, but not more
than 5%.
Separating ML vs. TF risks. The Index does not disaggregate data on ML- and TF-related risks. This is
due to a shortage of separate, consistent and regularly updated data related to TF risks. Current FATF
MERs are still the most solid basis for evaluating both ML and TF, though as aggregated scores.
Trade-based money laundering: The FATF identifies three main methods by which criminal organisations
and terrorist financiers move money for the purpose of disguising its origins and integrating it into the
formal economy: use of the financial system; physical movement of money (e.g. cash couriers); physical
movement of goods through the trade system.2 The Basel AML Index focuses mostly on the first two
ways, with less coverage of financial crime facilitated by international trade.
Use for compliance or risk assessment purposes: Due to these limitations, we recommend that the
Basel AML Index Expert Edition, rather than the Public Edition, should be used for compliance or risk
assessment purposes. The Expert Edition should also form part of a comprehensive, risk-based
compliance programme along with additional indicators and procedures relevant to the organisation’s
specific needs.
1 https://www.fatf-gafi.org/media/fatf/documents/methodology/FATF%20Methodology%2022%20Feb%202013.pdf
2 https://www.fatf-gafi.org/publications/methodsandtrends/documents/trade-basedmoneylaundering.html
3BASEL INSTITUTE ON GOVERNANCE
3 Scores and ranking
Countries are ranked from highest to lowest level of risk. The change column reflects the comparison of
2018 and 2019 results. Negative scores identify progress made (lower risks for the country) and positive
scores demonstrate an increase in ML/TF risks.
Ranking
Ranking
Country
Country
Change
Change
18/19
18/19
Score
Score
1 MOZAMBIQUE 8.22 -0.06 24 ANGOLA 6.33 -0.16
2 LAOS 8.21 -0.04 25 SERBIA* 6.33 -0.19
3 MYANMAR* 7.93 0.43 26 TAJIKISTAN* 6.28 -2.02
4 AFGHANISTAN 7.76 -0.52 27 ALGERIA 6.28 -0.07
5 LIBERIA 7.35 -0.07 28 KAZAKHSTAN 6.27 -0.09
6 HAITI 7.34 0.01 29 ECUADOR 6.25 -0.05
7 KENYA 7.33 -0.07 30 JAMAICA* 6.24 -0.24
8 VIETNAM* 7.30 -0.07 31 THAILAND* 6.22 -0.08
9 BENIN 7.27 0.02 32 SENEGAL 6.20 0
10 SIERRA LEONE 7.20 -0.04 33 TURKEY 6.19 0.08
11 CAPE VERDE 7.01 -0.01 34 PANAMA* 6.19 -0.02
12 NIGERIA 6.89 0.03 35 GUYANA 6.14 0.02
13 ZIMBABWE* 6.87 0.01 36 MOROCCO 6.12 -0.1
14 PARAGUAY 6.74 -0.05 37 UKRAINE* 6.01 -0.05
15 YEMEN 6.74 -0.07 38 BOLIVIA 6.01 -0.01
16 CAMBODIA* 6.63 -0.85 39 ALBANIA* 6.00 0.43
17 TANZANIA 6.63 -0.08 40 VANUATU* 5.90 -0.47
18 COTE D'IVOIRE 6.62 0.03 41 KYRGYZSTAN* 5.86 -0.33
19 CHINA* 6.59 0.57 42 BOSNIA-HERZEGOVINA 5.83 -0.01
20 MONGOLIA* 6.57 -0.08 43 COLOMBIA* 5.83 1.41
21 NICARAGUA* 6.53 -0.19 44 PHILIPPINES 5.81 -0.13
22 ARGENTINA 6.50 -0.05 45 BANGLADESH* 5.80 0.02
23 PAKISTAN 6.45 -0.04 46 MARSHALL ISLANDS 5.76 -0.16
4BASEL INSTITUTE ON GOVERNANCE
Ranking
Ranking
Country
Country
Change
Change
18/19
18/19
Score
Score
47 HONDURAS* 5.76 -0.09 76 BRAZIL 4.97 0.01
48 RUSSIA 5.75 -0.08 77 QATAR 4.97 -0.11
49 VENEZUELA 5.72 0.03 78 SWITZERLAND* 4.96 -0.37
50 UZBEKISTAN 5.71 -0.11 79 CANADA* 4.92 0
51 INDIA 5.60 0.32 80 HUNGARY* 4.90 -0.02
52 UNITED ARAB EMIRATES 5.60 -0.1 81 LATVIA* 4.89 0.91
53 BAHRAIN* 5.46 0.13 82 NETHERLANDS 4.86 -0.04
54 EL SALVADOR 5.46 0.03 83 TAIWAN, CHINA 4.84 -0.31
55 LEBANON 5.46 -0.53 84 SOUTH AFRICA 4.83 -0.51
56 BOTSWANA* 5.46 0.06 85 LUXEMBOURG 4.82 -0.29
57 DOMINICAN REPUBLIC* 5.41 -0.39 86 JORDAN 4.77 -0.07
58 PERU* 5.33 0.19 87 ROMANIA 4.76 0.01
59 AZERBAIJAN 5.31 -0.12 88 GUATEMALA* 4.75 -0.2
60 GHANA* 5.29 -0.03 89 ST. LUCIA 4.73 0.25
61 MOLDOVA 5.29 -0.08 90 ST. VINCENT AND GRENADINES 4.69 0.23
62 MALAYSIA* 5.28 -0.21 91 ICELAND* 4.66 0.07
63 SAUDI ARABIA* 5.26 0.25 92 AUSTRIA* 4.64 0.3
64 TRINIDAD AND TOBAGO* 5.26 0.01 93 KOREA, SOUTH 4.60 -0.09
65 COSTA RICA* 5.23 -0.24 94 GRENADA 4.59 0.39
66 GEORGIA 5.20 -0.11 95 SINGAPORE 4.58 0.07
67 INDONESIA* 5.13 -0.6 96 GREECE 4.56 0
68 MEXICO* 5.13 -0.04 97 IRELAND* 4.55 -0.03
69 HONG KONG SAR, CHINA 5.11 -0.07 98 EGYPT 4.55 -0.8
70 ARMENIA* 5.08 -0.15 99 GERMANY 4.49 0.05
71 GAMBIA 5.05 -0.03 100 SPAIN* 4.42 -0.03
72 UNITED STATES* 5.03 0.03 101 DOMINICA 4.40 0.23
73 JAPAN 5.02 -0.09 102 POLAND 4.34 -0.04
74 CYPRUS 5.01 0 103 BELGIUM* 4.29 -0.17
75 ITALY* 4.99 -0.1 104 CHILE 4.18 0.02
5BASEL INSTITUTE ON GOVERNANCE
Ranking
Ranking
Country
Country
Change
Change
18/19
18/19
Score
Score
105 CZECH REPUBLIC* 4.15 0.03 116 ISRAEL* 3.76 -0.08
106 UNITED KINGDOM* 4.13 -0.1 117 SLOVENIA* 3.70 -0.05
107 PORTUGAL* 4.10 -0.56 118 URUGUAY 3.58 -0.47
108 FRANCE 4.09 -0.03 119 LITHUANIA* 3.55 0.43
109 SLOVAKIA 4.04 -0.09 120 BULGARIA 3.51 -0.02
110 AUSTRALIA* 3.97 -0.09 121 SWEDEN* 3.51 -0.24
111 DENMARK* 3.95 -0.16 122 MACEDONIA 3.22 -0.11
112 MONTENEGRO 3.94 -0.01 123 NEW ZEALAND 3.18 -0.02
113 MALTA 3.94 -0.02 124 FINLAND* 3.17 0.6
114 NORWAY* 3.91 -0.21 125 ESTONIA 2.68 -0.05
115 CROATIA 3.82 -0.01
Table 1: Basel AML Index 2019 - Public Edition
* Countries assessed with the fourth-round FATF methodology
4 Analysis of results
4.1 General trends
• Some progress – but very slow: More countries showed slight improvements in their risk scores
in 2019 than last year, but there have been no substantial changes indicating significant progress
in tackling ML/TF. This confirms the general trend visible over the eight years since the Basel
AML Index was first calculated: most countries are slow to improve their resilience against ML/TF
risks.
• Improvements are minor: Between 2018 and 2019, 27% of countries listed in the Public Edition
(34/125) improved their scores by more than 0.1 point. However, only one country (Tajikistan)
managed to improve its score by more than 1 point.
• Some countries are still going backwards: The risk scores of 13% of countries (16/125)
deteriorated by more than 0.1 point. Colombia, Latvia, Finland and China demonstrated the
highest deterioration in risk scores.
• Most countries are at significant risk: 60% of countries in the 2019 Public Edition ranking
(74/125) have a risk score of 5.0 or above and can be loosely classified as having a significant
risk of ML/TF. The mean average level of risk, though marginally better than 2018, remains above
this (5.39 in 2019 compared to 5.63 in 2018).
6BASEL INSTITUTE ON GOVERNANCE
4.2 Lowest performing countries
Mozambique, Laos and Myanmar are the lowest performing countries out of the 125 countries assessed
by the Public Edition of the Basel AML Index. These three countries are listed among the US INCSR list
of major money laundering countries. Only Myanmar has been assessed by the FATF fourth-round
methodology, which may influence comparability between the countries.
4.2.1 Mozambique
Mozambique’s overall ML/TF risk score is 8.22 out of 10. The quality of its AML/CFT framework (Domain
1) is poor (9.28), based on data from the FATF (9.08) and the US INSCR (10), which lists it as a major
money laundering jurisdiction. Poor border controls and weak government institutions expose the country
to cross-border crimes related to drugs and human trafficking. Mozambique is also vulnerable to other
predicate offences including corruption, car theft and smuggling, robbery, cash smuggling, illicit trade in
precious metals and stones, customs fraud and goods smuggling.3
Mozambique has high risks associated with corruption, which is a pervasive problem in the country. The
country scores 7.11 for corruption (based on the TI CPI) and 7.70 for bribery risks (based on the TRACE
Bribery Risk Matrix). In January 2019, Mozambique announced the indictment of 18 individuals in
connection to the USD 2 billion “tuna bonds” scandal that plunged the country into its worst financial
crisis since independence. According to the Organized Crime and Corruption Reporting Project (OCCRP),
in 2013 the former finance minister Manuel Chang “approved $2 billion of government loans from Credit
Suisse and Russian bank VTB Capital, partially concealing them from donors including the International
Monetary Fund (IMF). The loans funded maritime projects including a state-owned tuna fishery. However,
an estimated 10 percent was diverted into bribes and kickbacks”.4 Mozambique defaulted on the loans
in January 2017, plunging the country into a financial crisis with debt soaring to 112% of GDP.
The country also fares poorly on Financial Transparency and Standards (Domain 3), with a score of 6.5.
The country’s risk level in Domain 4 (Public Transparency) and Domain 5 (Political and Legal Risks) is
medium. The country faces issues with the strength of public institutions, as well as the financial openness
of political parties and the level of media freedom.
4.2.2 Laos
Laos has an overall score of 8.21 and continues to face a high risk of money laundering despite leaving
the FATF’s list of jurisdictions with strategic deficiencies in 2017.
The country has high risks relating to the poor quality of its AML/CFT framework (Domain 1), scoring
9.12 out of 10. The country also has a low performance rating according to the FATF assessment, with a
score of 8.87 out of 10. However, the latest FATF report on Laos was issued in July 2011 and the country
has not gone through a fourth-round evaluation, which impacts on the validity and accuracy of its score.
3 https://esaamlg.org/index.php/Countries/readmore_members/Mozambique
4 https://www.occrp.org/en/daily/9090-mozambique-charges-18-in-tuna-bonds-scandal; see also https://www.justice.gov/opa/press-
release/file/1141826/download
7BASEL INSTITUTE ON GOVERNANCE
The main issues noted in the 2011 report related to the general lack of awareness of AML/CFT and the
lack of dedicated resources to undertake required reforms. The report also noted a high concern about
drug-related illicit proceeds (estimated at about 10% of GDP or USD 750 million) as well as deficiencies
in the criminalisation of ML and the absence of a freezing mechanism5.
The US INCSR lists Laos as a major money laundering jurisdiction, giving it the highest risk level of 10.
The main vulnerabilities relate to the cash-driven economy and limited law enforcement capacities, as
well as the existence of widespread corruption, drug and human trafficking, and environmental crimes.
The main sectors vulnerable to risk include the banking industry, stock market, insurance providers,
casinos, the real estate industry and money exchange shops.
The country’s performance in Domain 2 (Corruption and Bribery) is also poor, with a score of 6.73 under
TI CPI data and 7.10 under the TRACE Bribery Risk Matrix. Corruption is a high risk for companies
operating in Laos and “petty bribery is another dimension of corruption in Laos; companies are likely to
encounter this when trading across borders, paying taxes or acquiring public services”.6 In June 2019,
the ruling communist party announced an anti-corruption campaign.7 It remains to be seen whether this
will lead to any immediate results.
Laos performed poorly in Domain 3 (Financial Transparency and Standards), with a risk score of 6.16,
and Domain 4 (Public Transparency and Accountability), with a score of 7. In Domain 5 (Political and
Legal Risks), Laos scored 6.82, reflecting a weak and inefficient judiciary as well as a low level of press
freedom.
4.2.3 Myanmar
Myanmar’s overall score is 7.93. The quality of its AML/CFT framework (Domain 1) is poor, with a score
of 8.6 based on data from the FATF (8.2) and US INSCR (10).
The country was assessed with the FATF’s fourth-round methodology in September 2018, and its
performance in the 11 Immediate Outcomes – which measure the effectiveness of AML/CFT measures
– was only 3%. Technical compliance was rated at 48%. The overall FATF score in the Basel AML Index is
now 8.2, compared to 7.3 based on the previous 2011 FATF report. This does not necessarily reflect a
deterioration of the country’s position in FATF data. Rather, compared to the previous year, a more
accurate picture of the situation is now available as Myanmar has undergone its first assessment under
the new FATF methodology (See Chapter 2, Notes and limitations).
According to this latest FATF report, Myanmar is exposed to a large number of significant ML threats,
including drug production and trafficking, environmental crimes (including the illegal extraction of jade,
wildlife trafficking and illegal logging), human trafficking, corruption and bribery.8
5 http://www.apgml.org/members-and-observers/members/member-documents.aspx?m=a6c4a803-0e15-4a43-b03a-700b2a211d2e
6 https://www.ganintegrity.com/portal/country-profiles/laos/
7 https://thediplomat.com/2019/07/the-only-way-to-end-corruption-in-laos/
8 http://www.fatf-gafi.org/media/fatf/documents/reports/mer-fsrb/APG-Mutual-Evaluation-Report-Myanmar.pdf
8BASEL INSTITUTE ON GOVERNANCE
Myanmar is listed in the US INCSR as a major money laundering jurisdiction. According to the State
Department report, Myanmar’s economy is underdeveloped, as is its financial sector, and the majority of
currency is still held outside the formal banking system (although bank deposits have increased over the
past several years). The INCSR supports the FATF findings, noting that major sources of illicit proceeds
in Myanmar include narcotics, trafficking in persons, the illegal trade in wildlife, gems, and timber, as well
as public corruption.
Corruption and bribery (Domain 2) present a serious issue, with high scores of 6.73 (corruption) and 7.1
(bribery). The country lacks financial transparency (with a Domain 3 score of 7) and faces issues related
to political and legal risks (scoring 6.44 in this category). These factors make Myanmar potentially
appealing to criminal organisations.
4.3 Notable performers in 2019
While there is no country with a zero risk of money laundering, the best performing countries according
to the Basel AML Index in 2019 are Estonia, Finland and New Zealand.
4.3.1 Estonia
Estonia’s overall risk score is low at 2.68 out of 10. Estonia scores 2.95 in Domain 1 (Quality of AML
/CFT Framework). The low risk score is largely driven by its good performance in the 2014 FATF country
report, which produces a score of 3.61 and states that Estonia’s supervisory framework is “broadly
sound”, and the authorities “have been effective in confiscating and seizing property in ML and drug
related cases”.9 This score may worsen when Estonia is re-assessed according to the FATF fourth-round
methodology focusing on the effectiveness of AML/CFT measures and not only technical compliance.
Not only is it common for countries to obtain poorer scores when assessed with the latest methodology,
but Estonia has been subject to recent criticism of its effectiveness in preventing ML.
The Financial Secrecy Index (FSI) also ranks Estonia as a low-risk country, listing it 93rd out of 112
countries. 10 The few identified ML/TF issues relate to legal entity transparency (public company
ownership and corporate tax disclosure, as well as recorded company ownership).
Estonia also displays good results in Domain 2 (Corruption and Bribery), scoring 2.54. Indeed, in January
2019, the TI CPI named Estonia as the least corrupt country in emerging Europe.11 The country’s scores
for Domains 3, 4 and 5 demonstrate a low risk in the areas of financial transparency, public transparency
and legal and political risk.
It is important to note that the data does not reflect the risk of Estonia’s geographic proximity to Russia
and the issues that may be associated with this. Estonia has been labelled as one of the first ports of
entry for Russian money launderers wishing to gain access to the European financial market.
9 https://rm.coe.int/report-on-fourth-assessment-visit-executive-summary-anti-money-launder/168071600b
10 https://www.financialsecrecyindex.com/en/introduction/fsi-2018-results
11 https://emerging-europe.com/news/estonia-is-emerging-europes-least-corrupt-country/
9BASEL INSTITUTE ON GOVERNANCE
4.3.2 Finland
Finland’s overall score is 3.17 out of 10. In Domain 1 (Quality of AML/CFT Framework) Finland achieved
a score of 4.38. Of the three best performing countries, Finland is the only country that has been assessed
by the FATF fourth-round methodology, which occurred in February 2019. The country achieved a 45%
performance score in relation to effectiveness, and a 66% performance score in technical compliance.
According to the FATF report, “Finland has an adequate level of understanding of its ML and TF risks, and
especially of its main ML risks associated to the grey economy. Those risks are addressed in a well-
coordinated manner and through an efficient and comprehensive set of preventive measures”.12
Despite this, the FATF highlighted the risks connected with its geographical proximity to Russia: “Given
its geographical location, Finland is a major European gateway to and from non-European countries, and
strong business and trade relationships have developed between Finland and Russia, as well as with
neighbouring Baltic States and other Nordic countries. This geographic proximity supports the
development of commercial routes, including trade routes in illicit flows of goods and funds”.
The FATF report, which notes the limited ability of competent authorities to establish the beneficial
ownership of legal persons in a timely manner: “The public registries are not fully reliable and relevant
remedies to ensure that registers are kept up-to-date are not available”. This is supported by the FSI,
which ranks Finland 71 out of 112 countries. The main issues relate to secrecy of ownership registration
(recorded company ownership, limited partnership transparency and public company ownership). Finland
demonstrates a low risk level in Domain 2, 3, 4 and 5.
Even though the country possesses a low ML/TF risk, in March 2019 the National Bureau of Investigation
of Finland said it recorded dozens of cases of international money laundering in Finland in 2018, and has
so far seized EUR 225,000 from criminal gangs. The cases relate to professional money launderers, so-
called “money mules”, who have opened up hundreds of bank accounts all over the country13 . This
demonstrates the general point that no country, including those with strong AML/CFT frameworks and
institutions, is immune to money laundering risks.
4.3.3 New Zealand
New Zealand’s overall score is 3.18. The country’s performance in Domain 1 is 4.22, based on a good
performance in the FATF report (3.81) and the low-to-medium risks associated with financial secrecy
(4.95). As with Estonia, New Zealand has not yet been assessed with the FATF fourth-round methodology,
and the country report was issued in 2009. It is hoped that the findings from 10 years ago, namely that
the ML offence is being actively enforced, and that the confiscation regime is “generally sound” and is
put to frequent and effective use, hold true today.14 The report did however identify some issues of
concern related to weak preventive measures.
12 http://www.fatf-gafi.org/media/fatf/documents/reports/mer4/MER-Finland-2019.pdf
13 https://newsnowfinland.fi/crime/report-international-money-laundering-on-the-rise-in-finland
14 https://www.fatf-gafi.org/media/fatf/documents/reports/mer/MER%20New%20Zealand%20ES.pdf
10BASEL INSTITUTE ON GOVERNANCE
New Zealand is ranked in the FSI as a low-to-medium risk country. The main issues are related to
ownership registration and legal entity transparency.15
The country scores well for risks in Domains 2-5.
Even though the country has a low risk of ML/TF, the Ministry of Justice estimates that about NZD 1.35
billion (USD 0.9 billion) from fraud and illegal drugs is laundered in New Zealand each year.16
4.4 Top five improving countries
Tajikistan, Cambodia, Egypt, Indonesia and Portugal demonstrate the greatest improvements in the Public
Edition of the Basel AML Index 2019.
Country 2019 score 2018 score Difference
TAJIKISTAN* 6.28 8.30 -2.02
CAMBODIA* 6.63 7.48 -0.85
EGYPT 4.55 5.35 -0.80
INDONESIA* 5.13 5.73 -0.60
PORTUGAL* 4.10 4.66 -0.56
Table 2: Top 5 improving countries
* Countries assessed with the fourth-round FATF methodology
Different reasons explain the improvements. Tajikistan enjoys a huge decrease in its ML risk score due
to a much more positive FATF assessment in December 2018, which produces a score of 5.53 compared
to 9.35 previously. The country also shows slightly improved scores in corruption and political/legal risks.
Similarly, Indonesia’s updated FATF evaluation in September 2018 improves its FATF score from 6.32 to
4.73.
Making such significant progress in FATF assessments under the fourth-round methodology is rather
exceptional; in general, the fourth-round evaluations lead to a deterioration in country scores.
Improvements in the risk score for Cambodia, Egypt and Portugal are mainly due to them being dropped
from the US INCSR list of major money laundering countries. Cambodia also shows slight improvements
in relation to public transparency and accountability.
15 https://www.financialsecrecyindex.com/PDF/Finland.pdf
16 https://www.nzherald.co.nz/fraud/news/article.cfm?c_id=213&objectid=12166953
11BASEL INSTITUTE ON GOVERNANCE
4.5 Why some countries have fallen in the ranking
Colombia, Latvia, Finland, China and Lithuania have dropped significantly in the ranking due to an increase
in the ML/TF risk category after having undergone an FATF evaluation based on the fourth-round
methodology. Colombia’s FATF risk score rose sharply from 2.72 to 5.57, Latvia’s from 3.26 to 5.87,
Finland’s from 3.26 to 4.77, China’s from 4.63 to 6.23 and Lithuania’s from 3.68 to 5.33.
This may, but does not necessarily have to, indicate a sudden and dramatic deterioration in the countries’
ML/TF risks. It is more likely that it points to longstanding gaps in relation to the effectiveness of the
concerned country’s AML/CFT framework that have only just been highlighted by the new FATF
methodology. This represents an opportunity for these countries to fill these gaps, as well as a wake-up
call for all countries to focus on effectiveness and not just tick-box compliance with FATF
Recommendations.
Country 2019 score 2018 score Difference
COLOMBIA* 5.83 4.42 -1.41
LATVIA* 4.89 3.98 -0.91
FINLAND* 3.17 2.57 -0.60
CHINA* 6.59 6.02 -0.57
LITHUANIA* 3.55 3.12 -0.43
Table 3: Top 5 deteriorating countries
* Countries assessed with the fourth-round FATF methodology
5 Comparison of countries across five
domains
5.1 Domain 1: Quality of AML/CFT Framework
This domain consists of three indicators covering risks related to the quality of the legal and institutional
AML/CFT framework of a particular country and the ability of its financial and economic system to
mitigate risks of ML/TF. This domain has a 65% weighting in the overall score. Countries’ scores for this
domain are based on assessment of data from their latest FATF MER (35% weighting), the FSI (20%
weighting) and the US INSCR (10% weighting).
Country 2019 score in
Domain 1
ESTONIA 2.95
BULGARIA 3.16
MACEDONIA 3.28
CROATIA 3.59
12BASEL INSTITUTE ON GOVERNANCE
SLOVENIA* 3.67
MONTENEGRO 3.90
LITHUANIA* 3.91
URUGUAY 3.93
DOMINICA 3.95
NEW ZEALAND 4.22
Table 4: Top performing countries in Domain 1
* Countries assessed with the fourth-round FATF methodology
Performance in Domain 1 is largely driven by FATF data and the methodology used for the FATF
assessment of a particular country. The FATF reports issued prior to the introduction of the fourth-round
methodology are outdated and do not cover the extent to which financial systems and economies are
resilient against threats of ML/TF. They also do not provide data on a country’s performance regarding
the 11 FATF Immediate Outcomes, measuring the effectiveness of systems.
As a consequence, countries that have not yet been subjected to the FATF’s fourth-round evaluation
usually have better scores. Indeed, out of the 10 best performing countries in this domain, only two
(Slovenia December 2018, Lithuania February 2019) have had recent FATF assessments.
It can be expected that the risk rating of countries that have not been evaluated by the FATF in the last
few years, including of current top performers, will change significantly in the next few years due to
scheduled FATF evaluations (e.g. Uruguay to be evaluated in July 2019, Macedonia in April 2021, Croatia
in July 2021 and Montenegro in April 2022). There are no scheduled onsite missions for Estonia and
Bulgaria for the next three years. Consequently, these countries will not drastically change their position
in the Basel AML Index before the new FATF data appears.
For comparison, if the Basel AML Index only scored countries that had undergone FATF fourth-round
evaluations, the Domain 1 list of top performers would be:
Country 2019 score
in Domain 1
SLOVENIA* 3.67
LITHUANIA* 3.91
PORTUGAL* 4.36
FINLAND* 4.38
SWEDEN* 4.5
ISRAEL* 4.55
CZECH REPUBLIC* 4.74
SPAIN* 4.85
AUSTRALIA* 5.08
DENMARK* 5.17
13BASEL INSTITUTE ON GOVERNANCE
Table 5: Top performing countries in Domain 1 with an FATF fourth-round evaluation
The two tables on countries’ performance in Domain 1 show a significant difference in the minimum and
maximum scores of the top 10 performing countries. For countries that have undergone FATF fourth-
round evaluations, the minimum risk score 1 is lower (2.95 versus 3.67), as is the average result for these
countries (3.65 versus 4.52).
Data from the FSI and the US INSCR also have an important impact on Domain 1 risk scores. For instance,
none of the countries in the two lists of best performers (except Dominica) are in the US INSCR list of
major money laundering countries, and none are among the top 20 countries in the FSI.
Country 2019 score
in Domain 1
MOZAMBIQUE 9.28
LAOS 9.12
MYANMAR* 8.60
KENYA 8.56
AFGHANISTAN 8.55
CAPE VERDE 8.49
BENIN 8.33
LIBERIA 8.16
VIETNAM 8.12
Table 6: Lowest performing countries in Domain 1
* Countries assessed with the fourth-round FATF methodology
In contrast, the US INSCR list includes most of the lowest performing countries in Domain 1. Mozambique,
Laos, Kenya, Afghanistan, Cape Verde, Benin, Liberia, Vietnam and the Cayman Islands are defined by
the INSCR Vol. II as “major money laundering countries” for narcotics-related money laundering.17
The distribution of ML/TF risk in Domain 1 across all of the assessed countries shows that most countries
(87 out of 125) have a medium level of risk, referring to a score between 3.3 and 6.6. 36 countries have
a high risk of ML/TF, scoring from 6.70 to 9.90. Only three countries are rated as low risk with a score
below 3.3.
17 https://www.state.gov/wp-content/uploads/2019/03/INCSR-Vol-INCSR-Vol.-2-pdf.pdf
14BASEL INSTITUTE ON GOVERNANCE
Figure 1: Global distribution of ML/TF
risks (Domain 1)
5.2 Domain 2: Bribery and Corruption
Domain 2 consists of two indicators, covering corruption (TI CPI) and bribery (TRACE Bribery Risk Matrix).
Corruption and bribery are very common predicate offences to money laundering. Countries with high
exposure or vulnerability to corruption are at a higher risk of money laundering as proceeds of corruption
need to be laundered.
Bribery, defined as an illicit flow of money from a private entity to a public official in exchange for being
granted a government service, is an important form of corruption. It generates significant amounts of
money that need to be laundered to enter the financial system.
Domain 2 has a 10% weighting in the Basel AML Index, which is equally distributed between TI CPI scores
(5%) and TRACE Bribery Risk Matrix scores (5%).
Country 2019 score Country 2019 score
in Domain 2 in Domain 2
DENMARK 1.03 VENEZUELA 8.32
NEW ZEALAND 1.08 AFGHANISTAN 8.12
SINGAPORE 1.20 YEMEN 8.03
SWEDEN 1.31 HAITI 7.96
FINLAND 1.35 ANGOLA 7.84
NORWAY 1.40 CAMBODIA 7.81
SWITZERLAND 1.50 ZIMBABWE 7.57
NETHERLANDS 1.60 NICARAGUA 7.43
LUXEMBOURG 1.68 MOZAMBIQUE 7.40
UNITED KINGDOM 1.82 BANGLADESH 7.39
Table 7: Top performing countries in Domain 2 Table 8: Lowest performing countries in Domain 2
15BASEL INSTITUTE ON GOVERNANCE
Most countries have a medium risk of ML associated with corruption and bribery. The distribution of low-
and high-risk countries is almost equal.
Figure 2: Global distribution of corruption and
bribery risks (Domain 2)
5.3 Domain 3: Financial Transparency and Standards
Domain 3 covers risks of ML associated with financial transparency issues. The data are taken from the
IMF and World Economic Forum (WEF) and covers such indicators as strength of auditing, business
disclosure, regulations of security exchanges and quality of financial standards.
Transparency in the business sector is an important component to provide a holistic assessment of money
laundering risks. The Domain has a 15% impact on the overall score of countries.
Country 2019 score Country 2019 score
in Domain 3 in Domain 3
FINLAND 0.97 MARSHALL ISLANDS 8.00
MACEDONIA 1.00 YEMEN 7.62
NORWAY 1.14 HAITI 7.35
SINGAPORE 1.21 BAHRAIN 7.00
CANADA 1.41 MYANMAR 7.00
HONG KONG SAR 1.44 GRENADA 7.00
AUSTRALIA 1.53 ST. LUCIA 6.50
NETHERLANDS 1.68 MOZAMBIQUE 6.50
NEW ZEALAND 1.68 LIBERIA 6.36
LUXEMBOURG 1.69 LAOS 6.16
Table 9: Top performing countries in Domain 3 Table 10: Lowest performing countries in Domain 3
Similar to Domain 1, most countries (81 out of 125) are identified as medium risk. However, this time
there are 37 countries with a low risk rating and only six countries with a high risk rating related to their
financial transparency and standards.
16BASEL INSTITUTE ON GOVERNANCE
high risk
low risk
medium risk
Figure 3: Global distribution of financial
transparency risks (Domain 3)
5.4 Domain 4: Public Transparency and Accountability
Domain 4 relates to the transparency of public disclosures, the openness of budgets and public
accountability. An example of money laundering in this context relates to bribery and contributions to
election campaigns and political parties in return for advantages. The Domain has a 5% impact on the
overall score and consists of data from the International IDEA Political Finance Database, the Open
Budget Index and the World Bank IDA Resource Allocation Index.
The best performing countries show a near-zero risk level in this domain. Finland, Luxembourg, Israel,
Taiwan, Belgium, Estonia, Jamaica, Ireland and Lithuania all score between 0 and 1.
Country 2019 score
in Domain 4
SWITZERLAND 10.00
QATAR 10.00
BAHRAIN 10.00
SAUDI ARABIA 9.90
GAMBIA 9.00
CHINA 8.70
LEBANON 8.60
ZIMBABWE 8.57
YEMEN 8.50
VANUATU 8.00
Table 11: Lowest performing countries in Domain 4
Low performance in this domain is mainly associated with poor transparency levels of political finances,
mainly related to inadequate campaign spending reporting by parties and candidates. Unlike the other
domains, the distribution of risk scores shows that most countries are ranked as low risk.
17BASEL INSTITUTE ON GOVERNANCE
high risk
medium risk
low risk
Figure 4: Global distribution of public
transparency risks (Domain 4)
5.5 Domain 5: Legal and Political Risks
This domain covers political and legal risks associated with media freedom and strength of the rule of law
in the country. The data are taken from Freedom House, the WEF and the World Justice Project (WJP).
Freedom of expression in the press is seen as an important tool to expose money laundering. Additionally,
a functioning and independent judicial system is a critical measure to deter crime, including financial
crimes and money laundering, through the threat of punishment. Domain 5 has a 5% weighting in the
overall score.
Country 2019 score Country 2019 score
in Domain 5 in Domain 5
FINLAND 1.03 YEMEN 8.04
NORWAY 1.11 VENEZUELA 7.83
SWITZERLAND 1.23 UZBEKISTAN 7.35
LUXEMBOURG 1.37 LAOS 6.82
NEW ZEALAND 1.37 CAMBODIA 6.74
NETHERLANDS 1.37 TAJIKISTAN 6.69
DENMARK 1.38 AFGHANISTAN 6.65
SWEDEN 1.41 ANGOLA 6.49
CANADA 1.72 AZERBAIJAN 6.47
ICELAND 1.75 HAITI 6.45
Table 12: Top performing countries in Domain 5 Table 13: Lowest performing countries in Domain 5
Like in all other domains except Domain 4, the majority of countries are rated as medium risk.
18BASEL INSTITUTE ON GOVERNANCE
Figure 5: Global distribution of political
and legal risks (Domain 5)
6 Special indicator focus - analysis of
FATF data
During the first years of implementing the FATF fourth-round methodology, there were occasionally
concerns about the comparability of data (see also explanations in section 5.1 above) and the
presentation of findings.
Since then, we have observed significant improvements with respect to the harmonisation of the reporting
methodology under the new methodology and more regular updates of consolidated FATF assessments.
These improvements provide greater opportunities for enhanced analysis of this particular data set, which
is presented in the following and is offered with regular updates as part of the Basel AML Index Expert
Edition Plus package.
6.1 In-depth analysis of FATF data
This enhanced analysis is based on consolidated data from all published FATF Mutual Evaluation Reports
(MERs) and converts the FATF rating (Compliant, Largely Compliant, Partially Compliant, Non-Compliant)
into a numerical, colour-coded scale from 0 to 3.
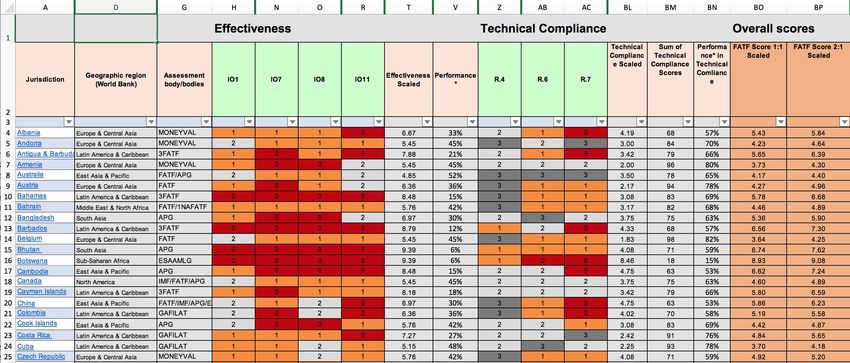
As illustrated in Figure 6 below, the data are presented in Excel format, accompanied by graphics and an
analysis of main achievements and trends. The Excel sheet includes regional indexation and information
19BASEL INSTITUTE ON GOVERNANCE
about the review authority and the date of review to allow sorting by these criteria. The scores are
presented in raw form as well as scaled from 0 to 3. Updates are provided on a quarterly basis.
Figure 6: Sample of FATF data available in the Expert Edition Plus package
The user can rank countries according to their results in the 11 Immediate Outcomes (IOs) and 40
Technical Recommendations (R). IO and R scores are presented both separately and aggregated.
The data are presented on two levels:
1. Indicator level (separately for IOs and Rs) or horizontal comparison:
• Total score per indicator
• Average score per indicator
• Performance (proportion of the potential achievements and real results)
2. Country level (separately for IOs and Rs) or vertical comparison:
• Total score per country
• Average score per country
• Performance per country (proportion of the potential achievements and real results)
The written analysis describes countries’ performance in terms of both FATF technical recommendations
and effectiveness criteria. The analysis helps users to:
• identify weak spots and strong points;
• rank countries according to their technical compliance and effectiveness;
• identify top and low performing countries and understand the reasons behind the scores;
• identify trends.
20BASEL INSTITUTE ON GOVERNANCE
6.2 Analysis of FATF data: 2019 trends
6.2.1 AML/CFT systems remain largely ineffective
Ratings in relation to the FATF's IOs reflect the extent to which a country's measures in AML are effective.
The 11 IOs represent key goals that an effective AML/CFT system should achieve. The annual results
show that countries’ effectiveness within the 11 IOs is low. The average performance ranges between
23% (lowest) and 50% (highest). In contrast, countries’ performance in technical compliance is much
better. The average distribution lies between 50% and 75%. Only two countries listed in the Public Edition
of the Basel AML Index (Botswana and Mauritius) show a performance below 40%.
Six countries stand out with a particularly high performance (above 80%) when it comes to technical
compliance. These are Spain, the United Kingdom, Belgium, Malaysia and Vanuatu. Spain and the United
Kingdom also show a comparatively strong performance in relation to the IOs. The situation of Vanuatu
is an unusual exception: it has one of the highest performances in technical compliance, yet at the same
time demonstrates 0% effectiveness based on the IOs.
6.2.2 Countries are making progress in international cooperation and use of
financial intelligence
Countries demonstrate the best performance in relation to IO2 on international cooperation and
facilitation (50% effectiveness). Altogether, countries achieve an effectiveness of 37% in IO1, which relates
to the overall understanding of the risks of ML/TF and the domestic coordination of efforts to combat
ML/TF. They fare similarly well (also 37%) when it comes to the use of financial intelligence (IO6) and in
relation to the investigation of terrorist finance offences (IO9). In contrast, performance relating to the
prevention of terrorist organisations from raising or moving funds is slightly lower (only 30%).
6.2.3 Countries need to get better at supervising regulatory authorities and
implementing preventive measures
FATF data show that all assessed countries have been facing significant issues when it comes to the
supervision, monitoring and regulation of financial institutions (IO3), with an average performance of only
27%. The situation is even worse for IO4, which relates to preventive measures in ML/TF –countries
average only 24% in this indicator.
6.2.4 Transparency of beneficial ownership remains a sticking point
Analysis of FATF data shows that countries demonstrate their lowest performance in dealing with
beneficial ownership information (IO5), with an average effectiveness score of only 23%. In terms of
technical compliance, the average score for R24 (Transparency and beneficial ownership of legal persons)
is 42%. For R25 (Transparency and beneficial ownership of legal arrangements) it is 44%. Information on
ownership structures is largely unavailable to competent authorities.
6.2.5 Reporting of suspicious transactions is quite effective but not followed by
convictions
FATF data indicate that countries show a good performance in submitting suspicious transaction reports.
Overall effectiveness for this R20 is around 80%. Out of those assessed with the fourth-round
methodology (and included in the Public Edition of the Basel AML Index) only Panama and Botswana
21BASEL INSTITUTE ON GOVERNANCE
demonstrated low effectiveness regarding the reporting of suspicious transactions. However, when it
comes to ML investigations and prosecutions, the performance level is only 23%.
7 Special regional focus – post-Soviet
countries
In 2019, the world saw a significant number of money laundering scandals related to “Russian money”
entering the financial markets of European countries, revealed through investigations by the OCCRP and
other investigative media outlets.
Consequently, the Basel AML Index has introduced a special geographic scope this year to provide an in-
depth look at risks of ML/TF in post-Soviet countries. The Public Edition of the Basel AML Index covers
the following: Armenia, Azerbaijan, Estonia, Georgia, Kazakhstan, Kyrgyzstan, Latvia, Lithuania, Moldova,
Russia, Tajikistan, Ukraine, Uzbekistan.
7.1 Summary
Analysis of ML/TF risks in the post-Soviet region shows that the average risk level is 5.4, with significant
deficiencies associated with corruption and bribery. In general, Central Asian countries (Kazakhstan,
Kyrgyzstan, Uzbekistan, Tajikistan) have a higher risk of ML/TF in comparison to Baltic countries (Latvia,
Lithuania, Estonia). With regards to countries subjected to FATF assessments under the fourth-round
methodology, Kyrgyzstan (27%) and Latvia (30%) demonstrate the lowest performance in terms of
effectiveness, while Armenia has the best rating in both technical compliance and effectiveness.
7.2 Analysis
ML/TF risks across these countries during the last six years have been fairly stable, with an average
risk score of 5.4 for the region (out of 10).
Country 2012 2013 2014 2015 2016 2017 2018 2019
ARMENIA* 5.13 4.9 4.86 4.89 4.63 4.44 5.23 5.11
AZERBAIJAN 6.49 6.48 6.46 4.9 4.84 4.77 5.43 5.31
ESTONIA 3.28 3.31 3.27 3.19 3.82 2.73 2.73 2.68
GEORGIA 5.64 4.8 4.83 4.8 4.71 5.28 5.31 5.20
KAZAKHSTAN 5.12 5.94 5.94 5.93 5.88 6.35 6.36 6.27
KYRGYZSTAN* 6.31 6.36 6.29 6.27 6.21 6.24 6.19 5.86
LATVIA* 5.36 4.93 5.03 4.98 4.91 3.64 3.98 4.89
LITHUANIA* 3.96 3.81 3.64 3.67 3.62 3.67 3.12 3.55
MOLDOVA 5.93 5.06 5.09 5.15 5.24 5.43 5.37 5.29
22BASEL INSTITUTE ON GOVERNANCE
RUSSIA 5.66 5.75 6.29 6.26 6.22 5.7 5.83 5.75
TAJIKISTAN* 8.12 8.27 8.34 7.07 8.19 8.27 8.3 6.28
UKRAINE* 6.62 6.47 6.55 6.56 6.57 6.45 6.06 6.01
UZBEKISTAN 5.42 5.4 5.4 5.11 5.1 5.99 5.83 5.71
Table 14: Basel AML Index risk scores since 2012
*Countries assessed with the fourth-round FATF methodology
Small changes to the Basel AML Index methodology and indicators over the years, including the addition
of a new indicator in 2019, may slightly influence results and comparability. However, it is clear that
Central Asian countries (Kazakhstan, Kyrgyzstan, Uzbekistan, Tajikistan) have a higher risk of ML/TF in
comparison to Baltic countries (Latvia, Lithuania, Estonia).
Almost half of the countries (6 out of 13) were assessed with the FATF fourth-round methodology in the
last few years by the regional FATF bodies. The results of these assessments indicate that these countries
have a medium level of risk related to ML/TF.
Country Effectiveness Technical compliance
Armenia 45% 80%
Kyrgyzstan 27% 54%
Latvia 30% 63%
Lithuania 36% 68%
Tajikistan 36% 60%
Ukraine 36% 69%
Table 15: FATF evaluations according to the fourth-round methodology
Of these, Kyrgyzstan (27%) and Latvia (30%) demonstrate the lowest level of effectiveness. Armenia has
the best performance in both technical compliance and effectiveness.
While risks identified by the FATF data for the region remain medium, more than 60% of the countries in
the region, namely Armenia, Azerbaijan, Georgia, Kazakhstan, the Russian Federation, Tajikistan, Ukraine
and Uzbekistan, are included in the US INCSR list of major money laundering countries. According to the
2019 US INCSR report, for all of these countries the primary sources of illicit proceeds include corruption,
fraud, trafficking in drugs, arms, and organised crime, prostitution, cybercrime and tax evasion. Money is
often laundered through real estate, insurance, financial and non-financial institutions, shell companies
and bulk cash smuggling schemes. Countries in the US INCSR list of major money laundering countries
have produced relatively few criminal convictions pertaining to money laundering, which is a reflection of
broad weaknesses surrounding the rule of law and judicial independence.
Another indicator to assess the quality of the AML/CFT framework of the region is the FSI. Countries
from this region are not present in the FSI’s list of top 25 financial secrecy jurisdictions. Russia holds
position number 29 and Ukraine number 43, while Latvia holds position number 55 out of 112
jurisdictions listed in total. In general, the region is not scored as having a high level of financial secrecy
risks.
23BASEL INSTITUTE ON GOVERNANCE
Existing data on corruption and bribery indicate a high risk level in this area. According to the TI CPI,
Turkmenistan earns the highest risk points in the region, followed by Uzbekistan and Tajikistan. The region
is the second lowest scoring region in the Basel AML Index, ahead of Sub-Saharan Africa18.
The data on financial and public transparency as well as political and legal risks differ heavily across the
region, with Latvia and Lithuania showing the best results and Central Asian countries demonstrating the
lowest performance.
8 Looking ahead
During development of the Basel AML Index 2019, it became clear that the quality of data concerning
financial crimes is still a critical issue to be addressed. The FATF has taken positive steps by increasing
the frequency of FATF updates and harmonising the methodology between different regional bodies. It is
hoped that with a continuously increased frequency of fourth-round evaluations by FATF and its regional
bodies, we can soon achieve full coverage and as such avoid skewed data due to outdated reports. The
impact goes far beyond the Basel AML Index as the reports themselves, and the Basel AML Index, directly
impact on the due diligence systems implemented by financial institutions and investors.
Helping these institutions untangle the data and use it easily and more accurately in their own system is
one of the aims of the recently upgraded FATF analysis provided as part of the Expert Edition Plus
package.
On the other hand, of course, it must be noted that, as illustrated by the latest high-profile ML cases,
even low-risk countries are not entirely immune to money laundering risks or harm resulting from financial
crimes. The resilience of their financial and public institutions is constantly tested by criminals. They need
to stay on the radar for analysis for ML/TF risks.
In this respect, opacity of beneficial ownership remains a key issue across all countries and requires a
coordinated response at the international level. The Basel AML Index is seeking ways to improve data
coverage for risks associated with non-transparent beneficial ownership. The same applies to risks
associated with increasing volumes of international trade. Trade-based money laundering is getting more
and more attention and we are looking at how best to reflect this and possibly other emerging trends in
the 2020 edition of the Basel AML Index.
18https://www.transparency.org/news/feature/weak_checks_and_balances_threaten_anti_corruption_efforts_across_eastern_eu
24You can also read


