Social and Behavioral Health Factors Associated with Violent and Mature Gaming in Early Adolescence - MDPI
←
→
Page content transcription
If your browser does not render page correctly, please read the page content below
International Journal of
           Environmental Research
           and Public Health

Brief Report
Social and Behavioral Health Factors Associated with
Violent and Mature Gaming in Early Adolescence
Linda Charmaraman 1, * , Amanda M. Richer 1 and Megan A. Moreno 2
 1    Wellesley Centers for Women, Wellesley College, Wellesley, MA 02481, USA; aricher@wellesley.edu
 2    Department of Pediatrics, University of Wisconsin-Madison, Madison, WI 53705, USA; Moreno@wisc.edu
 *    Correspondence: lcharmar@wellesley.edu

 Received: 1 June 2020; Accepted: 10 July 2020; Published: 11 July 2020

 Abstract: We examined how risk level of video games, measured by maturity and violence level, was
 associated with behavioral health, social impacts, and online social interactions. School-based surveys
 in two different cohorts assessed self-reported gaming behaviors, health, and social media use.
 For Study 1, our 700 participants were 52% female and 48% White (mean age 12.7). Middle school
 students who played the high-risk games reported higher depressive symptoms and problematic
 internet behaviors, less sleep, more time spent playing games, and higher frequency of checking
 social media than non-gaming students. Those who played high-risk games were less likely to play
 alone and to play with strangers than those who played minimal-risk games. For Study 2, our 772
 participants were 50% female and 57% White (mean age 12.6). Similar to Study 1, we found that those
 who played the high-risk games spent significantly more time playing games, were more interactive
 with other players, and had poorer sleep outcomes than non-high-risk gamers. Additionally, playing
 high-risk games had significantly different social impacts of gaming compared to less-risky gaming,
 including spending more money on games, spending less time on homework and with family or
 skipping meals due to gaming. Mature and violent content of video games and amount of online
 social interaction associated with gaming play a strong role in behavioral health and social impacts
 within families. These results can inform guidelines to intervene when problematic behaviors emerge.

 Keywords: violent gaming; problematic gaming; adolescence; social interactions; behavioral health

1. Introduction
       According to a recent Pew Research Center study [1], 90% of US teens play games of some kind,
such as on a game console, computer, or cell phone. In fact, the majority of adolescents in the U.S. and
other developing countries play video games [2], which, at the low and moderate gaming levels, can
provide social benefits for some adolescents [3], such as coping strategies and fulfilling social needs [4].
At the opposite end, higher gaming levels can result in excessive online gaming for others. With the
inclusion of the Internet Gaming Disorder (IGD) as an “emerging” disorder in the Diagnostic and
Statistical Manual for Mental Disorders 5 [5] and Gaming Disorder in the WHO’s ICD-11 [6], questions
still remain about how to determine positive, non-pathological heavy gaming from problematic gaming
that interferes with one’s daily life [7]. Internet gaming disorder (IGD) is associated with a multitude
of socioemotional issues which can interfere with academic achievement and developing healthy
social interactions [8], including depression, anxiety, self-esteem problems, high antisocial behavior,
aggressive thoughts, lack of empathy, anger control problems, hyperactivity/inattention, and clinically
significant reduction in sleep quality [4,9–13]. Adolescents who have attention problems and are
socially vulnerable (i.e., lack social skills or struggle with social relationships) are at a higher risk
of developing IGD symptoms [4]. Several studies have shown gendered patterns in vulnerability
of developing problematic gaming behaviors [2,4,9]. For instance, boys who are lonely and socially

Int. J. Environ. Res. Public Health 2020, 17, 4996; doi:10.3390/ijerph17144996   www.mdpi.com/journal/ijerph
Int. J. Environ. Res. Public Health 2020, 17, 4996 2 of 20
anxious are significantly more likely to adopt maladaptive gaming behaviors in the absence of positive
online social interactions [7].
As opposed to examining social and behavioral associations with pathological gaming that
would classify an early adolescent as having IGD (APA) or Gaming Disorder (WHO), we are focused
on problematic gaming behaviors that may or may not surpass these suggested clinical thresholds,
turning our attention to a non-clinical, school-based sample ranging from no gaming at all to high
levels. Besides identifying the risk factors that are associated with problematic and engaged but
non-pathological gaming, it is also critical to consider the content of games consumed for vulnerable
populations. According to the Pan European Game Information organization, forty percent of video
games that were present in the 2016 market were deemed inappropriate for tweens and young teens
due to exposure to violence, strong language, blood, and gore. The vast majority of games (89–96%)
that are rated for teens or more mature adult players have been found to be explicitly violent [14,15].
However, there are limitations to relying on commercially-available ratings of violent content [16],
especially when they usually focus on recommendations for teens in general, not tween and early
teen years, when parents are less familiar with how to supervise transitions into more mature gaming
content. Early adolescents have been shown to be particularly vulnerable to the effects of violent content
during this stage of social, emotional, cognitive, and neurological development [17]. By focusing on
only M-rated games, there is a potential for substantially underreporting children’s and young teens’
exposure to age-inappropriate gaming content [16]. Prior studies have utilized various techniques to
classify content of games, such as assessing exposure by checking whether participants ever played
one of four researcher-identified popular games [18], categorizing violent gaming content according
to one externally-derived measure such as the ESRB rating [16], or allowing teens to evaluate their
own exposure to violent gaming content for their favorite games [19]. The current study developed a
protocol to move beyond the entertainment industry-driven ratings and include other criteria beyond
violent content, such as sexual themes, substance use, and language used in chat rooms.
A major concern around problematic gaming behaviors is whether the excessive time spent
displaces real-life social interactions and whether that is necessarily detrimental or simply “engaged”
and for whom [7]. While teen gaming can be a solitary activity, teens often play with friends they know
in person (89%) or met online (54%), or strangers (52%) [20]. A majority of teen gamers (78%) report that
playing interactive online games makes them feel more connected to friends they already know [20].
Online gaming has been shown to provide a key way to maintain existing friendships [21], make new
social connections [22], and expand sources of social support for shy adolescents [23]. Through the
social compensation hypothesis [21], adolescents with difficulty in face-to-face social competence can use
the safety net of online interactions to compensate for their real-life social inadequacies. For instance,
adolescents with IGD have been found to over-rely on gaming to bolster their self-esteem and gain
social acceptance from peers [24]. In contrast, for adolescents who are already successfully navigating
their well-developed social skills, online gaming can extend that social capital [25] in what is known as
the augmentation hypothesis [26]. Not only do the “rich get richer” in this scenario, but the poor get
poorer, in that those who experience anxiety, depression, or low academic achievement can immerse
themselves in gaming as a way to escape from their troubles, which can lead to compulsive online
gaming over time [27].
Prior studies on the social outcomes of problematic gaming in adolescents have primarily focused
on proximal impacts on school achievement, such as being highly associated with a worse grade point
average or gaming-related school truancy [2,28]. Prior research has focused on quantity of gaming
that has detrimental effects on academic achievement, whereas research on the effects of the content
of gaming is often associated with negative affect, such as the relationship between violent gaming
and aggression [19]. Relatively speaking, fewer studies have addressed how problematic gaming
impacts family relations, particularly given the critical socialization role of parents in childhood and
adolescence [29]. In the few studies that exist, problematic gaming was related to lower-quality
family relationships and greater family conflict [30], and poor-quality parent–child relationships canInt. J. Environ. Res. Public Health 2020, 17, 4996 3 of 20
exacerbate the severity of problematic gaming. A recent review revealed that a strong paternal bond
can be protective of problematic gaming [31]. Poorer family functioning has also been associated in
households with problematic gaming, including higher parental anxiety due to the antisocial behavior
and anger management issues of their adolescents with IGD [9,32]. Another issue that arises in
households with problematic gaming behaviors is the larger amounts of spending on free-to-play
games compared to households with non-problematic gamers [33], which may lead to family conflict.
One study found weak relationships between problematic gaming and slightly lower parental closeness
and family conflict, but maintained that gaming frequency and playing with online strangers was
a much stronger predictor of gaming problems than parent–child dynamics [34]. More research is
needed to understand the role of parent–child relationships and the content (not just quantity) of
adolescent gaming.
Prior studies have emphasized quantity of gaming, that is, frequency of gameplay or number
of games played, but few studies have examined social and behavioral health outcomes associated
with playing games with varying levels of violent or age-inappropriate content. Previous research is
more limited in how playing violent and mature games is related to online social interactions and how
gaming affects daily life in the home and school contexts. The purpose of the following two studies
was to understand the association between playing violent or age-inappropriate online games and
early adolescent behavioral health outcomes in two different community cohorts—the first sample was
characterized by having a relatively low to medium gaming risk, whereas the second sample had a
fairly higher risk gaming profile. In Study 1, we hypothesize that gaming risk level will be associated
with problematic internet behaviors and increased social interactions while gaming, particularly with
unknown players. In Study 2, we hypothesize that the higher the risky gaming content, the more
likely participants would experience evidence of social withdrawal. By using two different methods
of determining how often early adolescents are exposed to risky gaming content, we hypothesize
that behavioral outcomes such as sleep or depressive symptoms will be associated with risky gaming
content in both middle school-based samples in nuanced ways depending on how it was measured.
Study 1
2. Materials and Methods
2.1. Data Collection
Study 1 was part of a larger cross-sectional study conducted in the Northeast US examining
early adolescent social media use in the period 2017–2018. The study was named the Learning,
Social Media, and Healthy Behaviors Project. We invited schools within one hour’s drive from our
campus that represented a range of social contexts in terms of school size, urbanicity, race/ethnicity, and
socioeconomic status. Following approval by the Wellesley College IRB Committee and school districts,
principals from a small urban middle school, a large suburban middle school, and an urban afterschool
program provided access to a convenience sampling of their 6th–8th grade students for a 40 min
online survey during a designated period. Parents were informed of the study and the availability
of a sample student survey to review through emails sent by school liaisons. Through a waiver of
consent documentation process approved by our IRB, parents were given the opportunity to opt their
child out of participating in the study. Schools provided laptops to take the voluntary Qualtrics survey
and students provided online assent before taking the survey. On the survey date, each participating
classroom had a researcher proctor the online survey by reading the assent information explaining the
goals, procedures, risks, benefits, and voluntary nature of the study. All students who were present
during the survey administration were provided an embossed pen as an incentive to participate.
Survey takers were also entered into a raffle for gift card incentives. Schools were provided with a
report of aggregated results and an honorarium in appreciation for their participation in the study.Int. J. Environ. Res. Public Health 2020, 17, 4996 4 of 20
2.2. Measures
Sociodemographic variables used as covariates included gender, age, and free/reduced-price
lunch. Age was calculated by subtracting students’ self-report date of birth from the date of survey
administration. Students were able to identify their gender as male (1) female (0) or “Other.”
Students who identified as “Other” were recoded to missing given the extremely small prevalence.
Students indicated whether they received free/reduced-price lunch through yes (1) or no/don’t know
(0) responses.
Gaming risk level was assessed by asking survey participants to indicate all of the online games
that they had ever played from a checklist of multiple games. Prior to data collection, the research
team conducted a scan of the most popular games as of late summer 2017. Since most available
statistics referred to the games that adults aged 18 and over played, we finalized the list of 16 games
based on our pilot study of three early adolescents who test drove the survey and provided feedback
on the relevance and acceptability of the answer choices. Respondents could also fill in additional
games that were not listed. All possible online games that respondents played were evaluated by
undergraduate research assistants to assign a risk level value to each game. Before conducting any
statistical analyses, we conducted this separate recoding process of independently assigning a risk
level to games that were stripped of any identifying data pertaining to who played those games in
our dataset. The Education Software Rating Board (ESRB) rating and Common Sense Media’s ratings
(from polling parents) were taken into account in determining level of risk. Suggested age limits from
Common Sense parents and ESRB were only one measure of our researcher-defined gaming risk levels,
since they each had their own systems for determining what was age appropriate. The ESRB includes
17 content descriptors that are rated E for appropriate for everyone (the most frequently assigned rating
by ESRB), E10+ (for ages 10 and up), Teen (for ages 13+), and Mature (for ages 17+). The descriptors
that we focused on pertained to blood/gore, violence, language, nudity, sexuality, and substances.
We also took into account how users tend to interact with one another while gaming, such as being
exposed to unfiltered and uncensored user-to-user communications via social media. Risk levels were
coded as 0 if the participant indicated being a non-gamer. A risk level of 1 was considered “minimal
risk,” including non-violent, age-appropriate games (e.g., Minecraft, Temple Run) that were often rated
E or E10+. A risk level of 2 was considered “moderate risk,” including borderline age-appropriate
games with some violence (e.g., Fortnite and Terraria) and may contain games rated as Teen for ages
13+. The highest risk level of 3 includes non-age-appropriate games with gory violence (e.g., Grand
Theft Auto and Fallout) and medium to high levels of other mature descriptors such as profanity,
substances, or sexuality. All games rated as Mature fell into this highest risk category. All games were
independently coded by two researchers during the initial open coding phase, and then, during the
secondary phase, all disagreements (2%) were reviewed until consensus. See Appendix A for a coding
scheme for game risk level.
2.2.1. Behavioral Health
Depression symptoms. We used the 4-item Center for Epidemiological Studies Depression Scale for
Children (ages 10–13; CES-DC): “Please check how much you felt this way in the past week:” I was
happy, I felt that friends didn’t want to be with me, I felt sad, It was hard to get started doing things,
etc. This scale has been shown to have a Cronbach’s alpha of 0.583 [35]. We added two additional
items from the CESDR-10 which have been validated on older adolescent samples (aged 13–18): could
not focus on the important things and felt irritable or cranky, with a Cronbach’s alpha of 0.90–0.91
(4-point Likert scale, CESD, [36]). The alpha for the current sample was 0.79.
Sleep duration. Participants were asked on average how many hours of sleep they get on a typical
school night. Responses ranged from 4 h or less to 10 or more hours. Average hours of sleep for
participants was 8 h.
Recreational computer use. Participants reported how many hours they use the computer (or other
screen device) for doing something other than school work. Responses were reported on a 7-pointInt. J. Environ. Res. Public Health 2020, 17, 4996 5 of 20
scale ranging from “none” to “5 or more hours per day”. On average, participants reported using the
computer for 1–2 h per day.
Problematic internet behaviors. Using the 3-item Problematic and Risky internet Use Screening Scale
(PRIUSS) [37], participants reported how often they lose motivation to do other things because of the
internet, feel nervous or anxious when not online, or become moody or depressed when not online
using on a 5-point scale of “never” to “very often” (alpha = 0.70). The average problematic internet
behaviors for the sample was 1.78 (SD = 0.70), which is between “never” and “rarely”.
Online gaming frequency. Students reported how often they played online games on a typical
school day. Responses were reported on a 5-point scale ranging from “I don’t play online games”
(lowest value) to “3 or more hours” (highest value). The average online games play time for the full
sample was 2.39 (SD = 1.27), which was equivalent to an average of up to 60 min play on a typical
school day.
2.2.2. Online Social Interactions
Online gaming interactions. Participants who indicated that they played online games were asked
whether they (a) usually play alone or against no one (54%) or (b) play with strangers (i.e., “I have no
idea who I play with online”; 23%).
Social media frequency. Frequency of checking social media on a typical school week was measured
on a 7-point scale ranging from “never” (lowest value) to “more than every hour” (highest value). The
average social media checking frequency for the full sample is 2.48 (SD = 1.48), suggesting that the
average participant checks social media between every few days to once a day.
Refer to Appendix A for a list of self-created measures.
2.3. Data Analysis
All analyses were conducted in SPSS version 25 (IBM SPSS Statsistics for Windows, Armonk,
NY, USA). For the power analyses to estimate the sample size, we used p = 0.05 and power = 0.80 as
target values. For a sample size of at least 700, for linear regression models estimating associations,
we estimated that individual regression parameters as low as 0.17 would be significant for the
models. For each regression model, the predictor was level of gaming risk. Participant gender, age,
and free/reduced-price lunch status were the control variables. Outcomes included two overarching
categories: (a) behavioral health (i.e., depressive symptoms, hours of sleep, time spent on the computer,
problematic internet behaviors, and (b) online social interactions (i.e., frequency of online game
play, playing games alone, playing games with strangers, and frequency of checking social media).
Regression analyses were used to investigate associations of gaming risk on behavioral health and
online social interactions, which included transforming a categorical variable into an ordinal value
into the linear regression [38]. Each participant was assigned a value associated with the game they
have ever played with the highest gaming risk. For example, if a student reported playing Minecraft
and Mortal Kombat, they were assigned a 3. Dummy variables for each level of gaming risk were used
in the model with “no gaming risk” or “non-gamers” as the reference category. Adolescent gender,
age, and free/reduced-price lunch (proxy for socioeconomic status) were used as control variables.
Previous studies have found that individual-level and community-level factors such as gender [39],
age [40], and socioeconomic status [41] are highly associated with how problematic gaming or digital
media use influences wellbeing. All available data for each outcome were used in the regression
models. For modeling frequency of online game play and who gamer plays with, only those who
reported playing online games were included (i.e., non-gamers were automatically skipped out of
answering these game-based questions through Qualtrics) and the “minimal risk” group was used as
the comparison category.Int. J. Environ. Res. Public Health 2020, 17, 4996 6 of 20
3. Results
Seven hundred student surveys were collected. All surveys were used for analysis, but some
surveys had missing data for the outcomes, resulting in a range of sample sizes from n = 381 to 609.
With a response rate ranging from 88 to 92% from each site, participants were ethnically/racially diverse
(52% female, 48% White, 16% Asian, 14% Black, 11% Latino, 11% Biracial/Other) early adolescents with
a mean age of 12.7 (range = 11–16). A total of 32% were in grade 6, 30% in grade 7, and 38% in grade 8.
A total of 77% reported that they received mostly As or As and Bs in the past year. Twenty-six percent
were eligible for free or reduced-priced school lunch programs. In the following section, we will
identify participants by their highest game risk level, such that middle school students who did not play
any games will be called “non-gamers” (31%), students who only played games that had a minimal
risk rating of “1” will be called “minimal-risk gamers” (17%). Middle school students who had ever
played a game with a “2” rating will be called “moderate-risk gamers” (18%), and those who had ever
played a level “3” game will be called “high-risk-gamers” (33%) (see Table 1). A total of 9% of players
reported gaming for 3 h or more on a typical school night.
Table 1. Study 1: Sample Descriptives.
Variable N Percent
Gender
Female 364 52.0
Male 331 47.3
Other 5 0.7
Race
White 328 47.7
Asian 110 16.0
Black 97 14.1
Latino 77 11.2
Biracial/Other 75 10.9
Grade
6th 223 31.9
7th 214 30.6
8th 263 37.6
Grades in school
Mostly As 288 42.3
Mostly As and Bs 237 34.8
Mostly Bs 51 7.5
Mostly Bs and Cs 73 10.7
Mostly Cs 22 3.2
Mostly Ds or Fs 10 1.5
Free/reduced-price lunch 109 25.8
Gaming risk
Non-gamers 212 31.3
Minimal risk 118 17.4
Moderate risk 122 18
High risk 226 33.3
Frequency of game play
Less than 30 min/day 199 43.0
30–60 min 125 27.0
1–2 h 78 16.8
3 h+ 61 13.2
Plays games alone 250 53.6
Plays games with strangers 157 33.7
12.70
Age 699
(1.00)
Depressive symptoms 475 1.69 (0.61)
Hours of sleep 457 8.06 (1.22)
Computer time 428 1.78 (0.74)
Problematic internet use 688 1.78 (0.70)
Frequency of checking social media 672 3.20 (2.41)Int. J. Environ. Res. Public Health 2020, 17, 4996 7 of 20
Gaming Risk
Moderate-risk gamers reported higher problematic internet behaviors than participants who
did not play games. Moderate-risk gamers were more likely to play online games with others than
minimal-risk gamers. High-risk gamers reported higher depressive symptoms and problematic internet
behaviors, less sleep and higher frequency of checking social media than non-gamers. High-risk gamers
also spent more time playing games, were less likely to play alone, and more likely to play with
unknown players than minimal-risk gamers (see Table 2).
Table 2. Study 1: Gaming Risk on Adolescent Behavioral Health and Online Social Interactions.
Behavioral Health
Frequency
Predictor Plays Games
Depressive Hours of Computer Problematic Freq of Game Plays Games of Checking
With
Symptoms Sleep Time Internet Use Play Alone Social
Strangers
Media
B (SE) B (SE) B (SE) B (SE) B (SE) B (SE) B (SE) B (SE)
Min Risk 0.10 (0.08) 0.10 (0.17) 0.05 (0.11) 0.14 (0.08) – – – −0.19 (0.27)
Mod
0.02 (0.09) −0.05 (0.17) 0.16 (0.11) 0.18 (0.08) * 0.20 (0.14) −0.61 (0.30) * 0.65 (0.35) 0.07 (0.27)
Risk
High
0.18 (0.08) * −0.34 (0.16) * 0.13 (0.10) 0.30 (0.08) *** 0.42 (0.13) ** −1.14 (0.29) *** 0.75 (0.33) * 0.99 (0.24) ***
Risk
Female 0.14 (0.06) * −0.19 (0.13) −0.09 (0.08) 0.13 (0.06) * −0.51 (0.11) *** 0.26 (0.22) −1.23 (0.25) *** 1.01 (0.20) ***
Age 0.05 (0.03) −0.25 (0.06) *** 0.12 (0.04) ** 0.04 (0.03) 0.04 (0.05) −0.08 (0.10) 0.16 (0.11) 0.79 (0.09) ***
Free
0.04 (0.09) −0.45 (0.19) * 0.07 (0.12) 0.06 (0.08) 0.50 (0.13) *** −0.56 (0.28) * 0.03 (0.29) 0.66 (0.24) **
lunch
R2 0.03 0.10 0.05 0.03 0.16 0.11 0.16 0.20
Note: Non-gamers was the comparison category used for non-gaming-related outcomes. Minimal risk was the
comparison category for gaming-related outcomes. * p < 0.05, ** p < 0.01, and *** p < 0.001.
4. Discussion
These results demonstrate that for early adolescents who play mainly minimally risky games,
there was some risk of problematic internet behaviors but no other behavioral health and online social
withdrawal. Moderate-risk and high-risk gamers were significantly more likely to play with strangers.
Prior research suggests that playing with strangers increases the likelihood of having IGD [34]. It was
only when compared to non-gamers that the high-risk gaming level was associated with more physical
and mental health difficulties, such as less sleep and more depressive symptoms. Scholars have
demonstrated that internet use is often used as a form of mood regulation, such as relieving feelings of
boredom, loneliness, depression, or providing an escape option [42]. LaRose and colleagues [43] further
suggest that using the internet to relieve feelings of depression can lead to deficient self-regulation,
which may explain the sleep outcomes in the current study. Interestingly, high-risk gamers showed
a greater likelihood of increased online social media interactions. Currently, there are many online
games that offer ample opportunities for interactions with peers through text messaging or voice chat,
which facilitates strategizing during a game, thereby fostering online friendships and moving toward
mutually defined gaming goals [44]. As we demonstrated in the current study, the high-risk gamers
were connected to their social media friends even beyond the gaming environment [25].
A limitation of this study was the identification of gaming risk level using the criteria of ever
having tried the game, which does not account for frequency or recency of having played any particular
game. Future research should measure gaming content risk level by most frequently and/or most
recently played games. Future studies should replicate our findings with a more current sample,
given the evolution of gaming culture. For instance, during the data collection of the current study,
the widely popular game Fortnite debuted in fall 2017, a phenomenon that may have had a social
impact in adolescent gaming culture.Int. J. Environ. Res. Public Health 2020, 17, 4996 8 of 20
Study 2
5. Materials and Methods
5.1. Data Collection
Using a different school-based sample in the Northeast US than Study 1, we recruited 1 large
suburban middle school and 3 urban afterschool programs to participate in a study of digital media
use, including social media, YouTube, and gaming in the period 2018–2019. Similarly to Study 1, school
and site selection was based on racial/ethnic composition, urbanicity, and socioeconomic diversity.
The study was named Adolescent Social Media Use, Health, and Parental Monitoring. After obtaining
IRB approvals from our institution and school districts to conduct the convenience sampling study
of 6th–8th grade students using a waiver of consent documentation, we distributed parent informed
consent/opt-out forms in English, Spanish, and Portuguese through parent email listservs and school
enewsletters. The middle school provided Chromebooks during a pre-scheduled advisory period
to take the 40 min survey. The afterschool programs provided Chromebooks during scheduled
break times. Since survey links were emailed to students, those who were absent during survey
administration were still able to participate in the study from home. Raffle prizes to a select few and
embossed pens were given to every student during survey administration. Schools were also given an
aggregated report of findings and an honorarium for participating in the study.
5.2. Measures
Sociodemographic variables included gender, age, and free/reduced-price lunch, similar to Study 1.
Gaming risk level. We updated the gaming risk categories to include the new games students
reported playing that were not already identified in Study 1. Categories were created using the same
industry standard metrics in Study 1 above. To maximize validity of responses, in Study 2, we asked
respondents to report only the top three games that they play most frequently in order to determine
their gaming risk level. This improves on the lack of specificity in Study 1 to include only the three
most frequently played rather than a lengthy checklist of having ever having played a game.
5.2.1. Behavioral Health
Sleep duration. Participants were asked on average how many hours of sleep they get on a typical
school night. Responses ranged from 4 h or less to 10 or more hours. On average, participants reported
getting approximately 7.5 h of sleep on a typical night.
Bedtime. Participants were asked by what time they fell asleep on a typical school night,
with responses ranging from 9pm or earlier to 2am or later. Participants were, on average, getting to
bed at approximately 10pm.
Depressive symptoms. Symptoms of depression were assessed using the Center for Epidemiologic
Studies Depression Scale Revised (CESD-10), a 10-item Likert scale [45] that measures how often
participants felt depressive symptoms in the past week. Response choices were “not at all or less
than 1 day”, “1–2 days”, “3–4 days”, or “5–7 days”. A score of 10 or higher indicates the presence
of significant depressive symptoms. A total of 19% of the sample would be considered depressed
according to this cutoff score.
5.2.2. Online Social Interactions
Online gaming frequency. Participants reported how often they play online games on a typical
school day. Responses were reported on a 5-point scale ranging from “I don’t play online games”
(lowest value) to “8 or more hours” (highest value). The average online games play time for the full
sample is 2.38 (SD = 2.34), which is equivalent to approximately 2 h of play on a typical school day.Int. J. Environ. Res. Public Health 2020, 17, 4996 9 of 20
Online gaming interactions. Participants were asked a single-item measure of how often they
interact with other players or chat while gaming. Response options were on a 5-point scale from never
to always. A total of 46% reported they often or always interact with other players while gaming.
Money spent on monthly gaming. Participants were asked how much they spent on games that they
played in a typical month, including on accessories and Vbucks. Amounts ranged from $0 to $100 or
more. On average, 61% spent nothing in a typical month, 19% spent up to $10, 11% spent up to $25, 5%
spent up to $50, 1% spent up to $100, and 3% spent over $100/month.
Social withdrawal due to gaming. On a 5-point scale ranging from 1 (never), 2 (once or twice),
3 (3–6 times), and 4 (more than 6 times), participants were instructed to indicate whether they had
done the following in the past two weeks due to their gaming: (a) spent less time on homework or
class projects (43%), (b) spent less time with family (42%), (c) skipped a meal (14%), (d) missed a sports
or afterschool activity (6%), or (e) missed or was late to school (6%).
5.3. Data Analysis
Similar to Study 1, after data collection, we then recoded the gaming risk levels in a separate
procedure conducted by undergraduate research assistants who were blinded to which study
participants played which games. For each regression model, the predictor was level of gaming risk.
Participant gender, age, and free/reduced-price lunch status were the control variables. Outcomes were
under two categories: (a) behavioral health (i.e., depression symptoms, hours of sleep, and bedtime),
and (b) online social interactions (i.e., frequency of online game play, interacting with other players while
gaming, money spent while playing online games, social withdrawal due to gaming). Linear regressions
were used to assess associations between gaming risk and behavioral health and social interactions
outcomes. The “non-gamers” group was used as the reference category for non-gaming-related
outcomes (i.e., hours of sleep and bedtime) and the “minimal risk” was the reference category for
the gaming-related outcomes (e.g., who gamers play with). All models were conducted using SPSS
and all data available were used to model outcomes. Sample sizes ranged from (N = 625–665) for the
analysis models.
6. Results
Surveys were collected from 799 participants. Fifteen student surveys were removed since they
only gave assent, one respondent did not agree to take the survey, and 11 were duplicates. Participants
in the analysis sample were 772 ethnically/racially diverse (50% female, 57% White, 18% Latino, 12%
Black, 5% Asian, and 8% Biracial/other) early adolescents with a mean age of 12.6 (range = 11–15 years).
A total of 33% of the sample were in grade 6, 35% in grade 7, and 32% in grade 8. A total of 24%
reported being eligible for free or reduced-price school lunch programs. A total of 74% reported
receiving mostly As or As and Bs in the past year. This sample had 5% non-gamers, 24% minimal-risk
gamers, 33% moderate-risk gamers, and 38% high-risk gamers. A total of 35% of the sample reported
playing games on average three or more hours on a typical school night. A total of 9% of gamers spent
$50–100+ per month on in-game purchases (see Table 3). Compared to the Study 1 sample, Study 2
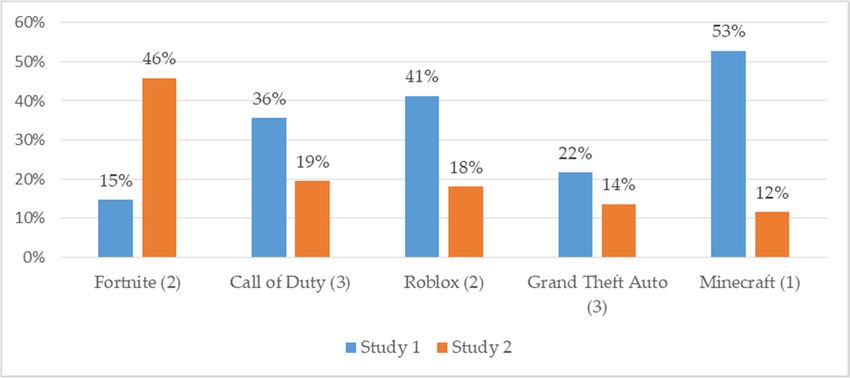
comprised of more gamers overall and more high-risk gamers. Figure 1 illustrates the top 5 games
played by participants in Study 1 and Study 2.Int. J. Environ. Res. Public Health 2020, 17, 4996 10 of 20
Table 3. Study 2: Sample Descriptives.
Variable N Percent
Gender
Female 384 49.7
Male 379 49.1
Other 9 1.2
Race
White 414 56.6
Asian 38 5.2
Black 86 11.8
Latino 134 18.3
Biracial/Other 59 8.0
Grade
6th 250 32.5
7th 273 35.3
8th 248 32.2
Grades in school
Mostly As 272 35.5
Mostly As and Bs 293 38.3
Mostly Bs 67 8.7
Mostly Bs and Cs 91 11.9
Mostly Cs 25 3.3
Mostly Ds or Fs 18 2.3
Free/reduced-price lunch 178 23.5
Frequency of game play
Less than 60 min 215 36.1
2h 127 21.3
3h 92 15.5
4+ hours 161 27.1
Money spent
$0 422 61.1
Up to $10 127 18.4
Up to $25 79 11.4
Up to $50 35 5.1
Up to $100 8 1.2
$100 or more 20 2.9
Bedtime
9pm or earlier 196 29.4
10pm 267 40.0
11pm 140 21.0
12am 40 6.0
1am or later 24 3.6
Gaming risk
Non-gamers 40 5.4
Minimal risk 176 23.9
Moderate risk 240 32.7
High risk 279 38.0
Age 772 12.57 (0.96)
Depressive symptoms 649 6.28 (4.98)
Hours of sleep 673 7.51 (1.38)
Interacts with other players 693 3.06 (1.46)
Spend less time on HW 687 1.56 (0.76)
Spend less time with family 681 1.60 (0.85)
Skipped a meal 677 1.21 (0.60)
Missed sports or afterschool activity 678 1.09 (0.41)Int. J. Environ. Res. Public Health 2020, 17, 4996 11 of 20
Int. J. Environ. Res. Public Health 2020, 17, x 11 of 21
Figure 1. Top 5 most popular games played (risk level).
Gaming
Gaming Risk
Risk
There wasnono
There was significant
significant association
association foundfound
betweenbetween depression
depression and risk
and gaming gaming
level.risk level.
High-risk
High-risk gamers reported fewer hours of sleep per night and a later bedtime than
gamers reported fewer hours of sleep per night and a later bedtime than non-gamers (see Table 4).non-gamers
(see Table 4).
Moderate- andModerate- and high-risk
high-risk gamers gamers report
report spending spending
more time more
playing timegames,
online playing online games,
interacting more
interacting more
while playing, while
and playing,
spending andmoney
more spending more
while money
gaming while
than gaming than
minimal-risk minimal-risk
gamers. gamers.
Moderate- and
Moderate- and high-risk gamers more frequently reported spending less time on
high-risk gamers more frequently reported spending less time on homework and less time with homework and
less time
family with
than family thangamers.
minimal-risk minimal-risk gamers.
High-risk gamersHigh-risk gamers
also more also more
frequently frequently
reported skipping reported
meals.
skipping
There was meals. There was between
no association no association
risky between risky gaming
gaming level levelmissed
and having and having missed
sports sports or
or afterschool
afterschool
activity. activity.
Table 4. Study
Table 4. Study 2: Gaming Risk
2: Gaming Risk on
on Adolescent
Adolescent Health
Health and
and Online
Online Social
Social Interactions.
Interactions.
Behavioral Health Online Social Interactions
Behavioral Health Online Social Interactions Missed
Spend Less
Depression Hours of Freq of Interact with Spend Less Spend Skipped A Sports or
Missed
Bedtime Money Spent Time with
Symptoms Sleep Game Play Interact
Other Players TimeSpend
on HW
Family
Meal After-school
Freq of Less Sports
Activity
Depression Hours with Money Less Skipped
B (SE) B (SE) Bedtime B (SE)Game
B (SE) B (SE) B (SE) B (SE) B Time
(SE) B (SE) or(SE)
B After-
Min Symptoms of Sleep Other Spent Time A Meal
−1.25 (0.89) −0.03 (0.25) 0.15 (0.18) – Play – – – with
– – school
–
Risk Players on HW
Mod Family Activity
0.79 (0.89) −0.08 (0.25) 0.28 (0.19) 1.06 (0.24) *** 1.05 (0.13) *** 0.37 (0.12) ** 0.23 (0.08) ** 0.19 (0.09) * 0.11 (0.06) 0.04 (0.04)
Risk
High B (SE) B (SE) B (SE) B (SE) B (SE) B (SE) B (SE) B (SE) B (SE) B (SE)
1.04 (0.92) −0.61 (0.26) * 0.51 (0.19) ** 1.87 (0.27) *** 1.43 (0.15) *** 0.88 (0.13) *** 0.36 (0.09) *** 0.42 (0.10) *** 0.22 (0.07) ** 0.08 (0.05)
Risk
Min −0.03 0.15
Female 3.17−1.25
(0.48) (0.89)
*** −0.66 (0.13) *** 0.37 (0.10) *** −0.34 (0.21)-- −0.75 (0.11) ***
-- −0.40 (0.10)--*** --
0.00 (0.07) --
−0.01 (0.08) --
0.06 (0.06) --
−0.01 (0.04)
Risk
Age −0.26 (0.20) (0.25)
−0.30 (0.06) (0.18)
*** 0.24 (0.04) *** −0.11 (0.09) −0.07 (0.05) −0.07 (0.04) −0.03 (0.03) −0.05 (0.03) −0.03 (0.02) −0.02 (0.02)
Free 1.05
1.42 (0.46) ** −0.22 (0.13) −0.22 (0.11) −0.07 (0.10) −0.03 (0.08)
Mod
lunch −0.08 0.12 (0.09) 0.28 0.00 (0.21)
1.06 (0.24) *
0.37 0.09 (0.07)
0.23 0.19 0.06 (0.06)
0.11 0.10 (0.04)
0.04**
R2 0.79
0.09 (0.89) 0.10 0.08 0.14 0.33 (0.13) 0.18 0.04 0.04 0.02 0.02
Risk (0.25) (0.19) *** (0.12) ** (0.08) ** (0.09) * (0.06) (0.04)
***
Note: Non-gamers was the comparison category used for non-gaming-related outcomes. Minimal risk gaming was
the comparison category for gaming-related outcomes. * p1.43
< 0.05, ** p0.88< 0.01, and 0.36 0.42
*** p < 0.001.
High −0.61 0.51 1.87 (0.27) 0.22 0.08
1.04 (0.92) (0.15) (0.13) (0.09) (0.10)
Risk (0.26) * (0.19) ** *** (0.07) ** (0.05)
*** *** *** ***
7. Discussion −0.66 −0.75 −0.40
3.17 (0.48) 0.37 −0.34 0.00 −0.01 0.06 −0.01
Female (0.13) (0.11) (0.10)
*** (0.10) *** (0.21) (0.07) (0.08) (0.06) (0.04)
Moving beyond associations *** between health, *** wellbeing, *** and frequency of gaming behaviors,
Study 2 explored the everyday −0.30 social consequences of online gaming, that is,−0.05
the extent to which the
0.24 −0.11 −0.07 −0.07 −0.03 −0.03 −0.02
Age −0.26 (0.20) (0.06)
content of gaming interfered ***
with
(0.04) daily
*** adolescent
(0.09) life,
(0.05) particularly
(0.04) social
(0.03) withdrawal.
(0.03) Compared
(0.02) (0.02)to
the lowest-risk gamers,
Free −0.22 the moderate-
0.12 and high-risk −0.22 gamers −0.07 experienced
0.09 similar
−0.03 levels
0.06 of online 0.10
1.42 (0.46) ** 0.00 (0.21)
lunch interactions, gaming
social (0.13) frequency,(0.09) and gaming (0.11)spending
* (0.10) habits. (0.07) More (0.08)
research (0.06)
is needed(0.04) ** to
R2 0.09 0.10 0.08 0.14 0.33 0.18 0.04 0.04 0.02 0.02
understand parents’ role in allowing in-game purchasing or whether vulnerable users are being
Note: Non-gamers
financially was the comparison
and psychologically exploitedcategory used for industry.
by the gaming non-gaming-related
Althoughoutcomes.
our studyMinimal risk 39%
found that
gaming was the comparison category for gaming-related outcomes. * p < 0.05, ** p < 0.01,
of early adolescent gamers spend some money on gaming accessories and Vbucks, with 4% spending and *** p<
0.001.
approximately $100 and up per month, little is known about whether early adolescents are aware of
7. DiscussionInt. J. Environ. Res. Public Health 2020, 17, 4996 12 of 20
how online microtransaction tactics that games use to pressure them into “limited time” purchases [46].
More research on gaming spending habits may help families flag the types of gaming content that are
associated with higher spending tendencies, which may be a potential concern for families.
Moderate- and high-risk gamers had more educational and family-related withdrawal, whereas
the highest-risk gamers also experienced consequences related to self-care (sleep duration, bedtime,
and skipping meals), signaling a tendency to more problematic gaming behaviors. Interestingly, risky
gaming content was not associated with withdrawing from one’s extracurricular activities, but rather
affected educational and family interactions mainly. This may be due to the desire to maintain social
connections with peers both online and offline. Given prior research indication that improving family
cohesion during therapy helped to treat problematic gaming [47], paying attention to the socializing
environment [48], such as family mealtimes and other opportunities to spend time together could
help mitigate potentially problematic gaming habits. Playing high-risk games was associated with
foregoing family and self-care activities, which raises the question of whether the online gaming is
simply preferred over those other activities or whether the social interactions from gaming fulfill their
social needs in ways that in-person activities do not. A preference for online social interactions (POSI)
may be one reason why frequent gamers are often the most socially interactive compared to infrequent
gamers [49]. Another explanation could be the heightened sense of online social support that is received
during collaborative gaming context, particularly in violent gaming contexts. Prior research on the
effects of violent gaming on physiological arousal has demonstrated that active online interactions
during violent gaming tasks significantly reduces the mental and physical load on players compared
to those playing solo [50].
8. Conclusions
We explored the social and behavioral risk factors of age-inappropriate gaming in two samples in
the Northeast US using slightly different methodologies that captured the rapidly evolving gaming
ecologies of that time. We redefined risk level of game playing according to frequency of use (rather
than ever having played a risky game in Study 1), conducting a similar analysis while adding additional
constructs related to social withdrawal impacts of problematic gaming. Study 1 was a sample conducted
in the period 2017–2018 around wherein one-third of the sample were non-gamers, only 9% reported
gaming over 3 h/week night, and the massively popular game Fortnite (coded as a Medium-Risk game
in our studies) had just debuted in the fall of that year (15% reported playing Fortnite). The sample
for Study 2 had similar demographic characteristics conducted in different school settings, but only
5% reported being non-gamers, over one-third (35%) reported gaming over 3 h/week night, and by
this time in the period 2018–2019, almost half of the gaming sample (46%) reported Fortnite as one of
the top three most frequent games that they played (a three-fold increase since Study 1). Despite the
differences in the sample characteristics, we demonstrated that many early adolescents who are playing
online games that are meant for mature audiences, such as medium risk (e.g., Fortnite) and high-risk
(e.g., Call of Duty) games, are more likely to experience symptoms of addictive behaviors and have
problems with mental wellbeing. For instance, those playing the riskiest games tend to get fewer
hours of sleep, a deprivation that can result in problems with attention, memory, decision making,
reaction time, and creativity, all of which are important to achieving in school. A higher amount of
screen-based activities, including gaming, has been associated with more problems falling asleep and
shorter weekday duration [51]. Prior research has also demonstrated that the existence of computers,
TVs, and gaming consoles in a child’s bedroom doubles the amount of time they play each week and
the likelihood of playing mature games [51]. This finding suggests that parents can make a difference
in the potential negative impacts of gaming by restricting the timing and location of gaming at bedtime.
Not only are parents a primary socializer for adolescents, they are usually the first ones to be
able to notice a persistent change in behavior or mood due to gaming, and possibly identify in what
ways gaming has affected their child’s social and family life. For instance, parents might first suspect a
problem when adolescents aren’t sleeping regularly with the introduction of a new game, are havingInt. J. Environ. Res. Public Health 2020, 17, 4996 13 of 20
trouble completing their homework or school projects, are losing their appetite and missing meals.
This first-hand observation is critical when parents decide to turn to pediatricians, educators, and
counselors for advice on whether the problem is a passing phase or whether it is something to intervene
before it progresses too far.
Due to the cross-section designs of both studies, we cannot determine the direction of influence
in the associations between gaming, behavioral health, and online social interactions. Although our
analysis plans were not pre-registered, as is recommended to prevent false positive findings [52],
we have provided detailed procedures for both of the exploratory studies presented in this article.
One of the strengths of reporting on multiple studies is the opportunity to present analyses that build
off of one another. For instance, Study 1 focused on social interactions and Study 2 focused on social
withdrawal behaviors due to gaming. Additionally, we presented all findings within the behavioral
health (e.g., sleep and depression) and gaming-related social interactions or withdrawal constructs
in our dataset and used the exact same covariates for both studies. Another limitation to note is the
self-reporting nature of the sleep and behavioral health outcomes that may be subject to mono-informant
bias [51]. Due to the listwise deletion of all cases with missing data on variables of interest, estimates
may be less efficient due to resulting loss of information [53]. However, our response rates of over 80%
support external validity of our data. Potential confounders in interpreting the relationship between
gaming risk and behavioral health include the media context within the household, (e.g., presence of
smartphones in the bedroom), parental monitoring style, and family structure, (e.g., having an older
sibling who may introduce more mature games to siblings at younger ages). Future research can build on
these findings to advance our understanding of any causal relationships as well as which subgroups are
more vulnerable when playing the higher-risk games. Since mature or age-inappropriate games can be
associated with relatively mild problems to deleterious outcomes that are considered more severe, using
a continuum approach rather than a categorical approach may be more practically useful to evaluate
how and when to intervene to prevent exacerbating the dilemma [54]. As research continues to examine
both adaptive and maladaptive gaming through measuring levels of distress or clinical diagnoses, it is
also important to discuss the age appropriateness and maturity level of the gaming content consumed
when advising patients and students in clinical, educational, and therapeutic practices.
Author Contributions: Conceptualization, L.C. and M.A.M.; methodology, L.C. and A.M.R.; software,
A.M.R.; validation, A.M.R.; formal analysis, A.M.R.; investigation, L.C.; resources, L.C.; data curation, L.C.;
writing—original draft preparation, L.C. and A.M.R.; writing—review and editing, L.C., A.M.R., and M.A.M.;
visualization, A.M.R. and L.C.; project administration, L.C.; funding acquisition, L.C. and M.A.M. All authors
have read and agreed to the published version of the manuscript.
Funding: Study 1 was funded by Children and Screens: Institute of Digital Media and Child Development
awarded to the L.C. and M.A.M. Study 2 was funded by a grant (R15HD094281–01 to L.C.) awarded by the
National Institutes of Child Health and Human Development (NICHD).
Acknowledgments: Additional resources were provided by the Wellesley Centers for Women Dissemination
Fund and the Wellesley College Sophomore Early Research Program. Study 1 findings were presented as a poster
at the American Psychological Association meeting, Chicago, IL, August 2019. An overview of both Study 1 and 2
will be presented as a panel discussion at the upcoming annual meeting of the American Academy of Child &
Adolescent Psychiatry October 2020. We wish to thank Sabina Unni, Stephanie Cobas, and Cynthia Serrano Najera
for their contributions in coding the gaming risk levels, Ineke Ceder for Study 1 data collection coordination,
Alyssa Gramajo for Study 2 data collection coordination and manuscript copyediting, and Alicia Doyle Lynch for
methodological consultation.
Conflicts of Interest: The authors declare no conflict of interest. The funders had no role in the design of the
study; in the collection, analyses, or interpretation of data; in the writing of the manuscript, or in the decision to
publish the results.Int. J. Environ. Res. Public Health 2020, 17, 4996 14 of 20
Appendix A
Table A1. Games Played by Participants in Study 1 and 2, Percent Played, and Risk Levels.
% % Minimum Age Violence Substance Language ESRB Rating (E, Risk Level
Game Sex (/5)
Study 1 Study 2 (Common Sense) (/5) Use (/5) (/5) E 10+, T, M, A) (/3)
Angry Birds 37.3 0.5 7+ 2 0 0 0 E 1
Assassin’s Creed – 2.0 18+ 4 0 0 4 M 3
Battlefield – 2.0 18+ 5 0 0 3 M 3
Call of Duty 35.6 19.5 18+ 5 0 0 3 T/M 3
Candy Crush Saga – 4.5 13+ 0 0 0 0 – 1
Fallout 14.0 1.4 16–18+ 3 to 5 3 to 4 4 4 M 3
Flow Free 13.6 2.2 8+ 0 0 0 0 – 1
Fortnite 14.6 45.9 13+ 3 0 0 1 T 2
Forza – 1.6 10–13+ 2 0 0-2 3 E / E 10+ 2
Geometry Dash – 3.8 8+ 1 0 0 0 – 1
Grand Theft Auto 21.6 13.5 18+ 5 5 5 5 M 3
Happy Glass – 3.0 8+ 0 0 0 0 12+ 1
Helix Jump – 13.4 9+ 0 0 0 0 1
Homescapes – 1.5 7+ 0 0 0 0 4+ 1
Just Dance 34.7 7.3 11+ 0 3 3 1 E / E 10+ 1
Lego Dimensions 4.7 0.5 10+ 2 0 0 1 E 10+ 1
Lovers in a
Dangerous – 0.1 12+ 1 0 0 0 2
Spacetime
Medal of Honor 3.0 0.1 18+ 4 0 0 5 M 3
Minecraft 52.8 11.5 8–10+ 2 0 0 0 E 10+ 1
Mortal Kombat 19.3 3.1 18+ 5 0 3 4 M 3
NHL/NBA/Madden
– 14.2 8+ to 11+ 1–3 0 0 0 E 1
NFL/Wii Sports
Overwatch – 4.9 13+ 3 1 2 0 T 2
Pokémon – 3.0 7+ 2 0 1 0 E / E 10+ 2
Portal 10.2 0.4 12+ 3 0 0 0 T 2
Rainbow Six: Siege – 7.7 18+ 4 0 0 4 M 3
Red Dead
– 2.3 18+ 5 5 5 5 M 3
Redemption
Roblox 41.3 18.0 10+ 4 0 0 1 E 10+ 2
Rolling Sky 32.6 7.0 8+ 0 0 0 0 – 1
Subway Surfers – 12.2 9+ 2 0 0 0 – 1
Super Smash
– 4.5 7–12+ 0 to 2 0 0 to 1 0 E / E 10+ 1
Brothers Ultimate
Temple Run 48.7 4.9 9+ 3 0 0 0 – 1
Terraria 8.5 0.4 11+ 3 1 0 1 T 2
Zoo Tycoon 3.0 0.0 10+ 0 0 0 0 E 1
Note: We began with 16 most popular games that teens played for Study 1. We added the missing games that were
popular in Study 1 as “write-in” games in Study 2, which increased the list to 33.
Appendix B. Measures for Study 1 and Study 2
Gender
Are you . . . ? Male Female Other (male transgender, female transgender, non-binary)
Age
What is your birth month and day?
What year were you born?
Free or reduced-price lunch
Do you get free or reduced price lunch at your school?
Yes No Don’t know
Depression symptoms (see Houghton et al., 2006; Haroz, Ybarra, & Eaton, 2014 for Study 1; see
Björgvinsson et al., 2013 for Study 2)Int. J. Environ. Res. Public Health 2020, 17, 4996 15 of 20
Sleep Duration
On an average school night, how many hours of sleep do you get?
# 4 or less hours #8h
#5h #9h
#6h # 10 or more hours
#7h
Bedtime (Study 2 only)
By what time do you usually fall asleep on a typical school night?
# 9pm or earlier
# 10pm
# 11pm
# 12am
# 1am or later
Recreational Computer Use (Study 1 only)
On an average school day, how many hours do you use a computer for something that is not school
work? (Count time spent on Xbox, PlayStation, iPod, tablet, smartphone, YouTube, Facebook, browsing
the Internet.)
# I do not use a computer for something that is not school work
# Less than 1 h per day
# 1 h per day
# 2 h per day
# 3 h per day
# 4 h per day
# 5 or more hours per day
Problematic Internet Behaviors (see Moreno, Arseniev-Koehler, & Selkie, 2016 for Study 1)
Games played (Study 1 only)
Which online games have you played? (check as many as you want)
I don’t play online games Portal
Minecraft Fallout
Angry Birds Temple Run
Mortal Kombat Rolling Sky
Lego Dimensions Flow Free
Medal of Honor Roblox
Zoo Tycoon Grand Theft Auto
Call of Duty Terraria
Just Dance List others
Games played (Study 2 only)
In the past year, which of these games have you played the most? (select up to 3)
I don’t play games Flow Free Happy Glass
Fortnite Roblox Homescapes
Minecraft Grand Theft Auto Assassin’s Creed
Angry Birds Mortal Kombat Helix Jump
Medal of Honor Lego Dimensions Paper.io
Zoo Tycoon Terraria NHL/NBA/Madden/NFL/wii sports
Call of Duty Super Smash Brothers Ultimate BattlefieldInt. J. Environ. Res. Public Health 2020, 17, 4996 16 of 20
Just Dance Overwatch Geometry Dash
Portal Pokemon Red Dead Redemption
Fallout Subway Surfers Forza
Temple Run Rainbow Seige Lovers in a Dangerous Spacetime
Rolling Sky Candy Crush List others_____________________
Online gaming frequency (Study 1 only)
How often do you play online games on a typical school day?
# I don’t play online games
# Less than 10 min/day 10-30 min
# 30–60 min
# 1–2 h
# 3h+
Online gaming frequency (Study 2 only)
On an average school day, up to how many hours do you play games (include online, phone, Xbox,
Playstation, etc.)
# Never
# Up to 1 h
# 2h
# 3h
# 4h
# 5h
# 6h
# 7h
# 8h
# More than 8 h
Online gaming interactions (skipped if checked “I don’t play online games” above, Study 1)
Who do you usually play online games with? (check any that apply)
# I usually play alone or against no one # Adults I know, like parents or relatives
# Kids I know, like friends or siblings # Adults I have never met before
# Kids I have never met before # I have no idea who I play with online.
Online gaming interactions (skipped if checked “I don’t play online games” above, Study 2)
How often do you interact with other players or chat while you are gaming?
# Never
# Rarely
# Sometimes
# Often
# AlwaysInt. J. Environ. Res. Public Health 2020, 17, 4996 17 of 20
Social media frequency (Study 1 only)
On a typical school week, how often do you check your social media (like Instagram)
# More than every hour A few times a week
# Every few hours Less often than a few times a week
# Once a day Never/Does not apply to me
# Every few days
Money spent on monthly gaming (Study 2 only)
In a typical month, how much do you spend on games you play (includes accessories, Vbucks, etc.)?
# $0
# Up to $10
# Up to $25
# Up to $50
# Up to $100
# $100 or more
Social withdrawal due to gaming (Study 2 only)
In the past 2 weeks, how often have you done the following because of the games you’ve played?
Never Once or twice 3–6 times More than 6 times
Spent less time on
homework or class # # # #
projects
Spent less time
# # # #
with family
Skipped a meal # # # #
Missed a sports or
# # # #
afterschool activity
Missed school/late
# # # #
to school
Note: Once the datasets are no longer active, we will provide the data upon request.
References
1. Pew Research Center. Teens, Social Media & Technology 2018. Available online: http://www.pewinternet.
org/2018/05/31/teens-social-media-technology-2018/ (accessed on 31 May 2018).
2. Muller, K.W.; Janikian, M.; Dreier, M.; Wolfling, K.; Beutel, M.E.; Tzavara, C.; Richardson, C.; Tsitsika, A.
Regular gaming behavior and internet gaming disorder in european adolescents: Results from a cross-national
representative survey of prevalence, predictors, and psychopathological correlates. Eur. Child Adolesc.
Psychiatry 2015, 24, 565–574. [CrossRef] [PubMed]
3. Przybylski, A.K. Electronic gaming and psychosocial adjustment. Pediatrics 2014, 134, e716–e722. [CrossRef]
[PubMed]
4. Peeters, M.; Koning, I.; Eijnden, R.V. Predicting Internet Gaming Disorder symptoms in young adolescents:
A one-year follow-up study. Comput. Hum. Behav. 2018, 80, 255–261. [CrossRef]
5. American Psychiatric Association. Substance-related and addictive disorders. In Diagnostic and Statistical
Manual of Mental Health, 5th ed.; American Psychiatric Association: Arlington, VA, USA, 2013. [CrossRef]
6. World Health Organization. International Statistical Classification of Diseases and Related Health Problems.
Available online: https://icd.who.int/browse11/l-m/en (accessed on 23 June 2020).
7. Carras, M.C.; Van Rooij, A.J.; Van de Mheen, D.; Musci, R.; Xue, Q.; Mendelson, T. Video gaming in a
hyperconnected world: A cross-sectional study of heavy gaming, problematic gaming symptoms, and online
socializing in adolescents. Comput. Hum. Behav. 2017, 68, 472–479. [CrossRef] [PubMed]You can also read