In Search of Patient Zero: Visual Analytics of Pathogen Transmission Pathways in Hospitals
←
→
Page content transcription
If your browser does not render page correctly, please read the page content below
IEEE TRANSACTIONS ON VISUALIZATION AND COMPUTER GRAPHICS, VOL. 27, NO. 2, FEBRUARY 2021711

                         In Search of Patient Zero:
    Visual Analytics of Pathogen Transmission Pathways in Hospitals
      T. Baumgartl∗ , M. Petzold∗ , M. Wunderlich, M. Höhn, D. Archambault, M. Lieser, A. Dalpke, S. Scheithauer,
             M. Marschollek, V. M. Eichel, N. T. Mutters, HiGHmed Consortium, and T. von Landesberger

       Figure 1: Transmission pathway tracing interface. 1. The Epidemic Curve View shows the number of infected patients. 2. The
       Contact Network View shows patient contacts as a network. 3. The Transmission Pathway View shows contacts and infection status.
       Tracing interaction shows potential infection transmission events. 4. Patient event details are shown in Patient Timeline View.

       Abstract—Pathogen outbreaks (i.e., outbreaks of bacteria and viruses) in hospitals can cause high mortality rates and increase costs
       for hospitals significantly. An outbreak is generally noticed when the number of infected patients rises above an endemic level or the
       usual prevalence of a pathogen in a defined population. Reconstructing transmission pathways back to the source of an outbreak – the
       patient zero or index patient – requires the analysis of microbiological data and patient contacts. This is often manually completed
       by infection control experts. We present a novel visual analytics approach to support the analysis of transmission pathways, patient
       contacts, the progression of the outbreak, and patient timelines during hospitalization. Infection control experts applied our solution to a
       real outbreak of Klebsiella pneumoniae in a large German hospital. Using our system, our experts were able to scale the analysis of
       transmission pathways to longer time intervals (i.e., several years of data instead of days) and across a larger number of wards. Also,
       the system is able to reduce the analysis time from days to hours. In our final study, feedback from twenty-five experts from seven
       German hospitals provides evidence that our solution brings significant benefits for analyzing outbreaks.
       Index Terms—dynamic networks, visualization applications, health, medicine, outbreak, Klebsiella, infection control

1   I NTRODUCTION
Pathogen transmissions are an acute problem in hospitals around the                         viruses, can endanger the lives of patients, since they represent a very
world [20, 24]. The transmission of pathogens, such as bacteria and                         vulnerable group of persons. Pathogen infections in hospitals can be
                                                                                            transmitted via patient-to-patient contact in the same room or ward [18].
                                                                                            Transmissions are generally difficult to detect since patients may be
• ∗ T. Baumgartl and M. Petzold are shared first authors.                                    infected, but show no clinical symptoms. These carriers are invisible
• T. Baumgartl, M. Wunderlich, M. Höhn and T. von Landesberger are with                    sources for potential transmissions. Screenings can detect carriers, but
  TU Darmstadt, Darmstadt, Germany. T. von Landesberger is now with                         regular screening of all patients is very costly and ineffective. Thus,
  Universität Rostock, Germany. E-mail: office@gris.tu-darmstadt.de.                        only high risk patients are usually screened when entering the hospital
• D. Archambault is with Swansea University, Swansea, United Kingdom                        or after transfers within the hospital.
  E-mail: D.W.Archambault@Swansea.ac.uk.
• M. Lieser, M. Petzold, V. M. Eichel, N. T. Mutters are with University          One initial infected patient, a patient zero or index patient, may
  Hospital Heidelberg, Heidelberg, Germany, E-mail:                            transmit the pathogen to other patients [20]. These patients may change
  {first.last}@med.uni-heidelberg.de.                                           wards and infect further patients. The endemic level represents the
• A. Dalpke is with TU Dresden, Dresden, Germany. E-mail:                      usual prevalence of a pathogen in a defined population. When the
  alexander.dalpke@ukdd.de.                                                    number of infected patients rises above a certain endemic level, and
                                                                               a spatio-temporal context is observed, it is called cluster or outbreak.
• S. Scheithauer is with University Medicine Göttingen, Universität Göttingen,
  Germany. E-mail: simone.scheithauer@med.uni-goettingen.de.                   The endemic level is characterized by parameters such as the type of pa-
• M. Marschollek is with L. Reichertz Institute for Medical Informatics,       tients and the location within the hospital (underlying diseases), as well
  Hannover, Germany. E-mail: Marschollek.Michael@mh-hannover.de.               as the pathogen specifics: e.g., the mode of transmission, seasonality
• This paper is contributed by HiGHmed infection control study group.          of occurrence, the resistance potential and infectiousness. As auto-
                                                                               matic outbreak detection is still an ongoing research problem [21, 83],
                                                                               usually, the endemic level is set manually by comparing numbers of
                                                                               newly infected patients within a certain time frame with the numbers
Manuscript received 30 Apr. 2020; revised 31 July 2020; accepted 14 Aug. 2020.
Date of publication 8 Dec. 2020; date of current version 15 Jan. 2021.         of infected patients in a previously recorded time frame. As not all
Digital Object Identifier no. 10.1109/TVCG.2020.3030437                        patients can be regularly tested or screened, depending on the pathogen,

                                    1077-2626 © 2020 IEEE. Personal use is permitted, but republication/redistribution requires IEEE permission.
         Authorized licensed use limited to: SLUBSee https://www.ieee.org/publications/rights/index.html
                                                  Dresden.    Downloaded on February 01,2021 atfor06:34:47
                                                                                                         more information.
                                                                                                                  UTC from IEEE Xplore. Restrictions apply.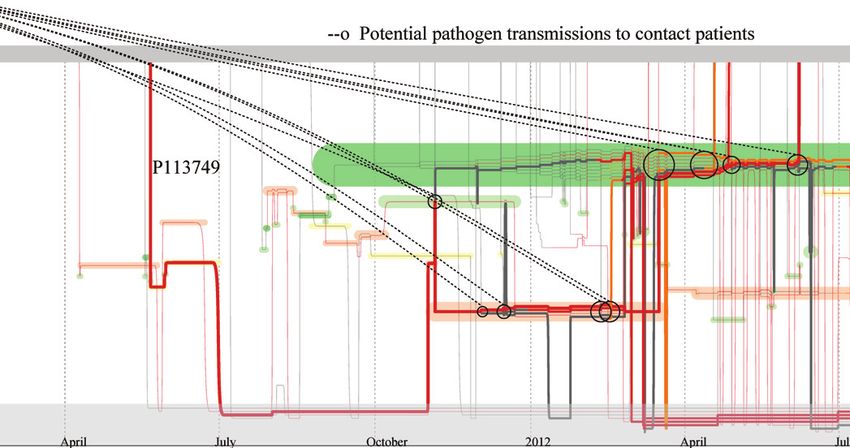
712                                               IEEE TRANSACTIONS ON VISUALIZATION AND COMPUTER GRAPHICS, VOL. 27, NO. 2, FEBRUARY 2021

it can take days, weeks or months before an outbreak is detected [27].         focus. Machine learning methods working with visual analytics have
Therefore, the monitoring of infectious persons and determining their          been proposed [16, 34], and more specifically for disease progression
transmission pathways is the primary goal of Infection Control experts,        pathways [33]. They have been applied to the problem of infection
e.g., hygienists, clinicians, hygiene experts, in order to intervene in        control [42], but in this closely related work the transmission pathway
time and prevent further pathogen spreading.                                   was not reconstructed. Machine learning is effective, but may not be
    Once an outbreak has been detected (Task 1), the infection control         feasible for rarely occurring pathogens, such as K. pneumoniae, where
experts need to trace the infection back to its source in order to de-         the numbers of items in the trained classes of (non)-infection are very bi-
termine if the patients are connected and belong to an outbreak. This          ased. Thus, transmission pathway reconstruction and the identification
means the identification of all potentially infected patients back to the       of potentially infected patients requires interactive exploration.
patient zero, i.e., the overall source of the outbreak (Task 2). The
experts need to reconstruct these transmission pathways – by whom,                Disease Spread and Dynamic Networks. As many pathogens
when and where did a transmission occur. This information is used              are transmitted over contacts preferentially, disease spreading is often
to find the origin of the infectious agent: whether it is nosocomial –          simulated as dynamic processes over contact networks. A number
hospital-intern. Furthermore, patient localization (which rooms/wards          of approaches have focused on the population level: the number of
– Task 3) and outbreak duration (begin/end – Task 4) need to be de-            infected patients through line charts [1, 18,36, 56]. They use the contact
termined. The transmission pathway is then used to identify putative           networks in the simulation, but only provide macroscopic views of
colonized or infected patients that are yet unknown and thus require           disease progression. The simulations often result in a collection of
testing (Task 5). Intervention procedures can then be implemented              thousands of dynamic graphs with very few existing approaches for this
by isolating or cohorting affected patients in separate rooms, special         data [10, 38]. Manynets [22], GraphLandscape [29] and SOM-based
disinfecting processes, increasing hand hygiene, screening and teaching        clustering [75] extract graph properties and compare many static graphs
staff affected: infected and exposed.                                          and these methods could be adapted and applied. However, two very
    The identification of transmission pathways is challenging because          different graphs can have the same properties [14]. Network piling
it can occur over several contacts, involve several hospital wards and         approaches [5, 71] allow the comparison of several static graphs in
various time spans (days to years). Tracing requires integrating both          detail but do not scale well to larger graphs and have not been adapted
the spatio-temporal patient information and microbiological test results.      to compare multiple dynamic graphs. Recently, a simulation and visual-
Outbreak pathway reconstruction needs to be fast and precise: each             ization of disease spreading over contact networks in hospitals has been
potential patient and their contacts need to be detected to prevent further    presented [80]. It shows the disease and transmission probability on
disease spreading. Often there is uncertainty about the patient status         individual level, but takes only a static network as input. This simplifi-
at the time of a contact, as screening often detects an infection or           cation is done for simulation purposes. However, in real cases, patients
colonization only at a later date. Thus, also potential infections need to     move across wards over time. Both visualization and simulation should
be considered.                                                                 take into account the network dynamics over time. In sum, however,
    Currently, transmission pathway reconstruction is a time-consuming         the simulations focus only on disease spreading prediction and not on
and potentially error-prone manual process. It may take days to weeks,         the reconstruction of pathogen transmission pathways.
using current hospital systems [27]. Visual analytics systems have the
potential to support this analysis process by saving analyst time [15].           Visualization of Contact Dynamics. The reconstruction of
However, current solutions focus mainly on the disease evolution at a          pathogen transmission pathways requires analyzing patient contacts and
population level (see Sect. 2).                                                patient infection status over time. A number of methods exist for visual-
    In cooperation with Infection Control experts from four German             izing a single dynamic graph over time in a scalable way [6, 55, 69, 73].
Hospitals and Infection Research Institutes, we developed a novel vi-          These methods use timeslices as a basis for the visual analytics process.
sual analytics system for the exploration of disease outbreaks. We used        The uniformity of timeslices poses a problem as the distribution of
iterative, user-centered design within a common project HiGHmed                transmission events is unequal over time. Event-based methods [41, 50]
over two years. The system offers several specialized views for the            for the visualization of dynamic networks [35, 63, 64, 78] are more ap-
exploration of outbreaks and pathogen transmissions. The core contri-          plicable. However, they have not been designed for outbreak networks
bution is a novel view for contract tracing that was inspired by the well      visualization in a way that fulfills the needs of the infection control
known storyline visualization [37, 46, 52]. The visual design, layout          experts.
and interactions enable to explore contacts as well as to automatically           The visualization of contact network dynamics for hospital data
determine and highlight patients and their contacts that could transmit        could be supported by dynamic set visualization and storyline ap-
pathogenic organisms.                                                          proaches. Set visualization methods [2] for the visualization of set dy-
    Our approach was applied to a real outbreak of Klebsiella pneumo-          namics [45,72] are able to show the set sizes and the number of changes
niae in a large German hospital. The experts were able to effectively          between sets over time. Methods for visualizing long time series [7]
reconstruct the transmission pathway back to the patient zero in a faster      and text visualizations [17, 59] have similar representations. Showing
and in a more comprehensive way when compared to existing methods.             the group membership over time on individual level has also moti-
In our final qualitative study, we gathered feedback from twenty-five            vated the storyline research. Storyline visualizations [37, 46–48, 67, 68]
experts located in seven German hospitals. The results indicated signif-       devote one dimension, usually the x-axis, to time and encode each
icant added value when tracing transmission and analyzing outbreaks            individual character in a story as a line. Lines that are placed close
in hospitals.                                                                  together to indicate the characters share a scene; when the lines sep-
                                                                               arate, the scene ends. For disease spreading, this encoding can be
2     R ELATED W ORK                                                           used to show contacts in the same ward and forms a key part of our
   Visual Analytics of Health Data. Visual Analysis of health-                 approach. Research in storyline visualization has focused on opti-
care data is an active area of research. Event-based visual analyt-            mizing the compactness of storyline visualizations (either automatic
ics approaches for health record data has been a main focus of this            or users-assisted) [4, 23, 37, 47, 48, 51, 61, 62, 67, 68], reducing cross-
area [13, 26, 28, 41, 53, 54, 57]. Disease surveillance and epidemiol-         ings [25, 32, 70, 79], plotting approaches [60], combining storylines
ogy has also been of interest [49]. Visual analytics approaches for            with event-based methods [3], genealogical data [31], streaming and
epidemiologists focus on the spatio-temporal evolution of a disease at         dynamic data [66, 81], and contacts between living things or actors ex-
a population level–how many people will be infected, in which geo-             hibiting similar behavior [52]. Reda et al. [52] is the closest approach
graphic area(s), and the speed of the spread [12, 39, 82]. These visual        to ours, but it needs to consider all contacts in the storyline. In our
analytics approaches target disease spreading over a large population at       work, we can reduce clutter by determining and highlighting pathogen
a macroscopic level. They visualize the number of people infected over         transmitting contacts. On the other hand, we need to show more specific
time, but detailed views about individual patient contacts are not the         locations inside the hospital or if the patient is discharged.

            Authorized licensed use limited to: SLUB Dresden. Downloaded on February 01,2021 at 06:34:47 UTC from IEEE Xplore. Restrictions apply.
BAUMGARTL ET AL.: IN SEARCH OF PATIENT ZERO: VISUAL ANALYTICS OF PATHOGEN TRANSMISSION PATHWAYS IN HOSPITALS713

                                                                                                                   6FUHHQLQJ                 7HVW
3     BACKGROUND – TASKS          AND   DATA
                                                                                 0LFUR 3DWLHQW $ 8QNQRZQ ,QIHFWHGFDUULHU               ,QIHFWHGGLVHDVHG
Over the course of one year, we investigated the data and tasks that are         ELRORJLFDO                               6FUHHQLQJ             7HVW
performed by infection control experts in four German hospitals during           'DWD      3DWLHQW% 8QNQRZQ 8QNQRZQ               ,QIHFWHGGLVHDVHG
their procedures. The data and tasks were guided by the scope of the                                                     7LPH
HiGHmed project. For a deep understanding of the data, tasks and cur-
rent analysis methods, we conducted a structured interview following                                                7UDQVIHU 7UDQVIHU    7UDQVIHU     7UDQVIHU

the methodology in [74]. We first used an online questionnaire that was                      3DWLHQW$        +RPH :DUG 7HPSRUDU\KRPH :DUG       +RPH
                                                                                /RFDWLRQ                    7UDQVIHU7UDQVIHU                     7UDQVIHU
answered by six infection control experts and epidemiologists. More-                                    +RPH :DUG :DUG
                                                                                            3DWLHQW%                                              :DUG
over, we interviewed three hygienists to learn the current work methods
by infection control experts in three hospitals and one infection control
institute. Further details on the tasks and data were assessed during the       Figure 2: Data characteristics. Bottom: Patient locations determined by
iterative design process (see Sect. 4). Our system is designed to support       transfer events. Top: Infection status of patients over time determined
one of their main tasks: tracing transmission pathways in outbreaks.            by microbiological data events.
3.1    Tasks
Our work resulted in these tasks without a strict workflow order:                Thus, a transfer is T Rk = (Pk , Lk ,tkT R ,typek ). The typek , determines
 T1 Detect Outbreak. Is there an outbreak? When the number of                   whether the transfer was 1) between wards, 2) from home to hospital,
     infected patients rises above a normal level within a certain period,      i.e., first hospital admission, or 3) home between hospital stays, i.e.,
     i.e., the endemic level, an outbreak occurs. Depending on the              ‘temporary home’, or 4) was the end of a hospital stay. The current
     pathogen, this endemic level can be two or more patients. As               location of the patient is the destination of the patient’s last transfer (see
     patients may not be tested or screened generally, an outbreak is           Fig. 2). The time intervals between successive transfers are irregular
     determined by manual inspection.                                           and cannot be transformed to regular intervals without sampling or
 T2 Outbreak Pathway.                                                           without causing scalability challenges. Even very short stays at a
     T2.1 Determine transmission contacts. Did contacts occur be-               location can lead to important contacts in pathway reconstruction.
             tween patients that could have led to pathogen transmis-
             sion? If yes, where, when and with whom?                             Microbiological data: MB is information about the tests and
     T2.2 Determine index patient (patient zero). Who is the source of          screenings of patients for pathogens. More formally, it is a set of
             the outbreak? Identifying the transmission pathway should          events MB = {MB j }. Each element MB j records which patient Pj ,
             lead back to the index patient, i.e., the patient zero.            was tested or screened s j , for which pathogen ρ, at what time t MB             j
     T2.3 Distinguish between a single or multiple outbreaks. Is the            and the result r j : MB j = (Pj , s j ,t MB
                                                                                                                         j  , ρ j , r j ). Patients may have several
             observed outbreak a single outbreak or multiple, simulta-          microbiological data records associated with them or none at all. The
             neous outbreaks of similar pathogens? Depending on the             analysis can take place before, during or after the hospital stay and the
             answer, there could be one or more index patients.                 spacing between events is irregular.
 T3 Outbreak Location.                                                             The result r j determines patient’s infection status (see Fig. 2):
     T3.1 Determine if the outbreak is hospital-associated. Did the                • infected – carrier: A positive result of a screening means that the
             transmissions occur within the hospital or have been in-                 patient is colonized. Due to lack of data on recovery (see Sect. 8)
             fections brought in from outside the hospital? A within-                 from this moment onwards, the patient retains this status unless
             hospital transmission, i.e. a nosocomial, points to a source             he/she is later identified as diseased.
             of infection such as a patient/staff/device. These transmis-          • infected – diseased: If a patient with symptoms is tested positively
             sions should be avoided as patients can have lower immune                on the pathogen ρ, he/she is in a diseased state. Due to lack of
             response and thus may be more vulnerable.                                data on recovery (see Sect. 8), the patient retains this status from
     T3.2 Locate ward(s) with pathogen transmissions. For nosoco-                     the moment of the positive test onwards.
             mial transmissions, in which ward has the transmission                • unknown: Before the first positive screening or targeted micro-
             occurred? This location needs to be disinfected or closely               biological test, the infection state is unknown. If the patient is
             monitored.                                                               not tested for the pathogen ρ, it is unknown whether they are
 T4 Quantify outbreak duration. When did the outbreak first start?                     infected/colonized. If a patient becomes infected at a later point
     How long does it last? Early detection mitigates the risk of larger              in the data set, the patient is labeled “unknown – will be infected”.
     outbreaks. Tracing back the time point of all transmissions to the
     initial index patient determines the total duration.                       4     D ESIGN P ROCESS              AND   F INAL A PPROACH
 T5 Identify potentially infected patients. Who is also potentially
     infected? Not all patients can be screened in the hospital to deter-       Our approach was developed through iterative design with our domain
     mine their infection, and not all infected patients show symptoms.         experts over two years following guidelines for effective visualization
     These potentially (i.e., putative) infected patients need to be iden-      design [30, 43, 58]. After the initial task and data analysis, we had
     tified via their contacts to infected patients.                             regular quarterly meetings with project participants. The number of
                                                                                participants in the meetings varied as not all participants could attend
3.2    Data                                                                     each meeting. On average, ten of our expert participants were present
                                                                                in our meetings. The expertise included: infection control, hygienists,
The pathogen transmission analysis requires to combine two types of             infection control data management, epidemiologists and infection con-
data 1) patient locations for determining contacts, and 2) microbio-            trol managers. Between the meetings, we communicated per email and
logical data for identifying infection status. Due to privacy reasons,          held interactive sessions onsite.
collection of this data is limited (see Sect. 8). The patient location is
only determined by a log record of their ward, not by tracking. The             4.1     Prototype Development
infection status is only known at the time of screening or test. These
data sets can span years with events recorded down to second precision.         Our first prototype had several linked views [76] (see Fig. 3a). The
The time between two consecutive events (e.g. transfers) can be on the          epidemic curve view showed the number of infected patients over a two
order of seconds to months.                                                     weeks period (see Fig. 3a–part 1,2). It highlighted potential outbreaks
                                                                                with infections above the endemic level per selected pathogens. For
   Patient Locations: The location data consists of a list of patient           identifying hospital-associated (nosocomial) infections, the patient stay
transfer events T R = {T Rk }. A transfer T Rk records that the patient Pk ,    along with infection status was shown (see Fig. 3a–part 3). Poten-
was transferred to location Lk at time tkT R for the following reason typek .   tial transmissions between patients were supported only by node-link

         Authorized licensed use limited to: SLUB Dresden. Downloaded on February 01,2021 at 06:34:47 UTC from IEEE Xplore. Restrictions apply.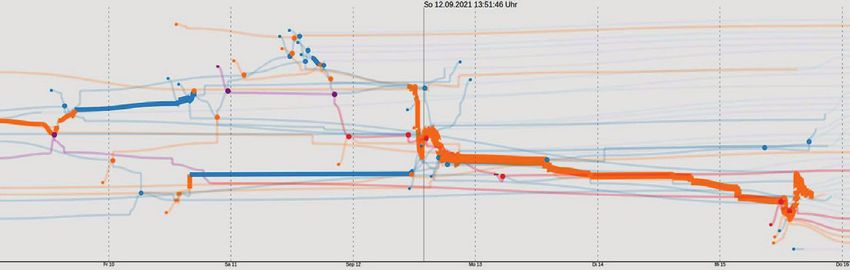
714                                                      IEEE TRANSACTIONS ON VISUALIZATION AND COMPUTER GRAPHICS, VOL. 27, NO. 2, FEBRUARY 2021

                                                                                 4.2 Final Prototype
                                                                                 The final visual interface is shown in Fig. 1. This design combines the
                                                                                 pathogen pathway reconstruction views of the user-selected pathogen
                                                                                 needed for our tasks (see Sect. 3.1).
                                                                                 1. Epidemic Curve View shows the number of infected persons per
                                                                                    day in order to support Task 1 – outbreak detection. The infection
                                                                                    control expert can select the total number of infections or only
                                                                                    new ones (i.e., without copystrains). To see how it relates to the
                                                                                    endemic level, a moving average of the user-selected time period is
                                                                                    shown. This view can show data for the hospital (see Fig. 9 top) or
                                                                                    specific wards (see Fig. 9 bottom). It supports longer time periods
                                                                                    via focus-and-context methods inspired by [77].
                                                                                 2. Contact Network View shows the contacts of selected patients for
                                                                                    determining putative infected patients (Task 5).
                                                                                 3. Transmission Pathway View supports Tasks 2–4. This view shows
                      (a) Initial visualization, see also [76]                      patient contacts and possible pathogen transmissions over time
                                                                                    in a storyline-like view. The extensions are layout, design, and
                                                                                    highlighting of potential transmission events more directly.
                                                                                 4. Patient Timeline View shows the patient location overlaid with mi-
                                                                                    crobiological data. It supports the visual analytics process with
                                                                                    infection status and location information. The data encoding is
                                                                                    unchanged since its early prototype described in Sec. 4.1.

                                                                                 5 Transmission Pathway View
                                                                                 The Transmission Pathway View shows patient infection status and
                            (b) Patient timeline view.                           contacts over time and across locations (Fig. 1 (3)). Outbreak duration,
                                                                                 potential transmission contacts between patients, and patient locations
                                                                                 are visible (Task 2–4).
                                                                                    Each line represents a patient and the x-axis encodes time (Task 4).
                                                                                 Each patient line starts with the earliest recorded admission to hospital
                                                                                 and ends with the last recorded stay. Temporary home stays are also
                                                                                 shown. This helps in detecting hospital-associated transmissions during
                                                                                 previous stays (Task 3.1). Patient lines pass close to each other for
                                                                                 every potential contact (Task 2.1). The y-axis encodes patient location.
                         (c) Initial storyline-like design                       Fixed vertical positions for individual wards (as in Baling et al. [8]) is
                                                                                 not scalable due to the larger number of wards and patients (hundreds),
 Figure 3: Early prototypes. Interfaces were translated into English.            but our layout still aims at preserving the vertical position of wards [4].
                                                                                 Line color conveys infection status, and background color is used to
                                                                                 encode location information. Technical details are below.
                                                                                 5.1 Layout
diagrams showing patient contacts and current infection status (see
Fig. 3a–part 4). A total of thirteen domain experts responded to our call        We propose a modified storyline [46] layout algorithm to support our
for feedback by filling out an online questionnaire [76]. The prototype           tasks. While typical approaches to storyline drawing optimize the
demonstrated a high degree of usefulness (mode 4 and 5 respectively on           number of edge crossings and minimize bends, we have the constraint
a five point Likert scale). The experts especially appreciated views that         of patient locations, including ward (Task 3), and patient contacts
were new to them: a) patient stay and the infection duration and b) the          (Task 2). Fast layout is required for interactive exploration, as sets of
contact network. They wanted these views to scale to longer periods of           patients in the view can change when filters are applied, and data sets
time, larger sets of microbiological data, and views to support pathogen         are loaded. Thus, we prioritize runtime over crossing optimization and
transmission pathway reconstruction.                                             minimizing bends (see Sect. 8). We build upon existing layouts and
                                                                                 combine them and adapt them for our purposes. Given these desired
   The second design included a Patient Timeline View that showed                goals, our algorithm is structured as follows (see also Fig. 4):
the patient stay and his/her microbiological data (see Fig. 3b). This              1. Data pre-processing: Construct patient contact graph
design leveraged the infection control expert’s experience with excel-             2. Initialization: Compute initial layout
based information. Each row is one patient, and the x-axis is time.                3. Constrained force-directed layout:
The background color shows the infection status, colored horizontal                      (a) Constraint – x position: The temporal order of patient
bars show the patient location, and colored vertical bars show the                            transfers is preserved
screening and test results. Our experts found that this view provided                    (b) Constraint – home/hospital: Patient y position for home,
a good overview of patient location and infection status. However,                            hospital and temporary home location is preserved
the separation of patients into rows made it difficult to spot contacts                   (c) Force – ward separation: Different wards are spaced out
leading to pathogen transmission. Sorting the rows by the time of the                         on the y-axis
first infection did not help, as a patient can have contact with several                  (d) Force – ward position: Spring forces encourage keeping
patients.                                                                                     wards at the same y position
   Our third design used a storyline representation of the infection                     (e) Force – line straightening: Force encourages straight lines
data (see Fig. 3c). Patients are lines and the x-axis is time. Lines                          after each iteration
are colored according to infection status. Contacts in this view are               4. Finalization:
line bundles. Although the view shows all data needed for pathogen                       (a) Line order: For simultaneous contacts of many patients,
transmission analysis, the experts had difficulty relating to it. The layout                   y order of lines according to the transfer time
that emphasized the movements made it difficult to follow patients and                    (b) Temporal adjustment: Align x position according to the
to determine transmissions.                                                                   exact time moments

            Authorized licensed use limited to: SLUB Dresden. Downloaded on February 01,2021 at 06:34:47 UTC from IEEE Xplore. Restrictions apply.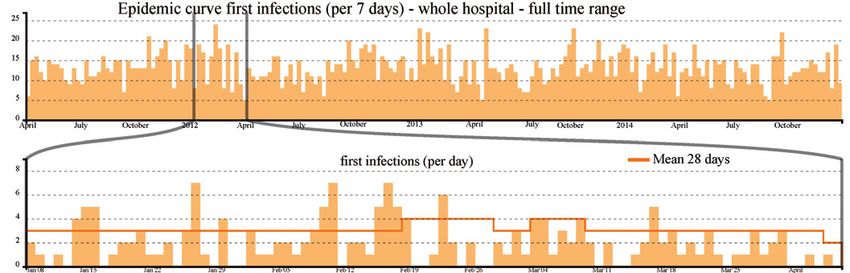
BAUMGARTL ET AL.: IN SEARCH OF PATIENT ZERO: VISUAL ANALYTICS OF PATHOGEN TRANSMISSION PATHWAYS IN HOSPITALS715
1. Pre-processing We construct a directed acyclic graph (DAG)
7U 7U 6 7U from the event-based data. Nodes are sets of patients at a location
3DWLHQW$ +RPH :DUG :DUG +RPH (i.e., patient contacts) or infection state changes (see Fig. 4a). Edges
7U 7U 6FDUULHU 7U 7U are transitions between these states. As the transfers have a single
3DWLHQW% +RPH :DUG :DUG :DUG +RPH
timestamp, nodes are interpreted as instantaneous events. Edges that
connect these nodes form a from-to transfer edge. This duplication also
$
ensures the duration of the stay at a particular location, and all possible
$
contacts between two transfer time moments. The locations, location
$ $ $ $ changes, and patient contacts can be followed through paths in this
$ $ $ $ $ $ graph. For changes in infection state, an infection state change node is
% % % % % % % %
created and passing through this node changes the patient’s infection
% % % % % % % state.
W W W W W W W W W
2. Initialization As each node of the DAG represents a set of pa-
(a) Pre-processing: Constructing patient contact graph tients together in a location, an initial layout can be computed using
dynamic set visualization based on Sankey Diagrams (D3 implementa-
tion used [11]). This initial layout takes into account the cardinalities
of the sets and operates on the structure of the DAG only. The exact
time of patient transfers is taken into account in the finalization.
3. Constrained force-directed layout We employ a force-directed
layout for storylines [46, 62]. Our initialization helps avoid local min-
ima, but it requires refinement subject to additional constraints (e.g., to
convey patient location). After experimenting with various ways to use
This variant leads to more clutter and lower discriminability between home and
’temporary home’ transfers.
space to convey patient location (i.e., all on the bottom), we decided
to divide the screen into home – hospital – temporary home from top
to bottom (see Fig. 4b). Admission to the hospital is a vertical line
descending from the top area of the screen. Temporary home transfers
are vertical lines towards the bottom of the screen. When optimizing
the layout with the force-directed algorithm, we use a constraint-based
approach [19] to enforce these locations and use additional forces to
encourage the desired properties of the layout. The first constraint pre-
serves the temporal order of movements along the x-axis. The second
The used variant distinguishes transfers from home (lines from top) and from constraint restricts movement outside y-axis areas for the three location
’temporary home’(lines from the bottom).
(b) Constraining area for home, hospital, and temporary at home.
types (Task 3.1). Additional forces are used to maximize the stability
of the y position of a patient during a stay in a ward to help represent
contact location (see Fig. 4c) (Task 3.2.). Still, the y position can vary
significantly when a patient stays in a location for long periods of time.
To remove this position change, we replace the individual y positions
of these nodes with the average (see Fig. 4d).
4. Finalization Lines are ordered from top to bottom according to
(c) Spring force for wards improves stability of y position. the order patients entered the ward (see Fig. 4e). Even though this may
cause more edge crossings, this order helps support Task 2: tracing
transmissions. Patients that were in the ward for longer periods of
time are more likely to be involved in transmission events. Finally,
individual nodes are placed at the precise time of their events along the
x-axis, which is important for determining outbreak duration and time
of possible pathogen transmissions (Task 4) (see Fig. 4f).
(d) Line straightening is performed after each iteration
5.2 Visual Design and Interaction
Infection status is encoded using color (see Fig. 5 left) in order to help
in tracing transmissions (Task 2). Differentiating between ‘unknown’
and ‘unknown-will be infected’ helps infection control experts track
patients over long time periods, reducing the requirement to pan and
zoom. Details on microbiological data are shown on demand through a
tooltip. The contact location (Task 3), specifically the ward, is shown
(e) Line order according to patient transfer order. Wiggles emphasize transfers, esp., ensure on demand by a colored background hull.
visibility of short time periods.
Using a process inspired by [31,68], patient lines are drawn smoothly.
As short periods of contact can lead to transmission, wiggles in the line
indicate new contacts (see Fig. 4e). We emphasize contacts between
patients on the same ward (Task 2) by minimizing the line width for
vertical lines (see Fig. 5 right). This also reduces overplotting as
inspired by Tanahashi and Ma [67].
Standard pan and zoom operations are supported as well as high-
(f) Finalization by aligning X position to the exact time.
lighting of selected patients. When a patient is selected, its line width
Figure 4: Stages of the layout algorithm which transform the event- is increased. Non-focus information is not filtered out [31], as it is
based data into a final storyline layout used by the interactive system. a requirement to be able to track patients in the data set. Straighten-
ing selected patient lines [37] would be an alternative, but this would
interfere with our ward location encoding.
Authorized licensed use limited to: SLUB Dresden. Downloaded on February 01,2021 at 06:34:47 UTC from IEEE Xplore. Restrictions apply.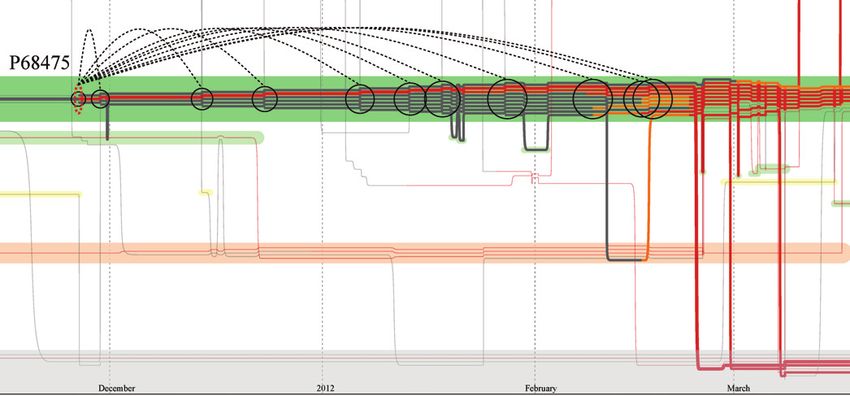
716                                               IEEE TRANSACTIONS ON VISUALIZATION AND COMPUTER GRAPHICS, VOL. 27, NO. 2, FEBRUARY 2021

                                                                                 XQNQRZQ        XQNQRZQ        XQNQRZQ             FDUULHU    FDUULHU          GLVHDVHG
                                                                                 XQNQRZQ        FDUULHU        GLVHDVHG            GLVHDVHG   FDUULHU          GLVHDVHG

                                                                                                   (a) Contact event types for infection transmission
                                                                                                               5HOHYDQWFRQWDFW                         &RQWDFW

                                                                                          ,QIHFWLRQ XQNQRZQ               FDUULHU                GLVHDVHG
                                                                                3DWLHQW$
                                                                                          /RFDWLRQ       KRPH :DUG 7HPSRUDU\KRPH          :DUG           KRPH

                                                                                                                   7UDQVPLVVLRQ
                                                                                            ,QIHFWLRQ    XQNQRZQ   HYHQW
                                                                                                                                                    GLVHDVHG
                                                                                3DWLHQW%
                                                                                            /RFDWLRQ KRPH :DUG :DUG                                    :DUG

                                                                                                                                       7LPH
Figure 5: Left: Visual design, where line color encodes infection status.          (b) Relevant contacts for pathogen transmission and possible transmission events.
Colored background hulls display wards. Right: Emphasizing patient
contacts by reducing the width of vertical lines.                               Figure 6: The types of contacts and encoding of transmission events.

5.3    Support for Transmission Pathway Exploration
Potential pathogen transmissions must be visible [44] among many
patient contacts over long periods of time (months to years). Panning
and zooming over such long time periods is inefficient and may lead
to missing important contacts in the data. We developed specialized
tracing interactions to support this visual analysis.
    Our interactive approach supports 1) backward tracing – finding
transmission events and patients in the past that could have infected a
selected patient. The interaction enables the search for an index patient,
i.e., patient zero (Task 2). 2) forward tracing – finding patients that
could be infected by a selected infected patient at a later point in time,
i.e., putative infected patients (Task 5).
    We now explain the necessary computation required to interactively
backward trace. Computation for forward tracing is done analogously.            Figure 7: Forward tracing of pathogen transmissions of patient P68475.
For a selected patient P, we calculate which contacts might have lead           The patient potentially infected many patients at the ward S279.
to the patient’s infection. A pathogen can be transmitted from an
infected patient Pi to the patient P when the patients come into con-
tact. Note, a contact between two diseased patients is deemed ir-               a multi-resistant pathogen of special interest: the bacteria Klebsiella
relevant as both patients are already diseased (see Fig. 6 top). We             pneumoniae. K. pneumoniae is a commensal gut bacterium that is a
identify relevant contacts as shown in Fig. 6: the pathogen transmis-           dominant cause of hospital-acquired infections. It is responsible for
sion must have happened during a critical contact before the infection          infections in the urinary tract, respiratory tract and blood stream [40].
was detected – the time moment of the earliest positive microbio-                  In the first quarter of 2012 (actual date anonymized), the infection
logical result τ. For each Pi of P and each contact location L, we              control experts faced an outbreak of K. pneumoniae in an area with
determine the earliest critical contact before the infection is detected        four wards. Staff members work on all four wards and the patients
CCi,L = mints {Pj ,ts ,te ,ts ≤ τ : L(P) = L(Pi ) = L)}. We assume the          are frequently swapped between these locations. The total capacity of
starting time moment of the contact interval (ts ,te ) where tt = ts as the     the area is 50 beds. The outbreak investigation performed at that time
transmission event time, Lt is transmission location (Task 3) and Pt            was done manually by the infection control experts, meaning the data
is transmission contact. Note, P can have several potential transmis-           was collected from several systems and merged into spreadsheets. The
sion events – different persons and locations and different times. This         original analysis using classical epidemiological data assigned in total
analysis is repeated, especially for contacts with unknown infection            12 patients to the outbreak. However, a deeper analysis of the pathogen
status, as they could be potentially infected if they had contact to an         transmission was not possible.
infected patient before. These critical contacts are computed using
                                                                                   This use case shows how the infection control experts analyzed
a constrained path search in the DAG used for the layout. There is
                                                                                this outbreak retrospectively using the system. The interaction with
currently no bound on how far back or forward in time the transmission
                                                                                the system was supported by the visual analytics experts. Since the
events are searched, but user-specified bounds could be implemented,
                                                                                patient zero was not found during the first outbreak investigations, the
depending on the specifics of the investigated pathogen.
                                                                                experts aimed to trace back the initial source of infection and to identify
    In the view, the selected patient P is emphasized. Relevant contact pa-     potential cases that were overlooked at that time.
tients Pt are kept and the non-relevant patients are de-emphasized. The            First, the infection control expert consults the epidemic curve for
positive test/screening events τ are highlighted with ellipses (orange for      K. pneumoniae of the first months of 2012 for the entire hospital to
carrier and red for diseased) and connected to potential transmission           assess the number of infected patients (Task 1). The data was cleaned
events (tt , Pt , Lt ) with flashback lines inspired by [48] (see Fig. 7 & 8).   for copystrains (repeated samples of the same patients), allowing to
The circle color encodes the type of relevant contact (Task 2.1). We            focus on new positive results (see Fig. 9a). Only a small increase in the
show all possible transmission events – i.e., several flashback lines.           number of infections at the hospital has occurred. Thus, this outbreak is
Connections indicate the length of time the potential infection was not         difficult to detect automatically. Based on his expertise, his focus turns
detected by the screening or testing (Task 4).                                  to the four wards, S276, S278, S279, and S295 (see Fig. 9b), where
                                                                                the outbreak was initially localized. The numbers of new infections
6     C ASE S TUDY                                                              in February in the wards were: 1 patient (S276), 3 patients (S278)
The visual analytics system was applied to real data from a large Ger-          and 9 patients (S279) (see Fig. 9b). The number of newly infected
man hospital by an infection control expert. The anonymized data                patients on the wards was higher than the endemic level assuming an K.
includes hospital location data of ∼180,000 patients and ∼900,000               pneumoniae outbreak on the ward.
microbiological data over four years. The focus of the case study is               The expert begins to reconstruct the transmission pathway (Task 2)

            Authorized licensed use limited to: SLUB Dresden. Downloaded on February 01,2021 at 06:34:47 UTC from IEEE Xplore. Restrictions apply.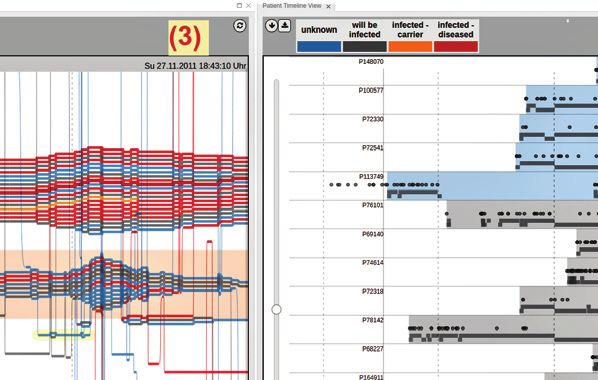
BAUMGARTL ET AL.: IN SEARCH OF PATIENT ZERO: VISUAL ANALYTICS OF PATHOGEN TRANSMISSION PATHWAYS IN HOSPITALS717
3 3
3
3
3
Figure 8: Backward tracing of pathogen transmissions of patient P68475 – indirectly via patient P76101’s contact with two patients on ward S295.
and visualizes all positively tested patients on the wards in the Trans-
mission Pathway View (see supplementary material and Fig. 7). In
total, there were 23 infected patients, which is higher than the original
outbreak analysis showed. A dominant cluster of patients highlights
12 infected patients on ward S279 in winter 2011/2012. It reveals the
first infected patient, patient P68475, who was already tested positive
in November 2011 – three months before this cluster of K. pneumoniae
(Task 4). By using the forward tracing interaction from patient P68475,
the infection control expert identified further patients that were in con-
(a) Epidemic curve for new infections of K. pneumoniae– sum of whole hospital.
tact with this patient (see Fig. 7). Thus, patient P68475 is the cause for
the spreading of K. pneumoniae on ward S279, but not for all patients
in the outbreak.
Since there was no previous contact of patient P68475 with colonized
patients (carrier) or diseased patients (with K. pneumoniae) in ward
S279, the expert uses the backward tracing interaction to search for
potential contacts on other wards (see Fig. 8). The visualization showed
that patient P68475 had no direct contact to patients with positive
laboratory tests for K. pneumoniae. However, the tracing lines lead to (b) Epidemic curve for new infections of K. pneumoniae– suspicious wards.
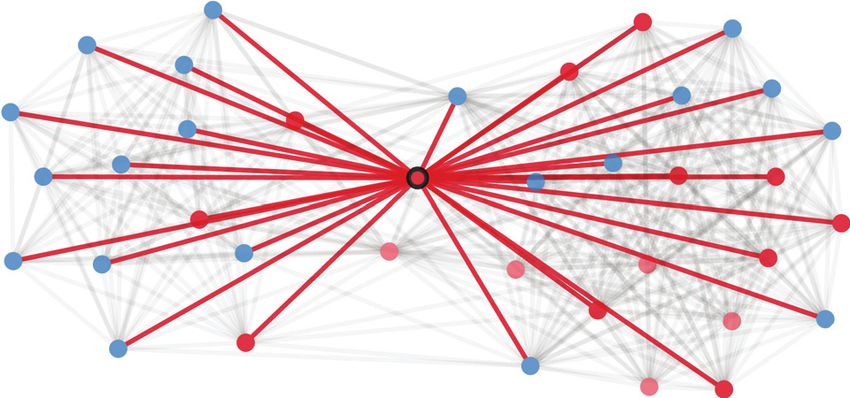
ward S95. As shown in the zoomed view of Fig. 8, patient P68475 had
contact with infected patients indirectly via patient P76101, who, in Figure 9: Epidemic curve with focus on the time period of interest:
turn, was in contact with two patients on ward S295 (Task 2.1). This Early-2012 indicates an higher number of new infections at ward S279.
is a novel insight. Both patients, P113749 and P108085, were tested
positive for K. pneumoniae. Thus, a possible transmission route of K.
pneumoniae to ward S279 could be via P113749/108985 − P761010 −
are provided in the annex in the supplementary material. The genome
P68475. As Fig. 8 shows, both patients are frequently returning to the
analysis confirms that eleven patients on the wards S279 and S295
hospital (many vertical lines from bottom) and usually stay for longer
were infected by one K. pneumoniae bacteria strain, including the
periods in the hospital (long horizontal lines). Forward tracing shows
potential patient zero candidate P113749. Interestingly, the two other
the potential beginning of the transmission events was before their first
potential patients zero P108085 and P152039 reveal substantial genome
admission to the hospital (see the start and the length of the tracing lines
differences to this set of patients (see Fig. A1 in annex). Thus, the expert
in Fig. 10). Patient Timeline View confirms this finding (see Fig. 11),
assigns P113749 as patient zero of this outbreak on the wards. The
where the first positive microbiological results (red vertical lines of
genome analysis reveals P1520395 as a further source of infection for
patient P113749 and P108985) are before the first hospital admission
at least one more patient on the wards. Thus, the two transmission
(Task 3.1). This is due to the limited dataset availability. The real
pathways occurred simultaneously (Task 2.3). This is a novel insight.
first admission was before the start of the available data. The forward
A further question is how many undetected transmissions the patient
tracing shows that both patients could infect patients at ward S295 and
zero P11349 had and whether there are potentially other infected pa-
S279 (see Fig. 10).
tients (Task 5). Therefore, the infection control expert opens a Contact
The Patient Timeline View (see Fig. 11) identifies a third infected Network View for this patient in the period when the initial transmis-
patient, patient P152039 on ward S276, who tested positive before sions were detected – beginning of November 2011 (see Fig. 12). The
the increase of infected patients occurs (see red vertical line in 2011). tracing interaction in this view highlights several potential transmis-
Since all patients had contact to several patients, these three patients sions to patients that were (not) detected as infected during their stay
are regarded as patient zero(s) and the potential origin for the K. pneu- on the wards. Transmission Pathway View and Patient Timeline View
moniae for this outbreak on the four wards S276, S278, S279 and S295 (see Fig. 1) show that the non-infected patients were screened (e.g.,
(Task 2& 3) with genetic analysis required for confirmation. rectal screening, urine, catheters) regularly and tested negative.
To provide further support and verification for the hypothesized The use case provides support that the visual analytics system en-
transmission pathways, the experts also used genome information of ables the infection control experts to conduct a classical epidemiolog-
the pathogen. Comparison of genomes of bacterial strains adds further ical analysis in a fast, reliable and comprehensive way. Highlighting
evidence to the analysis of outbreaks. Details of this external analysis potential transmission events enables to reveal transmission pathways
Authorized licensed use limited to: SLUB Dresden. Downloaded on February 01,2021 at 06:34:47 UTC from IEEE Xplore. Restrictions apply.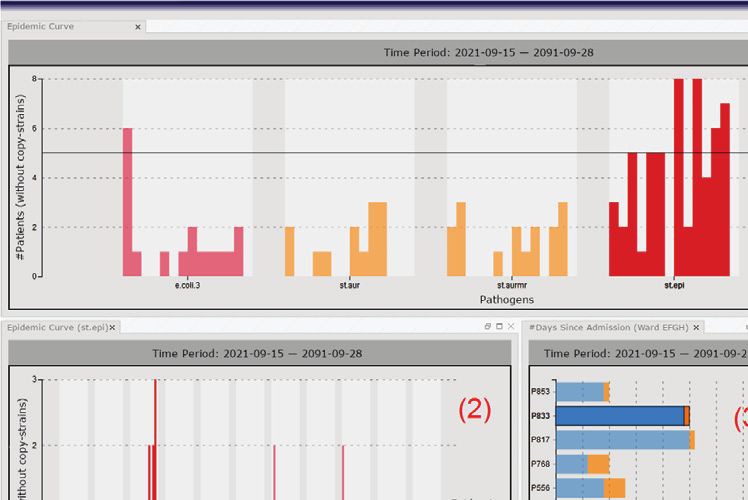
718 IEEE TRANSACTIONS ON VISUALIZATION AND COMPUTER GRAPHICS, VOL. 27, NO. 2, FEBRUARY 2021
3
Figure 12: Contact Network View: Patient 113749 could have infected
more patients in early November 2011.
Figure 10: Forward tracing for P113749 shows potential early start of
outbreak and transmissions to patients at wards S279, S295 and S278.
3DUWLFLSDQWV
)DPLOLDULW\ ,XQGHUVWDQGWKLVYLHZ QRWDWDOO IXOO\DJUHH
PRGH
DOO
QRQIDPLOLDU PRGH
3
3
IDPLOLDU
PRGH
3
3
3
3DUWLFLSDQWV
)DPLOLDULW\ 7KLVYLHZLVXVHIXO QRWDWDOO IXOO\DJUHH
3 DOO PRGH
3
QRQIDPLOLDU PRGH
3
3
IDPLOLDU PRGH
3
3
3
Figure 13: Understandability and usefulness of the view.
3
3
3
3
3 (Mo = 4) (see Fig. 13). As expected, participants familiar with the
3 tool gave higher scores. This result together with free text feedback
3
indicates that training is needed for using the approach effectively.
3
3
We also assessed how well the views supported the intended tasks
3
(see Fig. 14). Participants could identify contacts (Mo = 4) and un-
3
derstand their infection status (Mo = 5) (Task 2.1). They can clearly
3
identify patient stay duration and movement in or out of the hospital
(Mo = 4) (Task 3.1). Participants found it harder to identify the wards
(Mo = 3) (Task 3.2). The free text showed mixed reviews of using
Figure 11: Patient Timeline View of the outbreak patients sorted by
background color with some participants preferring it while others not.
time of first infection shows first infected patients already in 2011. The
Therefore, we interactively enable/disable this encoding.
red background indicates the infection status starting from the first
laboratory evidence of K. pneumoniae–shown as red vertical bar. Participants found the highlighting of potential transmission events
very useful (Mo = 4) and understandable (Mo = 4) (see Fig. 15). They
found the feature helpful in determining which contacts could lead to
a transmission and spreading of pathogens (Mo = 4, 5). The feedback
within the hospital. The steps taken for this analysis with our tool on support for long time periods when determining outbreak duration
took the hygienist 30 minutes. He estimated that this analysis would (Task 3) was also positive (Mo = 5). In free text, experts called for
normally take about two working days using his previous methods. The further pan and zoom support, which we revised in our visual interface.
hygienists usually determine the epidemic curves and contact networks The comparison of the network diagram and pathway views showed
manually through raw data from multiple information systems. that nine participants preferred Transmission Pathway View and six
7 D OMAIN E XPERT F EEDBACK participants preferred Contact Network View. Ten participants preferred
a combination of the two views. The distribution of preferences was
This qualitative evaluation focused on the Transmission Pathway View the same for both familiar and non-familiar participants. This result is
through an online questionnaire. Twenty-five domain experts from expected as the views target different tasks: “I need both views, as they
seven institutions in Germany participated in this evaluation. All partic- help find an answer to different tasks.” Transmission Pathway View is
ipants had several years of practical experience with infection control useful for detailed spatio-temporal analysis of transmissions and the
in hospitals: eleven were clinicians, epidemiologists or hygienists, six Contact Network View is useful for an overview of contacts without
were medical data analysis experts, six were medical data experts, and temporal focus (e.g., finding a “super-spreader”).
two were healthcare managers. Overall, 60% of the participants were
familiar with our interactive visualization, i.e., have participated in
feedback sessions, or had seen a live demonstration of the tool. At the ,VHHFOHDUO\ QRWDWDOO IXOO\DJUHH
ZKHQSDWLHQWVFKDQJHZDUG
beginning of the experiment, a one- paragraph explanation of each view ZLWKZDUGEDFNJURXQG PRGH
was provided with no further training. ZKHQSDWLHQWVFKDQJHZDUG
ZLWKRXWZDUGEDFNJURXQG
PRGH
The online questionnaire showed the views from the use case and LILWLVWKHILUVWDGPLVVLRQWRKRVSLWDO PRGH
asked participants to read these visualizations and answer the usability ZKHQSDWLHQWVDUHLQIHFWHG PRGH
and understandability questions as presented in Fig. 13–15. Participants ZKHQSDWLHQWVKDYHFRQWDFW PRGH
rated their answers to each question on a Likert scale: 1–5, with 5
meaning ’fully agree’ and could provide free text comments.
Participants found the view useful (Mo = 5) and easy to understand Figure 14: Results for readability of the views.
Authorized licensed use limited to: SLUB Dresden. Downloaded on February 01,2021 at 06:34:47 UTC from IEEE Xplore. Restrictions apply.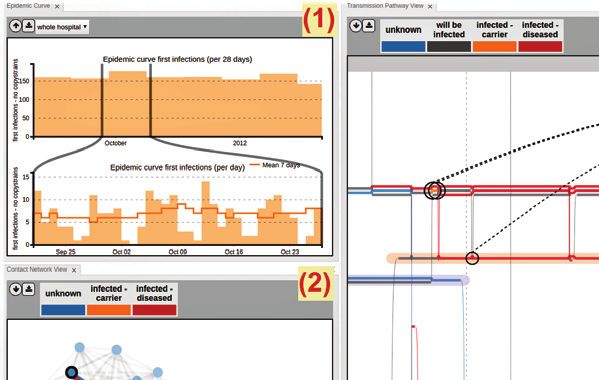
BAUMGARTL ET AL.: IN SEARCH OF PATIENT ZERO: VISUAL ANALYTICS OF PATHOGEN TRANSMISSION PATHWAYS IN HOSPITALS719

                                                             QRWDWDOO    IXOO\DJUHH
                                                                                                                              Layout   Edge crossing      Runtime (ms)      Pre-processing (ms)
            ,XQGHUVWDQGWKLVYLHZ                                                                       PRGH
                                                                                                                               Our       25a (37b )           197                   18
        ,WKLQNWKLVYLHZLVXVHIXO                                                                      PRGH
+LJKOLJKWLQJLVXVHIXOWRUHFRJQLVH                                                                                           [37]         14                160                  N/A
                                                                                                          PRGH
ZKLFKFRQWDFWVKDYHOHGWRGLVHDVH
7UDQVPLVVLRQ3DWKZD\LVVXLWDEOH                                                                         PRGH
      WRYLVXDOL]HORQJWLPHVSDQV

           Figure 15: Results for questions on tracing interaction.

    The free text feedback was positive: “Interesting and well thought-
out visualization. I was very enthusiastic about the presentation of this
                                                                                                                          Figure 16: Layout quality using Matrix dataset [65]. (a ) comparable to
visualization. The visualization of such complex data is not-trivial.”
Participants found some training was required, but after understanding                                                    Storyflow [37], (b ) - including start/end lines.
it, they found it very useful: “I find the Transmission Pathway View
really good. Of course, one has to get used to it first and learn to use
it first.” One expert suggested broader applicability “I would strongly                                                    patients remain infected for the remainder of the data set, which is
recommend this visualization to be shown to public health authority                                                       often not the case. These data need to be extracted from the current raw
(Gesundheitsamt). It could be ‘fit for purpose”’.                                                                          data by new algorithms. These algorithms have to be adjusted to the
    The participants found that scalability in terms of the number of                                                     ward, the patient-type, the type of pathogen and the tests. Additional
patients posed a significant challenge. They recommended a two-staged                                                      features, like the comparison and matching of antimicrobial profiles
process with filtering through the contact network and then show the                                                       simultaneous with the integration of genomics results of the pathogens
filtered data in the Transmission Pathway View. Four of the twenty-five                                                     would help the infection control expert automatically cluster patients
participants wanted to change the colors (e.g., showing each patient                                                      according to strains to better identify transmission pathways. We used
in a different color, using more prominent colors for the three areas                                                     an external tool to perform genome analysis to verify the suggested
(home, hospital, temporary home)). One participant requested further                                                      transmission routes. The genome analysis visualization is not part of
differentiation between carrier and diseased, as it is important for                                                      our system. However, since laboratories have access to near real-time
certain pathogens. A number of future extensions were suggested that                                                      genome analysis, this data can be extracted and used for matching
mainly require additional data. We discuss them in Sect. 8.                                                               specific pathogens to help verify the transmission pathway hypotheses.
                                                                                                                          Moreover, the visual interface could be extended to support provenance
8     D ISCUSSION             AND        F UTURE W ORK                                                                    of analysis and interaction. In the future, it would be interesting to
                                                                                                                          encode the mode of transmissions (e.g., airborne or contact) or other
The Transmission Pathway View layout was specifically designed for                                                         potential risk factors (e.g., diabetes, immunotherapy).
our tasks rather than to optimize edge crossing and wiggles. Still, the                                                      Our approach was designed and implemented for transmission
approach performs well on the benchmark Matrix dataset, with 14                                                           pathway reconstruction in hospitals. A modified version of the
entities and 90 transfers [65] (see Fig. 16). We used a laptop PC with an                                                 system has now been deployed in several hospitals for analyzing
Intel i7-9750H CPU (2.6 GHz) and 32GB memory. Pre-processing lasts                                                        COVID-19 hospital-associated transmissions (see video in German at
18 ms, the initialization stabilized after 30 iterations (62 ms) and force-                                               https://youtu.be/HAsb3dnUKyI). More generally, our approach could
directed layout after 10 iterations (135 ms). The layout of use case with                                                 be used to visually analyze contact tracing graphs of localized outbreak
27 entities and 704 transfers and the same number of iterations lasted                                                    clusters and in closed environments, such as cruise ships and buildings.
2517ms in total (190ms + 1265ms + 1062ms). The computation of                                                             The approach could be applicable to different definitions of spread,
tracking interaction for all critical patients lasted 37ms in total.                                                      such as financial or information contagion. The tracing interaction
    Our data sets pose visual scalability challenges in terms of the time                                                 could help with this reconstruction, but it needs to be adapted to the
spans of the data sets, number of patients, number of locations, number                                                   specifics of the application. For example for information spread, the
of patient transfers, and the number of screenings and tests. Interaction                                                 model would take the beliefs about the information, i.e., whether a
is leveraged to allow the approach to scale to larger data sets, combining                                                person supports or opposes the information [9] into account.
several views and automatically highlighting transmission pathway
events. They allow to explore pathways of up to hundred patients (see                                                     9    C ONCLUSION
Annex). Explicitly visualizing the number of forward and backward
connections of a patient would help the system scale when tracing                                                         In this paper, we have presented a visual analytics system for visualizing
contacts. Other methods for increasing the scalability of our approach                                                    transmission events and outbreaks in hospitals. The approach focuses
should be investigated.                                                                                                   on methods for reconstructing the transmission pathways for a certain
                                                                                                                          pathogen back to a patient zero. This visual analytics approach was
    The visual design of Transmission Pathway View relies heavily on
                                                                                                                          developed through iterative, user-centered design with seven German
colors to encode infection status and wards, limiting the number of
                                                                                                                          Hospitals and Infection Control Institutes or Units. As part of the design
wards that can be represented. Automatic detection of suspicious wards
                                                                                                                          process, storyline visualizations were adapted to visualize temporal
(i.e., a sudden increase in the number of cases) would help with this
                                                                                                                          contact networks. Our approach was applied to a real outbreak of
scalability along with forms of automated support. In order to scale a
                                                                                                                          Klebsiella pneumoniae in a large German hospital. Infection control
larger number of wards, interactive highlighting could help and hulls
                                                                                                                          experts were able to effectively unravel the outbreak and reveal two
could improve space efficiency [67]. The expert feedback indicated a
                                                                                                                          distinct transmission pathways. Tracing back the initial source, patient
need for enabling annotations to the visualizations with genome data or
                                                                                                                          zero was conducted in a faster and in a more comprehensive way when
measures taken during the outbreak, which could be implemented.
                                                                                                                          compared to existing methods. In our final qualitative user study of
    The data collection methodology and privacy considerations pose
                                                                                                                          twenty-five users, we found significant value in the approach when
limitations on what can be analyzed. A core challenge is localizing
                                                                                                                          making sense of outbreaks in hospitals.
contacts accurately, which is currently handled via electronic health
records. More accurate data on patient mobility through the hospital,
locations of rooms and beds, as well as information where procedures                                                        Acknowledgments We would like to thank all infection control
occur (e.g., surgery, endoscopy, radiography) could be helpful for                                                        experts involved, in particular A. Wulff, P. Biermann, S. Rey, C. Baier
certain visual analytics tasks. Technologies, such as RFID, could be                                                      and M. Kaase, for their helpful feedback. This work was supported
used, but would incur significant privacy considerations. Also, current                                                    by the German Federal Ministry of Education and Research (BMBF)
records do not confirm when a patient has been recovered. Therefore,                                                       within the Medical Informatics Initiative (01ZZ1802B/HiGHmed).

              Authorized licensed use limited to: SLUB Dresden. Downloaded on February 01,2021 at 06:34:47 UTC from IEEE Xplore. Restrictions apply.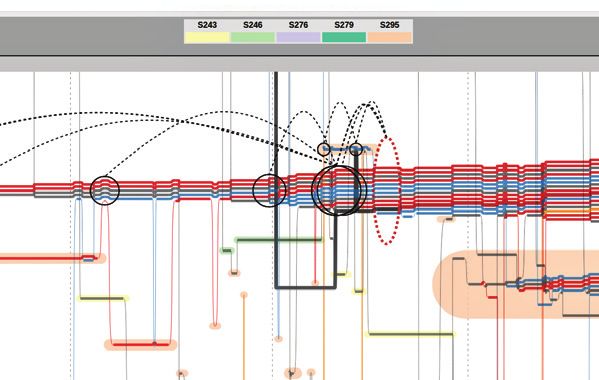
You can also read