Audubon's Birds and Climate Change Report - Conservation Science, National Audubon Society
←
→
Page content transcription
If your browser does not render page correctly, please read the page content below
Audubon’s Birds and Climate Change Report
Conservation Science, National Audubon Society
The National Audubon Society has spent the past century protecting birds.
Now we are prepared to work on their behalf in the 21st century.
Table of Contents
Audubon’s Climate Science Products		                           3     PART V: Expanded Methods for Audubon’s
                                                                     Climate Science					21
PART I: Conservation Status of North American
                                                                     The Importance of Scale				                        21
Birds in the Face of Future Climate Change		  5
                                                                     Climate Change Models and Uncertainty		            21
Summarizing the Science				4
                                                                     Materials and Methods				22
Introduction						4
SECTION CURRENTLY UNDER PEER-REVIEW.                                 Climate data						23
Methods						5
For a detailed look at the methods, refer to                         Bioclimatic Envelope Models				24
Results							5
PART V Expanded Methods, page 21.                                    Modeling algorithms					25
Conclusions						5
                                                                     Predicting distributions and characterizing ranges 25
Suggestions for Further Reading			            7
                                                                     Glossary of Terms					26
PART II: Prioritizing Climate Strongholds
for North American Birds				              8
                                                                     Appendix A: Bioclimatic variables used to
Summarizing the Science				8                                         model bird distributions				29
Introduction						8
Methods						8                                                       Appendix B: Sources of future climate data                       30
Results							10
Conclusions						12                                                  Appendix C: Flowchart for working with
                                                                     climate science data products			                                 31
Suggestions for Further Reading			 12

PART III: Applications of Audubon’s                                  Appendix D: FAQ for Audubon’s climatic
                                                                     suitability maps					32
Climate Science					13
Introduction						13
                                                                     Appendix E: FAQ for Audubon’s climate
Priority Species					13                                              prioritizations					33
Important Bird Areas					13
Climate Prioritizations and Land-Use			 14                           Appendix F: Accessing the Data			                                35
Conclusions						15

PART IV: Guidance on the Use and
Interpretation of Audubon’s Climate Maps		  16
Introduction						16
Creating the Maps					16
Interpretation of Maps				16
Over- and Under-Prediction				18
What about Extinction?				19
Extent							19
Using Audubon Climate Maps for Conservation
Decisions: Caveats and Limitations			       19
Habitat							19
Sea Level Rise						20
Predation, Competition, and Dispersal		     20
Migratory Species					20
Suggestions for Further Reading			          20

 Citation: National Audubon Society. 2014. Audubon’s Birds and Climate Change Report: A Primer for Practitioners. National Audubon Soci-
 ety, New York. Contributors: Gary Langham, Justin Schuetz, Candan Soykan, Chad Wilsey, Tom Auer, Geoff LeBaron, Connie Sanchez, Trish
 Distler. Version 1.2.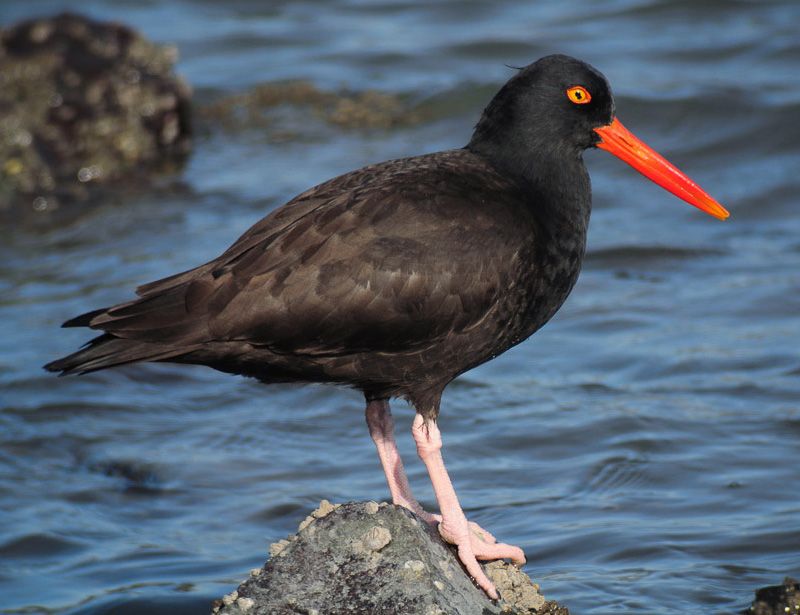
Audubon’s Climate Science
The National Audubon Society has completed a continental Please take the time to review this document to better
analysis of how North America’s birds may respond to future understand all the work that has been done. Then, begin to
climate change. Using extensive citizen science data and imagine how this science can support ongoing projects as well
detailed climate layers, we developed models that characterize as create new opportunities to promote bird conservation.
the relationship between the distribution of each species Contact climatescience@audubon.org for more information or
and climate. Then, we used our models to forecast species for assistance in obtaining, interpreting and analyzing species
distributions to future time periods based on climate estimates maps and prioritizations.
described by the Intergovernmental Panel on Climate Change
(IPCC). This core set of analyses will serve as the backbone
for informing bird conservation in North America through CLIMATE SENSITIVITY LISTS
planning tools for land managers, reports focused on species • Identify climate endangered, threatened, data
of conservation concern, and peer-reviewed publications deficient, and stable species
addressing the impacts of climate change on birds. We • Based on projected changes in climatic suitability
addressed three topics of general interest for broad-scale bird for each species
conservation, which we summarize here and on Audubon’s
website: (1) the impact of climate change on bird diversity INDIVIDUAL SPECIES MODELED CLIMATIC
in the United States and Canada (Part I); (2) identification of
SUITABILITY
areas that are expected to remain important to birds under the • Single-species climatic suitability maps
present and future climate (Part II); and (3) in-depth analyses • Current and future ranges
of potential climate change impacts on 314 species (online at
• Three future emissions scenarios each informed
audubon.org/climate). by multiple general circulation models
This document is a guide to Audubon’s climate science analysis. • Three future time periods
In the following pages, you will find descriptions of the work, • Visualizations available at Audubon.org/climate
along with definitions of key terms, practical guides to using
the data and maps, and examples of how Audubon’s climate CLIMATE PRIORITIZATIONS
science can enrich your ongoing programs.
• Spatial prioritizations providing the relative rank
of locations on the landscape
Audubon’s Conservation Science team has generated three
data products (Box 1). Each offers a distinct way to engage with • Available for summer, winter, or both seasons
the science. First, there are lists of climate-sensitive species, • Single-species
with potentially broad application to all users. Second, there
• Multi-species
are maps of modeled climatic suitability under a range of
climate change scenarios across three future time periods. • Integrated assessments of current and future
climatic suitability
These are available as animated illustrations on Audubon’s
website (e.g. Fig. 1.1) and as data through ArcGIS desktop.
Box 1. Audubon’s Climate Science products.
Third, we have integrated the climate change projections into
spatial prioritizations. These prioritizations highlight areas
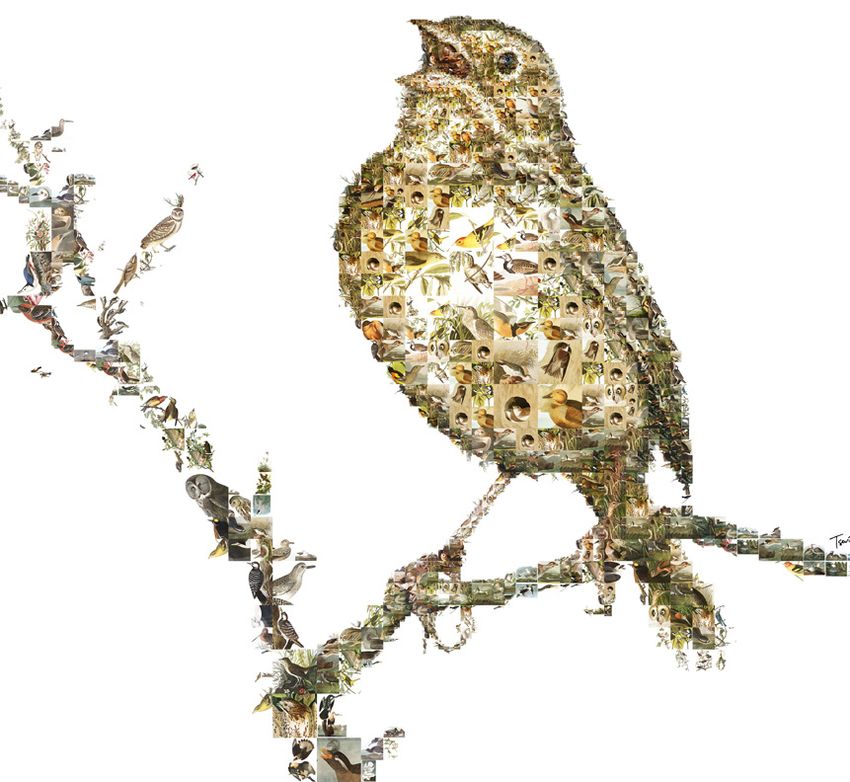
on the landscape that are likely to offer suitable climates for About the cover:
This photo mosaic of a Baird’s Sparrow
a single species or multiple species today and into the future.
was created by Charis Tsevis using
Prioritizations should have broad appeal throughout the bird fragments of John James Audubon’s
conservation community. They can be used to strengthen the paintings of some of the bird species
identified in the Audubon report as being
justification for projects already underway as well as to identify
under threat. Baird’s Sparrow reference
new areas in need of conservation attention. photo: Gerrit Vyn.
Birds and Climate Change | National Audubon Society | Conservation Science | September 2014 3
Figure 1.1. A sample climatic suitability map from Audubon.org/climate. This sequence of four maps reflects the four
modeled time periods (2000s [top], 2020s, 2050s, and 2080s [left to right along bottom]) and are shown in sequence as
an animated GIF online. Yellow and blue outlines are the current core climatically suitable range. Shaded yellow and
blue areas are modeled climatically suitable range in summer and winter, respectively. The darker the color, the more
climatically suitable the location. See Audubon.org/climate for climatic suitability projections of the 314 climate-threatened
and endangered birds. See Appendix D for responses to frequently asked questions about climatic suitability maps.

Birds and Climate Change | National Audubon Society | Conservation Science | September 2014                                      4
PART I:
Conservation Status of North American Birds
in the Face of Future Climate Change
Summarizing the Science
Increasingly, human-induced climate change is recognized
as a fundamental driver of biological processes and patterns.
Historic climate change is known to have caused shifts in
the geographic ranges of many plants and animals, and
future climate change is expected to result in even greater
redistributions of species. Using statistical models based on the
North American Breeding Bird Survey and Audubon Christmas
Bird Count datasets, we assessed geographic range shifts
through the end of the century for 588 North American bird
species during both the summer and winter seasons under a
range of future climate change scenarios. Our analysis shows
the following:

1. 314 of 588 species modeled (53%) lose more than              Figure 1.1. Historical (1900-2000) and mean simulated future
                                                                 warming (2001-2100) under three greenhouse gas emissions
                                       SECTION
   half of their current geographic range            CURRENTLY
                                          in all three modeled UNDER    PEER-REVIEW.
                                                                 scenarios (B1, A1B, A2). Source: Adapted from Figure SPM.5,
   scenarios. For a detailed look at the methods, refer toIPCC     PART
                                                                      WG1V2007.
                                                                              Expanded Methods, page 21.

2. For 126 species, loss occurs without accompanying range
   expansion.

3. For 188 species, loss is coupled with the potential
   to colonize new areas.

Climate sensitivity is an important piece of information
to incorporate into conservation planning and adaptive
management strategies. The persistence of many North
American birds will depend on their ability to colonize
climatically suitable areas outside of current ranges and
management actions that target climate change adaptation.

Introduction
Audubon’s Strategic Plan highlights a commitment to climate
change mitigation and adaptation. Mitigation includes
advocating for reductions in greenhouse gas emissions and
clean energy policies as well as bird-friendly siting of energy
development, whereas adaptation focuses on preparing species
and ecosystems—through Audubon’s conservation activities—
for changes that accompany a shifting climate.

To further understand the adaptation needs of individual
species, Audubon has used the Christmas Bird Count (CBC)
and North American Breeding Bird Survey (BBS) databases to
model how birds are likely to respond to future climate change.
These projected responses were then used to identify species
particularly sensitive to climate change.

Birds and Climate Change | National Audubon Society | Conservation Science | September 2014                                     5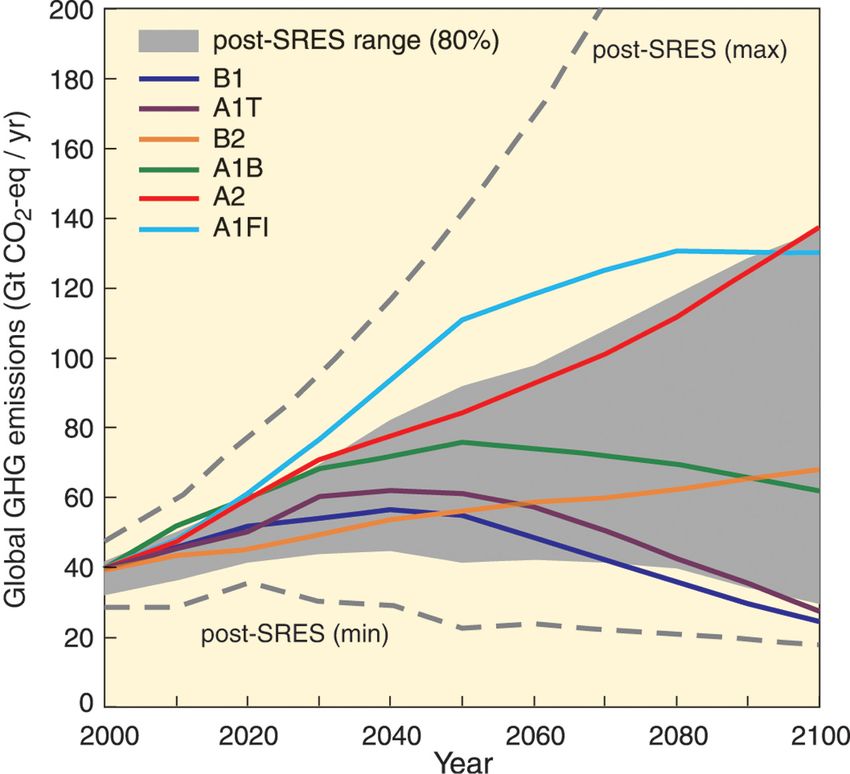
Methods                                                                 projections to generate a single climate projections for each
                                                                        time period and scenario.
We used historical records of species occurrence (presence/
absence) in the summer (BBS) and winter (CBC) seasons along             Species were then assigned to climate sensitivity categories
with historical climate data to build bioclimatic models for 588        (Table 1.1) based on projected changes in their climatically
species of North American birds. Models identify characteristics        suitable range over time.
of seasonal and annual climate corresponding to where a
species is found. The 17 biologically relevant climatic variables
                                                                        Results
(Appendix A) used are based on historical monthly temperature
and precipitation averages and totals and characterize annual Based on the loss of current climatic range and potential gain
and seasonal conditions. Models were built using boosted      of new climatic range, we classified 126 species (21.4%) as
regression trees, a machine-learning algorithm acknowledged   climate endangered, an additional 188 species (32%) as climate
for its ability to detect complex, non-linear relationships   threatened, and 274 (46.6%) as climate stable (n = 228) or low
between seasonal climatic conditions and where a species is   risk (n = 46). These designations are based on the rate and
found.                                                        amount of change in modeled climatically suitable range (e.g.
                                                              Fig. 1.2). Defining climate endangered and threatened species
 Classification     Description                               as those projected to lose >50% of their current climatically
                    Projected loss of >50% of current range   suitable range by 2050 and 2080 is a useful, but somewhat
                                                              arbitrary definition. Some species fall on the border of two
                    by 2050 across all scenarios with no net
                                                              classifications and may merit conservation action.
                    gain from range expansion
                                     SECTION CURRENTLY UNDER PEER-REVIEW.
                    Projected loss of >50% of current
                For a detailed look at the methods, refer to  Conclusions
                                                                 PART V Expanded Methods, page 21.
 Climate            range by 2080 across all scenarios
 Threatened         with possible net gain from range         More than half (314 of 588) of North American bird species
                    expansionroj                              were classified as climate endangered or threatened in this
                                                              century across a range of future climate projections, including
                    Projected loss of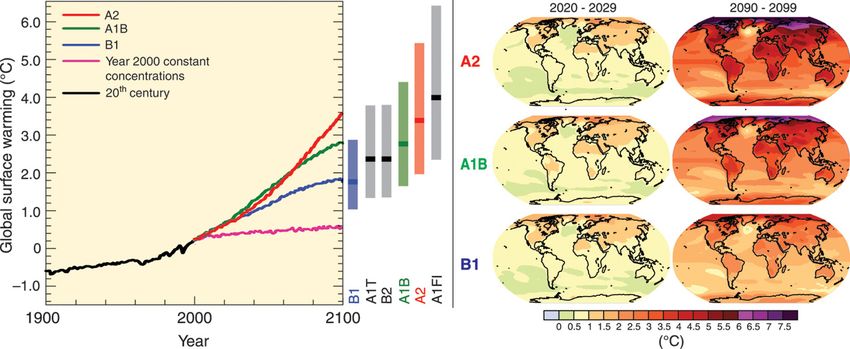
Data-deficient species should not be overlooked as a
conservation priority. Many occur in northern latitudes not               Contact climatescience@audubon.org for more information on
well-covered by the CBC or BBS surveys. However, these regions            Audubon’s Birds and Climate Change report or for assistance
will likely be most impacted by climate change. Improved                  in obtaining, interpreting and analyzing species maps and
monitoring of data-deficient species will allow us to assess their        strongholds rankings.
climate sensitivity.

Climate-stable species are of lower conservation concern when
thinking about the climatic stability of their geographic range.
However, a climatically stable species could still be at risk
from traditional conservation threats (e.g., habitat loss), and
indirect effects of climate change that fell outside the scope of
this study (e.g., sea level rise). In addition, our assessment may
underestimate risks for Neotropical migrants because we were
unable to model their responses to climate change on wintering
grounds in Central and South America.

Suggestions for Further Reading
Elith, J., J. R. Leathwick, and T. Hastie. 2008. A working guide
to boosted regression trees. Journal SECTION        CURRENTLY
                                        of Animal Ecology  77:802– UNDER PEER-REVIEW.
813.               For a detailed look at the methods, refer to PART V Expanded Methods, page 21.

Hijmans, R.J., S.E. Cameron, J.L. Parra, P.G. Jones, and A. Jarvis.
2005. Very high resolution interpolated climate surfaces for
global land areas. International Journal of Climatology 25:
1965-1978.

Solomon, S., D. Qin, M. Manning, Z. Chen, M. Marquis, K.B.
Averyt, M. Tignor and H.L. Miller (eds.). 2007. Contribution
of Working Group I to the Fourth Assessment Report of the
Intergovernmental Panel on Climate Change, Cambridge
University Press, Cambridge, United Kingdom and New York, NY,
USA.

Link, W. A., J. R. Sauer, and D. K. Niven. 2006. A hierarchical
model for regional analysis of population change using
Christmas Bird Count data, with application to the American
Black Duck. Condor 108:13-24.

McKenney, D.W., M. F. Hutchinson, P. Papadopol, K. Lawrence,
J. Pedlar, K. Campbell, E. Milewska, R. F. Hopkinson, D. Price,
and T. Owen. 2011. Customized Spatial Climate Models for
North America. Bulletin of the American Meteorological Society
92:1611-1622.

Sauer, J., J. E. Hines, J. E. Fallon, K. L. Pardieck, D. J. Ziolkowski,
Jr., and W. A. Link. 2012. The North American Breeding Bird
Survey, results and analysis 1966–2009. USGS, Laurel, Maryland.
Version 3.23.

Birds and Climate Change | National Audubon Society | Conservation Science | September 2014                                         7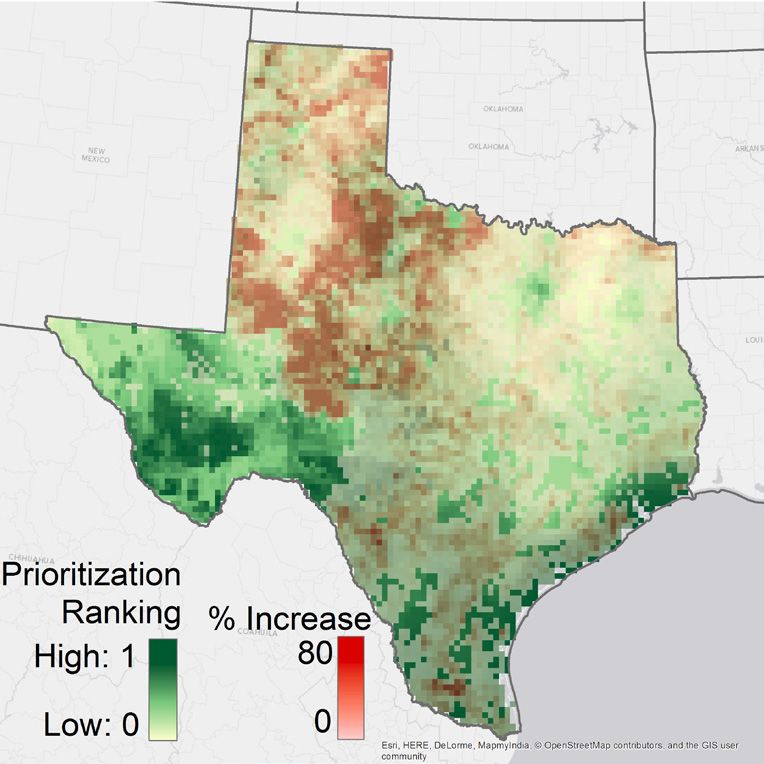
PART II:
Prioritizing Climate Strongholds for
North American Birds
Summarizing the Science                                                We generate both single-species prioritizations for 588 North
                                                                       American bird species and a multi-species prioritization for 314
Spatial prioritizations rank locations across a landscape              climate endangered and threatened species.
according to their relative value for attaining a conservation
goal, such as the protection of a priority species. This is useful
                                                                       Methods
for identifying areas of maximum return on conservation effort.
Audubon seeks to identify areas that are likely to be suitable         Single- and multi-species prioritizations were generated using
for a given species or suite of species today and under future         Zonation spatial prioritization software. In a single-species
climatic conditions. Therefore, we built spatial prioritizations       prioritization, Zonation ranks each 10 x 10 km grid cell based on
based on shifts in climatic suitability for each of 588 species in     its contribution toward protecting a species’ current and future
North America as well as a multi-species spatial prioritization        climatically suitable range.
for the 314 climate-endangered and threatened species. We
incorporated the inherent uncertainties of climate projections
and species responses into our analysis. Both single- and multi-

                                                                         ABILITY TO COLONIZE NEW AREAS
species prioritizations represent a useful way to synthesize
                                                                                                         High   “track and move”     unpredictable
Audubon’s projections of climate impacts on birds. Areas within
these spatial prioritizations with the highest relative ranking
represent climatic strongholds.
                                                                                                         Low    “suffer in place”   “adapt in place”
Introduction
As described in Part I, Audubon has generated maps of                                                                 Low                High
projected climatic suitability under a range of future time
periods and greenhouse gas emission scenarios. Here,                                                                TOLERANCE OF NEW CLIMATES
we outline how these projections can be synthesized into
landscape prioritization maps for individual or multiple species.
                                                                       Figure 2.1. Conceptual diagram characterizing possible
Critical to this process is the treatment of uncertainty across
                                                                       biological responses to climate change.
climate-impacts projections. Sources of uncertainty include the
emissions scenario considered (SRES B2, A1B, A2) and variation
across future time periods (2020s, 2050s, 2080s). In addition,
there are biological uncertainties, because we cannot be certain
how species will respond to future climate change even though
we have carefully modeled their historical responses.

We identified three views on biological uncertainty (Fig. 2.1) and
explored the implications of adopting these views. First,
a species might track and move with its shifting area of climatic
suitability. Second, a species may be unable to move, staying
in its current range and suffering in places that become
climatically unsuitable. Finally, species may be more plastic
than is currently understood and be able to adapt in place to
a changing climate. Highly mobile and flexible species form
a fourth group whose potential responses are very difficult to
anticipate within a climate change framework.

Birds and Climate Change | National Audubon Society | Conservation Science | September 2014                                                            8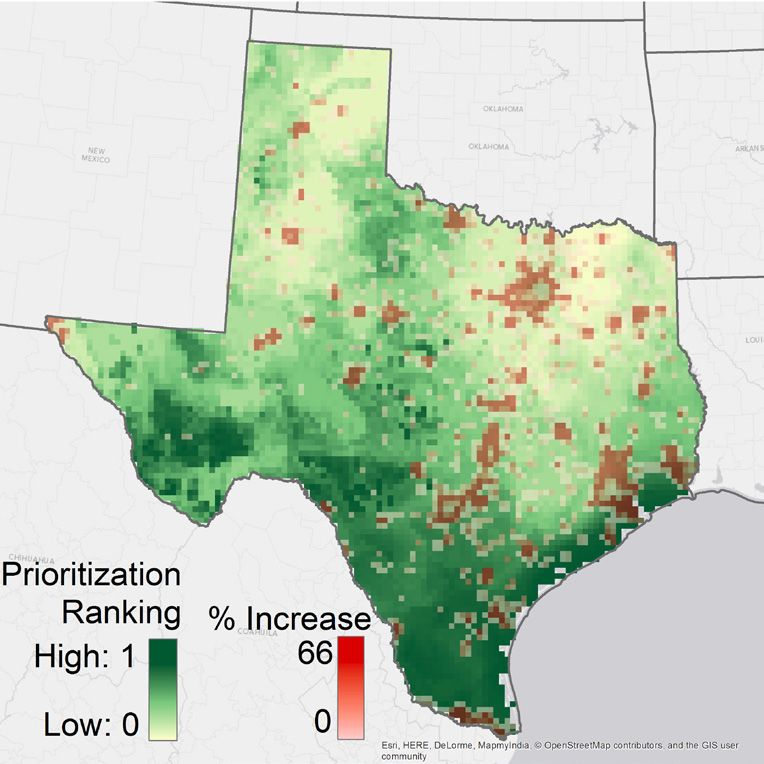
Figure 2.2. Spatial prioritization process for the Tree Swallow (Tachycineta bicolor). Start with the species’ current modeled
climatic suitability in summer (A) and future climatic suitability according to the three proposed biological responses (B).
Then generate spatial prioritizations corresponding to each of the three biological responses (C) and ensemble them into a
single “hedge your bets” prioritization (D).

Birds and Climate Change | National Audubon Society | Conservation Science | September 2014                                      9
Uncertainty due to emissions scenarios and variation across
future time periods (2020s, 2050s, 2080s) are incorporated by WHAT IS A SPATIAL PRIORITIZATION?
ensembling projections. Biological uncertainty is captured in • NOT a species range map.
the prioritization by treating the future climatically suitable
• A ranking of the landscape based on climate for the
range as (1) opportunity, (2) risk, and (3) ignoring it. These
conservation value of one or more species.
correspond to the biological responses: “track and move”,
“suffer in place”, and “adapt in place”, respectively (Fig. 2.1). • Incorporates information from multiple climate
Three prioritizations are built for each season (summer and scenarios, time periods in the future, and hypotheses
winter) and combined by taking the maximum score for about how birds might respond to climate change into
any grid cell across all three prioritizations and rescaling the a single map for conservation planning.
result between 0 and 1.
WHAT IS A CLIMATE STRONGHOLD?
We also generated a multi-species prioritization for the 314
• An area that is relatively valuable for retaining one or
climate-endangered and -threatened species. With multiple
more bird species while accounting for the potential
species, Zonation highlights areas with climates that will
effects of future climates on their distribution.
allow for conservation of many species (especially rare ones)
into the future. For this reason, when working with a group • The concept of a climate stronghold is useful for
of species (e.g. grassland birds), it is critical to build a multi- developing long-term conservation plans at a variety
species prioritization rather than summing or averaging across of spatial scales.
the single-species prioritizations for each group member (see
• Could be defined as some highest percentage (top
Conclusions for more information).
5 or 10%) of ranked pixels on the landscape (be it at
a local, state, regional, or national scale).
Results
Projected range shifts across future emissions scenarios Box 2. Climate prioritizations and strongholds.
and time periods can be represented by range expansion,
contraction, or stasis, depending on the assumed
biological response (Fig. 2.2, row B). Prioritizations based
on each of these assumptions differ, but those differences
are minimized when the prioritizations are combined,
or ensembled, into a final “hedge your bets” prioritization
(Fig. 2.2, row D).
In each prioritization, grid cell on the landscape are ranked
between 0 and 1, resulting in a high level of user flexibility (Fig.
2.3). For many applications, the top 5 or 10% of the landscape
may be of greatest interest for targeting conservation actions.
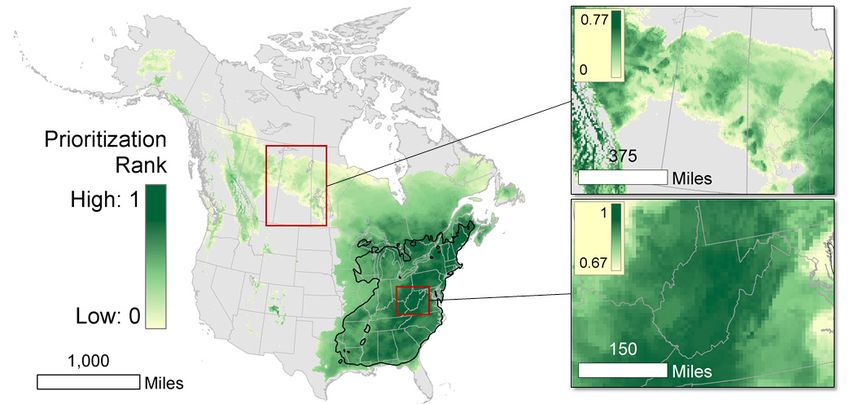
Prioritizations can be summarized at any spatial scale (Fig. 2.4).
A climate stronghold (Box 2) is therefore user-defined, but
represents some highest percentage of ranked grid cell on
the landscape at a local, state, regional, or national scale
(Box 2).
Birds and Climate Change | National Audubon Society | Conservation Science | September 2014 10Figure 2.3. Anatomy of a spatial prioritization for Wood Thrush (Hylocichla mustelina) in summer. Figure 2.4. Visualizing prioritizations at different spatial scales (Wood Thrush in summer). Note the map scale and range of stronghold rankings respresented at the state and province scale (insets) differs from the national scale. Birds and Climate Change | National Audubon Society | Conservation Science | September 2014 11
Conclusions
                                                                       Contact climatescience@audubon.org for more information on
Spatial prioritizations are an effective means of synthesizing         Audubon’s Birds and Climate Change report or for assistance
information across multiple future projections and species.            in obtaining, interpreting and analyzing species maps and
A single-species prioritization identifies areas likely to             strongholds rankings.
be climatically suitable today and tomorrow. These can
be combined with other spatial data inputs to develop a
conservation plan for the species that is robust to a range
of climate change futures and biological responses. See
Appendix E for an example of how one could represent
climate prioritizations in a map and responses to frequently
asked questions.

Multi-species prioritizations are useful for state, regional,
or national conservation planning. These are more than just
averaging across the single-species prioritizations because
multi-species prioritizations highlight areas with high species
diversity as well as hosting narrowly distributed species.
Contact climatescience@audubon.org for multi-species
prioritizations tailored to a given species set.

Suggestions for Further Reading
Bateman, B. L., H. T. Murphy, A. E. Reside, K. Mokany, and
J. VanDerWal. 2013. Appropriateness of full-, partial- and
no-dispersal scenarios in climate change impact modelling.
Diversity and Distributions 19:1224–1234.

Jezkova, T., V. Olah-Hemmings, and B. R. Riddle. 2011. Niche
shifting in response to warming climate after the last glacial
maximum: inference from genetic data and niche assessments
in the chisel-toothed kangaroo rat (Dipodomys microps). Global
Change Biology 17:3486–3502.

Moilanen, A., H. Kujala, and J. Leathwick. 2009. The Zonation
framework and software for conservation prioritization. Pages
196–210 in A. Moilanen, K. A. Wilson, and H. Possingham,
editors. Spatial Conservation Prioritization: Quantitative
Methods and Computational Tools. Oxford Univ. Press, Oxford;
New York.

Thuiller, W., B. Lafourcade, R. Engler, and M. B. Araujo. 2009.
BIOMOD - a platform for ensemble forecasting of species
distributions. Ecography 32:369–373.

Birds and Climate Change | National Audubon Society | Conservation Science | September 2014                                     12
PART III:
Applications of Audubon’s Climate Science
Introduction Once you have a list of climate-priority species, consider talking
with other conservation groups and agencies in your geography
Audubon’s climatic suitability maps and prioritizations were to look for synergies or redundancies.
completed to inform conservation programs. Here, we present
a set of examples demonstrating the application of Audubon’s Important Bird Areas
climate science.
Climate prioritizations are a useful conservation tool that
Priority Species can be combined with any spatial dataset to identify areas
of high conservation value for birds today and into the future.
Audubon’s climate change sensitivity classifications suggest The network of over 2,600 Important Bird Areas, identified
which species are most likely to be impacted by future climate. across the United States for their significance to current bird
Lists of climate-threatened or endangered species can be populations, is one example. Important Bird Areas serve as
compared or combined with existing priority species lists. the basis for many conservation efforts.
Climate-endangered species need help where they are, whereas
climate-threatened species need help where they are and with
moving to new sites in the future. Either of these conditions can
present a rationale for featuring a species as a priority species.
Figure 3.2. Important Bird Areas of Minnesota overlaid
upon a climate prioritization of 314 climate-threatened
and -endangered species.
Figure 3.1. The Black Oystercatcher was selected as
a climate priority species by Audubon California.
By integrating climate prioritizations and Important Bird Areas,
Photo credit: Len Blumin. we can strengthen our understanding of this network. Climate
prioritizations may contribute to the identification of new
Climate priority species can reinforce or complement existing Important Bird Areas as well as the validation of existing sites.
programs as well as provide the basis for a new conservation They can also be used to develop rankings of Important Bird
campaign. When building a list of climate priority species, Areas with respect to climate change for a particular state or
consider climate sensitivity along with other factors: geography of interest (Fig. 3.2). When considered along with
information on opportunities, capacity, and conservation
1. Selecting species from diverse regional geographies/habitats, efforts underway, climate prioritizations may help further define
where to work on conservation projects. Analyses integrating
2. F ocusing on species featured in existing conservation Important Bird Areas and climate prioritizations can inform
programs, efforts in policy, conservation planning, outreach, as well as
volunteer engagement.
3. C
omparing species’ climate sensitivity with their current
conservation status,
Birds and Climate Change | National Audubon Society | Conservation Science | September 2014 13Climate Prioritizations and Land-Use
For most species, habitat loss to development has been the
primary driver of population decline over the past century.
Climate change presents an additional threat to many species,
and it would be useful to identify areas where development
threatens potential climate strongholds.
Projected future land-use change has been produced by the
USGS EROS lab using the forecasting model FOR-SCE. For the
example below, we use simulated future land-use under a high
emissions scenario (A2) to estimate the development threat for
each grid cell in the climate prioritization. We define threat as
the simulated percent increase in developed land between 2005
and 2080.
For Texas, we then compare future development pressure
against each grid cell’s prioritization ranking to identify areas
that may be suitable for conservation work. Texas has a broad
range of climate prioritization rankings: highest along the
Mexican border and Gulf Coast and lowest in the panhandle
and northeast (Fig. 3.3).
Figure 3.4. Percent increase in urban (top) and agricultural
(bottom) development pressure overlaid on climate
prioritization rankings.
Figure 3.3. Climate prioritization rankings for Texas across
all climate threatened and endangered species in the
summer season.
Birds and Climate Change | National Audubon Society | Conservation Science | September 2014 14Development pressure will be high (increases >50%) in some areas (Fig. 3.4), particularly around Dallas-Fort Worth and Contact climatescience@audubon.org for more information on Houston (urban growth) and the Texas panhandle (agricultural Audubon’s Birds and Climate Change report or for assistance expansion). High-ranking climate strongholds along the coast in obtaining, interpreting and analyzing species maps and are most likely to be threatened by continued urbanization, strongholds rankings. whereas high-ranking sites in north-central Texas may be threatened by agriculture. A conservation strategy based on this analysis might embrace one of two approaches (Fig. 3.5). First, conservation actions could focus on high-ranking climate strongholds with low development pressure, the so-called “low-hanging fruit”. Second, conservation could focus on high-ranking areas with high likelihood for future development, the “biggest wins.” Conclusions The previous three examples—priority species, working with Important Bird Areas, and evaluating climate strongholds against projected future land-use—are just a few of the possible applications of Audubon’s climate science. One of the most exciting parts of the climate initiative is sharing this science across Audubon’s network of state offices, chapters and centers as well as with external partners, all of whom will explore the data and devise unique solutions to conservation problems. If you have a novel idea, contact climatescience@audubon.org to talk it through and confirm that it represents an appropriate application of the science. Figure 3.5. Alternative approaches toward setting conservation priorities incorporating both climate prioritization rankings and projected future development pressure. Areas in red have the greatest potential development pressure, whereas areas in blue are the highest-ranked climate strongholds. Purple areas are likely to be the hardest-fought conservation actions. Birds and Climate Change | National Audubon Society | Conservation Science | September 2014 15
PART IV:
Guidance on the Use and Interpretation of
Audubon’s Climate Maps
Introduction                                                           shades. Finally, a threshold can be chosen and the probability
                                                                       maps converted into binary presence/absence maps. The
Audubon recently released a series of maps showing the                 threshold is often chosen based on how accurately a model
projected responses of birds in North America to future climate        is able to discriminate between independent bird occurrence
change. These maps look similar to range maps in a field guide,        data not used in the modeling process (described below).
but they differ in important ways. Rather than showing the             Audubon scientists based this threshold on the kappa statistic.
geographic limits of a species’ distribution, these maps indicate
climatic suitability for a species or group of species. Questions      Choosing whether to represent values as continuous (color
of interpretation are likely to arise for bird experts with detailed   ramp) or discrete (binned or presence/ absence) depends on the
knowledge of bird distributions and conservation professionals         purpose of the map and aesthetics. Note that the maps can look
interested in using the maps for decision-making. Here, we             quite different even though they are built from the same values
provide guidance on the use and interpretation of Audubon’s            (Fig. 4.2). If a map of current range looks off to an expert, some
climate science.                                                       experimentation with binning values can often yield a map
                                                                       more consistent with expert opinion. All maps for that species
Creating the Maps                                                      should also be displayed in the same way, so that the whole
                                                                       set of maps for a season and species are comparable. This
As described in Part I, Audubon scientists used computer
                                                                       is important because we have no way to assess future maps
modeling to relate historical bird observations from the
                                                                       for accuracy, and we must compare maps displaying the
Audubon Christmas Bird Count (CBC) and the North American
                                                                       same thing.
Breeding Bird Survey (BBS) to a suite of climate variables.
In essence, they built a climate profile of each species across
a spectrum of temperature, precipitation, and seasonality
variables. With sufficient geographic coverage
and observations, models can describe the relationship
between bird occurrences and the climate space that favors
each species. This results in estimates of climatic suitability
in summer and winter for each species for every 10 x 10 km
grid cell across the continental United States and Canada
(e.g. Fig. 4.1)

The key value of modeling the relationship between bird
data and climate data is the ability to project that relationship
onto a map of future climate. Collectively, this provides insight
into of how each modeled species might respond to future
climate with a sense of both the magnitude and location of
these changes.

Interpretation of Maps
Within a climatic suitability map, the value of each grid
cell is a probability of occurrence based on climatic
suitability for the species. These can be converted into
maps that look like traditional range maps in a number
of ways. In a stretched color ramp, the strength of the color
represents the probability values. In a binned color scheme,
values are grouped and represented as solid colors or

Birds and Climate Change | National Audubon Society | Conservation Science | September 2014                                           16
Figure 4.1. Modeled climatic suitability for Common Loon (year 2000). Figure 4.2. Two visualizations of Common Loon (Gavia immer) summer range using the same base data but varying color ramp scales: stretch by 2.5 standard deviations (left) and classified by geometric interval (right). Birds and Climate Change | National Audubon Society | Conservation Science | September 2014 17
Clark’s Nutcracker
            Nucifraga columbiana

Figure 4.3. Example of climatic suitability map showing: (A) areas matching range maps, (B,C) areas that are climatically
suitable but not part of the current range, and (D,E) areas that are part of the current range but not modeled as being
climatically suitable.

Over- and Under-Prediction                                             This type of commission error occurs mostly in the Arctic.
                                                                       Under-predictions occurs where the projection shows a location
All probabilistic maps have areas where they over-predict              as unsuitable, yet the species is known to occur there in large
(errors of commission) and under-predict (errors of omission)          numbers. These errors are more serious than commission
the data. Over-prediction occurs where the projection shows            errors because they suggest that the models do not adequately
a location is suitable, yet the species is not recorded there.         sample climatic variables. Sampling problems are most likely
These situations are challenging to interpret because the              the result of the data sources: the CBC and BBS. Although
models only provide probabilities of occurrence based on               continental sampling for each survey is generally good,
climatic suitability. A species may not be present for biological      sampling is not uniform either spatially or temporally (Fig. 4.4).
reasons, such as interactions with other species (predation/
competition), or limited dispersal. So, the result may be              For bioclimatic models, sampling a diversity of climates is
perfectly accurate and yet differ dramatically from a range            more important than achieving uniform geographic sampling
map because the species cannot exploit certain parts of its            because large areas may have very similar climate and not
climatic range (e.g., Fig. 4.3, B). Another common commission          require dense sampling. Therefore, low sampling density in
error comes from incomplete sampling of a species range.               northern Canada, for example, is likely to impact some species
For example, the map below suggests that there are Clark’s             more than others. Extra care should be taken in interpreting
Nutcrackers in arctic Canada. This is likely untrue, but since         results in areas of poor to no sampling and for species with large
there are no data points (CBC circles or BBS routes) in that area,     parts of range that are poorly sampled. Also, recall that species
the model building process was unable to properly characterize         included in these analyses are limited to those observed in the
climatic suitability in the region (Fig. 4.3, C).                      CBC or BBS since 1950 and 1966, respectively, with sufficient

Birds and Climate Change | National Audubon Society | Conservation Science | September 2014                                           18
Figure 4.4. Sampling locations of the Audubon Christmas Bird Count (CBC) and North American Breeding Bird Survey (BBS)
for years 2000-2009.
observations to construct a well-performing model (see Part I future projections as risks, opportunity, or as uninformative,
for further details). depending on the biological response considered (See Part II
for detailed methods). This approach generates prioritizations
Locations of sampling shown in the Fig. 4.4 are a reasonable that identify areas suitable for a species today and in the future
proxy for the spatial limits of confidence in the data. In other across a range of future time periods and scenarios for climate
words, there is reason to have lower confidence in areas with change.
low sampling density.
Using Audubon Climate Maps for Conservation
What about Extinction? Decisions: Caveats and Limitations
Audubon’s climate science does not specifically model the Audubon climate maps can be a useful component of
probability of species going extinct because the models do conservation planning. As with any conservation planning
not estimate population size or persistence over time. Our process, care should be taken to bring all relevant information
classifications of climate-threatened and -endangered species together to inform the overall decision. As a standalone
refer to projected changes in the range of climatically suitable product, Audubon’s climatic suitability maps are useful for
area across the United States and Canada. If the area of identifying the climate sensitivity for each species and season
climatically suitable space is likely to shrink, this may contribute modeled. They also provide predictions about the direction
to population decline and eventual extinction, especially when and magnitude of expected change across climate scenarios
combined with existing threats. For 10 species, projections and timeframes. For on-the-ground conservation actions, this
suggest that their climatically suitable range disappears entirely information is best summarized in climate prioritizations (Part
under climate change. These are cases for which discussion of II). And in decision-making, other sources of information should
extinction risk is justified based on climate projections alone. be included. For example, the maps do not explicitly include
habitat or climate change impacts, such as sea level rise or land
Extent cover change.
Due to limited data, modeled climatic suitability does not
include Mexico. For species whose summer or winter ranges
Habitat
extend into northern Mexico, this is a deficiency because Audubon’s climate science does not incorporate habitat directly
the statistical model is not based on the full breadth of the in the model. The models link bird occurrences to climate
species’ climatic range. The presence along the U.S.-Mexico variables to describe the climatic suitability of a given area.
border of climatic zones that extend into northern Mexico (e.g. Projections of future suitability are for a given future time under
Sonoran desert) minimizes this shortcoming for all but the most a particular climate scenario. When we look at a range map in
broadly distributed species. Furthermore, Audubon scientists a field guide, we understand that areas within the range must
incorporated this limitation into their climate prioritizations have the right combination of factors on the ground, including
(Part II), which emphasize a species’ current range and treat habitat, for the bird to be present. Our climate maps should be
Birds and Climate Change | National Audubon Society | Conservation Science | September 2014 19interpreted similarly – the climatic conditions are favorable but Migratory Species
all the other requirements must be in place too.
Because the climate maps are derived from sources that do
Note that while habitat is crucial for conservation, we should not sample during migratory periods (i.e., the CBC runs from
be mindful that every plant and animal is tuned to its climate. Dec. 14 – Jan. 5 each year; the BBS from May – July), there is a
Biogeographers consider climate to be the biggest constraint on reasonable chance that key stopover sites are not represented
species distributions at broad (i.e. ecoregional) spatial scales. in the maps. For migratory species this should be taken into
At sub-regional scales, habitat is most important, and a local consideration during conservation planning. Species with
scales species interactions dominate. Each of these aspects is distinct stopover sites, where large numbers of birds return
important but they operate hierarchically. Therefore, climate to a small number of locations (e.g., shorebirds), can be
remains a practical first filter for determining the suitability of accommodated by overlaying maps of these sites. For species
a site. with less distinct migration routes and places, conservation
targets will be harder to identify.
Sea Level Rise
The Audubon climate sensitivity categories (climate
For coastal species, sea level rise caused by climate change endangered, threatened, and stable) are based on the seasons
will be crucial for conservation planning. Local impacts of sea modeled. So, for Neotropical migrants the winter season is
level rise are challenging to calculate because tides, currents, missing from the assessment. Thus, these species could be
land subsidence or uplifting, and other factors can dampen facing larger threats from climate change than suggested by
or amplify global averages. So, for a coastal conservation their classification. Neotropical migrants that are listed as
project, decision makers would want to consider focal bird climate stable — or any species with only one season modeled
species’ response to climate change (e.g., Audubon climate — should be interpreted with caution. Their climate sensitivity
prioritization maps) and sea level rise predictions in relation in the unmodeled season is unknown.
to existing and potential habitat. Lastly, considerations of land
ownership and stewardship would help establish the potential Suggestions for Further Reading
for conservation efforts and provide estimates of returns on
investment. Audubon climate maps are an important aspect Araújo, M.B. and A.T. Peterson. 2012. Uses and misuses of
of this process because they provide guidance on the likelihood bioclimatic envelope modeling. Ecology, 93(7): 1527–1539.
of species colonization and persistence in the restored area.
Elith, J., and J. R. Leathwick. 2009. Species distribution models:
Predation, Competition, and Dispersal ecological explanation versus prediction across space and
time. Annual Review of Ecology, Evolution, and Systematics
These factors are more difficult to assess, but will play a key role
40:677–697.
in shaping species responses to climate change. Just because
an area is climatically suitable, has the appropriate habitat,
Pearson, R. and T.P. Dawson. 2003. Predicting the impacts of
and is free from sea level rise, does not mean that a species can
climate change on the distribution of species: are bioclimate
successfully colonize it. Predators or competitors might prevent
envelope models useful? Global Ecology & Biogeography 12:
a species from getting established, or it might be unable to
361-371.
reach the area. Dispersal limitation is less likely to be important
for birds than many other organisms, but is still a factor.
Contact climatescience@audubon.org for more information on
Audubon’s Birds and Climate Change report or for assistance
in obtaining, interpreting and analyzing species maps and
strongholds rankings.
Birds and Climate Change | National Audubon Society | Conservation Science | September 2014 20PART V:
Expanded Methods for Audubon’s
Climate Science1
The Importance of Scale but showed varying results when predicted to future climate
spaces.
It is widely recognized that species distributions are influenced
by a variety of biotic and abiotic factors, including habitat Given the challenges of collecting the species-specific
availability, resource availability, species interactions, and physiological data necessary for mechanistic niche modeling,
physiology. However, the respective influences of these factors it is not primarily intended for use in forecasting, but rather
are highly dependent on the spatial and temporal scales provides a framework for understanding how species respond
of analysis. One of the major challenges for understanding to particular climatic gradients. Bioclimatic models remain the
the effects of climate change on species distributions lies in most widely used method to project impacts of climate change
identifying the appropriate spatiotemporal scales at which on species distributions; and when applied at the macro scale,
species distributions can and cannot be reliably predicted from are suitable for making broad predictions to inform conservation
a mechanistic knowledge of climate dependence. As a first planning. Hence, the models in this study are not intended to
approximation, species distributions considered at small scales provide a passive answer to the question of how bird species
tend to be mostly influenced by biotic interactions, mid scales will respond to future climate change. They are instead meant
by habitat and resource availability, and large scales by climate, to identify conservation opportunities that can only be realized
putatively through interactions with the physiological limits of if we proactively plan for changes in climate and biological
the organism. responses.
Here, we use correlative models to predict the geographic Climate Change Models and Uncertainty
responses of the North American avifauna to changes in
climate. We intentionally focus on a large geographic extent to Predictions about the future require the development of
approximate the spatial scale at which many bird distributions models, and all models entail uncertainty. In the case of
are proximately shaped by climate, and a 10 x 10 km resolution climate change, our best hope for making sound conservation
to approximate the resolution of our survey data. However, decisions is to account for uncertainty to the degree possible.
non-modeled factors such as habitat dependencies, biotic There are three major sources of uncertainty to consider when
interactions, and dispersal limitations may in some cases forecasting species responses to climate change: future climate
prove highly important even at this coarse scale. Because it is uncertainty, modeling uncertainty, and biological uncertainty.
impossible to incorporate all of these “non-climatic” variables In this analysis, we have gone to great lengths to understand all
into an analysis, the correlative distribution models presented three sources of uncertainty. We base our methods on recent
here are best described as capturing the bioclimatic envelope work showing that with a thorough treatment of algorithmic
of each species. uncertainties and ensemble forecasting, correlative distribution
modeling is a valuable tool for forecasting continental scale
Use of bioclimatic envelope models to forecast a future impacts of climate change for a large number of species.
distribution has been criticized for making overly simplified
assumptions about dispersal and biotic interactions. However, Future climate uncertainty is obvious: we don’t yet know how
these issues become more of a concern if we are intending to much climate will change in the future and at what rate, because
predict actual species distributions, rather than the distribution human behaviors that influence emissions are difficult to
potential of species. In this sense, these climate models should anticipate, as are the influence of emissions on climate. To deal
be seen as delineating areas where a species could occur in with this uncertainty, we base our analyses on a suite of possible
the future if other variables necessary for the survival of the emissions scenarios and General Circulation Models (GCMs) for
species such as suitable habitats and biotic interactions are which we had reasonable access to climate data layers for North
present, and dispersal is non-limiting. Recent studies testing the America (Appendix B). We ensemble predictions using consensus
performance of mechanistic models that explicitly incorporate
hypothetical biological processes against correlative bioclimatic 1
Excerpted from National Audubon Society. 2013. Developing a Management
models, conclude that bioclimatic models performed as well as Model of the Effects of Future Climate Change on Species: A Tool for the Landscape
mechanistic models for estimating current distributions, Conservation Cooperatives. Unpublished report prepared for the U.S. Fish and
Wildlife Service.
Birds and Climate Change | National Audubon Society | Conservation Science | September 2014 21Figure 5.1. Distribution of Audubon Christmas Bird Count circles and North American Breeding Bird Survey routes
(2000–2009).
forecasting to explore how biological outcomes might be validated each of the models with independent data from
affected by human action to reduce climate change impacts historical time periods, compared their predictive ability, and
through reduced emissions. Consensus forecasting is one chose the one that performed the best overall.
form of ensemble modeling that uses the central tendency
(e.g. mean or median value) from a set of possible models. The Biological uncertainty means that we are not sure if a species can
rationale behind consensus forecasting is that the ‘signal’ one is persist, or colonize newly suitable areas, under future climate
interested in emerges from the ‘noise’ associated with individual change. Much of the last 100 years of ecology has dealt with
model errors and uncertainties. Some conservation leaders understanding how populations and species persist: birth rates,
will be uncomfortable making decisions based on models. It is death rates, immigration, emigration, competition, foraging,
worth noting, however, that assuming species will not shift their lifespan, et cetera. These key biological factors are challenging
distributions in response to climate change is also a model of to measure and each estimate has sources of uncertainty,
the future. This status quo model has all the same uncertainties too. Our models do not incorporate any of these measures
associated with change models, except that there is no formal directly, but we can still consider them post hoc when issuing
attempt to bracket or measure the uncertainty. A status quo conservation recommendations. Here, biological uncertainty
model may, in fact, be the riskiest approach of all. is minimized through a spatial prioritization process bases on
multiple biological responses and subsequent identification of
Modeling uncertainty stems from the quality of the data used climate strongholds—areas climatically suitable today and in the
to develop the model as well as the limits of the modeling future accounting for both future climate uncertainty, modeling
technique. Data quality is tied to both the validity and spatial uncertainty, and biological uncertainty.
scale of the geographic coordinate data used to formulate
the model. Ideally, models constructed from the relationship Bird data
between current climate and species occurrence should be
Bird distribution data were obtained from two sources: the
validated using independent data from other time periods to
Audubon Christmas Bird Count (CBC) and the North American
assess their predictive ability. Such validation provides users
Breeding Bird Survey (BBS). Audubon Christmas Bird Counts
with a sense of how well the models can correctly predict known
began in 1900 as an alternative to the Christmas “side hunt”
presences within different times and climate spaces. Previous
and have been used to document early winter bird assemblages
studies that have tested for past changes in species distributions
across North America, and beyond. CBC surveys are conducted
using bioclimatic envelope models provide a valuable validation
by citizen scientists within 24.1 km diameter circles for one 24
of their use in studies of the potential impacts of future climatic
h period during a two-week interval, centered on December
changes. Modeling uncertainty is further propagated by the
25. For this study, all circles located in Canada and the United
fact that different modeling techniques often yield different
States were included (Fig. 5.1). We elected not to include data
predictions. To deal with this, we used three different modeling
from other areas due to relatively incomplete geographic
methods that fit complex non-linear relationships between
sampling and poor spatio-temporal resolution of climate data.
species occurrence data and environmental data. We then
Birds and Climate Change | National Audubon Society | Conservation Science | September 2014 22For every circle and count year, we translated raw count data historical dataset. Therefore, we calculated projected future
into presence/absence information for each species to reflect climate anomalies for each model and scenario by subtracting
whether or not it was detected. contemporary WorldClim grids for monthly minimum
temperature, maximum temperature, and precipitation from
The Breeding Bird Survey was initiated in 1966 for the purpose the CIAT future grids and added these monthly anomaly grids
of monitoring bird populations in the summer months (USGS to CFS mean climate grids for the base period (1971–2000).
Patuxent Wildlife Research Center). Most BBS routes in the Emissions scenarios are described in the IPCC Special Report
United States and Canada are surveyed in June but some on Emissions Scenarios and are grouped into families (e.g.,
are run as early as May and others extend as late as mid- A1, A2, B1 and B2) that explore alternative development
July. Survey routes are 24.5 miles long with stops at 0.5-mile pathways, covering a wide range of demographic, economic
intervals. At each stop, participants conduct a 3-minute point and technological driving forces on greenhouse gas emissions
count and record birds seen or heard. We used data for the first (Fig. 5.2). As described by the IPCC (2007), the B2 scenario is
30 stops (~24 km) for our analyses in an effort to balance the a relatively “low” emissions trajectory that emphasizes clean
geographic scales at which CBC and BBS sample the landscape and sustainable technology. In contrast, the A1B scenario is
and maintain a reasonable match to the resolution of our a relatively “middle-of-the-road” emissions scenario where
climate data (10 x 10 CBC circles BBS routes 5 km). Again, we technological change is balanced across fossil and non-fossil
only used data for the United States and Canada and, for every energy sources. Finally, the A2 scenario represents a relatively
route and year; we translated raw count data into presence/ “high” emissions pathway characterized by fragmented
absence information for each species. technological and economic growth. General Circulation Models
(GCMs) are numerical models that represent physical processes
Climate data in the atmosphere, ocean, cryosphere and land surface used to
simulate the response of the global climate system to increasing
We obtained contemporary climate data from the Canadian
greenhouse gas concentrations. Future climate predictions can
Forest Service (CFS) website for the mid-point of each CBC
be derived by combining emissions scenarios and GCMs
circle and to the start-point of each BBS route. The CFS has
(Fig. 5.3).
produced a set of high resolution (10 km), yearly contemporary
(1950 – 2010) climate datasets for Canada and the United States
based on thin plate smoothing algorithms. We matched bird
data and climate data on an annual basis (i.e., for CBC count
year x and BBS survey year x, we used climate data from year
x-1), assuming that climate variables from the year leading
up to each survey would best inform our understanding
of occurrence data. For instance, climate data for the year
prior to a CBC survey event would actually include monthly
climate data from that winter’s survey because each CBC
survey date is considered as of the 1st of January following the
December counts (i.e., survey data from 2000 spans December
1999–January 2000). This is important since our climate
parameters include indices of minimum and maximum monthly
temperatures and precipitation (Appendix A), as well as mean
variables. Similarly, climate data from the prior year matched
to BBS survey events would encompass the winter climate
preceding the summer (breeding) season.
Figure 5.2. Global emissions scenarios for the 21st Century.
Spatially downscaled (5-min resolution) climate grids for The present study considers three scenarios: B2, A1B, and
2010-2039, 2040-2069, and 2070-2099 were obtained from A2. Source: Figure SPM.5 IPCC WG1 2007.
the International Center for Tropical Agriculture (CIAT) for 13
combinations of emissions scenarios and General Circulation
Models (GCMs, Appendix B). These grids used historical
climate data from WorldClim, which differs from our CFS
Birds and Climate Change | National Audubon Society | Conservation Science | September 2014 23You can also read