Curcumin promotes AApoAII amyloidosis and peroxisome proliferation in mice by activating the PPARa signaling pathway - eLife
←
→
Page content transcription
If your browser does not render page correctly, please read the page content below
RESEARCH ARTICLE

                                        Curcumin promotes AApoAII amyloidosis
                                        and peroxisome proliferation in mice by
                                        activating the PPARa signaling pathway
                                        Jian Dai1,2*, Ying Li3, Fuyuki Kametani4, Xiaoran Cui5, Yuichi Igarashi5, Jia Huo6,
                                        Hiroki Miyahara1,7, Masayuki Mori1,7, Keiichi Higuchi1,7
                                        1
                                          Department of Neuro-health Innovation, Institute for Biomedical Sciences,
                                        Interdisciplinary Cluster for Cutting Edge Research, Shinshu University, Matsumoto,
                                        Japan; 2Department of Pathology, the Xiehe Hospital of Tangshan, Tangshan,
                                        China; 3Aging Biology, Department of Biomedical Engineering, Graduate School of
                                        Medicine, Science and Technology Shinshu University, Matsumoto, Japan;
                                        4
                                          Department of Dementia and Higher Brain Function, Tokyo Metropolitan Institute
                                        of Medical Science, Tokyo, Japan; 5Department of Aging Biology, Institute of
                                        Pathogenesis and Disease Prevention, Shinshu University Graduate School of
                                        Medicine, Matsumoto, Japan; 6Department of Orthopedic Surgery, the Third
                                        Hospital of Hebei Medical University, Shijiazhuang, China; 7Department of Aging
                                        Biology, Shinshu University School of Medicine, Matsumoto, Japan

                                        Abstract Curcumin is a polyphenol compound that exhibits multiple physiological activities. To
                                        elucidate the mechanisms by which curcumin affects systemic amyloidosis, we investigated amyloid
                                        deposition and molecular changes in a mouse model of amyloid apolipoprotein A-II (AApoAII)
                                        amyloidosis, in which mice were fed a curcumin-supplemented diet. Curcumin supplementation for
                                        12 weeks significantly increased AApoAII amyloid deposition relative to controls, especially in the
                                        liver and spleen. Liver weights and plasma ApoA-II and high-density lipoprotein concentrations
                                        were significantly elevated in curcumin-supplemented groups. RNA-sequence analysis revealed that
*For correspondence:                    curcumin intake affected hepatic lipid metabolism via the peroxisome proliferator-activated
daijian3@shinshu-u.ac.jp
                                        receptor (PPAR) pathway, especially PPARa activation, resulting in increased Apoa2 mRNA
Competing interests: The                expression. The increase in liver weights was due to activation of PPARa and peroxisome
authors declare that no                 proliferation. Taken together, these results demonstrate that curcumin is a PPARa activator and
competing interests exist.              may affect expression levels of proteins involved in amyloid deposition to influence amyloidosis and
Funding: See page 15                    metabolism in a complex manner.

Received: 28 September 2020
Accepted: 10 January 2021
Published: 26 January 2021

Reviewing editor: Rudolph E
                                        Introduction
Tanzi, Harvard University, United
                                        Amyloidosis is a group of diseases characterized by abnormal aggregation of proteins to form amy-
States                                  loid fibrils, and subsequent deposition in various tissues and organs, which can lead to severe func-
                                        tional failures. More than 30 amyloid proteins have been identified; some result in localized tissue
    Copyright Dai et al. This article
                                        deposits, such as Ab in Alzheimer’s disease and a-synuclein (aSyn) in Parkinson’s disease that
is distributed under the terms of
                                        deposit in the brain, while others result in systemic amyloidosis and are widely deposited in various
the Creative Commons
Attribution License, which              tissues and organs, such as ALl and ALk in immunoglobulin light chain amyloidosis and transthyretin
permits unrestricted use and            in ATTR amyloidosis (Benson et al., 2018). In general, when amyloid proteins are exposed to certain
redistribution provided that the        conditions that affect protein homeostasis (e.g., overexpression, gene mutation, and enzyme cleav-
original author and source are          age), they may undergo structural changes into stable structures that are rich in b-sheets, and which
credited.                               promote subsequent aggregation to form oligomers, protofibrils, and amyloid fibrils (Merlini and

Dai et al. eLife 2021;10:e63538. DOI: https://doi.org/10.7554/eLife.63538                                                             1 of 19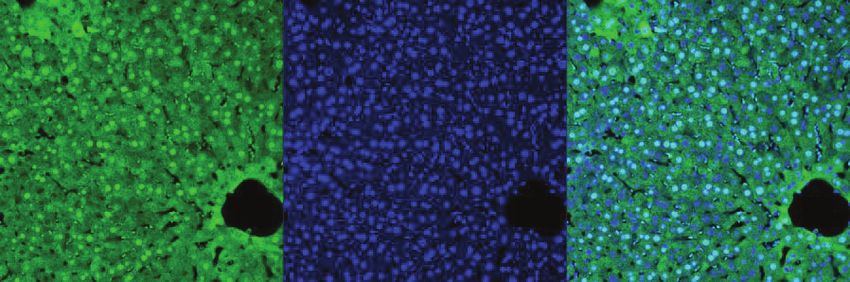
Research article                                                                                Biochemistry and Chemical Biology

                                    Bellotti, 2003; Knowles et al., 2014). Because the formation of amyloid fibrils is nearly irreversible,
                                    maintaining proteostasis and inhibiting amyloid aggregation present a challenge for development of
                                    an effective treatment.
                                        Some natural phenolic compounds extracted from plants exhibit certain anti-amyloid activity in
                                    vitro and in vivo (Stefani and Rigacci, 2013). Curcumin, a polyphenol compound, is extracted from
                                    the rhizome of Curcuma longa and has a long history of use in traditional medicines in some coun-
                                    tries in Asia. In in vitro experiments, curcumin has been shown to suppress the aggregation and
                                    cytotoxicity of Ab, aSyn, islet amyloid precursor protein, ATTR, and prion protein (Stefani and
                                    Rigacci, 2013). In 2001, the first evidence of the efficacy of curcumin against Ab amyloidosis in a
                                    transgenic model mice was reported (Lim et al., 2001). Curcumin was found to suppress amyloid
                                    deposition in a mouse model of Alzheimer’s disease and improve memory function. It was subse-
                                    quently demonstrated that the amount of amyloid present in TTR- and tau-transgenic mice was
                                    reduced by curcumin supplementation (Ferreira et al., 2013; Ferreira et al., 2016; Ma Q-L et al.,
                                    2013). Due to the strong affinity of curcumin for the amyloid structure, it is believed that curcumin
                                    inhibits the formation of amyloid fibrils by binding to amyloid protein monomers or aggregates
                                    (Stefani and Rigacci, 2013; Lim et al., 2001; Ahmad et al., 2017; Hafner-Bratkovic et al., 2008).
                                    This curcumin-protein complex exhibits better stability and reduces the tendency to aggregate.
                                    However, another mechanism that has been proposed suggests that curcumin inhibits Ab production
                                    by downregulating the expression of amyloid-beta precursor protein (APP) or beta-site APP cleaving
                                    enzyme 1 (BACE1) in vitro (Song et al., 2020; Zheng et al., 2017). Unfortunately, there are few
                                    reports that suggest that curcumin will provide clinical benefit in patients with Alzheimer’s disease or
                                    AL amyloidosis (Stefani and Rigacci, 2013; Golombick et al., 2015; Small et al., 2018). In fact, it is
                                    unclear how curcumin inhibits amyloid deposition in vivo.
                                        Curcumin is a compound with multiple physiological activities, which include anti-oxidation, anti-
                                    inflammatory, anti-cancer, lipid metabolism regulation, and anti-amyloid properties. However, a link
                                    between the various physiological activities has not been completely established (Liczbiński et al.,
                                    2020). Curcumin has been found to exert an influence on multiple signaling pathways (Shisho-
                                    dia, 2013). In 2003, curcumin was first shown to inhibit rat hepatic stellate cell growth by activation
                                    of peroxisome proliferator-activated receptor g (PPARg), suggesting that curcumin might have an
                                    effect on the PPAR signaling pathway (Xu et al., 2003). In mammals, the PPAR subfamily (PPARs) is
                                    a group of nuclear receptor proteins, for example transcription factors, and consists of three mem-
                                    bers, namely PPAR-a, PPAR-b/d, and PPAR-g, that play essential roles in the regulation of metabolic
                                    homeostasis, glucose and energy metabolism, cellular differentiation, inflammation, and ROS metab-
                                    olism (Pyper et al., 2010; Monsalve et al., 2013; Lamichane et al., 2018; Harmon et al., 2011).
                                    The functions of the three PPAR subtypes are different. PPAR-a regulates fatty acid transport and
                                    oxidative decomposition in the liver and muscle in response to energy metabolism levels. PPARg
                                    mainly regulates fatty acid synthesis and fat accumulation in adipose tissue, as well as differentiation
                                    of adipose cells and macrophages. PPARb/d plays an important role in lipid catabolism, energy
                                    homeostasis, and cell differentiation, but the mechanism and network of action are not completely
                                    clear (Harmon et al., 2011; Magadum and Engel, 2018). Among the three isotypes, the relationship
                                    between curcumin and PPARg is the most extensively studied, while information on a and b/d
                                    remains scarce.
                                        In this study, we sought to determine whether curcumin affects the amyloid deposition process
                                    besides directly binding to amyloid proteins, and identify a link between curcumin’s anti-amyloid
                                    activity and its various other biological activities. In our previous study, we found that antioxidants
                                    (tempol and apocynin) can effectively reduce AApoAII amyloid deposition (Dai et al., 2019). It is
                                    therefore possible that the anti-oxidative effects of curcumin also play an important role in amyloid
                                    formation. We examined the effects of curcumin supplementation in a mouse model of AApoAII
                                    amyloidosis, in which mice were induced to develop systemic amyloidosis (Higuchi et al., 1995). In
                                    contrast to expectations, our results showed that curcumin significantly promoted AApoAII amyloid
                                    deposition by activating the PPAR signaling pathway. Moreover, our results suggest that activation
                                    of PPARa plays a major role in the amyloid formation process.

Dai et al. eLife 2021;10:e63538. DOI: https://doi.org/10.7554/eLife.63538                                                            2 of 19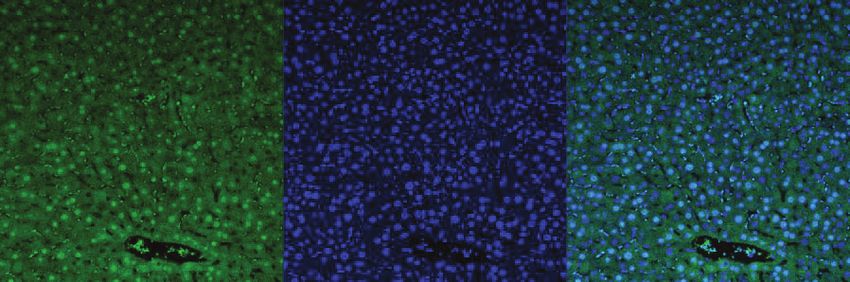
Research article                                                                                 Biochemistry and Chemical Biology

                                    Results
                                    Degree of AApoAII amyloid deposition and liver weights were
                                    significantly increased after supplementation with curcumin
                                    Two-month-old female R1.P1-Apoa2c mice were randomly divided into four groups: the control
                                    (Con) and curcumin (Cur) groups are non-amyloid-induced groups and fed a common diet or 2% w/
                                    w curcumin diet, respectively. The other two groups were injected with 1 mg AApoAII amyloid fibrils
                                    into the tail vein to induce amyloidosis, and were fed a common diet (A-NT group) or 2% curcumin
                                    diet (A-Cur group) (see experimental design in Figure 1—figure supplement 1, body weight and
                                    food intake in Figure 1—figure supplement 2). After 8 and 12 weeks, we evaluated the effect of
                                    curcumin intake on amyloid deposition. Unlike previous studies, the degree of amyloid deposition in
                                    the A-Cur group was significantly increased compared to the A-NT group at both 8 and 12 weeks,
                                    especially in the liver and spleen (Figure 1a–d, Figure 1—figure supplement 3). This is the first evi-
                                    dence that curcumin promotes amyloid deposition in vivo and suggests that curcumin can affect the
                                    amyloid deposition process via a complex mechanism, not just via binding with amyloid protein
                                    monomers or aggregates. In addition, no amyloid deposition was observed in the Cur group, sug-
                                    gesting that curcumin does result in the pathogenesis of amyloidosis without induction by amyloid
                                    fibril injection. These results suggest that curcumin accelerates amyloid deposition but does not
                                    cause structural changes in amyloidogenic proteins.
                                        On the other hand, we noticed that the livers of mice were larger and heavier in those mice that
                                    received dietary supplementation with curcumin than in those without supplementation
                                    (Figure 1e and f, Supplementary file 1). In the subsequent histological observation, it was found
                                    that the mice in the curcumin-supplemented groups had hepatocyte hypertrophy and abnormal
                                    changes in some hepatocyte nuclei, but no tumors or abnormal organisms were observed (Fig-
                                    ure 1—figure supplement 4). This is somewhat confusing, as it has been demonstrated in many
                                    high-fat diet experiments that curcumin effectively reduces liver lipid deposition and liver weight
                                    (Um et al., 2013; Maithilikarpagaselvi et al., 2016). To exclude the effects of hepatocyte damage
                                    or inflammation, plasma levels of aspartate aminotransferase (AST) and alanine transaminase (ALT)
                                    and several inflammatory marker cytokines in the liver were detected (Figure 1—figure supple-
                                    ments 5 and 6). However, we found no support that dietary supplementation with curcumin causes
                                    inflammation or cell injury in the liver. To confirm whether different doses will affect the experimental
                                    results, we repeated the experiment with a lower dose (0.5% w/w) of curcumin diet and obtained
                                    similar changes in the degree of amyloid deposition and liver weight (Figure 1—figure supplement
                                    7).

                                    Curcumin elevated levels of ApoA-II protein and affected lipid
                                    metabolism in mice
                                    It has been reported that overexpression of amyloid protein or precursor protein is one of the most
                                    important factors contributing to the pathogenesis of amyloidosis, and results in increased amyloid
                                    deposition in transgenic model mice (Merlini and Bellotti, 2003; Knowles et al., 2014;
                                    Calhoun et al., 1999). Apolipoprotein A-I (ApoA-I) and apolipoprotein A-II (ApoA-II) are the major
                                    proteins comprising HDL (high-density lipoprotein) particles, and curcumin has been shown to
                                    increase HDL levels in some studies of lipid metabolism (Yang et al., 2014; Panahi et al., 2018). We
                                    previously demonstrated that overexpression of ApoA-II can significantly aggravate amyloid deposi-
                                    tion in Apoa2c transgenic mice (Ge et al., 2007). Moreover, the co-deposited proteins in AApoAII
                                    amyloidosis may also affect the degree of amyloid deposition (Miyahara et al., 2018). We hypothe-
                                    sized that the increase in amyloid deposition in the curcumin diet group was due to upregulation of
                                    ApoA-II or other co-deposition proteins. Plasma levels of ApoA-II and the major proteins that were
                                    co-deposited with AApoA-II amyloids (ApoA-I and ApoE) were measured by western immunoblot. In
                                    line with our expectations, significantly higher plasma levels of ApoA-II at 12 weeks were observed
                                    for the Cur group compared with the Con group (Figure 2a). Following the increase in amyloid
                                    deposition, the plasma levels of ApoA-II will gradually decrease upon tissue deposition
                                    (Miyahara et al., 2018). As shown in Figure 2a, plasma levels of ApoA-II in the A-Cur group
                                    decreased significantly compared with those in the Cur group, while the decline in the A-NT group
                                    was mild compared with that in the Con group. These different degrees of decline resulted in a

Dai et al. eLife 2021;10:e63538. DOI: https://doi.org/10.7554/eLife.63538                                                             3 of 19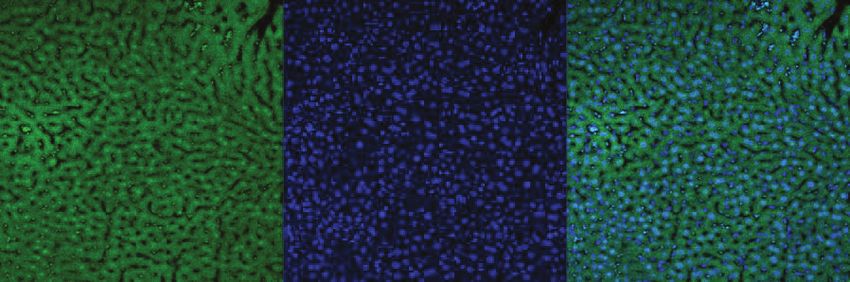
Research article                                                                                                                                 Biochemistry and Chemical Biology

    a                                                 b                                                           liver                                              spleen

                                                           A-NT
                                   *

                                                           A-Cur

                                                                                                                                                                                    Left, Congo red stain
                                                                                                                                                                                    Right, anti ApoA-II (IHC)

                                                                                                                  liver
    c                                                d                                                                                                                   spleen
                                   *

                                                           A-NT

                                                          A-Cur

                                                                                                                                                                                      Left, Congo red stain
                                                                                                                                                                                      Right, anti ApoA-II (IHC)
     e                                                                                 f
                                                                                                                       8-week group                               12-week group
                                                                                      liver/body weight (g/g)
                                                                                                                                                                         **                 ***
                                                                                                                0.08        ***                            0.08
                                                                                                                                               *
                                                                                                                0.06                                       0.06

                                                                                                                0.04                                       0.04

                                                                                                                0.02                                       0.02

                                                              Left: commercial diet                               0                                          0
                                                              Right: curcumin diet                                        Con     Cur   A-NT       A-Cur           Con        Cur    A-NT          A-Cur

Figure 1. Degree of AApoAII amyloid deposition and liver weights. (a) Amyloid index (AI) in the 8-week group. (b) Representative Congo red and IHC
images of AApoAII amyloid deposition in the 8-week group. Amyloid deposits (red arrows) were identified by green birefringence in Congo red-stained
sections using polarizing light microscopy. Each scale bar indicates 100 mm. (c) Amyloid index in the 12-week group. (d) Representative Congo red and
IHC images of amyloid deposition in the 12-week group. (e) Mice in curcumin-supplemented group have larger livers and less adipose tissue in the
abdominal cavity than mice without curcumin supplementation (left: commercial diet; right: curcumin diet). (f) Ratio of liver weight/body weight in all
groups. Each dot represents an individual mouse (a, c). Data are mean ± SD (f). N = 3–5. The Kruskal–Wallis test with the Steel–Dwass test was used for
the amyloid index, and the Tukey–Kramer method was used for multiple comparisons of liver weights; *p < 0.05, **p < 0.01, ***p < 0.001.
The online version of this article includes the following figure supplement(s) for figure 1:
Figure supplement 1. Experimental design.
Figure supplement 2. Weekly body weight and food intake measurements.
Figure supplement 3. Amyloid score in various organs.
Figure supplement 4. Hepatocyte hypertrophy in curcumin intake groups.
Figure supplement 5. No differences in AST and ALT plasma concentrations after curcumin intake.
Figure supplement 6. Inflammation-related gene expression in the liver in the 12-week group.
Figure supplement 7. Degree of AApoAII amyloid deposition and liver weights were significantly increased after supplementation with low dose
curcumin diet (0.5% w/w).

                                       narrowing difference between the A-NT and A-Cur groups. ApoA-I plasma levels showed a slight
                                       increase with curcumin supplementation, but were not significant (Figure 2b). Consistent with previ-
                                       ous results (Dai et al., 2019), ApoE, which is the most abundant co-deposited protein in AApoAII
                                       amyloidosis, was significantly increased in the amyloid-induced groups, but was not significantly
                                       affected by curcumin (Figure 2c).

Dai et al. eLife 2021;10:e63538. DOI: https://doi.org/10.7554/eLife.63538                                                                                                                                       4 of 19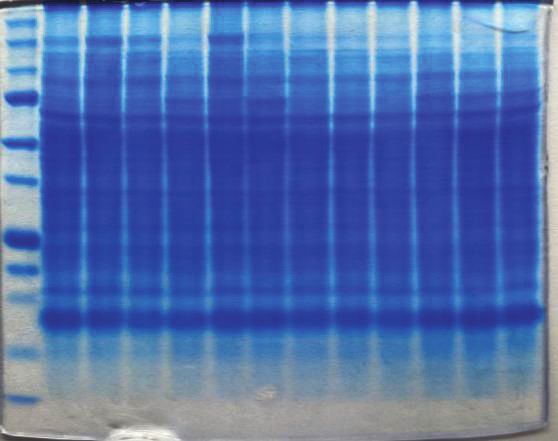
Research article Biochemistry and Chemical Biology
a b c
10 ApoA-II 25 ApoA-I 37 ApoE
P Con Cur A-NT A-Cur P Con Cur A-NT A-Cur P Con Cur A-NT A-Cur
4
** **
2 *
7
3 *
Fold change
6
Fold change
Fold change
1.5
5
2 4
1
3
1 0.5 2
1
0 0 0
Con Cur A-NT A-Cur Con Cur A-NT A-Cur Con Cur A-NT A-Cur
d e f
100 250 * 120
HDL in plasma㸦mg/dl㸧
*
Total-C in plasma㸦mg/dl㸧
**
* TG in plasma㸦mg/dl㸧 100
80 200
80
60 150
60
40 100
40
20 50
20
0 0 0
Con Cur A-NT A-Cur Con Cur A-NT A-Cur Con Cur A-NT A-Cur
Figure 2. Curcumin elevated ApoA-II levels and affected lipid metabolism in mice after 12 weeks. (a–c) Plasma concentrations of ApoA-II, ApoA-I, and
ApoE were determined by densitometry of Western immunoblot after SDS-PAGE. Representative results of western blot are shown above the figures.
Histograms show fold changes relative to the Con group and represent the means ± SD. P indicates the pooled plasma of female R1.P1-Apoa2c mice
at 2 months of age (N = 4) that did not have AApoAII amyloid deposits, as the positive control. (d–f) Plasma concentrations of HDL cholesterol,
triglycerides (TG), and total cholesterol (Total-C) were determined using quantitative assay kits. N = 3–5. The Tukey–Kramer method was used for
multiple comparisons; *p < 0.05. **p < 0.05.
The online version of this article includes the following figure supplement(s) for figure 2:
Figure supplement 1. ApoA-II, ApoA-I, and ApoE plasma levels after supplementation with 2% w/w curcumin diet for 8 weeks.
Because ApoA-II, ApoA-I, and ApoE are all constituent proteins of HDL and are related to lipid
metabolism, we evaluated the change in lipid metabolism by detecting plasma levels of total choles-
terol, HDL cholesterol, and triglycerides. Results suggest that curcumin supplementation increased
HDL cholesterol levels, but reduced triglycerides levels (Figure 2e–g), which is consistent with previ-
ous experiments of curcumin supplementation. Similar results were also shown in lipid metabolism
studies, in which hypolipidemic agents, namely fibrates, were used as PPARa agonists (van der
Hoogt et al., 2007; Staels et al., 1998).
Further, immunoblotting results of ApoA-I and ApoE in the 8-week group are consistent with
those of the 12-week group, but the change in ApoA-II protein did not show a significant difference.
These results indicate that the increase in ApoAII levels may have undergone a slow process to
adapt to the changes in lipid metabolism (Figure 2—figure supplement 1).
RNA sequence analysis showed that curcumin regulates many lipid
metabolism-related genes via the PPAR signaling pathway, especially
by activating PPARa in the liver
Although it has been suggested that curcumin inhibits amyloid fibril formation by binding to amyloid
proteins and maintaining protein homeostasis, our results showed that curcumin may also affect the
degree of amyloid deposition by other means. Several physiological activities of curcumin are
related to the activation of PPARg, including decreased insulin resistance, anti-inflammatory, and
anti-cancer activities (Liczbiński et al., 2020; Shishodia, 2013; Janani and Ranjitha Kumari, 2015;
Youssef and Badr, 2011). However, ApoAII expression is thought to be upregulated upon activation
of PPARa to enhance the delivery of lipids from the periphery tissue to the liver (Liu et al., 2015;
Dai et al. eLife 2021;10:e63538. DOI: https://doi.org/10.7554/eLife.63538 5 of 19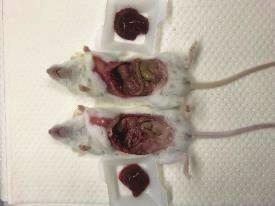
Research article                                                                              Biochemistry and Chemical Biology

                                    Shah et al., 2010). To identify possible signaling pathways or target proteins that respond to curcu-
                                    min, we performed a comprehensive analysis of mRNA transcription in the liver using the RNA
                                    sequence method. As shown in the Venn diagram (Figure 3a, Figure 3—source datas 1 and 2), 75
                                    genes are changed in mRNA expression by curcumin supplementation regardless of induction of
                                    amyloidosis (Figure 3—source data 3). The enrichment pathway analysis based on the KEGG data-
                                    base suggested that differentially expressed genes (DEGs) are mainly distributed in lipid metabo-
                                    lism-related signaling pathways centered on the PPAR pathway (Figure 3b, Figure 3—source datas
                                    4 and 5). Analysis of the non-amyloid induced groups separately showed that 98 genes were upre-
                                    gulated and 93 genes were downregulated in the Cur group compared with the Con group. Among
                                    the 15 genes that were most significantly upregulated, more than 2/3 were related to fatty acid
                                    transport and fatty acid oxidation (Figure 3c). Even considering the possible interference of AApoAII
                                    amyloidosis on gene expression in amyloid-induced groups, most of these genes had still been pro-
                                    moted in the A-Cur group (Figure 3d).
                                        As a transcription factor, PPARa is a major regulator of lipid metabolism in the liver. When the
                                    body is in an energy-deprived state, activated PPARa can mobilize fatty acids to the liver and pro-
                                    mote fatty acid b oxidation to produce energy by upregulation of genes involved in fatty acid trans-
                                    port, fatty acid binding, and peroxisomal and mitochondrial fatty acid b-oxidation (Pyper et al.,
                                    2010; Monsalve et al., 2013; Lamichane et al., 2018). During lipid metabolism, the physiological
                                    function of PPARg mainly involves synthesis and elongation of fatty acids and the differentiation of
                                    adipocytes for energy storage (Monsalve et al., 2013; Lamichane et al., 2018; Janani and Ranjitha
                                    Kumari, 2015). Upon analysis of the DEGs (Figure 3—source datas 1–3), we found that most of the
                                    genes were related to fatty acid oxidation, which suggests that curcumin regulates gene transcrip-
                                    tion by activated PPARa in the liver.
                                        We further confirmed the elevated mRNA expression levels of Ppara, Apoa2, Apoa1, and some
                                    genes related to fatty acid metabolism in curcumin-supplemented groups by real-time qPCR
                                    (Figure 3e). Although Pparg mRNA expression was confirmed to be upregulated by curcumin (Fig-
                                    ure 3—figure supplement 1), its levels were much lower than Ppara in the liver (data not shown).
                                    These results suggest that curcumin is a PPARa/g dual activator, and that the various physiological
                                    activities of curcumin may be derived from the complex regulation of PPARa and PPARg. Because
                                    expression of PPARa and PPARg varies largely in different tissues and organs, curcumin exhibits
                                    diverse physiological activities in different studies depending on the organs that are evaluated
                                    (Monsalve et al., 2013; Lamichane et al., 2018; Harmon et al., 2011), while Ppara should be the
                                    major target of curcumin owing to its abundance in mouse liver.

                                    PPARa levels in the liver were increased and showed more intranuclear
                                    localization in mice supplemented with curcumin
                                    As a transcription factor, activated PPARa transferred to the nucleus and formed heterodimers with
                                    retinoid X receptor (RXR). The heterodimers bind to the peroxisome proliferator response element,
                                    a specific DNA sequence present in the promoter region of PPAR-regulated genes (Xu et al., 2003).
                                    To elucidate how curcumin affects PPARa, we evaluated intracellular localization and PPARa levels
                                    in the liver. Compared with mice without curcumin supplementation, the fluorescence signal of
                                    PPARa in the Cur and A-Cur groups was concentrated in the nucleus, resulting in a higher signal
                                    intensity (Figure 4a). Moreover, as shown in Figure 4b, PPARa protein levels were increased in cur-
                                    cumin-supplemented mice, which is consistent with real-time qPCR results. These results confirm
                                    that the synthesis and activation of PPARa are promoted by curcumin and also explain the DEGs
                                    related to lipid metabolism in the liver.

                                    Curcumin induced a higher abundance of peroxisomes and elevated a
                                    variety of peroxisome proteins downstream of PPARa
                                    Proliferation of peroxisomes provides additional evidence that PPARa is a target protein of curcu-
                                    min. The mitochondria and peroxisomes are the most important organelles responsible for fatty acid
                                    oxidation. However, very long chain fatty acids (VLCFAs) exhibiting >22 carbons are too long to be
                                    metabolized in the mitochondria, and must be metabolized in peroxisomes (Islinger et al., 2018).
                                    Activated PPARa is known to promote peroxisomes in mice and increase levels of fatty acid oxida-
                                    tion (Islinger et al., 2018; Schrader et al., 2016; Lee et al., 1995). We noticed that peroxisome is

Dai et al. eLife 2021;10:e63538. DOI: https://doi.org/10.7554/eLife.63538                                                          6 of 19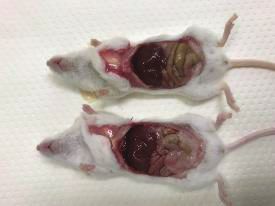
Research article Biochemistry and Chemical Biology
a b Sample number/
Rank Term Corrected P-value
Background
Cur vs Con A-Cur vs A-NT
PPAR signaling
1 17/82 1.22e-10
pathway
2 Retinol metabolism 17/88 1.65e-10
3 Fatty acid degradation 10/49 2.04e-06
116 75 58 4 Metabolic pathways 50/1256 2.04e-06
5 Chemical carcinogenesis 12/92 5.92e-06
Steroid hormone
6 11/86 1.92e-05
biosynthesis
Biosynthesis of
7 6/25 2.57e-04
unsaturated fatty acids
8 peroxisome 9/81 4.16e-04
… … … …
c
Acox1 Acaa1b Cyp4a10
Mub10
Fabp1
Ehhadh d Acox1 Scd1
Ehhadh
Cyp4a14
Scd1 Cyp4a10
Acaa1b
Crot
Retsat
Acsl1 Retsat
Plin2 Acot1
Elovl5
e
mRNA expression of PPAR signaling pathway in liver Con
10 Cur
***
9 * A-NT
8 A-Cur
Fold change
7
6 ***
5 *
4
3 * ** **
2
1
0
Pparα Apoa2 Apoa1 Cd36 Fabp Scd-1
Figure 3. RNA sequence analysis showed that curcumin regulates many lipid metabolism-related genes via the peroxisome proliferator-activated
receptor (PPAR) signaling pathway. (a) The Venn diagram shows that 75 genes are changed in the liver by supplementation with curcumin for 12 weeks.
(b) Enrichment pathway analysis based on the KEGG database. (c and d) The Volcano plot diagram shows that differentially expressed genes (DEGs)
affected by curcumin are related to lipid metabolism and the PPARa pathway. (e) Regulated genes were identified by real-time qPCR. Histograms show
fold changes relative to the Con group. Data are mean ± SD. The Tukey–Kramer method was used for multiple comparisons of gene changes; *p <
0.05, **p < 0.01, ***p < 0.001.
The online version of this article includes the following source data and figure supplement(s) for figure 3:
Source data 1. Cur vs Con.DEG.
Figure 3 continued on next page
Dai et al. eLife 2021;10:e63538. DOI: https://doi.org/10.7554/eLife.63538 7 of 19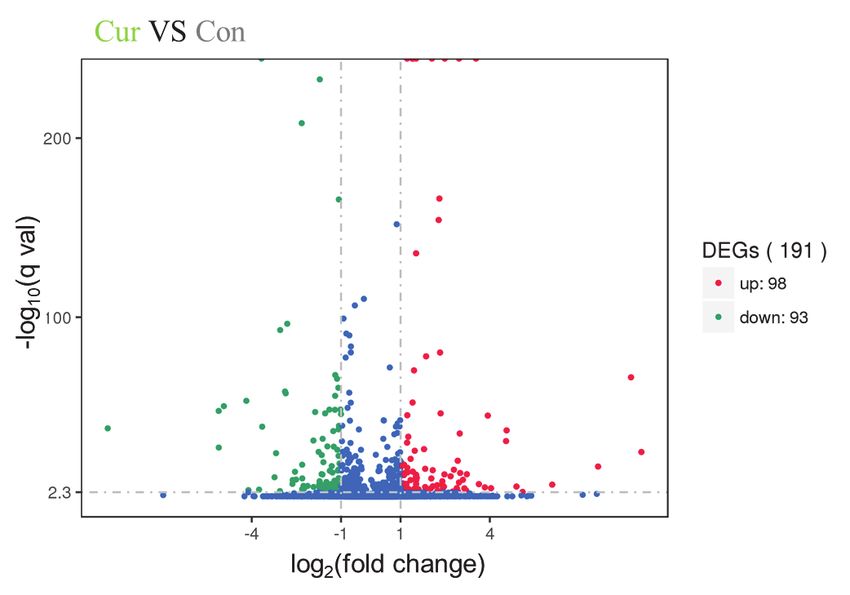
Research article Biochemistry and Chemical Biology
Figure 3 continued
Source data 2. ACur vs ANT.DEGs.
Source data 3. the list of 75 DEGs.
Source data 4. CurvsCon_all.DEG_KEGG_pathway_enrichment.
Source data 5. ACurvsANT_all.DEG_KEGG_pathway_enrichment.
Figure supplement 1. mRNA expression of Pparg in the liver.
ranked 8 in the analysis of enrichment pathways (Figure 3b). Many enzymes related to fatty acid ß
oxidation that are located in peroxisomes, including Acox, Acaa1, Ehhadh, Crat, and Crot, are
known to be upregulated (Figure 3—source datas 1 and 2). Another important upregulated protein
is Pex11, a protein that regulates peroxisome division to increase peroxisome abundance
(Weng et al., 2013; Knoblach and Rachubinski, 2010).
Catalase is one of the most important enzymes involved in protecting the cell from oxidative
damage by catalyzing the decomposition of hydrogen peroxide. Due to localization in peroxisomes,
it is usually used as a marker for peroxisomes (Goldman and Blobel, 1978; Fahimi, 1969). We
detected catalase in the liver by immunohistochemistry (IHC) and western immunoblotting to con-
firm peroxisome abundance. Results obtained for catalase by IHC and immunoblotting suggest a
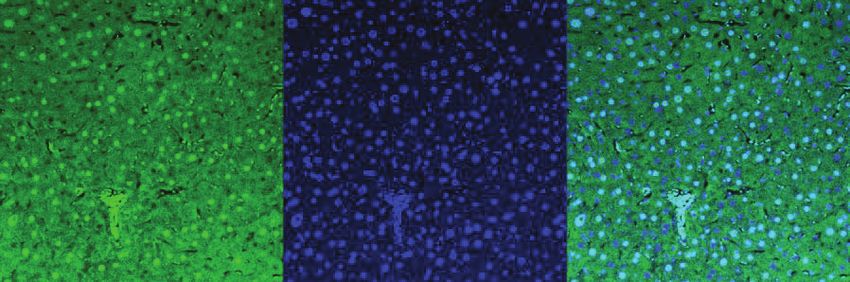
a PPARα DAPI Merge
Con
Negative
control
b
Cur
50
PPARα
37 β-actin
Con Cur A-NT A-Cur
2.5 **
A-NT *
2
Fold change
1.5
1
0.5
A-Cur
0
Con Cur A-NT A-Cur
Figure 4. PPARa levels in the liver are increased and show more intranuclear localization in curcumin-supplemented mice. (a) Immunofluorescence
results of PPARa showed obvious intranuclear signal accumulation and extranuclear signal enhancement after curcumin ingestion. (b) Levels of PPARa
proteins in the liver were determined by western immunoblot. Data are mean ± SD. The Tukey–Kramer method was used for multiple comparisons; *p
< 0.05, **p < 0.01.
Dai et al. eLife 2021;10:e63538. DOI: https://doi.org/10.7554/eLife.63538 8 of 19
Research article                                                                                          Biochemistry and Chemical Biology

                                            higher abundance of peroxisomes after curcumin supplementation (Figure 5a and b). The overex-
                                            pression of catalase also reflects an increase in fatty acid metabolic activity and oxidative stress in
                                            hepatocytes.
                                               In addition, we unexpectedly found that the protein band observed at a molecular weight of 75
                                            kD is significantly increased in SDS PAGE of the liver extracts stained by Coomassie brilliant blue
                                            (Figure 5c). We analyzed the proteins in this band by proteomic LC-MS/MS analysis and determined
                                            that it was comprised of several peroxisomal proteins related to fatty acid oxidation, including
                                            Ehhadh, Hsd17b4, and Acsl1 (Figure 5d, Supplementary file 2). These results demonstrate that cur-
                                            cumin regulates peroxisome abundance via PPARa activation.

    a

     Catalase

                                       Con                              Cur                     A-NT                            A-Cur
    b                                                                     Catalase         c
             50                                                                                     Liver lysate on SDS PAGE
                                                                          β-actin
             37
                               Con         Cur      A-NT        A-Cur                          75

                           4                               *                                   50
             Fold change

                           3
                                      **

                           2

                           1

                           0
                                Con        Cur     A-NT        A-Cur                                      Con    Cur        A-NT       A-Cur

    d Proteomics analysis of the 75 kD band
                           #            Identified Proteins (369)             Gene Name   Con       Cur    A-NT A-Cur
                      1            Peroxisomal bifunctional enzyme             Ehhadh     123       581    107    577
                       2            Carbamoyl-phosphate synthase                Cps1      154       139    225    169
                       3                   Serotransferrin                       Tf       151       121    163    134
                      …                            …
                       8       Peroxisomal multifunctional enzyme type 2       Hsd17b4    58         81     56    88
                      …                            …
                      13          Long-chain-fatty-acid--CoA ligase 1           Acsl1     39         53     44    64
                      …                            …

Figure 5. Peroxisome and fatty acid oxidative enzymes are increased in the liver. IHC (a) and western blot (b) results confirmed that catalase was
significantly increased after curcumin supplementation. (c) The protein band near 75 kD of liver lysates exhibited different expression levels for the
commercial diet and curcumin diet groups. (d) Three peroxisomal proteins were identified in the band that were found to be upregulated by LC-MS/
MS. Data are mean ± SD. The Tukey–Kramer method was used for multiple comparisons; *p < 0.05, **p < 0.01.

Dai et al. eLife 2021;10:e63538. DOI: https://doi.org/10.7554/eLife.63538                                                                        9 of 19
Research article                                                                                     Biochemistry and Chemical Biology

                                    Discussion
                                    In previous studies, curcumin was found to exert physiological activities involved in the regulation of
                                    several transcription factors (PPARr, NFkB, AP-1, STAT, etc.) and their signaling pathways
                                    (Liczbiński et al., 2020; Shishodia, 2013). In the present experiment, we found that the gene
                                    expression changes in mouse liver after curcumin supplementation are centered on the PPAR signal-
                                    ing pathway. In the enrichment pathway analysis, most of the DEGs involved in retinol metabolism,
                                    metabolic pathways, fatty acid degradation, and the peroxisome pathway are also downstream of
                                    PPARa. Until now, research on curcumin has mainly focused on the activation of PPARr, and it has
                                    been demonstrated that curcumin participates in glucose and lipid metabolism, inflammatory cyto-
                                    kine production, and inhibiting tumor cell proliferation via PPARr (Shishodia, 2013). Although some
                                    studies have found that PPARa expression is increased after curcumin intake (Kong et al., 2020;
                                    Zeng et al., 2016), there is currently a lack of further experimental results revealing any connection
                                    between curcumin and PPARa pathway activation. Our results complement the theoretical system
                                    suggesting that curcumin regulates the transcription of many genes in the liver depending centrally
                                    on PPARa activation and broadly affects fatty acid transport and catabolism. These changes in genes
                                    and proteins levels may be involved, in which curcumin regulates the occurrence and development
                                    of various diseases or phenotypes, such as amyloidosis, changes in HDL and triglycerides, oxidative
                                    stress, peroxisome proliferation, and hepatocyte hypertrophy (Figure 6).
                                        Due to the unexpected promotion of AApoAII amyloid deposition by curcumin in this study, we
                                    suspect that the anti-amyloid effect of curcumin is not applicable to all types of amyloidosis. To bet-
                                    ter understand the findings of the present study, we suggest that the effects of curcumin on pro-
                                    gression of amyloidosis should be divided into two aspects, one of which is a pro-amyloidosis effect.
                                    In this experiment, the plasma concentration of ApoA-II increased almost threefold (Figure 2a) via
                                    PPARa pathway activation. Levels of amyloid protein are the most important factor for progression
                                    of amyloidosis, and suppression of amyloid protein levels is the main target for treatment of various
                                    systemic amyloidosis, including AA, AL, ATTR, and dialysis-related Aß2M amyloidosis (Merlini and
                                    Bellotti, 2003; Knowles et al., 2014; Calhoun et al., 1999; Zhang et al., 2010; Ueda et al., 2007).

                                                                                                              AApoAII
          Curcumin                                                                                           Amyloidosis

                                                                                                              Peroxisome
                                          PPARα
                                                                                                             Fatty acid
                                                                                                             metabolism
                              PPARα                                                                           Hepatocyte
                                                                                                            hypertrophy
                                                 nucleus
                                           RXR
                                                               Apoa2, Fabp, Cd36, Scd-1,
                                                               Acox㸪Acaa1, Pex11…
                         PPARα         RXR

                                    PPRE

Figure 6. Schematic diagram of the effect of curcumin mediated by PPARa in mouse liver. Curcumin regulates gene expression via PPARa activation
and exhibits biological activities involved in amyloidosis, peroxisome proliferation, lipid metabolism, and hepatocyte hypertrophy.

Dai et al. eLife 2021;10:e63538. DOI: https://doi.org/10.7554/eLife.63538                                                                 10 of 19
Research article Biochemistry and Chemical Biology
In ApoA-II transgenic mice, the serum concentration of ApoA-II increased twofold and AApoAII amy-
loid deposition was notably accelerated (Ge et al., 2007). However, calorie restriction (diet)
decreased the ApoA-II/ApoA-I ratio in serum and suppressed amyloidosis (Li et al., 2017). Thus, we
believe that the pro-amyloid effect of curcumin observed here is mainly caused by increased ApoA-II
levels.
The other aspect is the anti-amyloid effect of curcumin. Curcumin has shown general affinity for
the amyloid protein structure and it has been demonstrated that this binding is efficient to maintain
stability of the amyloid protein and inhibit the formation of insoluble amyloid fibrils (Stefani and
Rigacci, 2013; Ahmad et al., 2017; Hafner-Bratkovic et al., 2008). In addition to direct binding to
amyloid proteins, it has also been shown that curcumin activates autophagy and macrophages in
some studies to reduce the dysfunction caused by amyloid proteins (Zhang et al., 2006; Li et al.,
2014). Moreover, it was reported that some molecules elevate lysosome biosynthesis via activation
of PPARa and accelerate the clearance of amyloid proteins and protein aggregates (Ghosh et al.,
2015; Chandra et al., 2018). Compared with previous data, we noticed that amyloid deposition in
Apoa2c transgenic mice with twice the serum concentration of ApoA-II is more severe than in those
with greater ApoA-II concentrations in this study (Ge et al., 2007). In transgenic mice injected with 1
mg AApoAII fibrils for 8 and 12 weeks, the average amyloid score in the liver and spleen at 12 weeks
and the amyloid index at 8 weeks was 3.4, 4, and 3, respectively, compared with values of 2, 3.4,
and 1.5, respectively, in curcumin-supplemented mice. We believe that this difference demonstrates
that curcumin may also exert a certain anti-amyloid ability in this experiment, but it is difficult to eval-
uate and further analyses should be carried out in the future.
Curcumin interacts with various cellular metabolic pathways by activating PPARs. Most biological
process, such as metabolic control and defect, involve complex molecular interactions and are regu-
lated via various signaling pathways. When amyloid proteins play functional roles in certain meta-
bolic pathways, progression of amyloidosis may be accelerated or decelerated via treatments that
modulate such metabolic pathways. As ApoA-II interacts particularly with lipid metabolism, it is likely
that amyloid deposition was increased by metabolic changes caused by curcumin, including acceler-
ation of ß-oxidation of fatty acids, reduction of lipogenesis, and increased synthesis of
apolipoproteins.
In addition, we think the peroxisome proliferation is the most important factor that explains the
hepatocyte and liver hypertrophy. There was no significant change in food intake between the four
groups investigated in our experiments (Figure 1—figure supplement 2), and no significant lipid
deposition was observed in the liver (Figure 1—figure supplement 4). Peroxisomes in liver paren-
chymal cells are very few and representResearch article Biochemistry and Chemical Biology
the central metabolic role, it was shown that peroxisomes interact with many organelles involved in
cellular lipid metabolism, such as the ER, mitochondria, lysosomes, and lipid droplets
(Schrader et al., 2015; Wanders et al., 2018; Sugiura et al., 2017). There is also functional inter-
play between peroxisomes and the nucleus, which may also involve signaling via H2O2
(Schrader et al., 2013; Mullineaux et al., 2018).
Other means by which peroxisome proliferation affects ER or mitochondrial functions are also
known. However, the mechanism by which curcumin activates PPARs is not yet clear. There are two
means of activating PPARs, namely ligand-dependent and ligand-independent. In the ligand-depen-
dent manner, the molecular shape of PPARs is modified by ligand binding in the cytoplasm, and
PPARs enter into the nucleus. In a ligand-independent manner, PPARs can be phosphorylated by
protein kinases to induce a structural change of phosphorylated PPARs, even in the absence of
ligands (Lamichane et al., 2018; Harmon et al., 2011; Magadum and Engel, 2018). Further experi-
ments are needed to confirm whether curcumin directly binds and activates PPARs as an exogenous
ligand, or whether activation involves a ligand-independent pathway.
PPARa and PPARr involve different aspects of metabolic pathways, such as decomposition or
storage of fatty acids, fatty acid-based energy production, or glucose-based energy production.
PPARa agonists (e.g., fibrates) or PPARr agonists (e.g., thiazolidinedione) play important roles in the
treatment of hyperlipidemia and type 2 diabetes in the clinic. PPARa/r dual agonists are also under
development to treat more complex metabolic diseases, but some exhibit side effects and cause
liver or cardiac dysfunction (Kim et al., 2019; Kalliora et al., 2019). In clinical trials, it has been dem-
onstrated that supplementation with curcumin at a high dose is safe in humans (Sahebkar, 2014;
Chen et al., 2015). Improving the molecular structure of drugs based on that of curcumin offers the
possibility to produce dual or specific agonists without side effects.
Taken together, our results demonstrate the novel agonistic effect of curcumin on PPARa. We
identified specific effects of curcumin on mice, including promotion of AApoAII amyloidosis and per-
oxisome proliferation. Curcumin is involved in various physiological activities mediated by PPARs
activation, leading to regulation of genes participating in the PPAR pathway. The beneficial use of
curcumin based on these particular abilities requires further consideration. The development of
derivative agents based on curcumin with high bioavailability or specific effects may have far-reach-
ing significance for the treatment of diseases such as amyloidosis, hyperlipidemia, type 2 diabetes,
and other metabolic disorders.
Materials and methods
Animals and drug administration
R1.P1-Apoa2c congenic mice were used in this study, which carry the amyloidogenic type c allele
(Apoa2c) of amyloidosis-susceptible SAMP1 strain on a genetic background of the SAMR1 strain. R1.
P1-Apoa2c mice exhibit a normal aging process and develop accelerated AApoAII amyloidosis by
oral or intravenous administration of AApoAII fibrils (Higuchi et al., 1995). Mice were maintained
under SPF conditions at 24 ± 2˚C with a light-controlled regimen (12 hr light/dark cycle) in the Divi-
sion of Animal Research, Research Center for Supports to Advanced Science, Shinshu University. The
mice were fed a commercial diet (Con group and A-NT group) or curcumin diet (Cur group and
A-Cur group) and tap water ad libitum. The commercial diet is a MF diet (Oriental Yeast, Tokyo,
Japan) and the curcumin diet is the MF diet supplemented with 0.5% or 2% w/w curcumin (Wako,
Osaka, Japan).
Three to five R1.P1-Apoa2c congenic mice were housed in a single cage. Female mice were used
for experiments to avoid the anticipated adverse impacts due to fighting among male mice. Mice
were sacrificed by cardiac puncture under deep sevoflurane anesthesia after 8 weeks and 12 weeks
of curcumin intake. Plasma and half of the major organs (heart, liver, spleen, stomach, small intestine,
tongue, skin, lung, and kidney) were snap-frozen by liquid nitrogen and stored at 80˚C for bio-
chemical analysis. The remaining organs were fixed in 10% neutral buffered formalin followed by
embedding in paraffin for histochemical analysis. All experiments were approved by the Committee
for Animal Experiments of Shinshu University (Approval No. 280086).
Dai et al. eLife 2021;10:e63538. DOI: https://doi.org/10.7554/eLife.63538 12 of 19Research article Biochemistry and Chemical Biology
Induction of AApoAII amyloidosis
AApoAII amyloid fibrils were isolated using Pras’ method (Pras et al., 1969) from the livers of R1.P1-
Apoa2c mice having severe amyloid deposits. Mice in the amyloid-induced groups were injected
with 1 mg amyloid fibrils into the tail vein for induction of AApoAII amyloidosis at 8 weeks of age.
AApoAII fibrils were sonicated before use and the injection was performed immediately.
Evaluation of amyloid deposition
Amyloid deposits were detected in paraffin organ sections stained with a saturated solution of 1%
Congo red dye. An amyloid score (from 0 to 4) in each organ was determined semi-quantitatively as
described previously (Xing et al., 2002) under polarizing light microscopy (LM) (Axioskop 2, Carl
Zeiss, Tokyo, Japan). Two observers, with no information of the Congo red stained tissues, graded
the degree of amyloid deposition in each mouse, separately. The degree of amyloid deposition in
each mouse was represented by an amyloid index (AI), which is the average of the amyloid scores in
seven organs (heart, liver, spleen, stomach, small intestine, tongue, and skin).
Hepatocyte size in each group
To analyze the hepatocyte size in each mouse quantitatively, we captured five images of each sec-
tion selected randomly at 400 magnification and determined the average hepatocyte size in each
image by calculating the total area divided by the cell counts using an image processing program
(NIH ImageJ software, version 1.61). We determined the average hepatocyte size of each mouse
and then performed a statistical analysis between all four groups.
Immunohistochemistry and immunofluorescence analysis
We detected AApoAII deposition and catalase by immunohistochemistry (IHC) following a previously
described method (Li et al., 2017). Antiserum against mouse ApoA-II was produced against guani-
dine hydrochloride-denatured AApoAII in our laboratory (Higuchi et al., 1983) and applied at a dilu-
tion ratio of 1:3000. Catalase antibody was applied (1:500, GTX110704, GeneTex Inc, CA, USA) to
reveal the degree of peroxisome change in the liver. After incubation overnight at 4˚C with the pri-
mary antibody, the sections were incubated with the biotinylated secondary antibody (1:300, DAKO,
Glostrup, Denmark) for 1 hr at room temperature. Target proteins were identified by the horseradish
peroxidase-labeled streptavidin-biotin method (1:300, DAKO). In the immunofluorescence experi-
ments, the sections were incubated with the PPARa antibody (1:500, GTX101098, GeneTex Inc, CA,
USA) overnight and incubated with Alexa Fluor 488 goat anti-rabbit antibody (1:500, Thermo Fisher
Scientific, Japan) for 1 hr at room temperature and incubated with DAPI for 10 min. Images were
captured immediately using a confocal laser fluorescence microscope (LSM 880 with Airyscan, Carl
Zeiss, Germany). In a negative control section, the primary antibody was omitted to confirm the
specificity of staining.
Lipid metabolism analysis
Lipid metabolism levels were determined using quantitative assay kits by means of HDL cholesterol,
total cholesterol, and triglyceride concentrations in the plasma with the instructions provided by the
manufacturer (HDL-cholesterol E test, 431–52501; Total-cholesterol E test, 439–17501; TG E test,
432–40201, FUJI FILM Wako, Osaka, Japan). Each sample repeated at least three times.
AST and ALT detection
Two hundred microliters of frozen mouse plasma per mouse was sent to Nagahama life science labo-
ratory (Oriental Yeast, Tokyo, Japan) for determination of AST and ALT levels. The laboratory pro-
vided a test report.
Immunoblot analysis
We measured proteins levels by western blotting as described previously (Ge et al., 2007; Li et al.,
2017). To determine plasma levels of ApoA-II, ApoA-I, and ApoE, 0.5 mL samples from each mouse
were separated by Tris-Tricine/SDS–16.5% or 15% polyacrylamide gel electrophoresis (PAGE). After
electrophoresis, proteins were transferred to a polyvinylidene difluoride (PVDF) membrane (Immobi-
lon, 0.2 mm pore, Millipore Corp., MA, USA) and incubated overnight at 4˚C with primary antibody
Dai et al. eLife 2021;10:e63538. DOI: https://doi.org/10.7554/eLife.63538 13 of 19Research article Biochemistry and Chemical Biology
solution containing polyclonal rabbit anti-mouse ApoA-II antiserum (diluted 1:3000) or the ApoA-I
antiserum (diluted 1:4000) produced in our laboratory, or ApoE antibody (1:500, Santa Cruz, San
Francisco, CA, USA). Next, horseradish peroxidase-conjugated anti-rabbit IgG (Code #7074, Cell
Signaling Technology Inc, Danvers, MA, USA) (1:3000) was used for 1 hr incubation at room temper-
ature and target proteins were detected by the enhanced chemiluminescence (ECL) method. Thirty
micrograms of liver lysates were separated on Tris-Tricine/SDS–12% PAGE to determine levels of
PPARa (1:3000, GTX101098, GeneTex Inc), b-actin (1:3000, GTX110564, GeneTex Inc), and catalase
(1:3000, GTX110704, GeneTex Inc, CA, USA). Target protein levels were analyzed using the NIH
ImageJ software.
RNA sequence analysis
We selected liver samples from the 12-week group for RNA sequence analysis, which exhibit more
obvious amyloid deposition in amyloid-induced animals and no abnormal changes in AST and ALT
levels. Ten milligrams of each mouse liver stored at 80˚C was homogenized in TRIzol RNA isolation
reagent (Invitrogen-Thermo Fisher, Tokyo Japan) and pooled into four sample tubes (Con, Cur,
A-NT and A-Cur groups, N = 3–5), and the samples were sent to Filgen (Nagoya, Japan). Total RNA
was extracted and the RNA purity and integrity were confirmed using a Bioanalyzer 2100 system
(Agilent Technology, Santa Clara, CA USA). mRNA sequencing analysis was performed with an Illu-
mina next generation sequencing platform. Sequencing count data were analyzed using the DESeq2
software to determine the significant DEGs among the different groups. Biological functions into
which DEGs accumulated were analyzed using an annotation database (Gene Ontology and KEGG
Pathway Database) to elucidate the mechanism of the effects of curcumin supplementation.
Gene expression analysis
We followed a previously described method to confirm mRNA expression levels (Tian et al., 2014).
Quantitative real-time qPCR analysis was carried out using an ABI PRISM 7500 Sequence Detection
system (Applied Biosystems, New York, USA) with SYBR Green (TaKaRa Bio, Tokyo, Japan). The b-
actin gene was used to normalize gene expression. Each sample repeated at least three times. The
forward and reverse primer sequences for real-time PCR are listed in Supplementary file 3. Chemi-
cal reagents used in the experiments, unless otherwise specified, were obtained from Wako Pure
Chemical Industries Ltd. (Osaka, Japan).
Nano-flow liquid chromatography-ion trap mass spectrometry (LC-MS/
MS)
Thirty micrograms of liver lysates were separated on Tris-Tricine/SDS–12% PAGE and stained with
Coomassie brilliant blue for 20 min. The stained bands near 75 kD were excised and soaked in 50
mM Tris-HCl, pH 8.0, containing 50% acetonitrile for 30 min. The gel was dried in a Speed-Vac
(Savant) and incubated in 50 mM triethylammonium bicarbonate containing proteomics grade tryp-
sin (Sigma-Aldrich, Tokyo, Japan) at 37˚C for 20 hr. The digests were extracted from the gel with
100–200 mL of 0.1% TFA containing 60% acetonitrile. These extracts were evaporated in a Speed-
Vac and stored at 80˚C until assayed.
Samples were resuspended in 0.1% formic acid and introduced into a nano-flow HPLC system,
EASY-nLC 1200 (Thermo Fisher Scientific Inc, Waltham, MA, USA). A packed nano-capillary column,
NTCC-360/75-3-123 (0.075 mm I.D. 125 mm L, particle diameter 3 mm, Nikkyo Technos Co., Ltd.,
Tokyo, Japan), was used at a flow rate of 300 nL/min with a 2–80% linear gradient of acetonitrile for
80 min. Eluted peptides were directly detected with an ion trap mass spectrometer (QExactive HF;
Thermo Fisher Scientific Inc, Waltham, MA, USA). For ionization, a spray voltage of 2.0 kV and capil-
lary temperature of 250˚C were used. The mass acquisition method consisted of one full MS survey
scan with an Orbitrap resolution of 60,000, followed by an MS/MS scan of the most abundant pre-
cursor ions from the survey scan with an Orbitrap resolution of 15,000. Dynamic exclusion for the
MS/MS was set to 30 s. An MS scan range of 350–1800 m/z was employed in the positive ion mode,
followed by data-dependent MS/MS using the HCD operating mode on the top 15 ions in order of
abundance. The data were analyzed with Proteome Discoverer (Thermo Fisher Scientific Inc, Wal-
tham, MA, USA), Mascot software (Matrix Science Inc, Boston, MA, USA), and Scaffold software
(Proteome Software, Inc, Oregon, USA). Swissprot and GenBank databases were used.
Dai et al. eLife 2021;10:e63538. DOI: https://doi.org/10.7554/eLife.63538 14 of 19Research article Biochemistry and Chemical Biology
Statistical analyses
For comparison of parametrical data, one-way analysis of variance (ANOVA) with Tukey’s test was
performed using the SPSS 26.0 software package (Abacus Concepts, Berkley, CA USA). For compari-
son of nonparametric data, the Kruskal–Wallis test with the Steel–Dwass test was performed using
the R software version 3.4.3. p-valuesResearch article Biochemistry and Chemical Biology
. Transparent reporting form
Data availability
The data used to support the findings of this study are included within the article. Key RNA seq anal-
ysis data is available on Dryad (https://doi.org/10.5061/dryad.9ghx3ffgm). All other data supporting
the findings of this study will be made available upon reasonable request to the corresponding
authors.
The following dataset was generated:
Database and
Author(s) Year Dataset title Dataset URL Identifier
Dai J, Li Y, 2021 The results of RNA seq analysis https://doi.org/10.5061/ Dryad Digital
Kametani F, Cui X, (Curcumin promotes progression of dryad.9ghx3ffgm Repository, 10.5061/
Igarashi Y, AApoAII amyloidosis and dryad.9ghx3ffgm
Miyahara H, Mori peroxisome proliferation in mice by
M, Higuchi K activating the PPAR signaling
pathway)
References
Ahmad B, Borana MS, Chaudhary AP. 2017. Understanding curcumin-induced modulation of protein
aggregation. International Journal of Biological Macromolecules 100:89–96. DOI: https://doi.org/10.1016/j.
ijbiomac.2016.06.053, PMID: 27327907
Benson MD, Buxbaum JN, Eisenberg DS, Merlini G, Saraiva MJM, Sekijima Y, Sipe JD, Westermark P. 2018.
Amyloid nomenclature 2018: recommendations by the international society of amyloidosis (ISA) nomenclature
committee. Amyloid 25:215–219. DOI: https://doi.org/10.1080/13506129.2018.1549825, PMID: 30614283
Calhoun ME, Burgermeister P, Phinney AL, Stalder M, Tolnay M, Wiederhold KH, Abramowski D, Sturchler-
Pierrat C, Sommer B, Staufenbiel M, Jucker M. 1999. Neuronal overexpression of mutant amyloid precursor
protein results in prominent deposition of cerebrovascular amyloid. PNAS 96:14088–14093. DOI: https://doi.
org/10.1073/pnas.96.24.14088, PMID: 10570203
Chandra S, Jana M, Pahan K. 2018. Aspirin induces lysosomal biogenesis and attenuates amyloid plaque
pathology in a mouse model of Alzheimer’s disease via PPARa. The Journal of Neuroscience 38:6682–6699.
DOI: https://doi.org/10.1523/JNEUROSCI.0054-18.2018, PMID: 29967008
Chen FY, Zhou J, Guo N, Ma WG, Huang X, Wang H, Yuan ZY. 2015. Curcumin retunes cholesterol transport
homeostasis and inflammation response in M1 macrophage to prevent atherosclerosis. Biochemical and
Biophysical Research Communications 467:872–878. DOI: https://doi.org/10.1016/j.bbrc.2015.10.051,
PMID: 26471308
Corton JC, Peters JM, Klaunig JE. 2018. The PPARa-dependent rodent liver tumor response is not relevant to
humans: addressing misconceptions. Archives of Toxicology 92:83–119. DOI: https://doi.org/10.1007/s00204-
017-2094-7, PMID: 29197930
Dai J, Ding X, Miyahara H, Xu Z, Cui X, Igarashi Y, Sawashita J, Mori M, Higuchi K. 2019. Suppression of mouse
AApoAII amyloidosis progression by daily supplementation with oxidative stress inhibitors. Oxidative Medicine
and Cellular Longevity 2019:1–14. DOI: https://doi.org/10.1155/2019/1263274
Erdmann R, Blobel G. 1995. Giant peroxisomes in oleic acid-induced Saccharomyces cerevisiae lacking the
peroxisomal membrane protein Pmp27p. Journal of Cell Biology 128:509–523. DOI: https://doi.org/10.1083/
jcb.128.4.509
Fahimi HD. 1969. Cytochemical localization of peroxidatic activity of catalase in rat hepatic microbodies
(PEROXISOMES). Journal of Cell Biology 43:275–288. DOI: https://doi.org/10.1083/jcb.43.2.275
Farré JC, Mahalingam SS, Proietto M, Subramani S. 2019. Peroxisome biogenesis, membrane contact sites, and
quality control. EMBO Reports 20:e46864. DOI: https://doi.org/10.15252/embr.201846864, PMID: 30530632
Ferreira N, Santos SA, Domingues MR, Saraiva MJ, Almeida MR. 2013. Dietary curcumin counteracts
extracellular transthyretin deposition: insights on the mechanism of amyloid inhibition. Biochimica Et Biophysica
Acta (BBA) - Molecular Basis of Disease 1832:39–45. DOI: https://doi.org/10.1016/j.bbadis.2012.10.007,
PMID: 23069388
Ferreira N, Gonçalves NP, Saraiva MJ, Almeida MR. 2016. Curcumin: a multi-target disease-modifying agent for
late-stage transthyretin amyloidosis. Scientific Reports 6:26623. DOI: https://doi.org/10.1038/srep26623,
PMID: 27197872
Ge F, Yao J, Fu X, Guo Z, Yan J, Zhang B, Zhang H, Tomozawa H, Miyazaki J, Sawashita J, Mori M, Higuchi K.
2007. Amyloidosis in transgenic mice expressing murine amyloidogenic apolipoprotein A-II (Apoa2c).
Laboratory Investigation 87:633–643. DOI: https://doi.org/10.1038/labinvest.3700559, PMID: 17468778
Ghosh A, Jana M, Modi K, Gonzalez FJ, Sims KB, Berry-Kravis E, Pahan K. 2015. Activation of peroxisome
proliferator-activated receptor a induces lysosomal biogenesis in brain cells: implications for lysosomal storage
disorders. Journal of Biological Chemistry 290:10309–10324. DOI: https://doi.org/10.1074/jbc.M114.610659
Dai et al. eLife 2021;10:e63538. DOI: https://doi.org/10.7554/eLife.63538 16 of 19Research article Biochemistry and Chemical Biology
Goldman BM, Blobel G. 1978. Biogenesis of peroxisomes: intracellular site of synthesis of catalase and uricase.
PNAS 75:5066–5070. DOI: https://doi.org/10.1073/pnas.75.10.5066, PMID: 368807
Golombick T, Diamond TH, Manoharan A, Ramakrishna R. 2015. Ramakrishna R: stabilisation of laryngeal AL
amyloidosis with long term curcumin therapy. Case Reports in Hematology 2015:910528. DOI: https://doi.org/
10.1155/2015/910528, PMID: 26199769
Hafner-Bratkovic I, Gaspersic J, Smid LM, Bresjanac M, Jerala R. 2008. Curcumin binds to the alpha-helical
intermediate and to the amyloid form of prion protein - a new mechanism for the inhibition of PrP(Sc)
accumulation. Journal of Neurochemistry 104:1553–1564. DOI: https://doi.org/10.1111/j.1471-4159.2007.
05105.x, PMID: 17996023
Harmon GS, Lam MT, Glass CK. 2011. PPARs and lipid ligands in inflammation and metabolism. Chemical
Reviews 111:6321–6340. DOI: https://doi.org/10.1021/cr2001355, PMID: 21988241
Higuchi K, Matsumura A, Honma A, Takeshita S, Hashimoto K, Hosokawa M, Yasuhira K, Takeda T. 1983.
Systemic senile amyloid in senescence-accelerated mice. A unique fibril protein demonstrated in tissues from
various organs by the unlabeled immunoperoxidase method. Laboratory Investigation; a Journal of Technical
Methods and Pathology 48:231–240. PMID: 6337302
Higuchi K, Naiki H, Kitagawa K, Kitado H, Kogishi K, Matsushita T, Takeda T. 1995. Apolipoprotein A-II gene and
development of amyloidosis and senescence in a congenic strain of mice carrying amyloidogenic ApoA-II.
Laboratory Investigation; a Journal of Technical Methods and Pathology 72:75–82. PMID: 7837794
Islinger M, Voelkl A, Fahimi HD, Schrader M. 2018. The peroxisome: an update on mysteries 2.0. Histochemistry
and Cell Biology 150:443–471. DOI: https://doi.org/10.1007/s00418-018-1722-5, PMID: 30219925
Janani C, Ranjitha Kumari BD. 2015. PPAR Gamma Gene–a review. Diabetes & Metabolic Syndrome: Clinical
Research & Reviews 9:46–50. DOI: https://doi.org/10.1016/j.dsx.2014.09.015, PMID: 25450819
Kalliora C, Kyriazis ID, Oka S, Lieu MJ, Yue Y, Area-Gomez E, Pol CJ, Tian Y, Mizushima W, Chin A, Scerbo D,
Schulze PC, Civelek M, Sadoshima J, Madesh M, Goldberg IJ, Drosatos K. 2019. Dual PPARa/g activation
inhibitsSIRT1-PGC1a Axis and causes cardiac dysfunction. JCI Insight 4:17. DOI: https://doi.org/10.1172/jci.
insight.129556
Kim SH, Hong SH, Park YJ, Sung JH, Suh W, Lee KW, Jung K, Lim C, Kim JH, Kim H, Park KS, Park SG. 2019.
MD001, a novel peroxisome Proliferator-activated receptor a/g agonist, improves glucose and lipid
metabolism. Scientific Reports 9:1656. DOI: https://doi.org/10.1038/s41598-018-38281-0, PMID: 30733541
Knoblach B, Rachubinski RA. 2010. Phosphorylation-dependent activation of peroxisome proliferator protein
PEX11 controls peroxisome abundance. Journal of Biological Chemistry 285:6670–6680. DOI: https://doi.org/
10.1074/jbc.M109.094805
Knowles TP, Vendruscolo M, Dobson CM. 2014. The amyloid state and its association with protein misfolding
diseases. Nature Reviews Molecular Cell Biology 15:384–396. DOI: https://doi.org/10.1038/nrm3810, PMID: 24
854788
Kong D, Zhang Z, Chen L, Huang W, Zhang F, Wang L, Wang Y, Cao P, Zheng S. 2020. Curcumin blunts
epithelial-mesenchymal transition of hepatocytes to alleviate hepatic fibrosis through regulating oxidative stress
and autophagy. Redox Biology 36:101600. DOI: https://doi.org/10.1016/j.redox.2020.101600, PMID: 32526690
Lamichane S, Dahal Lamichane B, Kwon S-M. 2018. Pivotal roles of peroxisome Proliferator-Activated receptors
(PPARs) and their signal cascade for cellular and Whole-Body energy homeostasis. International Journal of
Molecular Sciences 19:949. DOI: https://doi.org/10.3390/ijms19040949
Lee SS, Pineau T, Drago J, Lee EJ, Owens JW, Kroetz DL, Fernandez-Salguero PM, Westphal H, Gonzalez FJ.
1995. Targeted disruption of the alpha isoform of the peroxisome proliferator-activated receptor gene in mice
results in abolishment of the pleiotropic effects of peroxisome proliferators. Molecular and Cellular Biology 15:
3012–3022. DOI: https://doi.org/10.1128/MCB.15.6.3012, PMID: 7539101
Li H, Zhang Y, Cao L, Xiong R, Zhang B, Wu L, Zhao Z, Chen SD. 2014. Curcumin could reduce the monomer of
TTR with Tyr114Cys mutation via autophagy in cell model of familial amyloid polyneuropathy. Drug Design,
Development and Therapy 8:2121–2128. DOI: https://doi.org/10.2147/DDDT.S70866, PMID: 25382970
Li L, Sawashita J, Ding X, Yang M, Xu Z, Miyahara H, Mori M, Higuchi K. 2017. Caloric restriction reduces the
systemic progression of mouse AApoAII amyloidosis. PLOS ONE 12:e0172402. DOI: https://doi.org/10.1371/
journal.pone.0172402, PMID: 28225824
Liczbiński P, Michałowicz J, Bukowska B. 2020. Molecular mechanism of curcumin action in signaling pathways:
review of the latest research. Phytotherapy Research 34:1992–2005. DOI: https://doi.org/10.1002/ptr.6663,
PMID: 32141677
Lim GP, Chu T, Yang F, Beech W, Frautschy SA, Cole GM. 2001. The curry spice curcumin reduces oxidative
damage and amyloid pathology in an Alzheimer transgenic mouse. The Journal of Neuroscience 21:8370–8377.
DOI: https://doi.org/10.1523/JNEUROSCI.21-21-08370.2001, PMID: 11606625
Liu C, Guo Q, Lu M, Li Y. 2015. An experimental study on amelioration of dyslipidemia-induced atherosclesis by
clematichinenoside through regulating peroxisome proliferator-activated receptor-a mediated apolipoprotein
A-I, A-II and C-III. European Journal of Pharmacology 761:362–374. DOI: https://doi.org/10.1016/j.ejphar.2015.
04.015, PMID: 25979856
Ma Q-L Z , Yang F, Ubeda OJ, Gant DJ, Alaverdyan M, Teng E, Hu S, Chen P-P, Maiti P. 2013. Curcumin
suppresses soluble tau dimers and corrects molecular chaperone, synaptic, and behavioral deficits in aged
human tau transgenic mice. Journal of Biological Chemistry 288:4056–4065. DOI: https://doi.org/10.1074/jbc.
M112.393751
Magadum A, Engel FB. 2018. PPARb/d: linking metabolism to regeneration. International Journal of Molecular
Sciences 7:2013. DOI: https://doi.org/10.3390/ijms19072013
Dai et al. eLife 2021;10:e63538. DOI: https://doi.org/10.7554/eLife.63538 17 of 19You can also read


