Embryonic geometry underlies phenotypic variation in decanalized conditions - eLife
←
→
Page content transcription
If your browser does not render page correctly, please read the page content below
RESEARCH ARTICLE

                                   Embryonic geometry underlies
                                   phenotypic variation in decanalized
                                   conditions
                                   Anqi Huang1, Jean-François Rupprecht1,2, Timothy E Saunders1,3,4*
                                   1
                                    Mechanobiology Institute, National University of Singapore, Singapore, Singapore;
                                   2
                                    CNRS and Turing Center for Living Systems, Centre de Physique Théorique, Aix-
                                   Marseille Université, Marseille, France; 3Department of Biological Sciences, National
                                   University of Singapore, Singapore, Singapore; 4Institute of Molecular and Cell
                                   Biology, Proteos, A*Star, Singapore, Singapore

                                   Abstract During development, many mutations cause increased variation in phenotypic
                                   outcomes, a phenomenon termed decanalization. Phenotypic discordance is often observed in the
                                   absence of genetic and environmental variations, but the mechanisms underlying such inter-
                                   individual phenotypic discordance remain elusive. Here, using the anterior-posterior (AP) patterning
                                   of the Drosophila embryo, we identified embryonic geometry as a key factor predetermining
                                   patterning outcomes under decanalizing mutations. With the wild-type AP patterning network, we
                                   found that AP patterning is robust to variations in embryonic geometry; segmentation gene
                                   expression remains reproducible even when the embryo aspect ratio is artificially reduced by more
                                   than twofold. In contrast, embryonic geometry is highly predictive of individual patterning defects
                                   under decanalized conditions of either increased bicoid (bcd) dosage or bcd knockout. We showed
                                   that the phenotypic discordance can be traced back to variations in the gap gene expression,
                                   which is rendered sensitive to the geometry of the embryo under mutations.

*For correspondence:
dbsste@nus.edu.sg
                                   Introduction
Competing interests: The
                                   The phenomenon of canalization describes the constancy in developmental outcomes between dif-
authors declare that no
                                   ferent individuals within a wild-type species growing in their native environments (Flatt, 2005;
competing interests exist.
                                   Hallgrimsson et al., 2019; Waddington, 1942). To better understand how canalized a developmen-
Funding: See page 18               tal process is, we need to quantitatively measure the molecular profiles of the developmental regula-
Received: 03 April 2019            tory genes in multi-cellular organisms. In Drosophila, the highly reproducible body patterning in
Accepted: 11 February 2020         adult flies originates from both the reproducible setup of the instructive morphogen gradients and
Published: 12 February 2020        the precise downstream transcriptional readouts early in embryogenesis (Bollenbach et al., 2008;
                                   Gregor et al., 2007a; Petkova et al., 2014). In particular, the inter-individual variation of the posi-
Reviewing editor: Naama
Barkai, Weizmann Institute of
                                   tional information conferred by gene expression can be less than the width of a single cell
Science, Israel                    (Dubuis et al., 2013; Gregor et al., 2007a); that is these processes are highly canalized. Given the
                                   ubiquity of canalization in nature, such highly reproducible developmental processes are likely not
   Copyright Huang et al. This
                                   exclusive to insect development.
article is distributed under the
                                       The developmental canalization that we see in contemporary species is the product of evolution,
terms of the Creative Commons
Attribution License, which         either as the consequence of stabilizing selection (Gibson and Wagner, 2000) or the manifestation
permits unrestricted use and       of the intrinsic properties of the underlying complex gene regulatory networks (Siegal and Berg-
redistribution provided that the   man, 2002). Canalization can break down in individuals subjected to aberrant genetic mutations or
original author and source are     extreme environmental conditions (Imasheva et al., 1997; Rutherford and Lindquist, 1998). Such
credited.                          individuals in decanalized conditions become sensitive to variations in their genetic background and

Huang et al. eLife 2020;9:e47380. DOI: https://doi.org/10.7554/eLife.47380                                                         1 of 21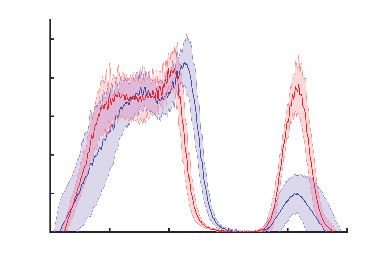
Research article                                                                                         Developmental Biology

                                   external environments, which are otherwise neutral to developmental outcomes. This leads to signifi-
                                   cantly increased inter-individual variation in phenotypic outcomes.
                                       It is important to characterize the sources of variation in order to understand what canalization is
                                   actually buffering against. Interestingly, significant phenotypic variation remains in laboratory animals
                                   with isogenic genomes, exposed to homogeneous environments (Gärtner, 1990). This indicates that
                                   under decanalized conditions, other components besides genetic and environmental variation may
                                   also cause phenotypic discordance. Previous work has proposed that stochastic expression of redun-
                                   dant genes predicts the developmental outcome of the mutant individuals (Burga et al., 2011).
                                   However, in many other cases, it remains elusive as to why mutation increases inter-individual pheno-
                                   typic variation and what alternative components underlie such variation (Janssens et al., 2013;
                                   Surkova et al., 2013).
                                       To identify potential sources of variation that govern phenotypic discordance, we utilized the
                                   highly canalized process of early Drosophila embryonic AP patterning. We proposed that the inter-
                                   individual variation of the embryonic geometry is one of the factors that predetermine individual pat-
                                   terning outcomes under decanalizing mutations. We found that the patterning system in genetically
                                   intact embryos has a striking capacity to buffer against variations in embryonic geometry. When we
                                   artificially reduced the aspect ratio of the embryos by more than twofold, the relative boundary posi-
                                   tions of segmentation genes showed only a minor shift compared to that of the wild type. The pres-
                                   ervation of the boundary positions can be, at least partially, attributed to changes in the Bcd
                                   gradient profile due to the rounder embryonic shape in the shorter embryos. Importantly, the inter-
                                   individual variations of boundary positions remained comparable to that of the wild type. In contrast,
                                   when we introduced decanalizing mutations such as increased maternal bcd dosage or bcd knock-
                                   out, the embryonic geometry becomes predictive of patterning outcomes of individuals. In both sce-
                                   narios, the inter-individual phenotypic discordance can be traced back to variations in gap gene
                                   expression patterns. This suggests that under decanalized conditions particular gene interactions are
                                   preferentially affected by geometric constraints. Taken together, our study reveals embryo geome-
                                   try, or more generally the physical domain in which patterning occurs, is a significant source of varia-
                                   tion that can account for phenotypic discordance under decanalized conditions.

                                   Results
                                   Embryos with dramatically reduced embryonic length still proceed with
                                   normal development
                                   Scaling is one of the most astonishing features of embryonic patterning in dipteran insects. The
                                   expression boundaries of the early patterning genes reside at conserved relative positions among
                                   closely related dipteran species, although they differ dramatically in egg size (Gregor et al., 2005).
                                   Such inter-species scaling can be attributed to the Bcd gradient of a conserved characteristic length
                                   (Gregor et al., 2008). Within the Drosophila species, individual embryos of different size also exhibit
                                   scaled pattern as a consequence of adapted Bcd production and degradation rate (Cheung et al.,
                                   2011; Cheung et al., 2014). We propose here that another macroscopic variable that the patterning
                                   system needs to adapt to in order to ensure scaling is the geometry, or shape of the egg. Given a
                                   defined embryonic volume, the embryos can vary significantly in their aspect ratio (AR = embryonic
                                   length/embryonic width, Figure 1A). Since Bcd molecules diffuse mainly at the cortical region of the
                                   embryo (Gregor et al., 2007b), varying embryonic geometry affects the effective diffusion area, and
                                   thus the length and time scales of the morphogen gradient formation (Grimm et al., 2010). There-
                                   fore, we first examined how altering embryonic geometry affects embryonic patterning.
                                      The geometry of each embryo is predetermined during oogenesis when the follicle cells sur-
                                   rounding the egg chamber transform the developing egg from a sphere to an ellipse (Haigo and
                                   Bilder, 2011; He et al., 2010b). This process is mediated by the planar cell polarity of the follicle
                                   cells and the elliptical shape of the embryos remains unchanged throughout embryogenesis. Here,
                                   we used maternal ShRNA to knockdown one of the planar cell polarity core components, atypical
                                   cadherin Fat2 specifically in the follicle cells (Horne-Badovinac et al., 2012), and we henceforth refer
                                   to these as fat2RNAi embryos. As Fat2 expression is only inhibited within the somatic cells of the
                                   egg chamber using traffic jam (tj) >Gal4 driver, the fertilized eggs produced by this perturbation
                                   remain genetically intact. This reduces the embryonic length from 510 ± 17 (s.d.) mm in wild type to

Huang et al. eLife 2020;9:e47380. DOI: https://doi.org/10.7554/eLife.47380                                                           2 of 21
Research article Developmental Biology
A length B C
width
30 3.2
40 3.0 WT
25
frequency (%)
WT WT 2.8 fat2RNAi
frequency (%)
aspect ratio
20 fat2RNAi 30 2.6
fat2RNAi 2.4
15 2.2
20 2.0
10 1.8
5 10 1.6
1.4
0 0 1.2
300 350 400 450 500 550 600 170 180 190 200 210 220 230 240 300 350 400 450 500 550 600
embryonic length (µm) embryonic width (µm) embryonic length (µm)
D 95 E F
EGFP::Bcd
nuclei in AP axis
90
85 WT
80 fat2RNAi
ctrl
fat2RNAi
75
70
fat2RNAi
65
60
55
300 350 400 450 500 550 600 En::GFP
embryonic length (µm)
G H
fluorescent intensity
3
fluorescent intensity
3
6 x10 6 x10
Normalized Bcd nuclear
Embryonic 600 0.5
fluorescent intensity
5 5 length (µm) 550 1
raw nuclear
raw nuclear
0.3
4 4 500
3 3 450 0.1
0.4 0.5 0.6
2 2 400
1 1 350 EL > 450 µm
(/P
0 0 300 0
0 100 200 300 400 500 600 0 0.2 0.4 0.6 0.8 1 0 0.2 0.4 0.6 0.8 1
Embryonic length (µm) x/L x/L
Difference Normalized Bcd nuclear
I J 2 K
fluorescent intensity
Nuclear cycle 11 Nuclear cycle 4
Normalized fluorescent intensity
WT ctrl exp
1 fat2RNAi exp
Wild type
fat2RNAi ctrl sim
1 fat2RNAi sim
2
fat2RNAi 0
Nuclear cycle 11
0.4 Experiment
1 0.2 Theory
0.0
0 100 200 0 0.2 0.4 0.6 0.8 1
Embryonic length (µm) x/L
Figure 1. The Bcd gradient in embryos with differing geometry is consistent with the SDD model. (A) Distribution
of embryonic length in wild type (n = 239) and fat2RNAi (n = 364) embryos. (B) Distribution of embryonic width in
wild type (n = 239) and fat2RNAi (n = 364) embryos. (C) Aspect ratio (EL/EW) against embryonic length for each
embryo. Black dots denote expected aspect ratio if embryonic volume is conserved (assuming ellipsoidal
geometry). (D) Number of nuclei along the AP axis plotted against embryonic length in wild type and fat2RNAi
embryos. Line indicates linear regression of all data. (E) En expression in fat2RNAi embryos showing defective
dorsal closure (left) or normal morphogenesis (right). Arrows indicate locations of defects. Green dots indicate En
stripes. (F) Midsagittal plane of ctrl (top) and fat2RNAi (bottom) embryos expressing eGFP::Bcd in mid n.c. 14. (G)
eGFP::Bcd profiles of both ctrl and fat2RNAi embryos plotted as a function of absolute distance from the anterior
pole (left) or scaled AP position (right). Each dot represents the average concentration in a single nucleus.
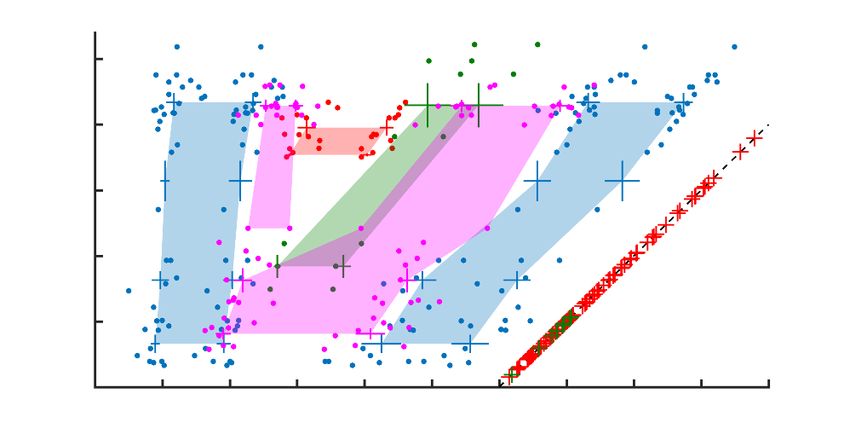
Colormap indicates the absolute AP length of each individual. (H) Mean and standard deviation of nuclear
intensity within each 2% EL were computed for group of embryos longer (red, n = 27) and shorter (blue, n = 17)
than 450 mm. Inset is close-up of profile near embryo midpoint to show the intersection of the two curves. (I)
Representative fluorescent in situ hybridization (FISH) against bcd mRNA in wild type (top) and fat2RNAi (bottom)
in n.c. 11 embryos. Scale bar, 50 mm. (J) Fluorescent intensity profile of FISH assay along AP axis in n.c. 4 (top) and
n.c. 11 (bottom). Normalization to measured fluorescence signal in the region 120 mm from anterior. n = 5, 2 (n.c.
4) and n = 2,2 (n.c. 11) for wild type (red) and fat2RNAi (blue) respectively. Error bars show standard deviation. (K)
Fitting of SDD model to experimentally measured Bcd gradient. All parameters, as outlined in
Materials and methods, are kept constant, with only change being embryonic geometry. See
Figure 1 continued on next page
Huang et al. eLife 2020;9:e47380. DOI: https://doi.org/10.7554/eLife.47380 3 of 21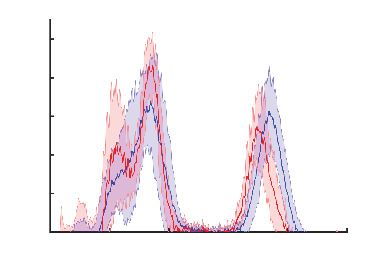
Research article                                                                                              Developmental Biology

                                   Figure 1 continued
                                   Materials and methods for details. Lower panel shows intensity difference in experimental measurements and
                                   predicted profiles along the AP-axis.
                                   The online version of this article includes the following figure supplement(s) for figure 1:
                                   Figure supplement 1. Effects of perturbing embryonic geometry by fat2RNAi.

                                   432 ± 40 mm in fat2RNAi embryos (Figure 1A), with some embryos as short as 320 mm. Meanwhile,
                                   the perturbed embryos show an increased embryonic width (EW) along the dorso-ventral (DV) axis
                                   (Figure 1B, 196 ± 5 mm in wild type and 202 ± 11 mm in fat2RNAi). Together, these geometrical var-
                                   iations lead to only a slight reduction of ~8% in the embryonic volume (assuming an ellipsoidal
                                   geometry) compared to wild type embryos (Figure 1C; Figure 1—figure supplement 1A–C). The
                                   round eggs are fertilizable and continue with proper embryogenesis (Figure 1—figure supplement
                                   1D; Video 1).
                                       We examined the nuclear distribution in the blastoderm embryos, as nuclei are the basic units
                                   interpreting positional information, and an altered nuclear distribution may affect patterning out-
                                   comes. We found that nuclear number along the AP axis decreases proportionally to embryonic
                                   length, leaving the inter-nuclear distance unchanged (Figure 1D; Figure 1—figure supplement 1E).
                                   In other words, the number of nuclei to interpret AP positional information reduces from 85 ± 4 in
                                   wild type to 65 ± 5 in fat2RNAi embryos.
                                       Despite the significant changes in embryonic geometry, the fat2RNAi embryos show invariably
                                   eleven Engrailed (En) stripes, demarcating the posterior boundary of each body segment including
                                   three thoracic (T1 ~T3) and eight abdominal segments (A1 ~A8; Figure 1E). We noticed that fat2R-
                                   NAi embryos shorter than 400 mm developed morphological defects in late embryogenesis, where
                                   abnormal dorsal closure leads to mismatch between the two lateral sides of the ectoderm
                                   (Figure 1E, arrows; Figure 1—figure supple-
                                   ment 1D). However, such local morphological
                                   abnormality is likely due to defective tissue mor-
                                   phogenesis as a consequence of limited physical
                                   space, rather than patterning errors (Video 2).

                                                                                            Video 2. Defective morphogenesis in late embryo
                                                                                            development due to extreme embryonic geometry.
                                                                                            Confocal movies of fat2RNAi embryos expressing
                                                                                            en >mCD8::GFP from germband retraction to dorsal
                                                                                            closure stages. Two embryos in the movie represent
                                                                                            individuals with EL shorter (top) and longer (bottom)
                                   Video 1. Embryogenesis of different geometry. Wide       than 400 mm. The dashed box indicates mismatch
                                   field movies of wild type (top) and fat2RNAi (bottom)    between opposing ectodermal tissue during dorsal
                                   embryos from the onset of gastrulation until hatching.   closure. The numbers indicate the EL of each embryo.
                                   https://elifesciences.org/articles/47380#video1          https://elifesciences.org/articles/47380#video2

Huang et al. eLife 2020;9:e47380. DOI: https://doi.org/10.7554/eLife.47380                                                                 4 of 21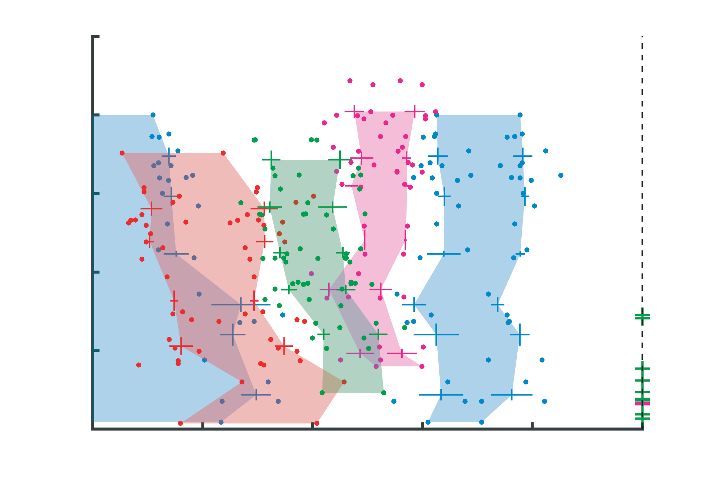
Research article                                                                                        Developmental Biology

                                   Developmental reproducibility is preserved with a minor impact on
                                   scaling under geometrical perturbations
                                   Before tackling the consequences of decanalization, we next ask how the AP patterning network,
                                   from the initial morphogen gradient formation to gap gene readout, is altered under large geomet-
                                   ric perturbations. First, we focus on Bcd, which provides AP positional information in the early
                                   embryo. To compare the spatial Bcd concentration profile in different embryonic geometry, we live-
                                   imaged eGFP-Bcd fusion protein in both control and fat2RNAi backgrounds, and measured the
                                   nuclear Bcd intensity along the AP axis at mid nuclear cycle (n.c.) 14 (Figure 1F). We found that the
                                   absolute Bcd concentration is lower in the anterior half of the embryo in fat2RNAi individuals com-
                                   pared to that of control (Figure 1G and H) (p
Research article                                                                                      Developmental Biology

                                       The SDD model can fit the observed Bcd gradient profiles in different embryonic geometries
                                   without requiring any change to the Bcd dynamics or production (Figure 1K). As a consequence, we
                                   can explain the above observations. First, the lower Bcd intensity near the anterior pole in fat2RNAi
                                   embryos is because of dilution due to the larger DV extent in rounder embryos. If the total Bcd mol-
                                   ecule number is similar at a particular AP position, the measured Bcd nuclear concentration (which
                                   depends on both total protein number and the local volume) at that position is lower in fat2RNAi
                                   embryos. Second, since the diffusion coefficient appears to remain unchanged, there is greater accu-
                                   mulation of Bcd in the posterior region of fat2RNAi embryos as the total travel distance is reduced
                                   in the rounder, shorter embryos, even when accounting for the higher curvature in fat2RNAi
                                   embryos. The ability of the SDD model to explain these differences in the Bcd profile simply by
                                   accounting for embryo geometry provides further support to the SDD model being an excellent bio-
                                   physical description of the process of Bcd gradient formation. It is worth noting that the nuclei
                                   respond to the local concentration of mature Bcd protein regardless of the folding state of the
                                   tagged eGFP. Although we cannot infer the precise profile of mature Bcd from our experimentally
                                   measured eGFP profile as the Bcd protein folding rate is unknown, our model can test the effects of
                                   different protein folding time on the functional gradient in different geometries. From the model
                                   shown in Figure 1K, we can infer the total Bcd concentration, where we assume Bcd folds at a much
                                   faster rate than eGFP (Figure 1—figure supplement 1G). The predicted total Bcd concentration dis-
                                   plays qualitatively similar behavior in varying embryonic geometries to our experiments; that is our
                                   results are unlikely an artefact of protein folding time differences between Bcd and eGFP.
                                       Does the change of the Bcd concentration profile in fat2RNAi embryos impact on the scaling of
                                   downstream patterning genes? To address this question, we measured Hunchback (Hb) expression
                                   in mid n.c. 14 using live imaging of hb >LlamaTag (Bothma et al., 2018), (Figure 2A). In control
                                   embryos, the Hb expression boundary locates at 49.0% EL with variation of 1.3% EL, consistent with
                                   previous reports (Houchmandzadeh et al., 2002). Comparatively, the Hb boundary shows a posteri-
                                   zation in fat2RNAi embryos (52.9% EL). Further, we found an increased variation of 2.3% EL in the
                                   Hb boundary position (Figure 2B). However, considering the absolute length of fat2RNAi embryos,
                                   the variation of Hb boundary positions (~8 mm) between different individuals is still less than the
                                   average distance between neighboring nuclei.
                                       Using immunofluorescence, we next investigated the impact of geometrical perturbations on the
                                   expression domains of other gap genes. In agreement with our results for Hb, the boundary posi-
                                   tions of all four gap genes displayed slight shifts in the posterior direction in fat2RNAi embryos
                                   (Figure 2C–F). However, the inter-individual variation remains comparable to that of the wild type
                                   (Figure 2C–F, bottom row). We conclude that when we manipulate the embryonic geometry to an
                                   extent beyond that naturally observed, the reproducibility of the patterning outcomes is preserved.
                                   Therefore, the intact early embryonic patterning network is highly robust to variations in embryonic
                                   geometry.

                                   Embryonic length predetermines patterning outcomes in decanalized
                                   conditions of increased bcd dosage
                                   We have demonstrated that fat2RNAi embryos provide an excellent system for testing the role of
                                   geometry on patterning networks. Taking advantage of the availability of genetic manipulations in
                                   Drosophila, we now use this tool to explore the role of geometric constraints in determining pheno-
                                   typic outcomes in decanalized conditions: first, in embryos with increased maternal bcd gene dos-
                                   age; and second in embryos with depleted maternal bcd.
                                      Phenotypic discordance has been observed previously as a consequence of artificially altered
                                   maternal bcd dosage. Gradual increase of the maternal bcd gene copies leads to a larger proportion
                                   of individuals showing defective patterning (Namba et al., 1997). We wanted to test our hypothesis
                                   that the embryonic geometry predetermines patterning outcomes of these individuals. To efficiently
                                   increase the Bcd gradient amplitude, we generated a tandem bcd construct, where two copies of
                                   the bcd gene are linked by the P2A self-cleaving peptide (Figure 3A). Two transgenic fly lines with
                                   two and four genomic insertions of this construct deposit bcd mRNA into embryos at ~3 (6x bcd)
                                   and ~5 (10x bcd) fold wild-type amounts, respectively (Figure 3B; Figure 3—figure supplement
                                   1A–C). As Bcd protein counts scale linearly with that of its mRNA, the corresponding amplitude of
                                   the Bcd gradient are expected to show the same fold changes (Petkova et al., 2014), as manifested
                                   by the posterior displacement of cephalic furrow position (Figure 3B).

Huang et al. eLife 2020;9:e47380. DOI: https://doi.org/10.7554/eLife.47380                                                       6 of 21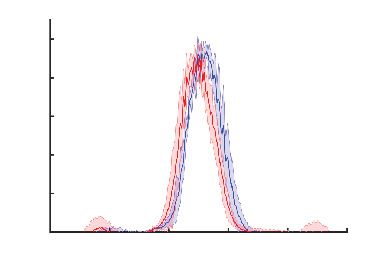
Research article Developmental Biology
A B
hb>LlamaTag 0.58
0.56
ctrl
0.54
ctrl
fat2RNAi
0.52
x/L
0.50
fat2RNAi
0.48
0.46
0.44
300 350 400 450 500 550
embryonic length (µm)
C D E F
WT
WT
WT
WT
fat2RNAi
fat2RNAi
fat2RNAi
fat2RNAi
Hb Kr Kni Gt
1 1 1 1
cKni/cmaxKni
cHb/cmaxHb
cGt/cmaxGt
0.8 0.8 0.8
cKr/cmaxKr
0.8
0.6 0.6 0.6 0.6
0.4 0.4 0.4 0.4
0.2 0.2 0.2 0.2
0 0 0 0
0 0.2 0.4 0.6 0.8 1 0 0.2 0.4 0.6 0.8 1 0 0.2 0.4 0.6 0.8 1 0 0.2 0.4 0.6 0.8 1
x/L x/L x/L x/L
0.55 0.6 0.85
0.7
0.55 0.8
0.5 0.65
0.75
x/L
x/L
x/L
x/L
0.5 0.6
0.7
0.45
0.45 0.55 0.65
0.4 0.4 0.5 0.6
Hb1 Kr1 Kr2 Kni1 Kni2 Gt2 Gt3
Figure 2. Embryonic patterning is robust to perturbation of embryonic geometry. (A) Max projection of ctrl (top) and fat2RNAi (bottom) embryos
expressing maternally loaded eGFP and hb >LlamaTag. (B) Scaled Hb boundary positions plotted against EL in two genotypes. (C–F) Comparison of
gap gene expression between wild type and fat2RNAi embryos. Profiles normalized to max intensity and the computed mean and s.d. plotted against
scaled AP length. Boundary positions of each individual is plotted to show the distribution in two genotypes (WT, red and fat2RNAi, blue). Scale bars,
100 mm.
The ~5 fold bcd overexpression compromises viability to adulthood (Figure 1—figure supple-
ment 1D) and the non-hatched embryos displayed a plethora of defective patterning phenotypes
(Figure 3C; Figure 3—figure supplement 1D). Individuals with mild defects frequently displayed
missing or fused denticle belts in the fourth abdominal (A4) segment (Figure 3C–D), a positional
bias that has been reported previously (Namba et al., 1997). More severe phenotypes showed
defects in a spreading region centered about the A4 segment. Meanwhile, embryos show high rate
of mouth defects as a consequence of significantly increased local Bcd concentration in the most
anterior region (Figure 3C–D; Figure 3—figure supplement 1D). Patterning defects were rarely
seen in 3-fold bcd over-expression embryos unless fat2RNAi knockdown is further introduced into
this genetic background (Figure 3C–D; Figure 3—figure supplement 1E). A large percentage of
these individuals showed abdominal patterning defects, with A4 showing the highest defective fre-
quency (Figure 3C–D). Interestingly, a similar distribution of defective abdominal segments is also
seen in the small proportion of non-hatched fat2RNAi individuals (Figure 3C–D).
To understand if embryonic geometry predetermines the severity of phenotypic defects in indi-
viduals, we characterized the patterning outcomes using En expression in embryos with various bcd
copy number and embryonic length. Individuals with 2-fold bcd overexpression (single insertion of
tandem bcd), within the natural range of embryonic geometry, showed intact En expression. How-
ever, shorter embryos (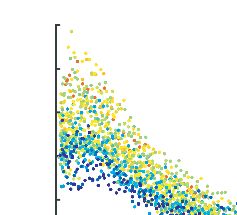
Research article Developmental Biology
A endogeneous bcd C D 10xbcd
self-cleaving peptide
regulatory sequences
10xbcd
fat2RNAi, 6xbcd
tandem
P2A fat2RNAi
bcd
bcd gene region bcd gene region mouth
parts A1 A2 A3 A4 A5 A6 A7 A8 100
fat2RNAi,
80
6xbcd
% embryos
B CF position
60
10xbcd 6xbcd 2xbcd
wild type 33.0±1.0 %EL
40
fat2RNAi
2 insertions of 20
tandem bcd
41.8±1.3 %EL
0
mouth A1A2A3A4A5A6A7A8
4 insertions of parts
48.0±1.7 %EL
tandem bcd 0 20 40 60 80 100 defective segments
% embryos
E fat2RNAi natural range en stripes F
6xbcd
A
4xbcd
1 1 1
1 1 2
2 2 3
2 3 3
A P
4 4 4
3 5
5
6xbcd
6
11 8 7 7
9 8 8
9
A P
10 11 10 10 9
11 11 10
11
10xbcd
P
350 400 450 500 550 600
embryonic length (µm)
Figure 3. Defects due to decanalization by Bcd over-expression are length-dependent. (A) Schematic illustration of tandem bcd construct. (B) Embryos
expressing 2x (wild type), 6x and 10x of maternal bcd fixed at the onset of gastrulation and stained with Phalloidin. Green arrowheads indicate the
positions of cephalic furrow (CF) formation. (C) Distribution of defective cuticular segments in non-hatched 10xbcd (top), fat2RNAi, 6xbcd (mid) and
fat2RNAi (bottom) embryos. Colormap indicates the frequency of defects in each segmental region. (D) Bar plots showing the distribution of defective
cuticular segments in three genotypes. (E) En expression patterns in 4x (top), 6x (mid) and 10x (bottom) bcd embryos with different EL. Green dots,
normal En stripes; red dots, defective En stripes; A, anterior; P, posterior. (F) Representative 6xbcd embryos with different EL expressing en >mCD8::
GFP. Numbers indicate En stripe identities and red mask indicate defective segmental regions. Scale bar, 100 mm.
The online version of this article includes the following figure supplement(s) for figure 3:
Figure supplement 1. Embryonic patterning with maternal bcd overexpression.
segments gradually expands from the 6th En stripe to both anterior and posterior regions with
decreasing embryonic length (Figure 3E, middle panel and 3F). Further, increasing bcd dosage 5-
fold renders patterning processes exceedingly susceptible to reduced embryonic length. Defects are
observed in comparatively shorter individuals within the natural range and recurringly the 6th En
stripe is the most frequent breaking point in the patterning (Figure 3E, bottom panel).
The A4 segment is a weak point in the gap gene network due to
repression of eve stripe five in short embryos
The defective abdominal patterning that we observe here is an intuitive result, as both the posteriza-
tion of gap gene boundaries due to increased bcd dosage and reduced embryonic length lead to
reduced number of nuclei along the AP axis in the trunk region. When the number of nuclei falls
short of the minimal requirement to fulfill all the different cell identities along the AP axis, certain
cell fates become lost. It is surprising, however, that this defect originates at and expands from the
same position in all defective embryos, the A4 segment. This positional bias is also reflected in the
segmentation gene pattern at the blastoderm stages. While the gap gene boundaries remain
roughly at the same scaled positions across different geometries (Figure 4A), the absolute distance
between neighboring gap gene expression peaks decreases in response to reduced embryonic
length (Figure 4B). This in turn changes the combinatorial inputs to activate downstream pair-rule
genes, for example even-skipped (eve). The expression peaks of Kni and Gt are brought into proxim-
ity with gradually reducing embryonic length (Figure 4B–C). As Kni and Gt confine the boundaries
of eve stripe 5 (Fujioka et al., 1999), the expression of this eve stripe is over-repressed (Figure 4C,
asterisk). This results in the loss of correct cell fate at this position, corresponding to the future A4
Huang et al. eLife 2020;9:e47380. DOI: https://doi.org/10.7554/eLife.47380 8 of 21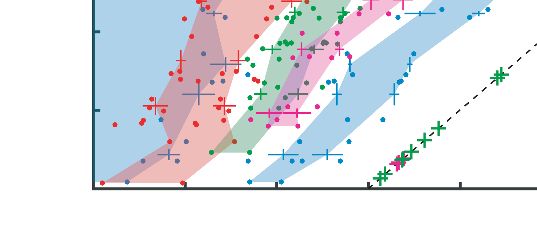
Research article                                                                                                                                                             Developmental Biology

                                       A                                                                          B
                                                               600      Hb   Gt                                                               600     Hb    Gt
                                                                        Kr   Kni                                                                      Kr    Kni

                                       embryonic length (µm)

                                                                                                                      embryonic length (µm)
                                                               550                                                                            550

                                                               500                                                                            500

                                                               450                                                                            450

                                                               400                                                                            400

                                                               350                                                                            350
                                                                 0.5     0.6       0.7         0.8        0.9   1.0                             200    250        300   350   400   450   500
                                                                                                                                                           distance from anterior (µm)
                                                                                         x/L
                                      C                                      Hb                      Kr                                       Kni                   Gt Eve

                                                                                                                                                                         *
                                                                6xbcd

                                   Figure 4. Embryonic patterning breaks down at A4 segment with bcd overexpression. (A–B) Embryonic length of
                                   6xbcd individuals plotted against the scaled (A) or absolute (B) AP position of four gap gene boundaries (Hb, blue;
                                   Gt, magenta; Kr, red and Kni, green). Data from every 30 mm EL interval were binned to compute mean and s.d.
                                   and the colored areas are generated by connecting mean values of different EL ranges. Dashed line indicates
                                   posterior boundary of individuals; green and magenta crosses overlapping the dashed line indicate individuals
                                   with corresponding EL not expressing Kni and Gt, respectively. (C) Representative segmentation gene expression
                                   in 6xbcd embryos with different EL. Asterisk indicates repressed Eve stripe five and arrowhead indicates failed
                                   activation of Kni. Scale bar, 100 mm.

                                   segment. With further reduced embryonic length, a larger percentage of individuals fail to activate
                                   Kni and Gt in the trunk region (Figure 4B, green crosses; Figure 4C, arrowhead), leading to defects
                                   across a broader range.

                                   AP patterning of bcd mutants correlates with embryonic length
                                   We have shown that embryonic geometry predicts individual patterning outcomes under increased
                                   bcd dosage. To understand if embryonic geometry is a general factor underlying phenotypic discor-
                                   dance in decanalized conditions, we asked how geometrical perturbation influences phenotypic out-
                                   puts in the absence of Bcd inputs. This question is motivated by the significant phenotypic variation
                                   observed among embryos derived from females carrying the same bcd null allele (Frohnhöfer and
                                   Nüsslein-Volhard, 1986; Frohnhofer and Nusslein-Volhard, 1987). For example, the individuals
                                   derived from bcdE1 homozygous females show highly variable pattern in the perspective A1 to A5
                                   segments, manifesting in either fusion or depletion of various number of denticle belts.
                                       To systematically understand the inter-individual phenotypic variation among bcd mutants, we
                                   utilized an allele generated by the CRISPR-MiMIC method (Huang et al., 2017; Venken et al.,
                                   2011). The MiMIC transposon carrying stop codons in all three reading frames is targeted by CRISPR
                                   to insert into the first intron of the endogenous bcd gene. Therefore, no functional Bcd protein is
                                   produced by this knockout allele (annotated bcdKO). Moreover, the MiMIC construct contains an
                                   eGFP marker, which facilitates further genetic manipulation, such as recombination, carried out in
                                   this study.
                                       The cuticular pattern of the bcdKO allele qualitatively recapitulates that of bcdE1 (Figure 5—fig-
                                   ure supplement 1A–C). While the anterior embryonic patterning is entirely defective, the patterning
                                   defects in posterior regions are more variable. The number of normal abdominal denticle belts in
                                   each embryo ranges from three (A6 - A8) to seven (A2 - A8), with four intact abdominal segments
                                   (A5 –A8) being the most frequently observed phenotype (Figure 5A). Structures indicating partially

Huang et al. eLife 2020;9:e47380. DOI: https://doi.org/10.7554/eLife.47380                                                                                                                              9 of 21
Research article Developmental Biology
A 40 E F ctrl
6
5
no. abdominal
30
% embryos
segments
4
20 3
2
10
1
0 330-360 360-390 390-420 420-450 450-480
0
3 4 5 6 7 embryonic length (µm)
no. normal abdominal segments
G fat2RNAi, bcdKO
B 70
60
% embryos
50
40
30
20
10
0
i ii iii iv
type of ectopic spiracle morphology
C 6 H 12
no. engrailed stripes
5 WT
boundary position
variation as %EL
10
bcdKO
4 8 fat2RNAi, normal
fat2RNAi, defective
3 6 bcdKO
4 fat2RNAi, bcd
2
1 2
0
0 300 350 400 450 500 550
1 2 3 1 2 i1 i2 2 3
Hb Hb Hb Kr Kr Kn Kn Gt Gt embryonic length (µm)
D 330-360µm 360-390µm 390-420µm 420-450µm 450-480µm
Figure 5. bcd mutant phenotypes correlate with embryonic length. (A) Phenotypic frequency showing different number of normal abdominal segments
in bcdKO mutant individuals (n = 202). Dashed area indicates proportion of embryos showing fully developed ectopic spiracles (see Figure 5—figure
supplement 1D(i)). (B) Phenotypic frequency of different ectopic spiracle morphology as shown in Figure 5—figure supplement 1D (n = 168). (C)
Variation of gap gene boundary positions in wild type vs. bcdKO embryos. Error bars are computed by bootstrapping with data shown in Figure 5—
figure supplement 1E–H. (D) Representative cuticle patterns of fat2RNAi, bcdKO embryos within different ranges of embryonic length, from left to
right, 330–360, 360–390, 390–420, 420–450, and 450–480 mm. Stars indicate normal abdominal segments. (E) Number of normal abdominal segments
plotted against EL range of each individual. (F) En expression in wild type embryo. Green dots indicate En stripes. (G) Representative images of
fat2RNAi, bcdKO embryos showing different number of En stripes. Magenta dots indicate En stripes. Scale bar, 100 mm. (H) Number of En stripes
plotted vs. EL in individuals from three genotypes. Magenta triangles indicate individuals showing defective morphogenesis at the end of dorsal
closure; cyan triangles indicate normal morphogenesis.
The online version of this article includes the following figure supplement(s) for figure 5:
Figure supplement 1. Characterization of bcd mutant phenotypes.
Figure supplement 2. Variations of bcd mutant phenotypes.
Figure supplement 3. Bcd mutant phenotypes correlate with embryo length.
differentiated abdominal segments can be observed in the anterior regions of the bcdKO embryos.
However, these structures do not recapitulate any of the wild-type denticle belts (Figure 5—figure
supplement 1B). Further, we observed and classified the variable phenotypes of the duplicated pos-
terior spiracles according to the completeness of the organ morphogenesis (Figure 5B; Figure 5—
figure supplement 1D). Interestingly, the fully developed ectopic spiracle organ (Figure 5—figure
supplement 1D (i)) is only observed in embryos showing less than six intact abdominal segments,
while most frequently observed in individuals with three intact abdominal segments (Figure 5A,
Huang et al. eLife 2020;9:e47380. DOI: https://doi.org/10.7554/eLife.47380 10 of 21Research article Developmental Biology
dashed bar area). This indicates correlation between the patterning outcomes of the abdominal
regions and the ectopic spiracles.
The wide spectrum of bcdKO phenotypes can be attributed to variations in patterning gene
expression during the blastoderm stage. By the end of the blastoderm stage, the relative boundary
positions of all gap gene expression domains show significant anterior shift compared to those in
the wild-type embryos (Figure 5—figure supplement 1E–H). Importantly, the absence of Bcd activ-
ity results in significantly increased variation in gap gene boundary positions (Figure 5C, pmCD8::GFP In individuals with moderately increased
(green). Dots indicate En stripes and the numbers on embryonic length (range 2, EL within 390–420
top of the embryos indicate the AP length of each mm), Hb stripes in the terminal regions separate
individual. further apart, permitting Kni expression in the
https://elifesciences.org/articles/47380#video3 middle region (Figure 6A–C, range 2). This Kni
Huang et al. eLife 2020;9:e47380. DOI: https://doi.org/10.7554/eLife.47380 11 of 21Research article Developmental Biology
A Hb Kr Kni Gt
range3
range2
range1
B 550
C
range3
range1 range2 range3
embryonic length (µm)
500
Tor Tor Tor Tor Tor Tor
450 Cad Cad Cad
range1 range2
400 Hb Gt Hb Hb Gt Kni Gt Hb Hb Gt Kr Kni Gt Hb
350
Kni Kr Kr
300
0 50 100 150 200 250 300 350 400 450 500
distance from anterior (µm)
Figure 6. Phenotypic discordance can be traced back to variations in gap gene expression in bcdKO individuals. (A) Representative gap gene
expression patterns within different range of EL. Range1, 330–360 mm; range2, 390–420 mm; and range3, 510–540 mm. (B) Embryonic length of bcdKO
individual plotted vs. boundary position of four gap genes shown as absolute distance from the anterior pole (Hb, blue; Gt, magenta; Kr, red and Kni,
green). Data from every 30 mm EL interval were binned to compute mean and s.d. and the colored areas are generated by connecting mean values of
different EL ranges. Dashed boxes indicate ranges of EL corresponding to (A). Dashed line indicates posterior boundary of individual embryos; red and
green crosses overlapping the dashed line indicate individuals with corresponding EL not expressing Kr and Kni, respectively. (C) Schematic illustration
of positional information transfer from maternal systems to gap gene expression in bcdKO embryos within different range of embryonic length. Scale
bar, 100 mm.
The online version of this article includes the following figure supplement(s) for figure 6:
Figure supplement 1. Positional information transfer in the absence of maternal bcd.
Figure supplement 2. Strong correlation between gap gene boundary positions and embryonic length in the absence of maternal bcd.
stripe is sandwiched by two Gt expression domains, a thin anterior stripe and a wider posterior one.
The anterior Gt stripe in bcd mutants has been observed before (Staller et al., 2015) but its regula-
tory interactions remain elusive. Potentially it is activated by the remnant anterior determinants such
as the maternal Hb, distributed in the anterior half of the embryo (Irish et al., 1989). Comparatively
shorter embryos show phenotypically higher degree of symmetry in both cuticle and gene expres-
sion patterns, conceivably due to stronger repression of maternal Hb in shorter individuals (Fig-
ure 6—figure supplement 1B–D; Figure 6—figure supplement 2).
Looking more closely at individuals within the natural range of embryonic geometry (range 3, EL
within 510–540 mm), the sufficient physical space between two Hb stripes permits the expression of
Kr, Kni and Gt, arranged in spatial order that is conserved as in wild-type embryos (Figure 6A–C,
range 3). In summary, as a consequence of gradually increasing embryonic length, a continuously
increasing variety of gap gene expression domains are activated along the AP axis, which is in turn,
translated into increased number of body segments, as manifested by the pair-rule gene expression
pattern (Figure 6—figure supplement 1E).
Discussion
Individuals of the same species often display a certain level of morphological and behavioral differ-
ences, such as in animal color patterns and human facial features (Beldade et al., 2002;
Sheehan and Nachman, 2014). This reflects inter-individual variation in genetic composition and
life-history environmental exposure (Dall et al., 2012). Such intraspecific individuality may have
Huang et al. eLife 2020;9:e47380. DOI: https://doi.org/10.7554/eLife.47380 12 of 21Research article Developmental Biology
significant ecological and social impacts on the population (Forsman and Wennersten, 2016).
Equally, these same genetic and environmental variations pose challenges to fundamental develop-
mental processes as they try to generate invariant developmental outcomes. Multiple lines of evi-
dence suggest that organisms have evolved canalization mechanisms that render developmental
processes insensitive to such sources of variation (Félix and Barkoulas, 2015; Flatt, 2005). Early
Drosophila embryonic patterning provides an excellent example of a canalized developmental pro-
cess – the boundaries of segmentation gene expression remain highly reproducible amongst individ-
uals in the face of heterozygous mutations (Lehmann and Nüsslein-Volhard, 1987;
Wieschaus et al., 1984), genetic variations (Lott et al., 2007) and temperature perturbations
(Houchmandzadeh et al., 2002; Lucchetta et al., 2005). These studies suggest that mechanisms
including epistasis, genotype-environment interactions and canalizing gene regulatory networks
(Manu et al., 2009) work together to ensure precise patterning outputs.
In this study, we have identified embryonic geometry as an additional source of variation that pat-
terning processes have evolved to buffer against. The geometry, or in other words, the aspect ratio
of each ellipsoid-shaped embryo is determined during oogenesis, and this parameter varies
by ±10% in the population of the wild-type strain OreR. The variable geometry in turn increases the
variation in embryonic length given the natural range of embryonic geometry. Previous studies have
shown that patterning outcomes are highly reproducible and remain scaled to embryonic length
(Antonetti et al., 2018; Lott et al., 2007). What roles do Bcd and the gap gene interactions have in
this scaling (Wu et al., 2015)? Combining results from fat2RNAi embryos with theoretical modeling
may reveal exciting new insights into the underlying scaling mechanisms (Bieler et al., 2011;
Jaeger et al., 2004). Correspondingly, we found that under decanalized conditions, either by
depleting maternal bcd inputs or artificially increasing the bcd dosage, the patterning process loses
its capacity to buffer embryonic length variations. Consequently, the length of an individual embryo
predetermines its patterning outcomes. The predictive power becomes stronger when we artificially
increase the variation of the embryonic geometry. The aspect ratio of the fat2RNAi embryos differs
by ±30% while the average embryonic volume is only slightly reduced by ~8%. These results further
support embryonic geometry as a major source of variation that accounts for inter-individual pheno-
typic variation under decanalized conditions.
Both embryonic volume and embryonic length are inheritable traits and therefore adaptive to arti-
ficial selection or environmental changes (Azevedo et al., 1997; Fox and Czesak, 2000; Lott et al.,
2007; Miles et al., 2011). It will be interesting to understand if the aspect ratio of the embryo shape
is also a genetically variable trait so that the population can be selected to produce progenies with a
biased geometry. If this is the case, embryonic geometry may be involved in the complex interplay
between environment, genetic components and developmental processes during the course of evo-
lution. When a population confronts selection towards a new phenotypic optimum, for example,
larger egg volume due to decreasing temperature (Azevedo et al., 1997), such directional selection
may result in decanalizing effects on the patterning processes (Miles et al., 2011; Wagner et al.,
1997). Meanwhile, the naturally variable embryonic geometry - together with other sources of varia-
tion - generates a spectrum of patterning outcomes in different individuals. As a result, a different
range of embryonic geometry will be favored and selected as they maintain the patterning outcomes
of the parental lines. Conceivably, this may be one of the reasons why eggs of closely related Dip-
teran species differ not only in size (Gregor et al., 2008; Markow et al., 2009) but also in geometry,
and such geometrical differences can also be observed in different laboratory lines carrying different
genetic background.
Our quantitative analysis of segmentation gene expression demonstrates how embryonic geome-
try affects individual patterning outcomes under two decanalizing conditions. In the case of the
maternal bcd null mutant, we have shown that the signaling centers located at both poles of the
embryo initiate the hierarchical gene expression along the AP axis in a non-scaled manner. This
explains, mechanistically, how patterning processes incorporate information of the embryonic geom-
etry to account for the final outputs. It remains unclear, however, in the case of increased bcd dos-
age, what determines the breaking point (the fourth abdominal segment) of the final pattern. One
possibility is that the susceptibility of this position reflects the strength of the regulatory interactions
between the segmentation genes (Jaeger, 2011). Systematic comparisons among different Dro-
sophila species have shown that the regulatory sequences of the segmentation genes are rapidly
evolving and thus substantially diverged (Ludwig et al., 2000). Interestingly, the spatio-temporal
Huang et al. eLife 2020;9:e47380. DOI: https://doi.org/10.7554/eLife.47380 13 of 21Research article Developmental Biology
dynamics of the segmentation gene expression patterns are highly conserved between species, sug-
gesting that the co-evolution of modular transcription binding sites compensate for each other to
keep the patterning outcomes unchanged (Gregor et al., 2005; Ludwig et al., 2005; Ludwig et al.,
2000). Such an inter-species canalization phenomenon is also observed among more distally related
species within the sub-taxon Cyclorrhapha, which involved more dramatic rewiring of the regulatory
network (Crombach et al., 2016; Wotton et al., 2015). If the breaking point of patterning processes
under decanalized conditions truly depends on the system parameters of the underlying network
(Jaeger and Crombach, 2012), we expect to see different susceptible points in different network
structures. This can be tested by characterizing decanalizing phenotypes in related species.
A longstanding question in patterning is how do gene regulatory networks downstream of
morphogens incorporate information about the macroscopic geometrical parameters of each indi-
vidual to give rise to scaled patterning outputs? While our results do not provide mechanistic insight
into the scaling mechanisms of the gap gene network, they define the physical boundaries where
such scaling breaks down. The emergence of scaled expression boundaries is closely linked to
embryo geometry, and future models will hopefully more rigorously test the role of geometry in the
scaling. Further, our results directly show that the Bcd gradient shape depends on the embryo
geometry; in our case, by roughly conserving embryo volume but reducing the aspect ratio, the Bcd
gradient extends further into the posterior, resulting in a posterior shift in gap gene expression
boundaries.
In conclusion, embryonic geometry was identified as a source of variation in addition to environ-
mental and genetic factors that predetermines phenotypic outcomes in mutant conditions. We think
that embryonic or more generally, tissue geometry may play an important role in other decanalizing
conditions by affecting patterning outputs, such as other segmentation gene mutants
(Janssens et al., 2013; Surkova et al., 2013), or in vitro induction of patterning systems
(Lancaster and Knoblich, 2014; Simunovic and Brivanlou, 2017), both of which show significant
inter-individual phenotypic variations. Our work highlights that care must be taken when taking a
system out of its native environment – for example organoids – as the system boundaries affect the
operation of signaling networks. Characterizing the influence of the geometrical parameters will help
us to have a more complete understanding of decanalization, and in turn, canalizing phenomenon.
Materials and methods
Fly stocks and genetics
The bcd knockout allele (bcdKO) used in this study was generated by CRISPR-mediated insertion of a
MiMIC cassette into the first intron of the bcd gene (Huang et al., 2017; Venken et al., 2011) The
cuticle phenotype of bcdKO was compared to that of the classic bcdE1 allele (Frohnhöfer and Nüs-
slein-Volhard, 1986) To generate embryos with artificially reduced aspect ratio, we expressed RNA
interference against the fat2 gene using a maternal traffic jam (tj) >Gal4 driver (Barlan et al., 2017)
Both UAS > fat2 RNAi and tj >Gal4 were either crossed to or recombined with the bcdKO allele, so
that the females carrying all three alleles produce bcd null embryos with wide range of aspect ratio.
The tandem bcd construct was generated by replacing the eGFP sequence in the pCaSpeR4-
egfp-bcd vector (Gregor et al., 2007b) by bcd protein coding sequence. First, the vector was
digested with NheI and SphI to remove the eGFP. Next the bcd coding sequence was amplified by
PCR from the vector using primer pairs
5’-cggagtgtttggggctagcaaagatggcgcaaccgccg-3’ and
5’-gttagtagctccgcttccattgaagcagtaggcaaactgcgagtt-3’.
Further the P2A self-cleaving peptide with the GSG linker was synthesized as oligo pairs
5’-tttgcctactgcttcaatggaagcggagctactaacttcagcctgctgaagcaggctggagacgtggaggagaaccct
ggacctgcatgcatggcgcaaccgc-3’ and
5’ggcggttgcgccagcatgcaggtccagggttctcctccacgtctccagcctgcttcagcaggctgaagttagtagctccgcttc-
cattgaagcagtaggcaaa-3’.
These two fragments and the digested vector were then assembled using Gibson Assembly strat-
egy (NEB). The final construct was injected (BestGene Inc) and two insertions on 2nd (tdBcd(II)) and
3rd (tdBcd(III)) chromosome, respectively, were established and used for this study. Consequently,
Huang et al. eLife 2020;9:e47380. DOI: https://doi.org/10.7554/eLife.47380 14 of 21Research article Developmental Biology
hetero- or homo-zygous tdBcd(III) females produce embryos with 4x and 6x of maternally loaded
Bcd protein, respectively (compared to 2xbcd in the wild-type); and homozygous tdBcd(II);tdBcd(III)
females generate 10xbcd embryos. Finally, females homozygous for tdBcd(III) which also carry
tj >Gal4 and UAS >fat2 RNAi generate 6xbcd embryos with reduced aspect ratio.
Other fly lines used in this study include a laboratory OreR strain raised in 25˚C (the wild-type con-
trol); en >mCD8 GFP (to visualize dynamic en expression pattern); egfp-bcd line (for quantification
of Bcd gradient profile); mat >eGFP; hb >LlamaTag (gift from Hernan Garcia’s lab); Df(3R)tllg
(BL#2599).
Measurement of embryonic geometry
To compare the geometrical parameters between OreR, bcdKO and fat2RNAi populations, embryos
were dechorionated and aligned laterally on an agar plate and imaged under a stereoscope (Nikon
SMZ18). Images were then segmented to extract the embryo contour and fitted to elliptic shapes.
The long and short axes of fitted ellipses were taken as the measurement of embryonic length and
width, respectively. The approximate embryonic volume is calculated using the measured length and
width, assuming embryos are ellipsoids in shape. For each strain, more than 200 individuals were
measured.
For confocal live imaging, embryonic length was measured as the longest distance between the
anterior and posterior poles. The immunostaining procedures result in an isotropic shrinkage of
embryonic volume. To measure the geometrical parameters of the fixed embryos, we first carried
out a linear fit between aspect ratio and embryonic length using stereoscope data. Further we mea-
sured the aspect ratio of each fixed embryo and estimate its embryonic length and width using the
same linear fit equation.
We checked our assumption of isotropic shrinkage upon fixation (Figure 1C and Figure 1—figure
supplement 1A). Comparing embryos from live imaging and fixed embryos, we did not observe sig-
nificant anisotropy in the embryo geometry (Figure 1—figure supplement 1B–C).
Immunostaining
Embryos at desired stages were dechorionated by household bleach and fixed in heptane saturated
by 37% paraformaldehyde (PFA) for 1 hr. The vitelline membrane was subsequently manually
removed. Prior to incubation with primary antibodies, embryos were blocked with 10% BSA in PBS.
Antibodies used were guinea pig anti-Hb (1:2000), rabbit anti-Gt (1:800), guinea pig anti-Kr (1:800),
guinea pig anti-Kni (1:800), guinea pig anti-Eve (1:800). Primary antibodies were detected with Alexa
Fluor-labelled secondary antibodies (1:500; LifeTech). Embryos were co-stained with Phalloidin con-
jugated with Alexa Fluor for staging purpose or visualizing cephalic furrow position. Short incubation
of Dapi dye was carried out during the last wash prior to mounting to visualize presyncytial nuclei.
Embryos were mounted in AquaMount (PolySciences, Inc) and imaged on a Zeiss LSM710 micro-
scope with a C-Apochromat 40x/1.2 NA water-immersion objective. Hb, Gt, Kr, Kni and Eve antibod-
ies were gifts from Johannes Jaeger.
Cuticle preparation
Embryos of various genotypes were collected during the blastoderm stages and allowed to develop
at 25˚C until the end of embryogenesis. The embryos were then dechorionated, fixed, devitellinized
and incubated into a mixture of Hoyer’s medium and Lactic acid in a 1:1 ratio at 65˚C between an
imaging slide and a cover slip. For an exhaustive description of the method used see
Alexandre (2008).
Measurement of bcd profile
For measurement of Bcd gradient profile, we followed the protocols detailed in Gregor et al.
(2007a). Embryos expressing eGFP-Bcd either with or without fat2RNAi were dechorionated and
mounted laterally on a confocal microscope (Zeiss LSM710). The images were acquired at the mid-
sagittal plane of embryos at early n.c. 14. Data acquired in Figure 1F–H for different individuals
(including eGFP:Bcd and eGFP:Bcd; tj >Gal4,UAS > fat2 RNAi) were co-mounted on the same glass-
bottom dish and taken with identical microscope settings. For each image, nuclear centers along the
dorsal edge of the embryo were manually selected and the corresponding circular area was used to
Huang et al. eLife 2020;9:e47380. DOI: https://doi.org/10.7554/eLife.47380 15 of 21Research article Developmental Biology
compute the average fluorescent intensity. Nuclear intensity was then plotted against either abso-
lute distance from the anterior or scaled AP position. To compare average profiles between control
and fat2RNAi embryos, all nuclei from embryos either longer or shorter than 450 mm are binned in
50 bins along the scaled AP axis over which the mean and standard deviation were computed.
Fluorescence in situ hybridization
Probe synthesis
A 471 bp region of bcd transcript was amplified from early embryo cDNA using primer pairs:
5’-cccggatccCTCAAATAGCAGAGCTGGAGC-3’ and 5’-cccggtaccGCTGCTGCTGGAAGAACTG-
3’ and subcloned into the pSP18 vector. Further, the vector was linearized by BamHI restriction
digestion and DIG-labeled ‘anti-sense’ RNA was synthesized with T7 RNA polymerase using DIG
RNA Labeling Kit [Roche-11175025910]. Synthesized RNA probes were then precipitated by adding
75 ml pre-chilled ethanol, 1.3 ml LiCl (7.5 M) and 1 ml yeast tRNA (25 mg/ml) to the labeling reaction.
Precipitation takes overnight at 20˚C. After centrifuging at 4˚C full speed for 30 min, the precipi-
tated RNA probes were washed with 70% ethanol (in DEPC water) and re-suspended in 100 ml
Hyb-A buffer (50% formamide, 5XSSC buffer, 100 mg/ml salmon DNA [BDL F012], 50 mg/ml heparin
[Sigma-Aldrich H4784], 0.1% tween-20 in DEPC water). The synthesized RNA probes were stored in
20˚C.
Pre-hybridization
Embryos at stages within 2 hr after fertilization were collected, dechorionated and fixed in 1:1 solu-
tion of heptane and 4% formaldehyde in PBS for 20 min. After that, lower phase of the solution was
replaced by methanol with the same volume. The solution was vortexed for 20 s to remove the vitel-
line membrane, and the embryos at the bottom of the lower phase were collected and rinsed three
times with methanol. Embryos were then rehydrated by washing them in sequentially increasing per-
centage of PBT (PBS+0.1%Tween-20) in methanol. Next, embryos were post-fixed in 4% formalde-
hyde in PBT for 20 min and washed 5 times in PBT. Embryos were then washed in Hyb-B buffer (50%
formamide, 5XSSC in DEPC water). Finally, pre-hybridization was carried out by placing the embryos
in Hyb-A buffer at 65˚C for 3.5 hr.
Hybridization
5 ml of RNA probes was diluted in 250 ml Hyb-A buffer. The probe mix was heated at 80˚C for 10
min and placed on ice for 5 min. The probe mix was added to the embryos and hybridization was
carried out at 65˚C for 18 hr. The embryos were washed at 65˚C in Hyb-B buffer for 6 times, 30 min
each wash. After, the embryos were washed sequentially in the following solution at room tempera-
ture: 4:1 Hyb-B:PBT, 1:1 Hyb-B:PBT, 1:4 Hyb-B:PBT and PBT, 5 min each wash. Embryos were incu-
bated with blocking solution (4:1 PBT:Western blocking reagent (Roche- 11921673001)) for 1 hr. For
primary staining against DIG-labeled RNA probes, embryos were incubated with sheep anti-DIG
[Sigma-Aldrich 11333089001] with 1:400 dilution in the blocking solution at 4˚C overnight. After
washing in PBT for 6 times with 20 min each wash, embryos were stained with the secondary anti-
body donkey anti-sheep Alexa 555 [Thermo Fisher Scientific A21436] with 1:500 dilution in PBT for 1
hr at room temperature. Finally, after washing in PBT for 6 times, embryos were mounted on micros-
copy slides with Aqua-Poly/Mount [Polysciences, Inc- 18606].
Microscopy imaging and image analysis
Slides were imaged on a Zeiss confocal LSM880 using 40X water immersion lens. For each embryo,
Z-stack images were taken covering the region from surface to the midsagittal plane, and the neigh-
bouring planes were separated by 3 mm. Following that, a projected maximum intensity image was
generated. The outside of the embryo was segmented using thresholding in Matlab after using roll-
ing ball background subtraction. A 10mm-thick mask was defined around the embryo perimeter in
order to avoid effects from yolk autofluorescence. Finally, the average signal intensity at each posi-
tion along the AP axis was taken from the mask. The signal from each embryo varies significantly,
making a rigorous quantitative comparison challenging. The signal from each embryo was normal-
ized by the intensity around 200 mm from the anterior pole.
Huang et al. eLife 2020;9:e47380. DOI: https://doi.org/10.7554/eLife.47380 16 of 21You can also read