An integrative study of five biological clocks in somatic and mental health - eLife
←
→
Page content transcription
If your browser does not render page correctly, please read the page content below
RESEARCH ARTICLE

                                    An integrative study of five biological
                                    clocks in somatic and mental health
                                    Rick Jansen1†*, Laura KM Han1†, Josine E Verhoeven1, Karolina A Aberg2,
                                    Edwin CGJ van den Oord2, Yuri Milaneschi1, Brenda WJH Penninx1
                                    1
                                     Department of Psychiatry, Amsterdam UMC, Vrije Universiteit Amsterdam,
                                    Amsterdam Public Health Research Institute and Amsterdam Neuroscience,
                                    Amsterdam, Netherlands; 2Center for Biomarker Research and Precision Medicine,
                                    Virginia Commonwealth University, Richmond, United States

                                    Abstract Biological clocks have been developed at different molecular levels and were found to
                                    be more advanced in the presence of somatic illness and mental disorders. However, it is unclear
                                    whether different biological clocks reflect similar aging processes and determinants. In ~3000
                                    subjects, we examined whether five biological clocks (telomere length, epigenetic, transcriptomic,
                                    proteomic, and metabolomic clocks) were interrelated and associated to somatic and mental health
                                    determinants. Correlations between biological aging indicators were small (all r < 0.2), indicating
                                    little overlap. The most consistent associations of advanced biological aging were found for male
                                    sex, higher body mass index (BMI), metabolic syndrome, smoking, and depression. As compared to
                                    the individual clocks, a composite index of all five clocks showed most pronounced associations
                                    with health determinants. The large effect sizes of the composite index and the low correlation
                                    between biological aging indicators suggest that one’s biological age is best reflected by
                                    combining aging measures from multiple cellular levels.

*For correspondence:                Introduction
ri.jansen@ggzingeest.nl             Aging can be conceptualized in different ways. While chronological age is measured by date of birth,
†
 These authors contributed          biological age reflects the relative aging of an individual’s physiological condition. Biological aging
equally to this work                can be estimated by various cellular indices (López-Otı́n et al., 2013). Commonly used indices are
                                    based on telomere length, DNA methylation patterns (epigenetic age), variation in transcription
Competing interest: See
                                    (transcriptomic age) as well as alterations in the metabolome (metabolomic age) and in the prote-
page 15
                                    ome (proteomic age) (see Han et al., 2019; Xia et al., 2017 and Jylhävä et al., 2017 for recent
Funding: See page 15                reviews). Biological aging is defined as the residuals of regressing predicted biological age on chro-
Received: 29 May 2020               nological age: a positive value indicates that the biological age is larger than the chronological age.
Accepted: 14 December 2020          Advanced biological aging (i.e. an increased biological clock) has been associated to poor somatic
Published: 09 February 2021         health, including the onset of aging-related somatic diseases such as cardiovascular disease, diabe-
Reviewing editor: Sara Hägg,
                                    tes, and cognitive decline (Xia et al., 2017). Advanced biological aging has also been correlated to
Karolinska Institutet, Sweden       mental health: childhood trauma (Li et al., 2017), psychological stress, and psychiatric disorders
                                    (Darrow et al., 2016; Han et al., 2018). Specifically, telomere length has been most extensively
   Copyright Jansen et al. This
                                    researched and was found to be shorter in various somatic conditions (Jin et al., 2018), all-cause
article is distributed under the
                                    mortality (Mons et al., 2017; Wang et al., 2018) and a range of psychiatric disorders
terms of the Creative Commons
Attribution License, which          (Lindqvist et al., 2015). Advanced epigenetic aging has also been linked to worse somatic health,
permits unrestricted use and        mortality (Marioni et al., 2015), depressive disorder (Han et al., 2018; Whalley, 2017), and post-
redistribution provided that the    traumatic stress disorder (Wolf et al., 2018), although some studies have found associations with
original author and source are      the opposite direction of effect (Verhoeven et al., 2018; Boks et al., 2015). Advanced transcrip-
credited.                           tomic aging was found in those with higher blood pressure, cholesterol levels, fasting glucose, and

Jansen, Han, et al. eLife 2021;10:e59479. DOI: https://doi.org/10.7554/eLife.59479                                                  1 of 20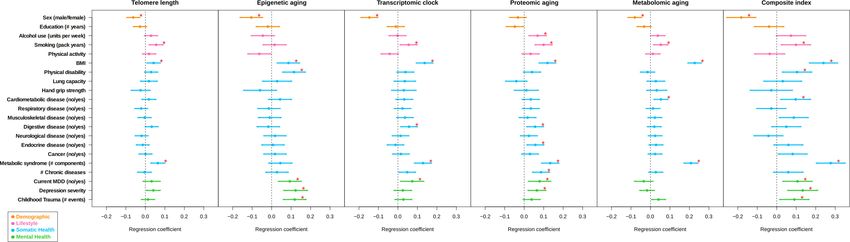
Research article                                                                               Cell Biology Genetics and Genomics

                                    body mass index (BMI) (Peters et al., 2015). Advanced metabolomic aging increases risk on future
                                    cardiovascular disease, mortality, and functionality (Akker et al., 2019).
                                        While all biological clocks aim to measure the biological aging process, there is limited evidence
                                    for cross-correlations among different clocks. Belsky and colleagues (Belsky et al., 2017) recently
                                    showed low agreement between eleven quantifications of biological aging including telomere
                                    length, epigenetic aging, and biomarker-composites. In contrast, Hastings et al., 2019 showed rela-
                                    tively strong correlations (r > 0.50) between three physiological composite biological clocks (i.e.
                                    homeostatic dysregulation, Klemer and Doubal’s method and Levine’s method), but not with telo-
                                    mere length. Other studies showed that telomere length was not correlated with epigenetic aging
                                    (Han et al., 2018; Marioni et al., 2018), although cell type composition adjustments revealed a
                                    modest association (Chen et al., 2017). Further, both Hannum and Horvath epigenetic clocks
                                    (Hannum et al., 2013; Horvath et al., 2012) showed modest correlations to a transcriptomic clock.
                                        Most previous studies, however, have separately considered the relation between a single biolog-
                                    ical clock and different somatic and mental health conditions. To date, extensive integrated analyses
                                    across multiple cellular and molecular aging markers in one study are lacking and it remains unknown
                                    to what extent different biological clocks are similarly associated to different health determinants. In
                                    addition, most studies did not examine health in its full range and, consequently, whether both
                                    somatic and mental health are associated with biological aging remains elusive. As it is unlikely that
                                    a single biological clock can fully capture the complexity of the aging process (Cole et al., 2019), a
                                    composite index, that integrates the different biological clocks and thereby aging at several molecu-
                                    lar levels, may reveal the strongest health impact. Therefore, there is an additional need to integrate
                                    different biological clocks and test whether such a ‘composite clock’ outperforms single biological
                                    blocks in its association with health determinants.
                                        To develop a better understanding of the mechanisms underlying biological aging, this study
                                    aimed to examine (1) the intercorrelations between biological aging indicators based on different
                                    molecular levels ranging from DNA to metabolites, namely telomere length, epigenetic, transcrip-
                                    tomic, proteomic and metabolomic clocks; (2) the relationships between different biological aging
                                    indicators with both somatic and mental health determinants; and (3) whether a composite biological
                                    clock outperforms single biological aging indicators in its association with health. For the five biolog-
                                    ical aging indicators and the composite clock, associations were computed with a wide panel of life-
                                    style (e.g. alcohol use, physical activity, smoking), somatic health (functional indicators, BMI,
                                    metabolic syndrome, chronic diseases) and mental health (childhood trauma, depression status)
                                    determinants.

                                    Results
                                    Sample characteristics
                                    To create indicators for biological aging we used whole blood derived measurements from the Neth-
                                    erlands Study of Depression and Anxiety (NESDA) baseline assessment: telomere length (N = 2936),
                                    epigenetics (DNA methylation, N = 1130, MBD-seq, 28M CpGs), gene expression (N = 1990, Affy-
                                    metrix U219 micro arrays, >20K genes), proteomics (N = 1837, Myriad RBM DiscoveryMAP 250+,
                                    171 proteins) and metabolites (N = 2910, Nightingale Health platform, 231 metabolites), with 653
                                    overlapping samples (see Table 1 for sample characteristics). Each subsample included around 66%
                                    female, with mean age of around 42 years.

                                    Computing biological clocks
                                    The methods for creating the biological clocks are described in detail in the Materials and methods
                                    section. In brief, for each of the four omics measures (epigenetic, transcriptomic, metabolomic and
                                    proteomic) we estimated biological age using ridge regression and cross validation (see Figure 1 for
                                    study design). As telomere length values usually decline with increasing chronological age, this indi-
                                    cator was multiplied by 1 to be able to compare directions of effects consistent with the other bio-
                                    logical clocks. Correlations between chronological age and predicted biological age were 0.30 for
                                    telomere length, 0.95 for epigenetic age, 0.72 for transcriptomic age, 0.85 for proteomic age, and
                                    0.70 for metabolomic age (Figure 1). For each omics-based biological clock, biological aging is
                                    defined as the residuals of regressing predicted biological age on chronological age: a positive value

Jansen, Han, et al. eLife 2021;10:e59479. DOI: https://doi.org/10.7554/eLife.59479                                                    2 of 20
Research article Cell Biology Genetics and Genomics
Table 1. Sample description.
Telomere Epigenetic Transcriptomic Proteomic Metabolomic Composite
Length Aging Aging Aging Aging Index
# Subjects 2936 1130 1990 1837 2910 653
Demographic Sex (%female) 66.00 65.00 67.00 67.00 66.00 66.00
Education years (mean) 12.15 11.93 12.07 12.07 12.15 11.71
Age (mean) 41.81 41.53 38.71 41.37 41.94 41.23
Lifestyle Alcohol use (units per week, mean) 6.24 6.54 6.38 6.39 6.29 6.48
Smoking (pack years, mean) 11.00 11.43 11.84 10.37 11.12 10.90
Physical activity 3679.72 3638.54 3729.20 3741.00 3668.13 3525.05
(MET minutes per week, mean)
Somatic BMI (mean) 25.60 25.67 25.68 25.66 25.60 25.82
Health
Physical disability (score, mean) 24.40 29.45 26.00 23.22 24.45 30.27
Lung capacity 477.74 479.75 478.42 477.19 477.23 475.23
(PEF in liter/minute, mean)
Hand grip strength (kg, mean) 37.06 37.77 37.08 37.46 37.05 37.74
Cardiometabolic disease (%cases) 18 18 18 18 18 17
Respiratory disease (%cases) 9 9 9 9 9 10
Musculoskeletal disease (%cases) 10 10 10 9 10 9
Digestive disease (%cases) 9 9 9 8 9 8
Neurological disease (%cases) 3 2 3 3 3 2
Endocrine disease (%cases) 3 3 3 3 3 4
Cancer (%cases) 7 8 7 7 7 8
Metabolic syndrome 1.36 1.39 1.37 1.33 1.36 1.41
(# components, mean)
# Chronic diseases (mean) 0.61 0.62 0.62 0.58 0.61 0.63
Mental Health Current MDD (%cases) 27 72 34 26 27 76
Depression severity (IDS, mean) 21.46 25.80 22.91 20.96 21.48 26.67
Childhood Trauma 0.91 0.97 1.00 0.87 0.92 1.01
(score from 0-4, mean)
means that the biological age is larger than the chronological age. The individual clocks residualized
for chronological age are also referred to as biological aging indicators. Correlations between bio-
logical aging indicators, corrected for sex, are presented in Figure 2. Correlations were significant
for 3 out of 10 pairs; proteomic vs metabolomic aging (r = 0.19, p=2e-16), transcriptomic vs epige-
netic aging (r = 0.15, p=3e-06) and transcriptomic vs proteomic aging (r = 0.08, p=2e-06).
Associations between individual biological aging indicators and health
determinants
For each of the five biological aging indicators, we computed associations with several demographic
(sex, education), lifestyle (physical activity, smoking, alcohol use), somatic health (BMI, hand grip
strength, lung function, physical disability, chronic diseases), and mental health (current depression,
depression severity, childhood trauma) determinants. Except for proteomic aging, sex was associ-
ated with all biological aging indicators: women were biologically younger than men (p=3e-4 for
telomere length, p=5e-4 for epigenetic aging, p=4e-11 for transcriptomic aging, p=1e-5 for metabo-
lomic aging). Education was not associated with any biological aging indicator. We controlled for
sex by using it as a covariate in all following models (except for in the model where sex was the out-
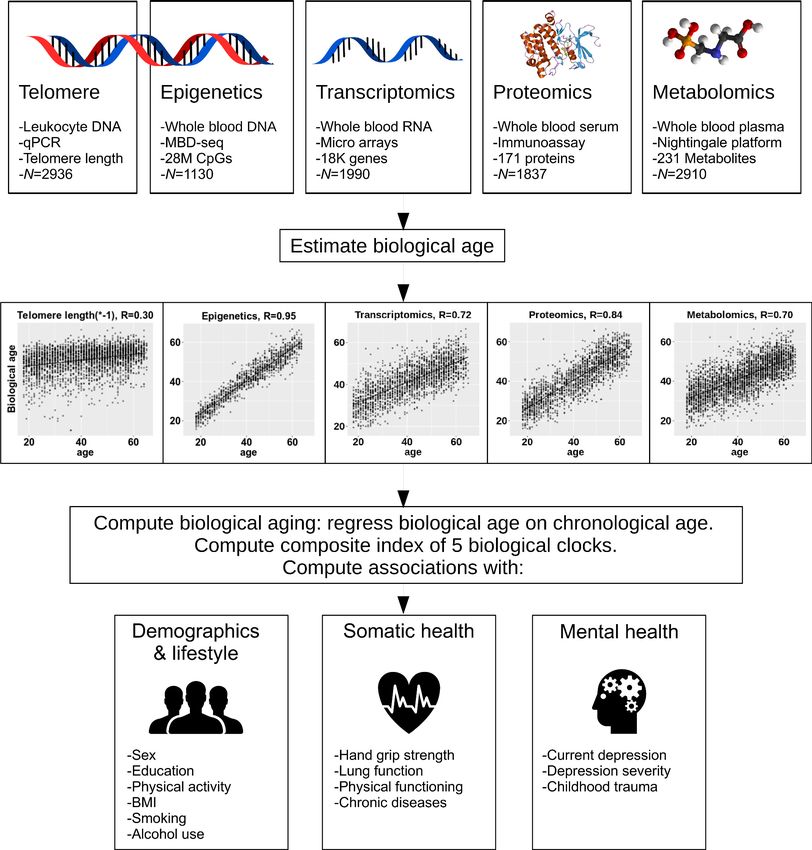
come). Table 2 and Figure 3 give an overview of all associations. Correction for multiple testing was
done using permutation-based FDR (Materials and methods), resulting in a p-value threshold of 2e-2
for an FDR of 5% for all tests.
Jansen, Han, et al. eLife 2021;10:e59479. DOI: https://doi.org/10.7554/eLife.59479 3 of 20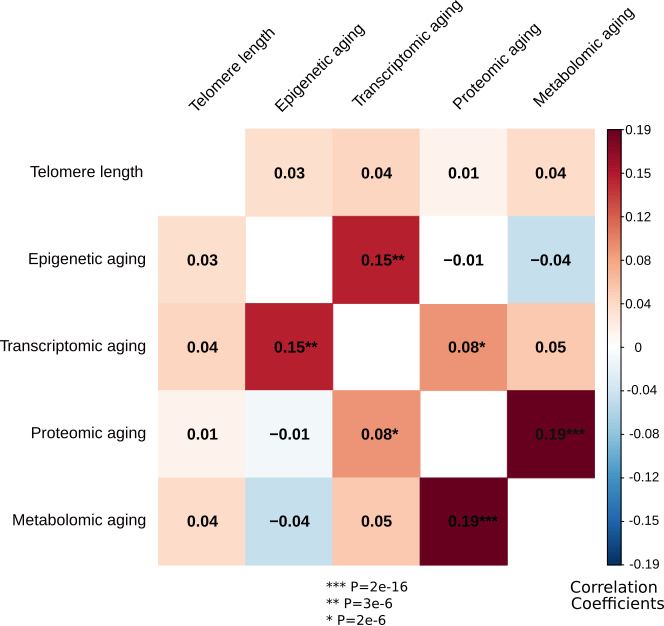
Research article                                                                                      Cell Biology Genetics and Genomics

Figure 1. Study design. The upper part of the figure shows the five biological layers. From each of the four omics layers (epigenetic, transcriptomic,
proteomic, and metabolomic data), biological age was estimated, and biological age was regressed on age to obtain measures of biological aging.
Only telomere length was not age-regressed. The five biological aging indicators were associated with multiple demographic, lifestyle, somatic health
and mental health determinants.

Jansen, Han, et al. eLife 2021;10:e59479. DOI: https://doi.org/10.7554/eLife.59479                                                              4 of 20
Research article                                                                                    Cell Biology Genetics and Genomics

                                    Figure 2. Correlations between the biological aging indicators. The heatmap represents Spearman rank
                                    correlations between the five biological aging indicators, all corrected for sex. Out of 10 pairs, three are
                                    significant: transcriptomic vs epigenetic aging, metabolomic vs proteomic aging and proteomic vs transcriptomic
                                    aging. All biological aging indicators were age-regressed, only telomere length was not.

                                        Among the lifestyle determinants, alcohol use was associated with advanced proteomic aging
                                    (p=3e-3) and smoking (packs per year) was associated with shorter telomere length (p=3e-3), and
                                    advanced transcriptomic (p=2e-2), proteomic (p=1e-5) and metabolomic aging (p=5e-3). Physical
                                    activity was not associated with any biological aging indicator.
                                        From the somatic health determinants, high BMI was strongly associated with advanced biological
                                    aging of all indicators (p=2e-2 for telomere length, p=4e-3 for epigenetic aging, p=6e-10 for tran-
                                    scriptomic aging, p=1e-7 for proteomic aging, and p=2e-35 for metabolomic aging). Physical disabil-
                                    ity was associated with advanced epigenetic aging (p=1e-4). Within the domain of chronic diseases,
                                    the presence of digestive diseases and endocrine diseases were associated with advanced proteo-
                                    mic aging (p=2e-2 and p=1e-2, respectively). Subjects with cardiometabolic disease showed
                                    advanced metabolomic aging (p=4e-3) and subjects with digestive disease exhibited advanced tran-
                                    scriptomic aging (p=1e-2). Those with metabolic syndrome showed advanced biological aging
                                    across four indicators (p=6e-4 for telomere length, p=1e-8 for transcriptomic aging, p=5e-9 for
                                    proteomic aging, p=5e-29 for metabolomic aging).
                                        The presence of current depression and depression severity were associated advanced epigenetic
                                    (p=2e-3 and p=9e-5) and proteomic aging (p=8e-3 and p=6e-3, respectively). Current depression
                                    was also associated with advanced transcriptomic aging (p=2e-2) and those with childhood trauma
                                    showed advanced epigenetic aging (p=8e-5). To verify if the results were confounded by medication

Jansen, Han, et al. eLife 2021;10:e59479. DOI: https://doi.org/10.7554/eLife.59479                                                           5 of 20
Table 2. Associations between five biological aging indicators and multiple health determinants.
For each biological aging indicator, linear models were fit with the health determinant as predictor, while controlling for sex. Beta’s and p-values from these models
are presented here. In the 653 samples with all five data layers available, a composite index was constructed which was significantly associated with more variables
than any of the five individual biological aging indicators. All biological aging indicators were age-regressed, only telomere length was not. Telomere length models
were corrected for age instead. * Beta for telomere length was multiplied by 1 to compare with other biological aging indicators. All measures are coded such that
Research article
higher values indicate advanced biological aging. Bold indicates FDR < 5%.
Composite Composite
Telomere Epigenetic Transcriptomic Proteomic Metabolomic Index Index
Length N=2936 clock N=1130 Clock N = 1990 Clock N=1837 Clock N=2910 (sum) N=653 (PC1) N=653
Beta* P Beta P Beta P Beta P Beta P Beta P Beta P
Demographic Sex (male/female) -0.06 2.89E-04 -0.10 4.65E-04 -0.15 3.64E-11 -0.03 1.46E-01 -0.08 1.25E-05 -0.18 2.33E-06 -0.11 3.59E-03
Education (# years) -0.03 1.12E-01 -0.02 5.21E-01 -0.01 6.37E-01 -0.05 3.43E-02 -0.03 8.22E-02 -0.04 3.11E-01 -0.05 2.27E-01
Lifestyle Alcohol use (units per week) 0.03 1.05E-01 -0.05 1.40E-01 0.00 9.21E-01 0.07 2.89E-03 0.04 4.57E-02 0.07 6.05E-02 0.09 1.50E-02
Smoking (pack years) 0.06 3.11E-03 0.02 6.22E-01 0.05 1.55E-02 0.10 1.33E-05 0.05 5.09E-03 0.10 1.15E-02 0.12 2.85E-03
Physical activity 0.02 2.75E-01 -0.06 3.88E-02 -0.04 6.42E-02 0.03 1.51E-01 0.01 5.18E-01 -0.04 3.62E-01 0.01 7.38E-01
Somatic BMI 0.04 1.80E-02 0.09 3.94E-03 0.14 6.02E-10 0.12 9.82E-08 0.23 2.07E-35 0.24 2.32E-10 0.22 2.18E-09
Health
Physical disability 0.03 9.11E-02 0.11 1.41E-04 0.04 8.61E-02 0.04 7.42E-02 -0.01 4.24E-01 0.10 7.38E-03 0.03 4.01E-01
Lung capacity 0.02 4.19E-01 0.03 4.65E-01 0.04 2.13E-01 -0.04 1.51E-01 0.03 2.37E-01 0.03 5.34E-01 -0.02 6.57E-01
Hand grip strength -0.02 3.33E-01 -0.06 1.71E-01 0.03 3.52E-01 0.01 7.30E-01 0.03 2.24E-01 -0.03 6.14E-01 0.03 6.20E-01
Jansen, Han, et al. eLife 2021;10:e59479. DOI: https://doi.org/10.7554/eLife.59479
Cardiometabolic disease (no/yes) 0.02 3.37E-01 0.04 1.56E-01 0.03 1.44E-01 0.03 1.35E-01 0.05 3.94E-03 0.10 1.37E-02 0.08 3.19E-02
Respiratory disease (no/yes) -0.02 2.12E-01 -0.01 6.34E-01 0.02 2.85E-01 0.03 1.27E-01 0.01 4.67E-01 -0.03 4.70E-01 0.01 7.17E-01
Musculoskeletal disease (no/yes) 0.00 8.11E-01 -0.01 7.37E-01 0.04 1.04E-01 0.02 4.36E-01 0.02 2.23E-01 0.09 2.27E-02 0.11 4.96E-03
Digestive disease (no/yes) 0.03 5.77E-02 -0.02 5.71E-01 0.06 9.76E-03 0.06 1.21E-02 0.02 2.81E-01 0.05 2.01E-01 0.04 2.86E-01
Neurological disease (no/yes) -0.02 2.58E-01 0.02 5.60E-01 0.01 5.44E-01 0.02 2.84E-01 0.02 1.93E-01 -0.04 2.64E-01 -0.02 5.09E-01
Endocrine disease (no/yes) -0.01 4.45E-01 0.01 8.13E-01 -0.01 5.75E-01 0.06 1.03E-02 0.03 1.23E-01 0.06 1.18E-01 0.09 1.64E-02
Cancer (no/yes) 0.00 9.66E-01 0.02 5.65E-01 0.02 4.88E-01 0.03 1.81E-01 0.02 2.01E-01 0.08 3.22E-02 0.07 5.00E-02
Metabolic syndrome (# 0.06 6.35E-04 0.04 1.46E-01 0.13 9.98E-09 0.13 5.34E-09 0.21 4.53E-29 0.28 9.10E-13 0.26 6.41E-12
components)
# Chronic diseases 0.00 7.99E-01 0.03 3.63E-01 0.05 3.20E-02 0.09 1.24E-04 0.03 1.39E-01 0.06 1.26E-01 0.07 8.43E-02
Mental Health Current MDD (no/yes) 0.03 1.59E-01 0.09 1.99E-03 0.07 1.68E-02 0.08 7.62E-03 -0.03 1.61E-01 0.11 6.05E-03 -0.12 2.29E-01
Depression severity 0.04 2.40E-02 0.12 8.67E-05 0.03 2.76E-01 0.07 5.99E-03 -0.02 3.74E-01 0.13 7.61E-04 0.05 1.87E-01
Childhood Trauma 0.01 4.54E-01 0.12 7.99E-05 0.03 2.06E-01 0.04 8.96E-02 0.04 2.46E-02 0.09 1.96E-02 0.07 7.19E-02
* Beta for telomere length was multiplied by -1 to compare with other biological clocks.
Bold indicates FDRResearch article Cell Biology Genetics and Genomics Figure 3. Forest plot of associations between biological aging and health determinants. For each of the associations between biological aging indicators and health determinants, the standardized beta and standard deviation derived from linear models were plotted. The significant associations (p
Research article                                                                              Cell Biology Genetics and Genomics

                                    more than 15% of variance (the first 2 PC’s more than 25% each), indicating the multidimensionality
                                    and non-redundancy of the five biological aging indicators.
                                       To allow for direct effect size comparisons between the composite (summed) index and the indi-
                                    vidual aging indicators, we compared the findings for the composite index to those of each individ-
                                    ual biological aging indicator with the same subsample. In this analysis, p-values and effect sizes
                                    were often more pronounced for the composite index (Figure 4, Supplementary file 2). For exam-
                                    ple, sex, BMI, metabolic syndrome and current MDD, were significantly associated with the compos-
                                    ite index, but the betas for the composite index were larger than the betas from any individual
                                    indicator. For the other five variables significantly associated with the composite index (smoking,
                                    physical disability, cardiometabolic disease, depression severity, and childhood trauma) the betas for
                                    the composite index were larger than four out of five betas from the individual biological aging
                                    indicators.

                                    Discussion
                                    In this study, we examined five biological clocks based on telomere length and four omics levels
                                    from a large, clinically well-characterized cohort. We demonstrated significant intercorrelations
                                    between three pairs of biological aging indicators, illustrating the complex and multifactorial pro-
                                    cesses of biological aging. Furthermore, we observed both overlapping and unique associations
                                    between the individual biological aging indicators and different lifestyle, somatic and mental health
                                    determinants. Separate linear regressions showed that male sex, high BMI, smoking, and metabolic
                                    syndrome were consistently associated with more advanced levels of biological aging across at least
                                    four of the biological clocks. Strikingly, depression was associated to more advanced levels of epige-
                                    netic, transcriptomic and proteomic aging, signifying that both somatic and mental health are associ-
                                    ated with advanced biological aging. Finally, by integrating a composite index of all biological aging
                                    indicators we were able to obtain larger effect sizes with for example physical disability and child-
                                    hood trauma exposure, underscoring the broad impact of determinants on cumulative multi-system
                                    biological aging.
                                        The range of correlations among the biological aging indicators considered in this study indicates
                                    that the correlates of chronological age in different molecular layers were not strongly correlated,
                                    suggesting that biological aging may be differently manifested at certain cellular levels. Consistent
                                    with prior studies, we showed weak correlations between different biological aging indicators
                                    (Li et al., 2020) and we confirm the absent relationship between telomere length and epigenetic
                                    aging (Marioni et al., 2018; Belsky et al., 2017; Breitling et al., 2016), but also show lack of associ-
                                    ations with transcriptomic, proteomic or metabolomic aging. However, we do confirm an earlier find-
                                    ing showing a significant but modest correlation between epigenetic and transcriptomic aging
                                    (Peters et al., 2015). The correlation between metabolomic and proteomic aging may partly be
                                    explained by the fact that both data were obtained from platforms that were aimed at probing cen-
                                    tral inflammation lipid processes, rather than the full proteome or metabolome. Nevertheless, we
                                    can infer that only some biological aging indicators show overlap, while most of them seem to be
                                    tracking distinctive parts of the aging process, even if they are associated with the same somatic or
                                    health determinants.
                                        Our study showed that several of the determinants considered exhibited consistent associations
                                    with different biological aging indicators. First, male sex was associated with shorter telomere length
                                    and advanced epigenetic, transcriptomic, and metabolomic aging, in line with a large body of litera-
                                    ture that shows advanced biological aging and earlier mortality in males compared to females
                                    (Austad and Fischer, 2016). Second, high BMI was consistently related to all biological aging indica-
                                    tors, showing that the more overweight or obese, the higher the biological age (Gielen et al.,
                                    2018), also after controlling for sex. Earlier studies showed similar associations between high BMI
                                    and shorter telomere length (Gielen et al., 2018), and older epigenetic (Horvath and Raj, 2018)
                                    and transcriptomic aging signatures (Peters et al., 2015). Third, our analyses showed similarly con-
                                    sistent associations between the prevalence of metabolic syndrome and advanced levels of aging.
                                    Further, all but epigenetic aging was advanced with respect to cigarette smoking.
                                        Major depressive disorder (MDD) status was consistently related to advanced aging in three (epi-
                                    genetic, transcriptomic, proteomic) out of the five biological aging indicators. In contrast, a recent
                                    study (N > 1000) in young adults (20–39 years) did not show associations between mental health (as

Jansen, Han, et al. eLife 2021;10:e59479. DOI: https://doi.org/10.7554/eLife.59479                                                   8 of 20
Research article Cell Biology Genetics and Genomics Figure 4. Barplots of betas from associations between biological aging and health determinants. For each of the associations between biological aging and health determinants, the standardized beta and standard deviation derived from linear models were plotted. Only samples that had data for all five biological clocks (N = 653) were used. All biological aging indicators were age-regressed, only telomere length was not. Jansen, Han, et al. eLife 2021;10:e59479. DOI: https://doi.org/10.7554/eLife.59479 9 of 20
Research article                                                                             Cell Biology Genetics and Genomics

                                    measured by the CIDI) and biological aging (indicated by telomere length, homeostatic dysregula-
                                    tion, Klemer and Doubal’s method and Levine’s method) (Hastings et al., 2019), but it seems possi-
                                    ble that this sample was too young to fully develop aging-related manifestations of mental health
                                    problems, or lacked age variation. It is likely that our data (obtained from participants 18–64 years)
                                    may have been more sensitive in picking up associations with mental health due to increased varia-
                                    tion in both chronological age (i.e. inclusion of older persons), as well as symptom severity. To fur-
                                    ther examine whether the results were consistent across participants with and without depressive
                                    psychopathology, we repeated all models in post-hoc analyses and added an interaction term
                                    between current depression status and health determinants. There was an overall consistent pattern
                                    of non-significant interaction terms for most health determinants and biological aging, although only
                                    higher BMI was significantly associated to advanced epigenetic aging in the psychopathology group.
                                    However, taken together, the results suggest that findings are not different in persons with and with-
                                    out mental disorders. We observed some significant associations between biological aging and med-
                                    ication use. The design of the current observational study cannot conclusively prove whether this is a
                                    direct medication effect or confounding by indication: the patient group using antidepressant medi-
                                    cation is also the group that is more chronically and severely depressed. This is similar for the meta-
                                    bolic syndrome related medication. Future studies using randomized clinical trial designs are
                                    needed to investigate the mechanism of action of direct pharmacological effects of medication on
                                    biological aging.
                                        Furthermore, we computed a composite index by summing up the five biological aging indicators
                                    studied here. In other words, this integrative metric contains cumulative independent signal from the
                                    individual markers and dependent shared signal – with possible reduced noise due to the summation
                                    – between them. Given that this composite index demonstrates larger effect sizes for BMI, sex,
                                    smoking, depression severity, and metabolic syndrome than the individual aging indicators, it is sug-
                                    gested that being biologically old at multiple cellular levels has a cumulative multi-systemic effect.
                                    When integrated, the composite index reveals stronger (i.e. greater cumulative betas for the com-
                                    posite index than individual clocks) converging associations with sex, BMI, metabolic syndrome and
                                    current MDD. This provides further support for the hypothesis that not one biological clock suffi-
                                    ciently captures the biological aging process and that not all clocks are under the control of one uni-
                                    tary aging process. There is abundant room for further progress in determining whether biological
                                    aging can be modified by intervening on these determinants.
                                        Nonetheless, the question remains which biological mechanism could plausibly link the current
                                    quantification of biological aging and its lifestyle, somatic, and mental health determinants. Part of
                                    this answer requires discussion on the features used to build the different clocks: the proteomic and
                                    metabolomic clocks mostly measure inflammatory or metabolic factors, two highly integrated pro-
                                    cesses in aging and aging-related diseases (Frasca et al., 2017). Previous studies suggest immune-
                                    mediated mechanisms (specifically inflammatory signaling) connecting metabolic syndrome
                                    (Révész et al., 2015), mental health disorders (Wohleb et al., 2016), and aging (Révész et al.,
                                    2018). Moreover, MDD is a condition in which inflammation, obesity, and premature or advanced
                                    aging co-occur and converge. It might therefore be speculated that immunity and ’inflammaging’
                                    (Franceschi et al., 2018) may tie together the currently observed associations.
                                        This study did not include existing biological clocks. While the application of established algo-
                                    rithms would increase generalizability of our findings, there are several reasons why it was not opti-
                                    mal to implement previously published algorithms in the NESDA data. First and foremost,
                                    generated omics data are platform-dependent and the existing epigenetic (Horvath, 2013) and
                                    gene expression (Peters et al., 2015) clocks rely on arrays with different coverage of probes as was
                                    used in NESDA, that also target different parts of genes. Second, a subsample of NESDA was part
                                    of the previously published metabolomic clock (Akker et al., 2019), thus application of this model
                                    to the current dataset would result in overfitting. The current proteomic platform has not been used
                                    before to train a biological clock. Moreover, there is currently no validated gold standard for calcu-
                                    lating transcriptomic, proteomic, or metabolomic clocks. Importantly, in spite of these limitations,
                                    we have followed an alternative but consistent methodological approach for training our omics-
                                    based biological clocks, leveraging the advantage to compare, combine, and integrate these clocks
                                    within the same population. However, we emphasize the need for epidemiological replication of
                                    these determinants in other datasets (e.g. those including different ethnicities) and we recognize

Jansen, Han, et al. eLife 2021;10:e59479. DOI: https://doi.org/10.7554/eLife.59479                                                 10 of 20
Research article Cell Biology Genetics and Genomics
that data harmonization and pooling are important strategies on the scientific research agenda that
may overcome this limitation in the future.
Since no previously published algorithms were used, we trained our own clocks using ridge
regression with cross-validation. This approach relies on the assumption that the determined cross-
sectional correlation between the omics patterns and chronological age arise mainly as a conse-
quence of biological aging, and is independent from potential secular trends (Nelson et al., 2020;
Belsky, 2015; Belsky et al., 2020). As common to cross-sectional studies, it is, however, impossible
to completely rule out potential cohort effects or uncontrolled individual differences and results
should be interpreted in light of this limitation. Future longitudinal studies are needed to identify
patterns of biological changes that go beyond their ability to predict age at the time of sampling.
While the current study only used chronological age as criterion endpoint, it is important to mention
that other epigenetic clocks exist that are trained to predict other potential criteria such as pheno-
typic markers of age (DNAm PhenoAge) (Levine et al., 2018) or a composite biomarker that was
derived from DNAm surrogates and smoking in pack-years (GrimAge) (Hillary et al., 2019). Such
clocks were developed to lead to improved predictions of risk of mortality.
More research is needed to elucidate whether: (1) physiological disturbances, such as loss of
inflammatory control associated with somatic and psychopathology, accelerate biological aging over
time, (2) advanced biological aging precedes and constitutes a vulnerability factor that causes
somatic and psychopathology, or (3) somatic and psychopathology and biological aging processes
are not causally linked, but share underlying etiological roots (e.g. shared genetic risks or environ-
mental factors) (Han et al., 2019). Yet, it could conceivably be hypothesized that dysregulation of
immunoinflammatory control may be related to metabolic outcomes, aging, and depression
(Diniz and Vieira, 2018), providing scope as to why some of these determinants converge across
different platforms and multiple biological levels.
Here, we used a large cohort that was well-characterized in terms of demographics, lifestyle, and
both somatic and mental health assessments, to study and integrate five biological clocks across
multiple levels of analysis. This is particularly important as we show that the determinants of biologi-
cal aging encompass several different domains. Moreover, our sample was adequately powered to
detect statistically significant associations, limiting the possibility for chance findings and increasing
probability for identifying robust biological age determinants. On the other hand, an obvious limita-
tion is the cross-sectional nature of this study that prevents us from drawing any conclusions on
whether the determinants accelerate the aging trajectory over time, the other way around, or
whether ‘third’ variables effect this association.
Another aspect that limits the interpretability of our findings in the context of increased risk of
developing aging-related diseases and mortality was the relatively young age of the current sample.
To illustrate, we were unable to predict future incidence of chronic disease or mortality from baseline
biological aging, likely due to the low numbers of mortality and disease onset (Supplementary file
3), for example the number of deceased cases ranged from 64 (TL) to 27 (proteomic clock). Previous
studies that have associated biological aging with mortality risk commonly include aging cohorts
(Danish longitudinal twin study with mean age of 86.1 years; Framingham Offspring Study with mean
age 61.0 years; Swedish population cohort SATSA with mean age 63.6 years; German population
cohort ESTHER with mean age 62.5 years; Lothian Birth Cohorts with mean age >69.5 years; Norma-
tive Aging Study with mean age 71.7 years) (Marioni et al., 2018; Li et al., 2020;
Christiansen et al., 2016; Perna et al., 2016; Murabito et al., 2018; Chen et al., 2016). Before
definitively interpreting a ‘clock’ as a measure of biological aging, further independent studies are
needed to establish that the clock changes with advancing age and forecasts disease, disability and
mortality.
Conclusions
In conclusion, this study examined the overlap between five biological aging indicators and their
shared and unique associations with somatic and mental health. Our findings indicate that they
largely track distinct, but also partially overlapping aspects of this aging process. Further, we dem-
onstrated that male sex, smoking, higher BMI and metabolic syndrome were consistently related to
advanced aging at multiple biological levels. Remarkably, our study also converges evidence of
depression and childhood trauma associations across multiple platforms, cellular levels, and sample
sizes, highlighting the important link between mental health and biological aging. Taken together,
Jansen, Han, et al. eLife 2021;10:e59479. DOI: https://doi.org/10.7554/eLife.59479 11 of 20Research article Cell Biology Genetics and Genomics
our findings contribute to the understanding and identification of biological age determinants,
important to the development of end points for clinical and epidemiological research.
Materials and methods
Study design and participants
Data used were from the Netherlands Study of Depression and Anxiety (NESDA), an ongoing longi-
tudinal cohort study examining course and consequences of depressive and anxiety disorders. The
NESDA sample consists of 2981 persons between 18 and 65 years including persons with a current
or remitted diagnosis of a depressive and/or anxiety disorder (74%) and healthy controls (26%). Indi-
viduals were recruited from mental health care settings, general practitioners, and the general popu-
lation in the period from September 2004 to February 2007. Persons with insufficient command of
the Dutch language or a primary clinical diagnosis of other severe mental disorders, such as severe
substance use disorder or a psychotic disorder were excluded. Participants were assessed during a 4
hr clinical visit, consisting of the collection of all somatic and mental health determinants in the cur-
rent study, as well as a fasting blood draw. All omics data was obtained from the same blood sam-
ple, drawn at the same time point as the health determinant examination during the face-to-face
visit. The study was approved by the Ethical Review Boards of participating centers, and all partici-
pants signed informed consent. More than 94% of the NESDA participants were from North Euro-
pean origin. The population and methods of the NESDA study have been described in more detail
elsewhere (NESDA Research Consortium et al., 2008).
Data to derive different biological clocks was available for different subsamples and all based on
the same fasting blood draw from participants in the morning between 8:30 and 9:30 after which
samples were stored in a 80˚C freezer or – for RNA - transferred into PAXgene tubes (Qiagen,
Valencia, California, USA) and stored at 20˚C. To create biological clocks, we used telomere length
(N = 2936), DNA methylation (N = 1130, MBD-seq, 28M CpGs), gene expression (N = 1990, Affyme-
trix U219 micro arrays, >20K genes), proteins (N = 1837, Myriad RBM DiscoveryMAP 250+, 171 pro-
teins) and metabolites (N = 2910, Nigthingale platform, 231 metabolites), see Table 1 and details in
the following sections.
Biological clock assessments
Telomere length
Leukocyte telomere length was determined at the laboratory of Telomere Diagnostics, Inc (Menlo
Park, CA, USA), using quantitative polymerase chain reaction (qPCR), adapted from the published
original method by Cawthon, 2002. Telomere sequence copy number in each patient’s sample (T)
was compared to a single-copy gene copy number (S), relative to a reference sample. The resulting
T/S ratio is proportional to mean leukocyte telomere length. The detailed method is described else-
where (Verhoeven et al., 2014). The reliability of the assay was adequate: eight included quality
control DNA samples on each PCR run illustrated a small intra-assay coefficient of variation
(CV = 5.1%), and inter-assay CV was also sufficiently low (CV = 4.6%).
DNA methylation (epigenetic clock)
To assay the methylation levels of the approximately 28 million common CpG sites in the human
genome, we used an optimized protocol for MBD-seq (Han et al., 2018; Aberg et al., 2020). With
this method, genomic DNA is first fragmented and the methylated fragments are then bound to the
MBD2 protein that has high affinity for methylated DNA. The non-methylated fraction is washed
away and only the methylation-enriched fraction is sequenced. This optimized protocol assesses
about 94% of the CpGs in the methylome. The sequenced reads were aligned to the reference
genome (build hg19/GRCh37) with Bowtie2 (Langmead and Salzberg, 2012) using local and
gapped alignment. Aligned reads were further processed using the RaMWAS Bioconductor
package (Shabalin et al., 2018) to perform quality control and calculate methylation scores for each
CpG.
Jansen, Han, et al. eLife 2021;10:e59479. DOI: https://doi.org/10.7554/eLife.59479 12 of 20Research article Cell Biology Genetics and Genomics
Gene expression (transcriptomic clock)
RNA processing and assaying -done at Rutgers University Cell and DNA repository- have been
described previously (Jansen et al., 2014; Jansen et al., 2017; Wright et al., 2014). Samples were
hybridized to Affymetrix U219 arrays (Affymetrix, Santa Clara, CA). Array hybridization, washing,
staining, and scanning were carried out in an Affymetrix GeneTitan System per the manufacturer’s
protocol. Gene expression data were required to pass standard Affymetrix QC metrics (Affymetrix
expression console) before further analysis. We excluded from further analysis probes that did not
map uniquely to the hg19 (Genome Reference Consortium Human Build 37) reference genome
sequence, as well as probes targeting a messenger RNA (mRNA) molecule resulting from transcrip-
tion of a DNA sequence containing a single nucleotide polymorphism (based on the dbSNP137 com-
mon database). After this filtering step, data for analysis remained for 423,201 probes, which was
summarized into 44,241 probe sets targeting 18,238 genes. Normalized probe set expression values
were obtained using Robust Multi-array Average (RMA) normalization as implemented in the Affy-
metrix Power Tools software (APT, version 1.12.0, Affymetrix). Data for samples that displayed a low
average Pearson correlation with the probe set expression values of other samples, and samples
with incorrect sex-chromosome expression were removed.
Proteins (proteomic clock)
As described previously (Lamers et al., 2016), a panel of 243 analytes (Myriad RBM DiscoveryMAP
250+) involved in various hormonal, immunological, and metabolic pathways was assessed in serum
using multiplexed immunoassays in a Clinical Laboratory Improvement Amendments (CLIA)-certified
laboratory (Myriad RBM; Austin, TX, USA). After excluding analytes with more than 30% missing
data (mostly due to values outside the ranges of detection), 171 of the 243 analytes remained for
analysis (with values below and above detection limits imputed with the detection limit values).
Metabolites (metabolomic clock)
Metabolite measurements have been described in detail previously (Akker et al., 2019; BBMRI-
NL Metabolomics Consortium et al., 2020). In short, a total of 232 metabolites or metabolite ratios
were reliably quantified from Ethylenediaminetetraacetic acid plasma samples using targeted high-
throughput proton Nuclear Magnetic Resonance (1H-NMR) metabolomics (Nightingale Health Ltd,
Helsinki, Finland) (Soininen et al., 2015). Metabolites measures provided by the platform include (1)
lipids, fatty acids and low-molecular-weight metabolites (N = 51); (2) lipid composition and particle
concentration measures of lipoprotein subclasses (N = 98); (3) metabolite ratios (N = 81). This
metabolomics platform has been extensively used in large-scaled epidemiological studies in the field
of diabetes, cardiovascular disease, mortality and alcohol intake (Akker et al., 2019; Würtz et al.,
2016; Wurtz et al., 2012; Würtz et al., 2015; Fischer et al., 2014). The data contained missing val-
ues due to detection limits. Samples with more than 25 missings were removed (N = 71), metabo-
lites with more than 250 missings were removed (N = 1). Other missing values were replaced with
the median value per metabolite. In total 231 metabolites in 2910 samples remained for analysis.
Building biological clocks for multiple omics domains
Telomere length was multiplied by 1 to be able to compare directions of effects consistent with
that of other biological clocks. For each of the other four omics domains (epigenetic, transcriptomic,
metabolomic, and proteomic data) the same approach was used to compute biological clocks. First,
the omics data were residualized with respect to technical covariates (batch, lab). Second, data per
omics marker were normalized using a quantile-normal transformation. Finally, biological age was
computed using cross-validation by splitting the sample in 10 equal parts. For each of the 10 groups,
nine parts were used as training set and the 10th as test set. In the training set the biological age
estimator was computed using ridge regression (R library glmnet), with chronological age as the out-
come, and the omics data as predictors. Only for methylation and gene expression a selection of
predictors (CpGs for methylation-based models and genes for gene-expression-based models) was
made for each cross validation step: we increased the number of sites included in the elastic net in
steps (steps for CpGs: 0, 100, 1000, 10,000, 80,000, 100,000, steps for gene expression 100, 500,
1000, 1200, 1400). CpGs/genes were selected in the order of their ranks derived from the associa-
tion with age in the training sample. We selected the number of CpGs/genes where the cumulative
Jansen, Han, et al. eLife 2021;10:e59479. DOI: https://doi.org/10.7554/eLife.59479 13 of 20Research article Cell Biology Genetics and Genomics
association signal reached a stable plateau. This approach is based on the rationale that adding
more markers should theoretically never decrease predictive power. We previously performed tests
where the number of CpGs/genes was included in the loop over the k-folds. However, as it pro-
duced very similar results but is much more computer intensive (Clark et al., 2020), this latter
approach was not used. This approach resulted in 80,000 CpGs (mapping to 2976 genes) for the epi-
genetic clock, and 1200 probes (mapping to 767 genes) for the transcriptomic clock. For the proteo-
mic and metabolomic data, all markers were used to predict age, because leaving markers out
decreased the prediction accuracy. The predictor was then used in the test set to create an unbiased
omics-based biological age. For each omics domain, biological aging was defined as the residuals of
regressing biological age on chronological age (Han et al., 2018; Peters et al., 2015). Thus, in the
terminology we use here, the biological aging indicators represent the biological age acceleration: a
positive value means that the biological age is larger than the chronological age. A composite index
of biological aging was made by scaling each of the five biological indicators and taking the sum, in
the 653 samples that had data for all five omics levels.
Health determinants
Lifestyle
Alcohol consumption was assessed as units per week by using the AUDIT (Babor et al., 1989).
Smoking status was assessed by pack years (smoking duration * cigarettes per day/20). Physical
activity (Gerrits et al., 2013) was assessed using the International Physical Activity Questionnaire
(IPAQ) (Craig et al., 2003) and expressed as overall energy expenditure in Metabolic Equivalent
Total (MET) minutes per week (MET level * minutes of activity * events per week).
Somatic health
BMI was calculated as measured weight divided by height-squared. Functional status is one of the
most potent health status indicators in predicting adverse outcomes in aging populations
(Guralnik et al., 1996), including depression (Milaneschi and Penninx, 2014). Assessment of func-
tional status includes measures of physical impairments and disability, reflecting how individuals’ lim-
itations interact with the demands of the environment. Two measures of physical impairments were
available: Lung capacity was determined by measuring the peak expiratory flow (PEF in liter/minute)
using a mini Wright peak flow meter. Hand grip strength was measured with a Jamar hand held
dynamometer in kilograms of force and was assessed for the dominant hand. Furthermore, physical
disability was measured with the World Health Organization Disability Assessment Schedule II
(WHODAS-II)s the sum of scale 2 (mobility) and scale 3 (self-care). The number of self-reported cur-
rent somatic diseases for which participants received medical treatment was counted. We used
somatic disease categories as categorized previously (Gerrits et al., 2013; Gaspersz et al., 2018):
cardiometabolic, respiratory, musculoskeletal, digestive, neurological and endocrine diseases, and
cancer. Metabolic syndrome components included waist circumference, systolic blood pressure, HDL
cholesterol, triglycerides, and glucose levels, which measurement methods are described elsewhere
(Révész et al., 2014).
Mental health
Presence of current (6 month recency) major depressive disorder was assessed by the DSM-IV Com-
posite International Diagnostic Interview (CIDI) version 2.1. Depressive severity levels in the week
prior to assessment were measured with the 28-item Inventory of Depressive Symptomatology (IDS)
self-report (Rush et al., 1996). Childhood trauma was assessed with the Childhood Trauma Interview
(CTI) (de Graaf et al., 2002). In this interview, participants were asked whether they were emotion-
ally neglected, psychologically abused, physically abused or sexually abused before the age of 16.
The CTI reports the sum of the categories that were scored from 0 to 2 (0: never happened; 1:
sometimes; 2: happened regularly), which was categorized into five categories.
Statistical analyses
For each of the five biological aging indicators we computed associations with demographic (sex,
education), lifestyle (physical activity, smoking, alcohol use), somatic health (BMI, hand grip strength,
lung function, physical disability, chronic diseases), and mental health (current depression,
Jansen, Han, et al. eLife 2021;10:e59479. DOI: https://doi.org/10.7554/eLife.59479 14 of 20Research article Cell Biology Genetics and Genomics
depression severity, childhood trauma) determinants using linear models with health determinants as
predictors and biological aging as outcome (for each health determinant separately). All models
included a covariate for sex, except for when sex was the outcome. For telomere length, chronologi-
cal age was used as covariate in the models, for the other biological aging indicators age was not
used as covariate because they are independent of chronological age by design. Standardized betas
from these models are reported (by scaling predictor and outcome). Correction for multiple testing
was done using permutation based FDR (Fehrmann et al., 2011). Subject labels were permuted
1000 times and associations were computed using the permuted data (all biological aging indicators
vs all health determinants). For each of the observed p-values (p) the FDR was computed as the aver-
age number of permuted p-values smaller than p, divided by the amount of real p-values smaller
than p, resulting in a p-value threshold of 2e-2 for a FDR of 5% for all tests. In the 653 overlapping
samples with data in each biological clock domain, we scaled (mean 0, standard deviation 1) and
summed up the five biological aging indicators in order to create a composite index of biological
aging.
Longitudinal analysis of mortality and chronic disease onset
As NESDA is a longitudinal study, with several follow-up measurement waves, we conducted post-
hoc analyses on the relationship between the biological aging indicators and subsequent outcomes
after six years of follow-up duration. The average chronological age of our cohort (mean = 41 years,
sd = 13, range = 18–65 years) is rather young, so high rates of mortality and morbidity were not
expected. Mortality data was gathered at each measurement wave. Also, at each wave self-reported
somatic diseases for which participants received medical treatment were assessed. Based on this, we
created somatic disease categories as categorized previously (Gerrits et al., 2013; Gaspersz et al.,
2018): cardiometabolic, respiratory, musculoskeletal, digestive, neurological and endocrine diseases,
and cancer. For these categories, we computed chronic disease onset defined as the disease not
being present at baseline (time of biological aging assessment) and present at the latest wave (6
years after baseline). For each biological clock, we computed longitudinal analyses, using a linear
model with mortality or chronic disease onset as outcome, and the biological clock residualized for
chronological age as predictor, while correcting for sex.
Acknowledgements
The infrastructure for the NESDA study (http://www.nesda.nl) is funded through the Geestkracht
program of the Netherlands Organisation for Health Research and Development (ZonMw, grant
number 10-000-1002) and financial contributions by participating universities and mental health care
organizations (VU University Medical Center, GGZ inGeest, Leiden University Medical Center, Leiden
University, GGZ Rivierduinen, University Medical Center Groningen, University of Groningen, Lentis,
GGZ Friesland, GGZ Drenthe, Rob Giel Onderzoekscentrum). Telomere length assaying was sup-
ported through a NWO-VICI grant (number 91811602). Methylation sequencing was supported by
NIMH grant R01MH099110. Metabolomics data were generated within the framework of the BBMRI
Metabolomics Consortium funded by BBMRI-NL, a research infrastructure financed by the Dutch
government (NWO, grant nr 184.021.007 and 184033111). Gene expression data were funded by
the US National Institute of Mental Health (RC2MH089951).
Additional information
Competing interests
Brenda WJH Penninx: has received research funding (not related to the current paper) from Boeh-
ringer Ingelheim and Jansen Research. The other authors declare that no competing interests exist.
Funding
No external funding was received for this work.
Jansen, Han, et al. eLife 2021;10:e59479. DOI: https://doi.org/10.7554/eLife.59479 15 of 20Research article Cell Biology Genetics and Genomics
Author contributions
Rick Jansen, Formal analysis, Visualization, Methodology, Writing - original draft, Writing - review
and editing; Laura KM Han, Josine E Verhoeven, Yuri Milaneschi, Brenda WJH Penninx, Writing -
original draft, Writing - review and editing; Karolina A Aberg, Edwin CGJ van den Oord, Writing -
review and editing
Author ORCIDs
Rick Jansen https://orcid.org/0000-0002-3333-6737
Laura KM Han https://orcid.org/0000-0001-9647-3723
Ethics
Human subjects: The NESDA study was approved by the Ethical Review Boards of participating cen-
ters, and all participants signed informed consent. The population and methods of the NESDA study
have been described in more detail elsewhere (Hillary et al., 2019).
Decision letter and Author response
Decision letter https://doi.org/10.7554/eLife.59479.sa1
Author response https://doi.org/10.7554/eLife.59479.sa2
Additional files
Supplementary files
. Source data 1. Data used for Figure 3.
. Source data 2. Data used for Figure 4.
. Supplementary file 1. Associations between biological aging and medication use.
. Supplementary file 2. Associations between biological aging (individual indicators and composite
index) and health determinants in 653 overlapping samples. For each biological aging indicator lin-
ear models were fit with the health determinant as predictor, while controlling for sex. The analysis
was limited to the 653 samples with all five data layers available. Beta’s and p-values from these
models are presented here. * Beta for telomere length was multiplied by 1 to compare with other
biological aging indicators. All measures are coded such that higher values indicate advanced bio-
logical aging. Bold indicates FDR < 5%.
.Supplementary file 3. Longitudinal analysis of biological aging and mortality and chronic disease
onset.
. Transparent reporting form
Data availability
According to European law (GDPR) data containing potentially identifying or sensitive patient informa-
tion are restricted; our data involving clinical participants are not freely available in a public repository.
However, we highly value scientific collaboration, therefore, in principle, NESDA data are available to
all scientific researchers working at non-commercial research organizations worldwide. Researchers
can request either existing data for data analyses or bioanalysis. Please visit the online data overview
for an extensive overview of the available data and NESDA’s current output (http://www.nesda.nl).
Data are available upon request via the NESDA Data Access Committee (nesda@ggzingeest.nl). Gene
expression data used for this study are available at dbGaP, accession number phs000486.v1.p1
(https://www.ncbi.nlm.nih.gov/projects/gap/cgi-bin/study.cgi?study_id=phs000486.v1.p1). As agreed
with NIH and approved by the local IRB, the data was scheduled to be deposited in the NIH controlled
access repository dbGAP. However, dbGAP is currently full and as soon as the new NIH controlled
access repository comes online data will be deposited.
The following previously published dataset was used:
Jansen, Han, et al. eLife 2021;10:e59479. DOI: https://doi.org/10.7554/eLife.59479 16 of 20Research article Cell Biology Genetics and Genomics
Database and
Author(s) Year Dataset title Dataset URL Identifier
Sullivan PF, Wright 2014 Integration of Genomics and https://www.ncbi.nlm. dbGAP, phs000486.
F, Wang W, Sun W, Transcriptomics in unselected nih.gov/projects/gap/ v1.p1
Zou F, Batista A, Twins and in Major Depression cgi-bin/study.cgi?study_
Madar V, Via K, id=phs000486.v1.p1
Brooks A, Tischfield
J, Wang Q, Qu A,
Kochar J,
D’Ambrosia D,
Penninx B, Smit J,
Jansen R, van
Grootheest G,
Boomsma D,
deGeus E,
Willemsen G,
Hottenga J-J
References
Aberg KA, Dean B, Shabalin AA, Chan RF, Han LKM, Zhao M, van Grootheest G, Xie LY, Milaneschi Y, Clark SL,
Turecki G, Penninx B, van den Oord E. 2020. Methylome-wide association findings for major depressive
disorder overlap in blood and brain and replicate in independent brain samples. Molecular Psychiatry 25:1344–
1354. DOI: https://doi.org/10.1038/s41380-018-0247-6, PMID: 30242228
Akker E, Trompet S, Wolf J, Beekman M, Suchiman HED. 2019. Predicting biological age based on the BBMRI-
NL 1 H-NMR metabolomics repository. bioRxiv. DOI: https://doi.org/10.1101/632919
Austad SN, Fischer KE. 2016. Sex differences in lifespan. Cell Metabolism 23:1022–1033. DOI: https://doi.org/
10.1016/j.cmet.2016.05.019, PMID: 27304504
Babor TF, Kranzler HR, Lauerman RJ. 1989. Early detection of harmful alcohol consumption: comparison of
clinical, laboratory, and self-report screening procedures. Addictive Behaviors 14:139–157. DOI: https://doi.
org/10.1016/0306-4603(89)90043-9, PMID: 2728952
BBMRI-NL Metabolomics Consortium, Bot M, Milaneschi Y, Al-Shehri T, Amin N, Garmaeva S, Onderwater GLJ,
Pool R, Thesing CS, Vijfhuizen LS, Vogelzangs N, Arts ICW, Demirkan A, van Duijn C, van Greevenbroek M, van
der Kallen CJH, Köhler S, Ligthart L, van den Maagdenberg A, Mook-Kanamori DO, de Mutsert R, et al. 2020.
Metabolomics profile in depression: a pooled analysis of 230 metabolic markers in 5283 cases with depression
and 10,145 controls. Biological Psychiatry 87:409–418. DOI: https://doi.org/10.1016/j.biopsych.2019.08.016,
PMID: 31635762
Belsky DW. 2015. Reply to Newman: quantification of biological aging in young adults is not the same thing as
the onset of obesity. PNAS 112:E7164–E7165. DOI: https://doi.org/10.1073/pnas.1518878112, PMID: 266765
81
Belsky DW, Moffitt TE, Cohen AA, Corcoran DL, Levine ME, Prinz JA, Schaefer J, Sugden K, Williams B, Poulton
R, Caspi A. 2017. Eleven telomere, epigenetic clock, and Biomarker-Composite quantifications of biological
aging: do they measure the same thing? American Journal of Epidemiology 187:1220–1230. DOI: https://doi.
org/10.1093/aje/kwx346
Belsky DW, Caspi A, Arseneault L, Baccarelli A, Corcoran DL, Gao X, Hannon E, Harrington HL, Rasmussen LJH,
Houts R, Huffman K, Kraus WE, Kwon D, Mill J, Pieper CF, Prinz JA, Poulton R, Schwartz J, Sugden K, Vokonas
P, et al. 2020. Quantification of the pace of biological aging in humans through a blood test, the DunedinPoAm
DNA methylation algorithm. eLife 9:e54870. DOI: https://doi.org/10.7554/eLife.54870
Boks MP, Mierlo H, Rutten BPF, Radstake TRDJ, De Witte L, Geuze E, Horvath S, Schalkwyk LC, Vinkers CH,
Broen JCA, Vermetten E. 2015. Longitudinal changes of telomere length and epigenetic age related to
traumatic stress and post-traumatic stress disorder. Psychoneuroendocrinology 51:506–512. DOI: https://doi.
org/10.1016/j.psyneuen.2014.07.011
Breitling LP, Saum K-U, Perna L, Schöttker B, Holleczek B, Brenner H. 2016. Frailty is associated with the
epigenetic clock but not with telomere length in a German cohort. Clinical Epigenetics 8:21. DOI: https://doi.
org/10.1186/s13148-016-0186-5
Cawthon RM. 2002. Telomere measurement by quantitative PCR. Nucleic Acids Research 30:–47. DOI: https://
doi.org/10.1093/nar/30.10.e47
Chen BH, Marioni RE, Colicino E, Peters MJ, Ward-Caviness CK, Tsai P-C, Roetker NS, Just AC, Demerath EW,
Guan W, Bressler J, Fornage M, Studenski S, Vandiver AR, Moore AZ, Tanaka T, Kiel DP, Liang L, Vokonas P,
Schwartz J, et al. 2016. DNA methylation-based measures of biological age: meta-analysis predicting time to
death. Aging 8:1844–1865. DOI: https://doi.org/10.18632/aging.101020
Chen BH, Carty CL, Kimura M, Kark JD, Chen W, Li S, Zhang T, Kooperberg C, Levy D, Assimes T, Absher D,
Horvath S, Reiner AP, Aviv A. 2017. Leukocyte telomere length, T cell composition and DNA methylation age.
Aging 9:1983–1995. DOI: https://doi.org/10.18632/aging.101293
Christiansen L, Lenart A, Tan Q, Vaupel JW, Aviv A, McGue M, Christensen K. 2016. DNA methylation age is
associated with mortality in a longitudinal Danish twin study. Aging Cell 15:149–154. DOI: https://doi.org/10.
1111/acel.12421, PMID: 26594032
Jansen, Han, et al. eLife 2021;10:e59479. DOI: https://doi.org/10.7554/eLife.59479 17 of 20You can also read