A new marine biogenic emission: methane sulfonamide (MSAM), dimethyl sulfide (DMS), and dimethyl sulfone (DMSO2) measured in air over the Arabian ...
←
→
Page content transcription
If your browser does not render page correctly, please read the page content below
Atmos. Chem. Phys., 20, 6081–6094, 2020
https://doi.org/10.5194/acp-20-6081-2020
© Author(s) 2020. This work is distributed under
the Creative Commons Attribution 4.0 License.

A new marine biogenic emission: methane sulfonamide
(MSAM), dimethyl sulfide (DMS), and dimethyl sulfone
(DMSO2) measured in air over the Arabian Sea
Achim Edtbauer1 , Christof Stönner1 , Eva Y. Pfannerstill1 , Matias Berasategui1 , David Walter1,2 , John N. Crowley1 ,
Jos Lelieveld1,3 , and Jonathan Williams1,3
1 Atmospheric  Chemistry Department, Max Planck Institute for Chemistry, Mainz, Germany
2 Department Biogeochemical Processes, Max Planck Institute for Biogeochemistry, Jena, Germany
3 Energy, Environment and Water Research Center, The Cyprus Institute, Nicosia, Cyprus

Correspondence: Achim Edtbauer (a.edtbauer@mpic.de)

Received: 5 November 2019 – Discussion started: 3 January 2020
Revised: 23 April 2020 – Accepted: 25 April 2020 – Published: 25 May 2020

Abstract. We present the first ambient measurements of            1   Introduction
a new marine emission methane sulfonamide (MSAM:
CH5 NO2 S), along with dimethyl sulfide (DMS) and                 The ocean plays an important role in the atmospheric chem-
dimethyl sulfone (DMSO2 ) over the Arabian Sea. Two ship-         istry of many trace gases and profoundly influences the
borne transects (W → E, E → W) were made during the               global sulfur and nitrogen cycles (Brimblecombe, 2014;
AQABA (Air Quality and Climate Change in the Arabian              Sievert et al., 2007; Bentley and Chasteen, 2004; Fowler
Basin) measurement campaign. Molar mixing ratios in pico-         et al., 2013, 2015). Dimethyl sulfide (DMS) emitted from
mole of species per mole of air (throughout this paper ab-        the ocean accounts for roughly half of the natural global
breviated as ppt) of DMS were in the range of 300–500 ppt         atmospheric sulfate burden. The global DMS flux to
during the first traverse of the Arabian Sea (first leg) and      the atmosphere was recently estimated to be 28.1 (17.6–
100–300 ppt on the second leg. On the first leg DMSO2 was         34.4) Tg S yr−1 , equivalent to 50 % of the anthropogenic sul-
always below 40 ppt and MSAM was close to the limit of de-        fur inputs (Webb et al., 2019). Nitrogen is often a limiting
tection. During the second leg DMSO2 was between 40 and           nutrient for phytoplankton growth in the ocean (Voss et al.,
120 ppt and MSAM was mostly in the range of 20–50 ppt             2013). Nonetheless, ocean emissions of organic nitrogen do
with maximum values of 60 ppt. An analysis of HYSPLIT             occur in the form of amines (R-NH2 ) (Ge et al., 2011; Gibb
back trajectories combined with calculations of the exposure      et al., 1999) and in inorganic forms such as nitrous oxide
of these trajectories to underlying chlorophyll in the surface    (N2 O) (Arévalo-Martínez et al., 2019) and ammonia (Gibb
water revealed that most MSAM originates from the Soma-           et al., 1999; Johnson et al., 2008; Paulot et al., 2015), partic-
lia upwelling region, known for its high biological activity.     ularly in upwelling regions (Carpenter et al., 2012).
MSAM emissions can be as high as one-third of DMS emis-              Upwelling regions of the ocean are those where nutrient-
sions over the upwelling region. This new marine emission is      rich waters from depths of 100 to 300 m are brought to the
of particular interest as it contains both sulfur and nitrogen,   surface (Voss et al., 2013; Kämpf and Chapman, 2016). Up-
making it potentially relevant to marine nutrient cycling and     welling leads to nutrient-richer zones in the surface ocean
marine atmospheric particle formation.                            and therefore to regions of high phytoplankton activity, re-
                                                                  sulting in strong carbon dioxide uptake and the release of var-
                                                                  ious volatile organic compounds including sulfur-, halogen-
                                                                  , and alkene-containing trace gases (Arnold et al., 2010;
                                                                  Colomb et al., 2008; Bonsang et al., 2010; Lai et al., 2011;
                                                                  Yassaa et al., 2008). In the Arabian Sea, the location of this

Published by Copernicus Publications on behalf of the European Geosciences Union.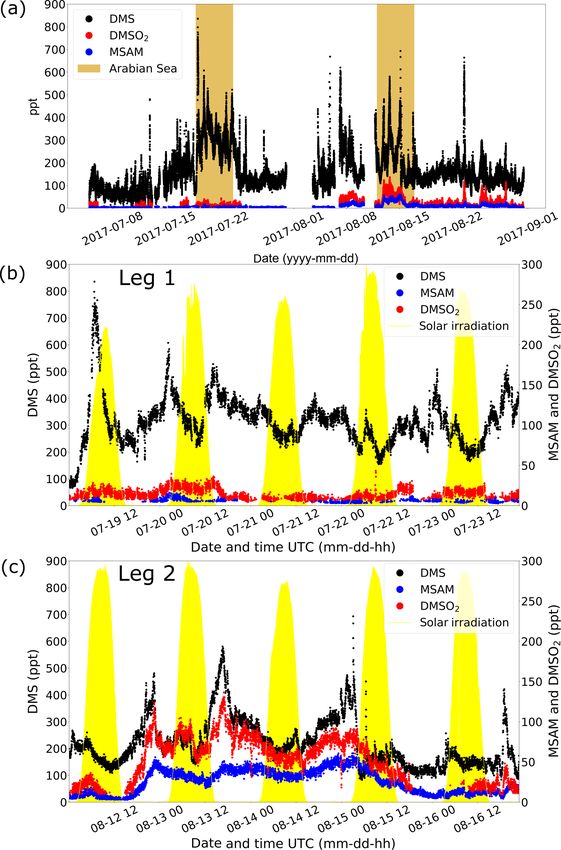
6082                                                                      A. Edtbauer et al.: A new marine biogenic emission

study, the Somalian coastal upwelling is a major feature. It        there were a weather station and four laboratory containers
is considered the fifth-largest upwelling system in the world       equipped with instrumentation for on- and offline measure-
(deCastro et al., 2016; Ajith Joseph et al., 2019).                 ment of a large suite of trace gases, particles, and radicals
    Here we present trace gas measurements taken on a ship-         (Bourtsoukidis et al., 2019; Bourtsoukidis et al., 2020; Wang
borne circumnavigation of the Arabian Peninsula. Relatively         et al., 2020).
few measurements have been made in this region due to po-
litical tensions and piracy. Transects of the Arabian Sea (the      2.2   Sampling
most southerly section of the route) showed high levels of
sulfur-containing gases. These include DMS, dimethyl sul-           A 10 m high (above sea level) high-volume flow inlet (HUFI)
fone (DMSO2 ), and methane sulfonamide (MSAM), a new                (diameter 15 cm) was used to draw ambient air down to the
marine emission that unusually contains both sulfur and ni-         containers at a flow rate of 10 m3 min−1 . The HUFI was sit-
trogen atoms.                                                       uated between the four containers on the foredeck so that
    DMS is known to stem from biochemical reactions within          when the ship headed into the wind, no interference from
phytoplankton that produce its precursor dimethylsulfonio-          the vessel’s smokestack or indoor ventilation was measured.
propionate (DMSP) (Kiene et al., 2000). Although only a             From the center of the HUFI, air was drawn continuously at
small fraction of the DMS produced within the ocean is re-          a rate of ca. 5 slpm (standard liter per minute) (first leg) or
leased into the atmosphere (Vila-Costa et al., 2006), it is still   3 slpm (second leg) into an air-conditioned laboratory con-
the most abundant form of oceanic sulfur emission (Kloster          tainer via an insulated FEP (fluorinated ethylene propylene)
et al., 2006; Quinn and Bates, 2011; Lana et al., 2011; Liss        tube (1/200 = 1.27 cm o.d., length ca. 10 m). The tube was
et al., 2014).                                                      heated to 50–60 ◦ C to avoid condensation inside the air-
    The oxidation mechanism of DMS in the atmosphere                conditioned container. To prevent sampling of sea spray and
is complex and still not fully understood (Mardyukov and            particles, a routinely changed PTFE (polytetrafluorethylene)
Schreiner, 2018; Barnes et al., 2006; Ayers and Gillett, 2000;      filter was installed in the inlet line before it entered the con-
Chen et al., 2018). DMSO2 , the second sulfur-containing            tainer. This inlet system was employed for the measurements
species measured in this study, is a product of DMS oxida-          of VOCs and total OH reactivity (Pfannerstill et al., 2019)
tion by the OH radical (Arsene et al., 2001; Barnes et al.,         simultaneously. The inlet residence time for the VOC mea-
2006). It can be formed directly from DMS, via the inter-           surements was determined by a spiking test with acetone, and
mediate dimethyl sulfoxide (DMSO) and from the oxidation            it was 12 s during the first leg and 26 s during the second leg.
of DMSO with BrO and NO3 (Barnes et al., 2006). Even
though the oxidation of DMS in the atmosphere is still not          2.3   Volatile organic compound (VOC) measurements
fully understood, reaction with the hydroxyl radical (OH) is
considered the dominant loss pathway (Khan et al., 2016).           Online VOC measurements were performed using a pro-
    Significantly DMS oxidation ultimately yields sulfates          ton transfer reaction time-of-flight mass spectrometer (PTR-
which may act as cloud condensation nuclei (see Fig. 1). In         ToF-MS 8000; manufacturer: Ionicon Analytik GmbH, Inns-
the case of MSAM, there are no previously reported mea-             bruck, Austria). Detailed descriptions of the instrument can
surements of this species. The MSAM data are assessed               be found in Jordan et al. (2009), Graus et al. (2010), and
here through comparison with the better-known DMS and               Veres et al. (2013). Drift pressure was maintained at 2.2 mbar
DMSO2 species and with respect to air mass back trajecto-           and the drift voltage at 600 V (E/N 137 Td). For mass scale
ries and chlorophyll exposure, in particular in relation to the     calibrations, 1,3,5-trichlorobenzene was continuously fed
upwelling region. In summary, we examine the provenance,            into the sample stream. The PTR-ToF-MS was calibrated at
distribution and fate of DMS, DMSO2 , and the new marine            the beginning, during, and at the end of the campaign (in to-
emission MSAM in the region of the Arabian Sea.                     tal five humidity dependent calibrations were conducted as
                                                                    described by Derstroff et al., 2017). Calibrations were per-
                                                                    formed by using a standard gas mixture (Apel-Riemer En-
2     Materials and methods                                         vironmental inc., Broomfield, USA) of several VOCs with
                                                                    gravimetrically determined mixing ratios. The VOCs in-
2.1    AQABA campaign                                               cluded in the calibration gas were methanol, acetonitrile, ac-
                                                                    etaldehyde, acetone, dimethyl sulfide, isoprene, methyl vinyl
From 25 June to 3 September 2017, the Air Quality and Cli-          ketone, methacrolein, methyl ethyl ketone, benzene, toluene,
mate Change in the Arabian Basin (AQABA) cruise took                o-xylene, 1,3,5-trimethylbenzene, and α-pinene. Clean syn-
place on the research vessel Kommandor Iona. The first leg          thetic air was measured every 3 h for 10 min to determine the
of the cruise started from La-Seyne-sur-mer near Toulon             instrument background. Synthetic air was supplied to the in-
(France) and headed through the Suez Canal and around               strument only and not the whole inlet. The time resolution of
the Arabian Peninsula and ended in Kuwait. The second leg           the measurement was 1 min and the mass range extended to
took the same route back (see Fig. 2). Onboard the ship             450 amu. Mass resolution (full width half maximum) at mass

Atmos. Chem. Phys., 20, 6081–6094, 2020                                               https://doi.org/10.5194/acp-20-6081-2020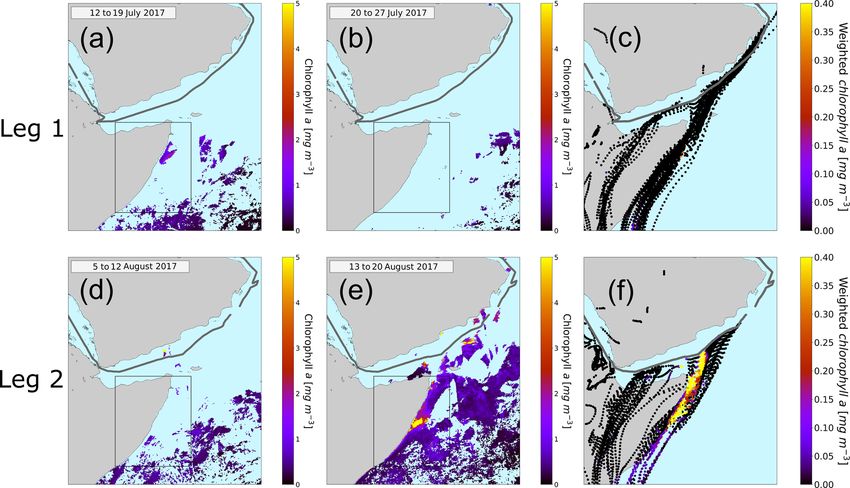
A. Edtbauer et al.: A new marine biogenic emission                                                                                   6083

Figure 1. DMS oxidation scheme focusing on the trace gases discussed (Barnes et al., 2006). DMSP production within phytoplankton yields
DMS in the surface water where it can be oxidize directly to DMSO. A small fraction of DMS is emitted to the atmosphere. Where it is
predominantly oxidized by the OH radical yielding methane sulfonic acid (MSA) and sulfates. Additionally we sketched a possible formation
pathway for DMSO2 . We suggest that MSAM could be formed in the water as a result of microbial activity, and parts of it are then emitted
to the atmosphere. The bottom part of the figure illustrates the principle of the Somalia upwelling. Wind blowing along the coast displaces
surface water and leads to the upwelling of cold nutrient-rich water, which can support a phytoplankton bloom (Kämpf and Chapman, 2016).

                                                                          96 amu was ca. 3500 during the first leg and > 4500 during
                                                                          the second leg.
                                                                             The total uncertainty of the DMS measurement was <
                                                                          30 % (main sources of uncertainty: standard gas mixture
                                                                          5 %, flow meter 1 %, calibration ≈ 10 %) and the precision
                                                                          < 5 %. DMSO2 and MSAM were not present in the calibra-
                                                                          tion gas. Calculation of the mixing ratio was therefore con-
                                                                          ducted based on the rate coefficients for proton transfer (Su
                                                                          and Chesnavich, 1982; Chesnavich et al., 1980), the knowl-
                                                                          edge of transmission factors, the amount of H3 O+ ions, and
                                                                          the parameters of the drift region (Lindinger et al., 1998).
                                                                          Applying this method results in a greater uncertainty than
                                                                          for compounds included in the calibration gas mixture of ap-
                                                                          proximately 50 %. The limit of detection (LOD: 3× stan-
                                                                          dard deviation of background) was 20 ppt for DMS, 25 ppt
                                                                          for DMSO2 , and 5 ppt for MSAM.
Figure 2. Ship track of AQABA cruise. Beginning in July 2017,
the campaign started in the south of France near Toulon; the ship
                                                                          2.4   Discussion of inlet effects
arrived in Kuwait at the end of July, started its return back to France
at the beginning of August, and was back at its starting point at the
beginning of September 2017. On the way to Kuwait it entered the          Semi-volatile and especially low-volatile compounds parti-
Arabian Sea on 19 July and left it on 24 July. On the way back            tion reversibly from the gas phase to the walls in Teflon tub-
it entered the Arabian Sea on 11 August and left it on 15 August.         ing (Pagonis et al., 2017; Liu et al., 2019; Deming et al.,
Credit: NASA Earth Observatory.                                           2019). Teflon tubing acts approximately as a chromatog-
                                                                          raphy column for these compounds (Pagonis et al., 2017).
                                                                          This leads to a smearing of the time profile of these com-

https://doi.org/10.5194/acp-20-6081-2020                                                  Atmos. Chem. Phys., 20, 6081–6094, 2020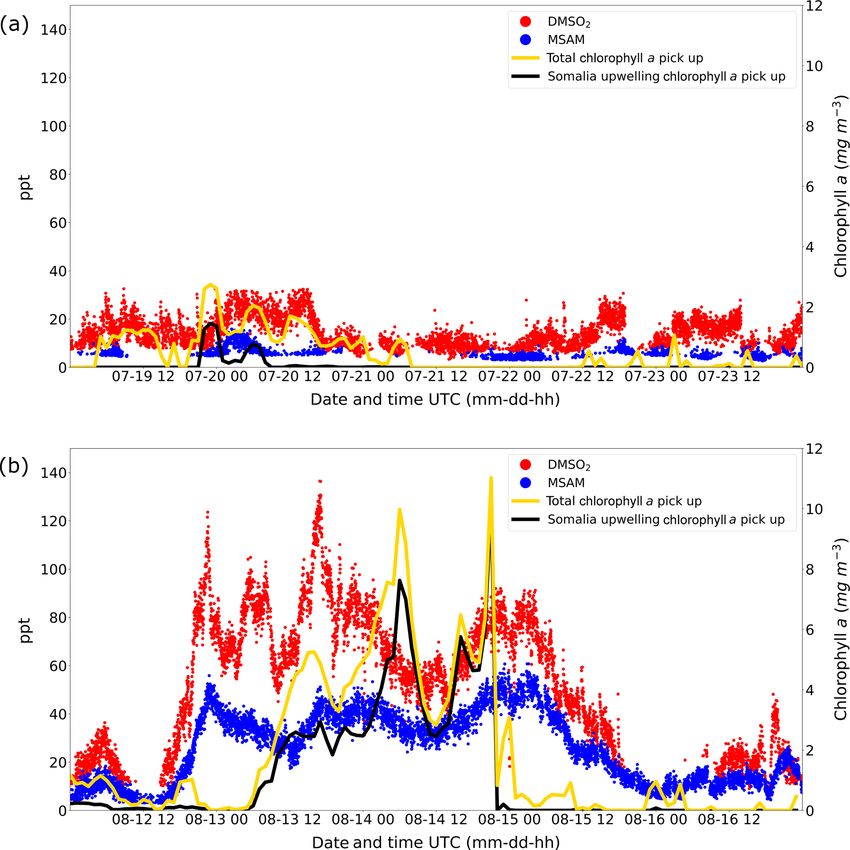
6084 A. Edtbauer et al.: A new marine biogenic emission
pounds, which affects the measured concentrations (Deming
et al., 2019). To evaluate this effect we measured a step con-
centration change from a stable MSAM concentration to a
zero MSAM concentration (at same humidity and flow). This
resulting decay does not necessarily follow a single expo-
nential decay (Liu et al., 2019). In our case we found the
best fit was obtained with a triple exponential decay. The
e-folding times (time it takes for the signal to decrease by
the factor 1/e) were from minutes to hours (for more de-
tails, see Sect. S5). This leads to considerable smoothing of
the MSAM signal for concentration changes on timescales of
minutes up to hours.
The partitioning of MSAM to the inside wall of the Teflon
tubing raises the question of whether the observed MSAM
could be generated there on surfaces. No inlet test was done
during the campaign to address this issue since this discovery
was a surprise. We do not know of a pathway to production
in the inlet (see Sect. S6 for a discussion), but it remains a
possibility that cannot yet be ruled out.
2.5 HYSPLIT back trajectories
Air mass back trajectories were calculated to investigate
the origin of air masses encountered. The Hybrid Single-
Particle Lagrangian Integrated Trajectory model (HYSPLIT,
version 4, 2014), a hybrid between a Lagrangian and an
Eulerian model for tracing small imaginary air parcels for-
ward or back in time (Draxler and Hess, 1998), was used
to derive 3-D back trajectories from a starting height of
200 m a.s.l. (above sea level), going 216 h back in time on
an hourly grid beginning at the ship’s position.
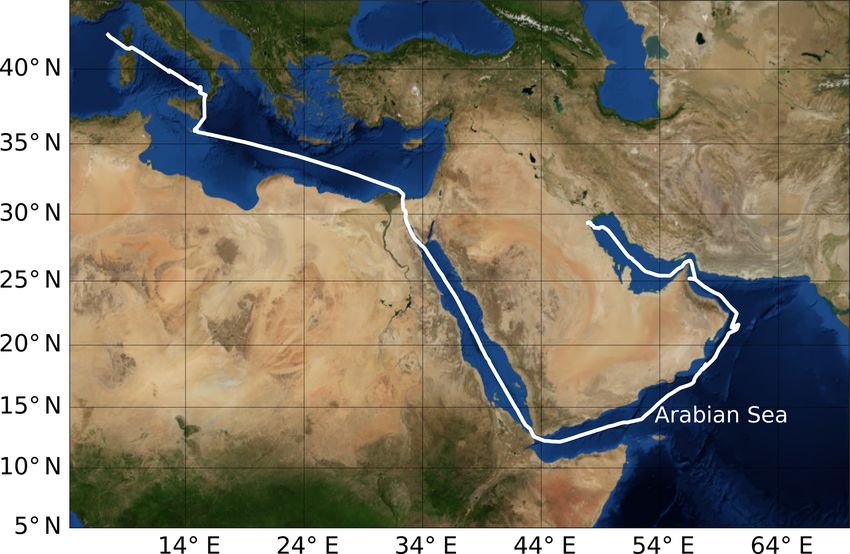
Figure 3. In (a) the mixing ratios of for DMS, DMSO2 , and MSAM
during the whole AQABA cruise are displayed. The Arabian Sea
3 Results parts of legs 1 and 2 are marked in brown. A zoom-in on measure-
ments over the Arabian Sea is given for leg 1 in (b) and for leg 2
This study focuses on the two crossings of the Arabian Sea in (c). The yellow filled curves in (b) and (c) show the solar irradi-
during the AQABA campaign. The Arabian Sea was gener- ation in arbitrary units.
ally characterized by low values of VOCs, especially VOCs
related to anthropogenic activities (Bourtsoukidis et al.,
2019; Bourtsoukidis et al., 2020; Pfannerstill et al., 2019; leg (Fig. 3c), the DMS mixing ratios over the Arabian Sea
Wang et al., 2020). The three molecules presented in this were significantly lower, in the range of 100–300 ppt, again
study are the exception. They were higher in the Arabian Sea with elevated peaks of short duration (around 2 h).
region than in the other regions. So the absence or very low
concentrations of the other molecules plus the high values 3.2 Dimethyl sulfone (DMSO2 )
(compared to other regions) of DMS, DMSO2 , and MSAM
characterize this part of the cruise as mostly influenced by DMSO2 was measured by the PTR-ToF-MS at m/z 95.0161.
clean marine air. Within the range of uncertainty for that mass, we did not find
another plausible molecular structure. Additionally, the head
3.1 Dimethyl sulfide (DMS) space of the pure compound (TCI Deutschland GmbH, pu-
rity > 99 %) was sampled yielding a peak at the same posi-
Measurements of DMS (m/z 63.0263) during AQABA tion as found in ambient air. Measurements of DMSO2 in
showed elevated mixing ratios when the vessel traversed the Arabian Sea region showed elevated levels between 40
the Arabian Sea during both legs (brown shaded region in and 120 ppt during the second leg (Fig. 3c) but more mod-
Fig. 3a). During the first leg over the Arabian Sea (Fig. 3b), est levels (< 40 ppt) on leg 1 (Fig. 3b). To our knowledge,
DMS mixing ratios were generally in the range of 300– there have been no measurements of DMSO2 performed in
500 ppt, with occasional peaks of 800 ppt. During the second this region previously.
Atmos. Chem. Phys., 20, 6081–6094, 2020 https://doi.org/10.5194/acp-20-6081-2020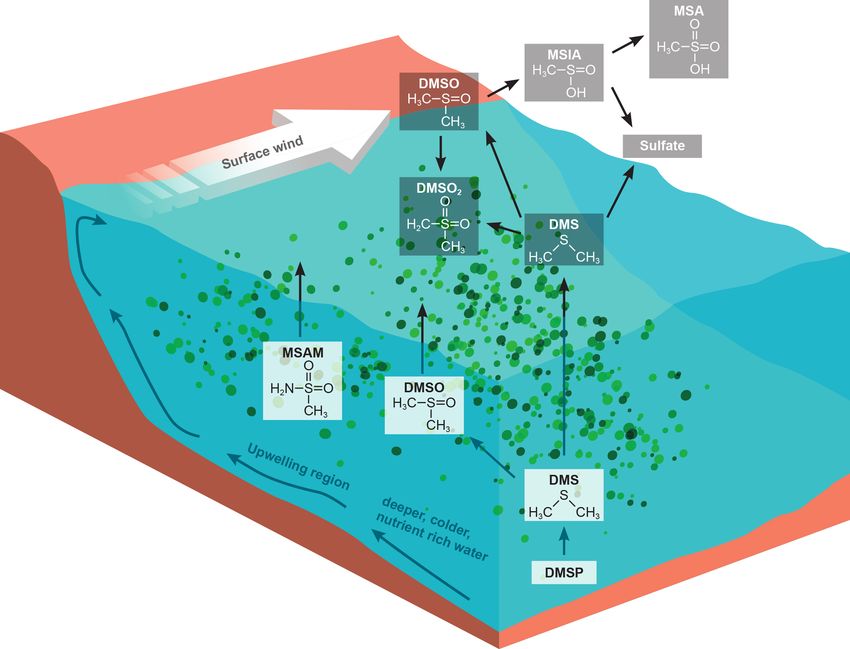
A. Edtbauer et al.: A new marine biogenic emission                                                                               6085

3.3    New atmospheric trace gas: MSAM

At m/z 96.0144, a signal was observed which displayed a
strong correlation with DMSO2 (Pearson correlation coeffi-
cient: r around 0.8) over the Arabian Sea during the second
leg (see Fig. 4). This mass corresponded to MSAM, which
has a similar structure to DMSO2 , with an amine group sub-
stituted for a methyl group (see Fig. 1 for the chemical struc-
tures of the molecules). This molecule has not previously
been measured in ambient air. To confirm the assignment of
mass m/z 96.0144 to MSAM, the head space of the pure
substance MSAM (Alfa Aesar, purity > 98 %) was sampled
by the PTR-ToF-MS. The analysis of the pure compound
MSAM by PTR-ToF-MS matched the mass found in am-
bient air. No other plausible molecular structures could be
found for this mass within the uncertainty for that mass.         Figure 4. Correlation of MSAM with DMSO2 during the second
Based on the correlation of mass m/z 96.0144 to DMSO2             leg in the Arabian Sea. Displayed in red the is the linear regression
in ambient data, the mass spectral match to the pure com-         ([MSAM] = 0.393·[DMSO2 ]+8.245 ppt). The Pearson correlation
pound, and the absence of alternative structures at that exact    coefficient is 0.8.
mass, we identify the measured signal as MSAM. In order
to test whether MSAM can be observed outgassing from sea-
                                                                  matology of DMS surface water concentrations has been de-
water, we flushed the headspace of solutions of 4.2, 0.05, and
                                                                  rived by Lana et al. (2011) from over 47 000 seawater mea-
0.0005 mol L−1 MSAM in artificial seawater with 100,
                                                                  surements worldwide. Lana et al. (2011) predict strong fluxes
50, and 25 mL min−1 of synthetic air (Air Liquide, Krefeld,
                                                                  of DMS in the Arabian Sea region, particularly in June, July,
Germany) each. The resulting mixing ratios measured ranged
                                                                  and August, coincident with the AQABA campaign. Seawa-
from 650 ppt (lowest concentration and lowest flow rate) to
                                                                  ter concentration data for DMS from the Lana climatology
130 000 ppt (highest concentration and highest flow rate). Up
                                                                  relevant for AQABA has been plotted in Fig. 5 for July and
to a certain flow value the increase in dilution due to an in-
                                                                  August. In the regions south of the Arabian Peninsula, higher
crease in flow is overcompensated for through an enhanced
                                                                  concentrations of DMS in seawater are expected in July than
emission of the substance from the seawater. Therefore we
                                                                  in August. Therefore the measured higher mixing ratios of
measured the highest MSAM mixing ratios at the highest
                                                                  DMS in July than August support the results of the climatol-
flow rate. During the Arabian Sea section of the second leg,
                                                                  ogy for this region.
values of up to 60 ppt were measured, but mostly it was found
                                                                     The highest DMS mixing ratios occurred during the first
to be in the range of 20–50 ppt. On the first leg, MSAM was
                                                                  leg over the Gulf of Aden with around 800 ppt. The peak val-
occasionally detected in the Arabian Sea, but concentrations
                                                                  ues are likely related to the ship crossing directly through
were generally close to the LOD.
                                                                  patches of phytoplankton as evidenced by the observation of
                                                                  strong bioluminescence around the ship during the night. The
4     Discussion                                                  DMS mixing ratio values of up to 300 ppt during the sec-
                                                                  ond leg can be compared to measurements made previously
Here we discuss DMS, DMSO2 , and MSAM measurements                in that region. DMS values of up to 250 ppt associated with
in air from a rarely sampled region, the Arabian Sea. First we    upwelling in the Gulf of Aden were reported during a ship
discuss the difference in DMS abundance between the two           cruise in April 2000 (Warneke and de Gouw, 2001). More
legs. Secondly we evaluate the source regions of these trace      recent measurements during a ship cruise in July and Au-
gases based on knowledge of their atmospheric lifetimes and       gust 2018 in the western tropical Indian Ocean reported val-
chlorophyll exposure. Then, finally, we address the implica-      ues of up to 300 ppt DMS (Zavarsky et al., 2018). The DMS
tions of these measurements to marine boundary layer chem-        measurements presented here are therefore consistent with
istry.                                                            the very limited previous measurements in this region.

4.1    DMS                                                        4.2   Atmospheric lifetimes of DMS, DMSO2 , and
                                                                        MSAM
We observed higher values of DMS in July (leg 1) than in Au-
gust (leg 2) over the Arabian Sea (see Sect. 3.1). This finding   The lifetime of DMS in the atmosphere with respect to the
is consistent with DMS flux predictions by Lana et al. (2011)     primary oxidant OH is around 1.3 d (bimolecular rate con-
for this region. Sea surface DMS concentrations can be used       stant = 7.8 × 10⁻¹² cm3 molec.−1 s−1 (Albu et al., 2006)).
to estimate DMS fluxes to the atmosphere, and a global cli-       For all lifetimes with respect to OH we use the global

https://doi.org/10.5194/acp-20-6081-2020                                            Atmos. Chem. Phys., 20, 6081–6094, 2020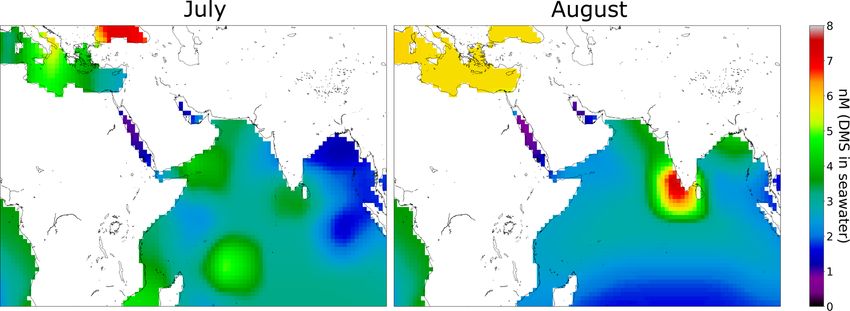
6086                                                                            A. Edtbauer et al.: A new marine biogenic emission

Figure 5. Climatology for DMS surface water concentrations in July and August (Lana et al., 2011). Over 47 000 DMS seawater measure-
ments were used together with interpolation or extrapolation techniques in order to obtain a monthly DMS surface water concentration of the
whole earth. In the regions south of the Arabian Peninsula the climatology estimates higher values in July than in August.

average concentration [OH] = 1.1 × 10⁶ molec. cm−3 (Prinn               trajectories). A common oceanic source and the similar life-
et al., 2005). In some regions of the marine boundary layer,            times of DMSO2 and MSAM help explain the observed good
BrO may also contribute to the oxidation of DMS leading                 correlation of MSAM with DMSO2 (see Fig. 4).
to shorter DMS lifetimes (Breider et al., 2010; Khan et al.,
2016; Barnes et al., 2006).                                             4.3     Chlorophyll exposure of HYSPLIT back
   The reaction rate of OH and DMSO2 is < 3 ×                                   trajectories
10−13 cm3 molec.−1 s−1 , which leads to a tropospheric life-
time of more than 35 d ([OH] = 1.1 × 10⁶ molec. cm−3 )                  MSAM and DMSO2 were close to the LOD during the first
(Falbe-Hansen et al., 2000), over 20 times longer than DMS.             leg, despite the fact that DMS mixing ratios were even higher
A recent study, Berasategui et al. (2020), measured a rate              than during the second leg. This observation excludes a sim-
constant of 1.4 ± (0.2) × 10−13 cm3 molec.−1 s−1 for the re-            ple relationship between the emissions of DMS and DMSO2
action of OH with MSAM, which results in a tropospheric                 or MSAM. DMSO2 is known to be an oxidation product
lifetime of 75 d ([OH] = 1.1 × 10⁶ molec. cm−3 ). As MSAM               of DMS and is therefore linked to marine biogenic activity
has a long lifetime with respect to reaction with OH, we                (Barnes et al., 2006). We hypothesize that the newly detected
must also consider its physical removal by deposition to the            trace gas MSAM is also linked to marine biogenic activ-
ocean surface. We therefore carried out experiments to de-              ity. This is based on the observation that MSAM displays
termine the Henry’s law constant for MSAM (for details,                 the highest values when influenced mainly by remote marine
see Sect. S2) and found it to be in the range of 3.3 × 10⁴ –            air without recent contact with land; it correlates well with
6.5×10⁵ M atm−1 . DMSO2 has a similarly large Henry’s law               DMSO2 (see Fig. 4) and is similar in chemical structure to
constant > 5 × 10⁴ M atm−1 (de Bruyn et al., 1994). A two-              DMS and DMSO2 . A good indicator of marine biogenic ac-
layer model can predict the exchange flux between the gas               tivity is phytoplankton. Phytoplankton in the water can be
and aqueous phase to derive an estimate of the effective life-          detected from space via the chlorophyll a pigment used for
times (Liss and Slater, 1974; Schwartz, 1992; Yang et al.,              photosynthesis. Satellite images of regional chlorophyll can
2014). For substances with a high Henry’s law constant, like            be exploited to investigate emission areas of marine biogenic
MSAM and DMSO2 , knowledge of the wind speed and the                    VOCs. In the following sections, and with the help of HYS-
marine boundary layer height is sufficient to get a predic-             PLIT back trajectories and chlorophyll a water content we
tion of the deposition lifetime (for details, see Sect. S1 in           will investigate where the source of MSAM and DMSO2 is
the Supplement). This gives a lifetime of 30.5 ± 23.5 h (ma-            located.
rine boundary layer height: 750±250 m and wind speeds 4 to              4.3.1    Chlorophyll a water content
14 m s−1 ). The lifetimes for MSAM and DMSO2 are there-
fore controlled by the deposition rate to the ocean surface             We used data from the satellite MODIS-Aqua (Jackson et al.,
and not by OH oxidation. This means that DMS, DMSO2 ,                   2019). In Fig. 6a, b and d, e the chlorophyll a concentration
and MSAM have similar lifetimes. During 12 and 13 Au-                   averaged over 8 d is plotted for the time periods relevant for
gust, most of the time air masses from the Somalia upwelling            our measurements. During the first leg (Fig. 6a and b) the
traveled for 10 h up to a day before reaching the ship. On              ship entered the Arabian Sea region on 19 July and left it
14 and 15 August, air masses from the Somalia upwelling                 around 23 July 2017. Figure 6a displays the average chloro-
were around 4 h old (determined from the HYSPLIT back                   phyll distribution from 12 to 19 July, since air masses reach-

Atmos. Chem. Phys., 20, 6081–6094, 2020                                                    https://doi.org/10.5194/acp-20-6081-2020
A. Edtbauer et al.: A new marine biogenic emission                                                                                     6087

Figure 6. Eight-day averaged chlorophyll a concentration in the Arabian Sea. The relevant time periods for the first leg (a, b) and for the
second leg (d, e) are pictured here. Panel (a) represents the average chlorophyll a concentration from 12 to 19 July, (b) from 20 to 27 July,
(d) from 5 to 12 August, and (e) from 13 to 20 August. The black rectangle represents the region of the Somalia coast upwelling. The ship
track is plotted in gray. The light blue means no chlorophyll a content. Panels (c) and (f) display the HYSPLIT back trajectories. The color
code of the trajectories represents the weighted amount of chlorophyll a concentration in the water underneath the trajectory.

ing the ship from 19 July onwards will have traveled over                jectory was within the marine boundary layer, as calculated
chlorophyll a regions before the time of observation. For the            from the HYSPLIT model, were considered. Changing the
second leg (Fig. 6d and e) (12 to the 16 August 2017) we                 weighting did not materially affect the results. For details on
used the average chlorophyll a content from 5 to 12 August               the weighting procedure, see Sect. S3.
and from 13 to 20 August. The highest chlorophyll concen-                   The results of these calculations are displayed in Fig. 7.
trations in the region are found off the Horn of Africa or So-           The graphs show the total chlorophyll exposure and the expo-
malia coast, a strong upwelling region.                                  sure of chlorophyll specifically from the region of the Soma-
                                                                         lia upwelling (see Fig. 6, the region in the black rectangle).
4.3.2   Back-trajectory chlorophyll analysis                             On the first leg (Fig. 7a), when both DMSO2 and MSAM
                                                                         mixing ratios were low, air reaching the ship did not cross
A trajectory analysis was carried out to investigate whether             chlorophyll-a-rich waters in the previous 1 to 2 d. This is
air masses traveling over regions of high chlorophyll are                the case for the total exposure as well as for the exposure
associated with higher atmospheric levels of DMSO2 and                   to chlorophyll in the Somalia upwelling region.
MSAM. To investigate the provenance of air masses sampled                   However, during the second leg (Fig. 7b), when DMSO2
at the ship in relation to the chlorophyll distributions shown           and MSAM levels were high, the air measured had traveled
above, HYSPLIT back trajectories were calculated (9 d back)              over extensive chlorophyll-a-rich waters. In general, the ex-
for every full hour of the cruise. For each point of the trajec-         posure in the Somalia upwelling region always constituted
tory the underlying chlorophyll a content was weighted with              the majority of the total exposure, except for one peak in
respect to the arrival time at the ship to account for oxida-            the beginning (13 August from 12:00 to 19:00 UTC) where
tion and dispersion effects (see Fig. 6c and f). These values            chlorophyll patches closer to the ship constituted roughly
were then added up for each trajectory individually in order             half of the total chlorophyll exposure. From these calcula-
to determine quantitatively to what extent the air sampled had           tions we can conclude that the occurrence of DMSO2 and
passed over areas of high chlorophyll content (indicator for             MSAM is related to marine emissions in the Somalia up-
phytoplankton in the water). Only time points when the tra-

https://doi.org/10.5194/acp-20-6081-2020                                                   Atmos. Chem. Phys., 20, 6081–6094, 2020
6088 A. Edtbauer et al.: A new marine biogenic emission
Figure 7. Weighted amount of chlorophyll a trajectories crossed over before arrival at the ship for leg 1 (a) and leg 2 (b). The total chloro-
phyll a exposure (yellow line) and the chlorophyll a exposure originating from the Somalia upwelling region (black line) are plotted. The
corresponding y axis for the chlorophyll a exposure for both graphs (a, b) is displayed on the right side. Mixing ratios in ppt for DMSO2
and MSAM are plotted in red and blue with the corresponding y axis on the left side.
welling region. MSAM and DMSO2 mixing ratios started tories. This is not unexpected as meteorological data for this
to increase around 12:00 UTC of 12 August but the chloro- region are sparse and the trajectories therefore correspond-
phyll exposure only started to increase around 06:00 UTC ingly uncertain.
on 13 August (Fig. 7b). A possible explanation for the de-
lay in chlorophyll exposure could be that the bloom already 4.4 DMSO2 , DMSO, MSIA, and MSA
started on 12 August and not just on 13 August as indicated in
Fig. 6d and e. Possibly the earlier start of the bloom escaped In the following we will discuss briefly why we did not de-
detection by MODIS-Aqua as it sees every point on earth ev- tect DMSO, methane sulfinic acid (MSIA), and methane sul-
ery 1–2 d. Around the Equator some regions escape detection fonic acid (MSA). These are important oxidation products
on any given day. An inspection of daily data from MODIS- from DMS.
Aqua revealed that parts of the Somalia upwelling were in DMSO is known to be an important intermediate in the
a blind spot of the satellite on 12 August. The chlorophyll oxidation of DMS with OH (Hoffmann et al., 2016). The re-
exposure fell sharply to zero at the beginning of 15 August, action rate of DMSO with OH is 15 times faster than that
roughly 8 h before DMSO2 and MSAM values start to de- of DMS with OH, making it a potentially important sink in
cline as well (Fig. 7b). In this case the calculated HYSPLIT the remote marine atmosphere (Barnes et al., 2006). A model
back trajectories no longer pass over the Somalia upwelling study of the sulfur cycle in the global marine atmosphere sug-
but cross Somalia before arriving at the ship. Our measure- gested values of around 10 ppt for DMSO in the region of the
ments thus indicate that we were impacted by the Somalian Arabian Sea (Chen et al., 2018). This is below the limit of
upwelling region for longer than calculated from the trajec- detection (LOD) of around 15 ppt for DMSO in our instru-
ment and probably the reason why we do not observe it in
Atmos. Chem. Phys., 20, 6081–6094, 2020 https://doi.org/10.5194/acp-20-6081-2020A. Edtbauer et al.: A new marine biogenic emission 6089
this dataset. Measurements of DMSO made on Amsterdam DMSO is known to only yield DMSO2 (Falbe-Hansen et al.,
Island ranged from 0.36 to 11.6 ppt (Sciare et al., 2000). 2000). However, NO3 oxidation is not thought to produce
MSIA has a very high reaction rate of 9 × DMSO (Barnes et al., 2006). Maybe the increase in DMSO2
10−11 cm3 molec.−1 s−1 with OH radicals (Burkholder after sunset (see Fig. 3c) is an indication that NO3 is oxidiz-
et al., 2015; Kukui et al., 2003; Hoffmann et al., 2016). In ing the remaining DMSO from the OH oxidation of DMS
the model study mentioned above, this leads to concen- produced during the daytime.
trations over the Arabian Sea of around 2 ppt which again With the data presented here it is not possible to decide
is below the LOD for MSIA with our instrument (around if one or some of the abovementioned mechanisms are re-
20 ppt) (Chen et al., 2018). sponsible for the observed DMSO2 values. A diel analysis of
MSA, on the other hand, is predicted to be around 20– DMS, MSAM, and DMSO2 was made. But due to the fact
40 ppt over the Arabian Sea (gas phase and aqueous phase that we only have 2 consecutive days with elevated DMSO2
combined), which is above its LOD, but almost all of it will on a moving platform, the results must be viewed with cau-
be in the aqueous phase (Chen et al., 2018; Hoffmann et al., tion since variation may come from source or removal pro-
2016). In the gas phase, the maximum MSA values reported cess variation. Nevertheless, for completeness, the plots and
to date are below 1 ppt, which is far too low to be mea- description of this diel variability are found in Sect. S4.
sured with our setup (LOD around 15 ppt) (Eisele and Tan-
ner, 1993; Chen et al., 2016; Berresheim, 2002). 4.5 MSAM
We observed DMSO2 mixing ratios during the second leg
between 40 and 120 ppt, which is high compared to previous We are not aware of a possible formation pathway for MSAM
measurements of 0.2–11 ppt (Berresheim et al., 1998; Davis in the gas phase. Therefore, we consider it rather unlikely
et al., 1998) made in Antarctica. In the following we will that it is formed via DMS gas phase oxidation. A microbial
briefly describe and discuss formation pathways for DMSO2 . formation from DMS or DMS products in the water of the
This will be done for formation via OH, BrO, and NO3 . highly biological active upwelling region with subsequent
emission into the atmosphere seems plausible (see Fig. 1).
4.4.1 OH To our knowledge there have been no reports of MSAM
occurring or being produced in biological systems. MSAM
DMSO2 formation from OH oxidation, via the intermedi- belongs to the class of sulfonamides which is known for its
ate DMSO, has been observed in laboratory studies (Falbe- antibacterial properties, and it has therefore been used in an-
Hansen et al., 2000). However, it has to be noted that newer tibacterial drugs (Sköld, 2010). The only mention of MSAM
studies indicate that mainly MSIA and not DMSO2 is formed in this context was as a metabolite of a drug detected in hu-
(Barnes et al., 2006; Kukui et al., 2003; Hoffmann et al., man urine (Anacardio et al., 2009).
2016). Another pathway is formation from the OH–DMS From the dataset presented in this paper, the ocean is ex-
adduct followed by sequential reactions with NO and O2 (Ar- pected to be a sink for MSAM. This is shown through our
sene et al., 2001; Barnes et al., 2006). Due to the low NOx calculations of the lifetime (a few hours to a few days), which
of the remote marine atmosphere, this pathway seems un- are dominated by deposition. The ocean can only become a
likely as well. There are speculations about a possible for- source of MSAM to the atmosphere if the concentration of
mation from the initially formed OH–DMS adduct by O2 ad- MSAM in surface seawater is so large that emission locally
dition and a subsequent complex process which is not yet dominates over deposition. Our measurements indicate that
fully understood (Berndt and Richters, 2012; Arsene et al., this was the case in the region of the Somalia upwelling. Al-
1999; Turnipseed et al., 1996; Barnes et al., 2006). though no seawater measurements were made in that region
to confirm this, the trajectory data presented here indicate
4.4.2 BrO
that biologically active areas are able to produce sufficiently
BrO can form DMSO2 from DMSO. But these reactions large MSAM concentrations.
seems rather unlikely because of the slow reaction rate com- To our knowledge, no measurements of MSAM have been
pared to the fast reaction rate of OH and DMSO. This re- reported in the atmosphere so far, and thus no information
action, therefore, would only play a role for much higher about the potential role it could play there is available. SO2
concentrations of BrO and not for concentrations of 2 ppt is an oxidation product of MSAM (Berasategui et al., 2020)
for BrO, which have been proposed to be ubiquitous in the and a precursor for sulfuric acid (H2 SO4 ). H2 SO4 is known
marine troposphere (Read et al., 2008; Platt and Hönninger, to be a key contributor to new particle formation (Li et al.,
2003). 2018; Kulmala et al., 2014; Almeida et al., 2013; Sipilä et al.,
2010; Weber et al., 1996, 2001; Chen et al., 2016). How-
4.4.3 NO3 ever, due to the slow reaction of MSAM with OH, the con-
tribution of MSAM to SO2 is negligible (Berasategui et al.,
Most studies show no formation of DMSO2 from NO3 oxida- 2020). Acid–base reactions (e.g., H2 SO4 with ammonia or
tion (Barnes et al., 2006). NO3 oxidation of the intermediate amines) are very important in new particle formation (Chen
https://doi.org/10.5194/acp-20-6081-2020 Atmos. Chem. Phys., 20, 6081–6094, 20206090 A. Edtbauer et al.: A new marine biogenic emission
and Finlayson-Pitts, 2017; Almeida et al., 2013). MSAM is a few hours to a few days. MSAM is a molecule which, to
an acid and therefore could participate in acid–base reac- our knowledge, has never been reported in the atmosphere.
tions, but since MSAM is only a weak acid (pKa = 10.8; We detected it in concentrations up to 60 ppt during the sec-
Junttila and Hormi, 2009) its role as an acid in these reac- ond leg in the Arabian Sea. Emissions of MSAM over the
tions is probably limited. Somalia upwelling can reach close to a third of the DMS
Studies indicate that the dominant driving force in new emissions.
particle formation and growth are the hydrogen bonds A marine emission containing a nitrogen atom is some-
formed between common atmospheric nucleation precursors what surprising since under most circumstances primary pro-
(Xie et al., 2017; Cheng et al., 2017; Li et al., 2018). The ductivity in the ocean is nitrogen limited. The emission of a
newly found trace gas MSAM is very intriguing because nitrogen-containing compound may be related to the abun-
it contains a sulfonamide group, which is a sulfonyl group dance of reactive nitrogen provided by the upwelling. Due to
connected to an amine group. The sulfonyl and the amine its sulfonyl and amine group, MSAM has a high hydrogen-
group both support hydrogen bonding, giving MSAM a high bonding capacity enabling hydrogen bonding to other at-
hydrogen-bonding capacity, potentially enabling nucleation. mospheric nucleation precursors. These hydrogen bonds are
Because of the comparable lifetimes of MSAM and DMS, known to be a critical factor in particle growth and formation
we can estimate the relative emission of MSAM to DMS (Li et al., 2018; Xie et al., 2017; Cheng et al., 2017). There-
from the ratio of the concentrations [MSAM] / [DMS]. We fore MSAM could prove to be of importance for particle for-
only included ratios observed in the afternoons of 14 and mation and/or growth over upwelling regions. The mecha-
15 August, when the ship was in closest proximity to the So- nisms in which gas phase precursors lead to new particle for-
malia upwelling. The afternoon was chosen to make sure that mation are an active research area in atmospheric chemistry
both MSAM and DMS have roughly the same atmospheric because they are subject to large uncertainties (Li et al., 2018;
lifetime when estimating the relative emission. Deposition to Chen et al., 2016, 2018; Carslaw et al., 2013).
the ocean surface will happen all the time for MSAM; how-
ever, OH, the main loss process for DMS, is only present
during the day. We derived ratios ranging from 0.1 to 0.27, Data availability. Data available via https://doi.org/10.17617/3.3o
meaning that emissions of MSAM over the Somalia up- (Edtbauer, 2020).
welling can be almost a third of the DMS emissions. There-
fore, MSAM could play an important role in particle forma-
tion and/or growth over and downwind of upwelling regions. Supplement. The supplement related to this article is available on-
To verify these possibilities, further experiments regarding line at: https://doi.org/10.5194/acp-20-6081-2020-supplement.
particle growth and formation with MSAM need to be per-
formed.
Author contributions. AE and CS were responsible for VOC mea-
surements and data. AE analyzed the data and drafted the article.
EYP contributed laboratory experiments concerning Henry’s law
5 Conclusions constant. MB and JNC contributed to data interpretation. DW calcu-
lated the back trajectories. JL designed and realized the campaign.
During the AQABA campaign we made the first measure- JW supervised the study. All authors contributed to manuscript writ-
ments of MSAM in ambient air. Back-trajectory chloro- ing and revision and read and approved the submitted version.
phyll analyses suggest that it is a marine biogenic emission
from the highly productive upwelling region off Somalia.
During the first leg of the AQABA campaign the ship en- Competing interests. The authors declare that they have no conflict
countered mostly biogenic emissions from sources located of interest.
along the ship route when crossing the Arabian Sea. The
enhanced DMS values observed there could be attributed to
seasonally enhanced DMS fluxes. No oxidation products or Acknowledgements. We thankfully acknowledge the cooperation
other organosulfur compounds were detected in substantial with the Cyprus Institute (CyI), the King Abdullah University of
amounts from the local emissions. In contrast, during the Science and Technology (KAUST), and the Kuwait Institute for
Scientific Research (KISR). We thank Hays Ships Ltd., Captain
second leg, not only DMS but also DMSO2 and MSAM
Pavel Kirzner, and the ship crew for their support on-board the Kom-
were measured. DMSO2 , like MSAM, was shown to origi-
mandor Iona. We would like to express our gratitude to the whole
nate from the Somalia upwelling region. DMSO2 mixing ra- AQABA team, particularly Hartwig Harder for daily management
tios of up to 120 ppt were measured during the second leg, of the campaign, and Marcel Dorf, Claus Koeppel, Thomas Klüpfel,
which is quite substantial considering that previous studies and Rolf Hofmann for logistical organization and help with prepa-
indicate it to be a minor or negligible product in DMS gas ration and setup. We are thankful to Jan Schuladen for the J -value
phase oxidation. The main loss mechanism for MSAM and measurements, Ulrike Weis for providing artificial seawater, and
DMSO2 is deposition to the ocean surface with lifetimes of Tom Jobson and Franziska Köllner for helpful discussions.
Atmos. Chem. Phys., 20, 6081–6094, 2020 https://doi.org/10.5194/acp-20-6081-2020A. Edtbauer et al.: A new marine biogenic emission 6091
Financial support. The article processing charges for this open- pressure dependence, Phys. Chem. Chem. Phys., 1, 5463–5470,
access publication were covered by the Max Planck Society. https://doi.org/10.1039/a907211j, 1999.
Arsene, C., Barnes, I., Becker, K. H., and Mocanu, R.: FT-IR prod-
uct study on the photo-oxidation of dimethyl sulphide in the
Review statement. This paper was edited by Steven Brown and re- presence of NOx – temperature dependence, Atmos. Environ.,
viewed by Eric Saltzman and one anonymous referee. 35, 3769–3780, https://doi.org/10.1016/S1352-2310(01)00168-
6, 2001.
Ayers, G. P. and Gillett, R. W.: DMS and its oxidation products
in the remote marine atmosphere: implications for climate and
atmospheric chemistry, J. Sea Res., 43, 275–286, 2000.
References Barnes, I., Hjorth, J., and Mihalopoulos, N.: Dimethyl sulfide and
dimethyl sulfoxide and their oxidation in the atmosphere, Chem.
Ajith Joseph, K., Jayaram, C., Nair, A., George, M. S., Balc- Rev., 106, 940–975, https://doi.org/10.1021/cr020529, 2006.
hand, A. N., and Pettersson, L. H.: Remote Sensing of Up- Bentley, R. and Chasteen, T. G.: Environmental VOSCs – for-
welling in the Arabian Sea and Adjacent Near-Coastal Regions, mation and degradation of dimethyl sulfide, methanethiol
in: Remote sensing of the Asian Seas, vol. 92, edited by: Bar- and related materials, Chemosphere, 55, 291–317,
ale, V. and Gade, M., Springer, Cham, 467–483, Switzerland, https://doi.org/10.1016/j.chemosphere.2003.12.017, 2004.
https://doi.org/10.1007/978-3-319-94067-0_26, 2019. Berasategui, M., Amedro, D., Edtbauer, A., Williams, J.,
Albu, M., Barnes, I., Becker, K. H., Patroescu-Klotz, I., Mocanu, Lelieveld, J., and Crowley, J. N.: Kinetic and mech-
R., and Benter, T.: Rate coefficients for the gas-phase reaction anistic study of the reaction between methane sulfon-
of OH radicals with dimethyl sulfide: temperature and O2 par- amide (CH3 S(O)2 NH2 ) and OH, Atmos. Chem. Phys., 20,
tial pressure dependence, Phys. Chem. Chem. Phys., 8, 728–736, 2695–2707, https://doi.org/10.5194/acp-20-2695-2020, 2020.
https://doi.org/10.1039/B512536G, 2006. Berndt, T. and Richters, S.: Products of the reaction of OH rad-
Almeida, J., Schobesberger, S., Kürten, A., Ortega, I. K., icals with dimethyl sulphide in the absence of NOx : Ex-
Kupiainen-Määttä, O., Praplan, A. P., Adamov, A., Amorim, A., periment and simulation, Atmos. Environ., 47, 316–322,
Bianchi, F., Breitenlechner, M., David, A., Dommen, J., Don- https://doi.org/10.1016/j.atmosenv.2011.10.060, 2012.
ahue, N. M., Downard, A., Dunne, E., Duplissy, J., Ehrhart, S., Berresheim, H.: Gas-aerosol relationships of H2 SO4 , MSA,
Flagan, R. C., Franchin, A., Guida, R., Hakala, J., Hansel, A., and OH: Observations in the coastal marine boundary layer
Heinritzi, M., Henschel, H., Jokinen, T., Junninen, H., Kajos, M., at Mace Head, Ireland, J. Geophys. Res., 107, 24191,
Kangasluoma, J., Keskinen, H., Kupc, A., Kurtén, T., Kvashin, https://doi.org/10.1029/2000JD000229, 2002.
A. N., Laaksonen, A., Lehtipalo, K., Leiminger, M., Leppä, Berresheim, H., Huey, J. W., Thorn, R. P., Eisele, F. L., Tanner, D.
J., Loukonen, V., Makhmutov, V., Mathot, S., McGrath, M. J., J., and Jefferson, A.: Measurements of dimethyl sulfide, dimethyl
Nieminen, T., Olenius, T., Onnela, A., Petäjä, T., Riccobono, F., sulfoxide, dimethyl sulfone, and aerosol ions at Palmer Station,
Riipinen, I., Rissanen, M., Rondo, L., Ruuskanen, T., Santos, F. Antarctica, J. Geophys. Res., 1998, 1629–1637, 1998.
D., Sarnela, N., Schallhart, S., Schnitzhofer, R., Seinfeld, J. H., Bonsang, B., Gros, V., Peeken, I., Yassaa, N., Bluhm, K., Zoellner,
Simon, M., Sipilä, M., Stozhkov, Y., Stratmann, F., Tomé, A., E., Sarda-Esteve, R., and Williams, J.: Isoprene emission from
Tröstl, J., Tsagkogeorgas, G., Vaattovaara, P., Viisanen, Y., Vir- phytoplankton monocultures: the relationship with chlorophyll-
tanen, A., Vrtala, A., Wagner, P. E., Weingartner, E., Wex, H., a, cell volume and carbon content, Environ. Chem., 7, 554–563,
Williamson, C., Wimmer, D., Ye, P., Yli-Juuti, T., Carslaw, K. https://doi.org/10.1071/EN09156, 2010.
S., Kulmala, M., Curtius, J., Baltensperger, U., Worsnop, D. R., Bourtsoukidis, E., Ernle, L., Crowley, J. N., Lelieveld, J.,
Vehkamäki, H., and Kirkby, J.: Molecular understanding of sul- Paris, J.-D., Pozzer, A., Walter, D., and Williams, J.: Non-
phuric acid–amine particle nucleation in the atmosphere, Nature, methane hydrocarbon (C2 –C8 ) sources and sinks around the
502, 359–363, https://doi.org/10.1038/nature12663, 2013. Arabian Peninsula, Atmos. Chem. Phys., 19, 7209–7232,
Anacardio, R., Mullins, F. G. P., Hannam, S., Sheikh, M. S., https://doi.org/10.5194/acp-19-7209-2019, 2019.
O’Shea, K., Aramini, A., D’Anniballe, G., D’Anteo, L., Fer- Bourtsoukidis, E., Pozzer, A., Sattler, T., Matthaios, V. N., Ernle, L.,
rari, M. P., and Allegretti, M.: Development and validation Edtbauer, A., Fischer, H., Könemann, T., Osipov, S., Paris, J.-D.,
of an LC-MS/MS method for determination of methanesul- Pfannerstill, E. Y., Stönner, C., Tadic, I., Walter, D., Wang, N.,
fonamide in human urine, J. Chromatogr. B, 877, 2087–2092, Lelieveld, J., and Williams, J.: The Red Sea Deep Water is a po-
https://doi.org/10.1016/j.jchromb.2009.05.051, 2009. tent source of atmospheric ethane and propane, Nat. Commun.,
Arévalo-Martínez, D. L., Steinhoff, T., Brandt, P., Körtzinger, A., 11, 447, https://doi.org/10.1038/s41467-020-14375-0, 2020.
Lamont, T., Rehder, G., and Bange, H W.: N2 O Emissions From Breider, T. J., Chipperfield, M. P., d. Richards, N. A., Carslaw, K. S.,
the Northern Benguela Upwelling System, Geophys. Res. Lett., Mann, G. W., and v. Spracklen, D.: Impact of BrO on dimethyl-
46, 3317–3326, https://doi.org/10.1029/2018GL081648, 2019. sulfide in the remote marine boundary layer, Geophys. Res. Lett.,
Arnold, S. R., v. Spracklen, D., Gebhardt, S., Custer, T., Williams, 37, L02807, https://doi.org/10.1029/2009GL040868, 2010.
J., Peeken, I., and Alvain, S.: Relationships between atmospheric Brimblecombe, P.: The Global Sulfur Cycle, in: Treatise on geo-
organic compounds and air-mass exposure to marine biology, chemistry, edited by: Holland, H. D., Elsevier, Amsterdam,
Environ. Chem., 7, 232–241, https://doi.org/10.1071/EN09144, 559–591, https://doi.org/10.1016/B978-0-08-095975-7.00814-7,
2010. 2014.
Arsene, C., Barnes, I., and Becker, K. H.: FT-IR product study of the
photo-oxidation of dimethyl sulfide: Temperature and O2 partial
https://doi.org/10.5194/acp-20-6081-2020 Atmos. Chem. Phys., 20, 6081–6094, 20206092 A. Edtbauer et al.: A new marine biogenic emission Burkholder, J. B., Sander, S. P., Abbatt, J., Barker, J. R., Huie, mos. Meas. Tech., 12, 3453–3461, https://doi.org/10.5194/amt- R. E., Kolb, C. E., Kurylo, M. J., Orkin, V. L., Wilmouth, D. 12-3453-2019, 2019. M., and Wine, P. H.: Chemical Kinetics and Photochemical Derstroff, B., Hüser, I., Bourtsoukidis, E., Crowley, J. N., Fischer, Data for Use in Atmospheric Studies, Evaluation Number 18, H., Gromov, S., Harder, H., Janssen, R. H. H., Kesselmeier, J., JPL Publication 15-10, Jet Propulsion Laboratory, Pasadena, Lelieveld, J., Mallik, C., Martinez, M., Novelli, A., Parchatka, https://doi.org/10.13140/RG.2.1.2504.2806, 2015. U., Phillips, G. J., Sander, R., Sauvage, C., Schuladen, J., Stön- Carpenter, L. J., Archer, S. D., and Beale, R.: Ocean-atmosphere ner, C., Tomsche, L., and Williams, J.: Volatile organic com- trace gas exchange, Chem. Soc. Rev., 41, 6473–6506, pounds (VOCs) in photochemically aged air from the eastern and https://doi.org/10.1039/c2cs35121h, 2012. western Mediterranean, Atmos. Chem. Phys., 17, 9547–9566, Carslaw, K. S., Lee, L. A., Reddington, C. L., Pringle, K. J., Rap, https://doi.org/10.5194/acp-17-9547-2017, 2017. A., Forster, P. M., Mann, G. W., v. Spracklen, D., Woodhouse, Draxler, R. R. and Hess, G.: An Overview of the HYSPLIT_4 Mod- M. T., Regayre, L. A., and Pierce, J. R.: Large contribution of elling System for Trajectories, Dispersion, and Deposition, Aust. natural aerosols to uncertainty in indirect forcing, Nature, 503, Meteorol. Mag., 47, 295–308, 1998. 67–71, https://doi.org/10.1038/nature12674, 2013. Edtbauer, A.: BVOCs measurements around the Arabian Peninsula Chen, H. and Finlayson-Pitts, B. J.: New Particle Formation (AQABA 2017), https://doi.org/10.17617/3.3o, 2020. from Methanesulfonic Acid and Amines/Ammonia as a Func- Eisele, F. L. and Tanner, D. J.: Measurement of the gas phase con- tion of Temperature, Environ. Sci. Technol., 51, 243–252, centration of H2 SO4 and methane sulfonic acid and estimates of https://doi.org/10.1021/acs.est.6b04173, 2017. H2 SO4 production and loss in the atmosphere, J. Geophys. Res., Chen, H., Varner, M. E., Gerber, R. B., and Finlayson-Pitts, B. J.: 98, 9001–9010, https://doi.org/10.1029/93JD00031, 1993. Reactions of Methanesulfonic Acid with Amines and Ammonia Falbe-Hansen, H., Sørensen, S., Jensen, N. R., Pedersen, T., as a Source of New Particles in Air, J. Phys. Chem. B, 120, 1526– and Hjorth, J.: Atmospheric gas-phase reactions of dimethyl- 1536, https://doi.org/10.1021/acs.jpcb.5b07433, 2016. sulphoxide and dimethylsulphone with OH and NO3 radi- Chen, Q., Sherwen, T., Evans, M., and Alexander, B.: DMS oxi- cals, Cl atoms and ozone, Atmos. Environ., 34, 1543–1551, dation and sulfur aerosol formation in the marine troposphere: https://doi.org/10.1016/S1352-2310(99)00407-0, 2000. a focus on reactive halogen and multiphase chemistry, Atmos. Fowler, D., Coyle, M., Skiba, U., Sutton, M. A., Cape, J. N., Chem. Phys., 18, 13617–13637, https://doi.org/10.5194/acp-18- Reis, S., Sheppard, L. J., Jenkins, A., Grizzetti, B., Gal- 13617-2018, 2018. loway, J. N., Vitousek, P., Leach, A., Bouwman, A. F., Cheng, S., Tang, S., Tsona, N. T., and Du, L.: The Influence of Butterbach-Bahl, K., Dentener, F., Stevenson, D., Amann, the Position of the Double Bond and Ring Size on the Stabil- M., and Voss, M.: The global nitrogen cycle in the twenty- ity of Hydrogen Bonded Complexes, Scient. Rep., 7, 11310, first century, Philos. T. Roy. Soc. Lond. B, 368, 20130164, https://doi.org/10.1038/s41598-017-11921-7, 2017. https://doi.org/10.1098/rstb.2013.0164, 2013. Chesnavich, W. J., Su, T., and Bowers, M. T.: Collisions in Fowler, D., Steadman, C. E., Stevenson, D., Coyle, M., Rees, R. a noncentral field: A variational and trajectory investiga- M., Skiba, U. M., Sutton, M. A., Cape, J. N., Dore, A. J., Vieno, tion of ion–dipole capture, J. Chem. Phys., 72, 2641–2655, M., Simpson, D., Zaehle, S., Stocker, B. D., Rinaldi, M., Fac- https://doi.org/10.1063/1.439409, 1980. chini, M. C., Flechard, C. R., Nemitz, E., Twigg, M., Erisman, J. Colomb, A., Yassaa, N., Williams, J., Peeken, I., and Lochte, K.: W., Butterbach-Bahl, K., and Galloway, J. N.: Effects of global Screening volatile organic compounds (VOCs) emissions from change during the 21st century on the nitrogen cycle, Atmos. five marine phytoplankton species by head space gas chromatog- Chem. Phys., 15, 13849–13893, https://doi.org/10.5194/acp-15- raphy/mass spectrometry (HS-GC/MS), J. Environ. Monit., 10, 13849-2015, 2015. 325–330, https://doi.org/10.1039/b715312k, 2008. Ge, X., Wexler, A. S., and Clegg, S. L.: Atmospheric Davis, D., Chen, G., Kasibhatla, P., Jefferson, A., Tanner, D., amines – Part I. A review, Atmos. Environ., 45, 524–546, Eisele, F., Lenschow, D., Neff, W., and Berresheim, H.: DMS https://doi.org/10.1016/j.atmosenv.2010.10.012, 2011. oxidation in the Antarctic marine boundary layer: Comparison Gibb, S. W., Mantoura, R. F. C., and Liss, P. S.: Ocean- of model simulations and held observations of DMS, DMSO, atmosphere exchange and atmospheric speciation of am- DMSO2 H2 SO4 (g), MSA(g), and MSA(p), J. Geophys. Res., monia and methylamines in the region of the NW Ara- 1998, 1657–1678, 1998. bian Sea, Global Biogeochem. Cy., 13, 161–178, de Bruyn, W. J., Shorter, J. A., Davidovits, P., Worsnop, D. R., Zah- https://doi.org/10.1029/98GB00743, 1999. niser, M. S., and Kolb, C. E.: Uptake of gas phase sulfur species Graus, M., Müller, M., and Hansel, A.: High resolution PTR- methanesulfonic acid, dimethylsulfoxide, and dimethyl sulfone TOF: quantification and formula confirmation of VOC in by aqueous surfaces, J. Geophys. Res.-Atmos., 99, 16927– real time, J. Am. Soc. Mass Spectrom., 21, 1037–1044, 16932, https://doi.org/10.1029/94JD00684, 1994. https://doi.org/10.1016/j.jasms.2010.02.006, 2010. deCastro, M., Sousa, M. C., Santos, F., Dias, J. M., and Gómez- Hoffmann, E. H., Tilgner, A., Schrödner, R., Bräuer, P., Wolke, Gesteira, M.: How will Somali coastal upwelling evolve R., and Herrmann, H.: An advanced modeling study on the im- under future warming scenarios?, Scient. Rep., 6, 30137, pacts and atmospheric implications of multiphase dimethyl sul- https://doi.org/10.1038/srep30137, 2016. fide chemistry, P. Natl. Acad. Sci. USA, 113, 11776–11781, Deming, B. L., Pagonis, D., Liu, X., Day, D. A., Talukdar, R., https://doi.org/10.1073/pnas.1606320113, 2016. Krechmer, J. E., de Gouw, J. A., Jimenez, J. L., and Ziemann, Jackson, T., Chuprin, A., Sathyendranath, S., Grant, M., P. J.: Measurements of delays of gas-phase compounds in a Zühlke, M., Dingle, J., Storm, T., Boettcher, M., and wide variety of tubing materials due to gas–wall interactions, At- Fomferra, N.: Ocean Colour Climate Change Initiative: Atmos. Chem. Phys., 20, 6081–6094, 2020 https://doi.org/10.5194/acp-20-6081-2020
A. Edtbauer et al.: A new marine biogenic emission                                                                                         6093

   version 4.0, available at: ftp://ftp.rsg.pml.ac.uk/occci-v4.0/          Li, H., Zhang, X., Zhong, J., Liu, L., Zhang, H., Chen, F., Li, Z.,
   geographic/netcdf/8day/chlor_a/2017/, last access: 28 Au-                  Li, Q., and Ge, M.: The role of hydroxymethanesulfonic acid in
   gust 2019.                                                                 the initial stage of new particle formation, Atmos. Environ., 189,
Johnson, M. T., Liss, P. S., Bell, T. G., Lesworth, T. J., Baker,             244–251, https://doi.org/10.1016/j.atmosenv.2018.07.003, 2018.
   A. R., Hind, A. J., Jickells, T. D., Biswas, K. F., Wood-               Lindinger, W., Hansel, A., and Jordan, A.: On-line monitoring of
   ward, E. M. S., and Gibb, S. W.: Field observations of the                 volatile organic compounds at pptv levels by means of proton-
   ocean-atmosphere exchange of ammonia: Fundamental impor-                   transfer-reaction mass spectrometry (PTR-MS) medical applica-
   tance of temperature as revealed by a comparison of high                   tions, food control and environmental research, Int. J. Mass Spec-
   and low latitudes, Global Biogeochem. Cy., 22, GB1019,                     trom. Ion Proc., 173, 191–241, https://doi.org/10.1016/S0168-
   https://doi.org/10.1029/2007GB003039, 2008.                                1176(97)00281-4, 1998.
Jordan, A., Haidacher, S., Hanel, G., Hartungen, E., Märk, L., See-        Liss, P. S. and Slater, P. G.: Flux of Gases across the Air-Sea Inter-
   hauser, H., Schottkowsky, R., Sulzer, P., and Märk, T. D.: A high          face, Nature, 247, 181–184, https://doi.org/10.1038/247181a0,
   resolution and high sensitivity proton-transfer-reaction time-of-          1974.
   flight mass spectrometer (PTR-TOF-MS), Int. J. Mass Spec-               Liss, P. S., Marandino, C. A., Dahl, E. E., Helmig, D., Hintsa,
   trom., 286, 122–128, https://doi.org/10.1016/j.ijms.2009.07.005,           E. J., Hughes, C., Johnson, M. T., Moore, R. M., Plane, J. M.
   2009.                                                                      C., Quack, B., Singh, H. B., Stefels, J., von Glasow, R., and
Junttila, M. H. and Hormi, O. O. E.: Methanesulfonamide:                      Williams, J.: Short-Lived Trace Gases in the Surface Ocean
   a cosolvent and a general acid catalyst in sharpless asym-                 and the Atmosphere, in: Ocean-Atmosphere Interactions of
   metric dihydroxylations, J. Org. Chem., 74, 3038–3047,                     Gases and Particles, Springer Earth System Sciences, edited by:
   https://doi.org/10.1021/jo8026998, 2009.                                   Liss, P. and Johnson, M. T., pp. 1–54, Springer-Verlag GmbH,
Kämpf, J. and Chapman, P.: Upwelling Systems of                               https://doi.org/10.1007/978-3-642-25643-1_1, 2014.
   the World, Springer International Publishing, Cham,                     Liu, X., Deming, B., Pagonis, D., Day, D. A., Palm, B. B., Talukdar,
   https://doi.org/10.1007/978-3-319-42524-5, 2016.                           R., Roberts, J. M., Veres, P. R., Krechmer, J. E., Thornton, J. A.,
Khan, M., Gillespie, S., Razis, B., Xiao, P., Davies-Coleman,                 de Gouw, J. A., Ziemann, P. J., and Jimenez, J. L.: Effects of gas–
   M. T., Percival, C. J., Derwent, R. G., Dyke, J. M.,                       wall interactions on measurements of semivolatile compounds
   Ghosh, M. V., Lee, E., and Shallcross, D. E.: A mod-                       and small polar molecules, Atmos. Meas. Tech., 12, 3137–3149,
   elling study of the atmospheric chemistry of DMS using the                 https://doi.org/10.5194/amt-12-3137-2019, 2019.
   global model, STOCHEM-CRI, Atmos. Environ., 127, 69–79,                 Mardyukov, A. and Schreiner, P. R.: Atmospherically
   https://doi.org/10.1016/j.atmosenv.2015.12.028, 2016.                      Relevant Radicals Derived from the Oxidation of
Kiene, R. P., Linn, L. J., and Bruton, J. A.: New and important               Dimethyl Sulfide, Account. Chem. Res., 51, 475–483,
   roles for DMSP in marine microbial communities, J. Sea Res.,               https://doi.org/10.1021/acs.accounts.7b00536, 2018.
   43, 209–224, https://doi.org/10.1016/S1385-1101(00)00023-X,             Pagonis, D., Krechmer, J. E., de Gouw, J., Jimenez, J. L., and
   2000.                                                                      Ziemann, P. J.: Effects of gas–wall partitioning in Teflon tub-
Kloster, S., Feichter, J., Maier-Reimer, E., Six, K. D., Stier, P.,           ing and instrumentation on time-resolved measurements of gas-
   and Wetzel, P.: DMS cycle in the marine ocean-atmosphere                   phase organic compounds, Atmo. Meas. Tech., 10, 4687–4696,
   system – a global model study, Biogeosciences, 3, 29–51,                   https://doi.org/10.5194/amt-10-4687-2017, 2017.
   https://doi.org/10.5194/bg-3-29-2006, 2006.                             Paulot, F., Jacob, D. J., Johnson, M. T., Bell, T. G., Baker, A. R.,
Kukui, A., Borissenko, D., Laverdet, G., and Le Bras, G.: Gas-Phase           Keene, W. C., Lima, I. D., Doney, S. C., and Stock, C. A.: Global
   Reactions of OH Radicals with Dimethyl Sulfoxide and Methane               oceanic emission of ammonia: Constraints from seawater and
   Sulfinic Acid Using Turbulent Flow Reactor and Chemical Ion-               atmospheric observations, Global Biogeochem. Cy., 29, 1165–
   ization Mass Spectrometry, J. Phys. Chem A, 107, 5732–5742,                1178, https://doi.org/10.1002/2015GB005106, 2015.
   https://doi.org/10.1021/jp0276911, 2003.                                Pfannerstill, E. Y., Wang, N., Edtbauer, A., Bourtsoukidis, E., Crow-
Kulmala, M., Petäjä, T., Ehn, M., Thornton, J., Sipilä, M., Worsnop,          ley, J. N., Dienhart, D., Eger, P. G., Ernle, L., Fischer, H.,
   D. R., and Kerminen, V.-M.: Chemistry of atmospheric nu-                   Hottmann, B., Paris, J.-D., Stönner, C., Tadic, I., Walter, D.,
   cleation: on the recent advances on precursor characterization             Lelieveld, J., and Williams, J.: Shipborne measurements of to-
   and atmospheric cluster composition in connection with atmo-               tal OH reactivity around the Arabian Peninsula and its role
   spheric new particle formation, Annu. Rev. Phys. Chem., 65, 21–            in ozone chemistry, Atmos. Chem. Phys., 19, 11501–11523,
   37, https://doi.org/10.1146/annurev-physchem-040412-110014,                https://doi.org/10.5194/acp-19-11501-2019, 2019.
   2014.                                                                   Platt, U. and Hönninger, G.: The role of halogen
Lai, S. C., Williams, J., Arnold, S. R., Atlas, E. L., Gebhardt, S., and      species in the troposphere, Chemosphere, 52, 325–338,
   Hoffmann, T.: Iodine containing species in the remote marine               https://doi.org/10.1016/S0045-6535(03)00216-9, 2003.
   boundary layer: A link to oceanic phytoplankton, Geophys. Res.          Prinn, R. G., Huang, J., Weiss, R. F., Cunnold, D. M., Fraser, P.
   Lett., 38, L20801, https://doi.org/10.1029/2011GL049035, 2011.             J., Simmonds, P. G., McCulloch, A., Harth, C., Reimann, S.,
Lana, A., Bell, T. G., Simó, R., Vallina, S. M., Ballabrera-Poy,              Salameh, P., O’Doherty, S., Wang, R. H. J., Porter, L. W., Miller,
   J., Kettle, A. J., Dachs, J., Bopp, L., Saltzman, E. S., Ste-              B. R., and Krummel, P. B.: Evidence for variability of atmo-
   fels, J., Johnson, J. E., and Liss, P. S.: An updated climatology          spheric hydroxyl radicals over the past quarter century, Geophys.
   of surface dimethlysulfide concentrations and emission fluxes              Res. Lett., 32, L07809, https://doi.org/10.1029/2004GL022228,
   in the global ocean, Global Biogeochem. Cy., 25, GB1004,                   2005.
   https://doi.org/10.1029/2010GB003850, 2011.

https://doi.org/10.5194/acp-20-6081-2020                                                     Atmos. Chem. Phys., 20, 6081–6094, 2020
You can also read