Evaluation of regional climate models ALARO-0 and REMO2015 at 0.22 resolution over the CORDEX Central Asia domain - GMD
←
→
Page content transcription
If your browser does not render page correctly, please read the page content below
Geosci. Model Dev., 14, 1267–1293, 2021
https://doi.org/10.5194/gmd-14-1267-2021
© Author(s) 2021. This work is distributed under
the Creative Commons Attribution 4.0 License.

Evaluation of regional climate models ALARO-0 and REMO2015 at
0.22◦ resolution over the CORDEX Central Asia domain
Sara Top1,2 , Lola Kotova3 , Lesley De Cruz4 , Svetlana Aniskevich5 , Leonid Bobylev6 , Rozemien De Troch4 ,
Natalia Gnatiuk6 , Anne Gobin7,8 , Rafiq Hamdi4 , Arne Kriegsmann3 , Armelle Reca Remedio3 , Abdulla Sakalli9 ,
Hans Van De Vyver4 , Bert Van Schaeybroeck4 , Viesturs Zandersons5 , Philippe De Maeyer1 , Piet Termonia2,4 , and
Steven Caluwaerts2,4
1 Department  of Geography, Ghent University (UGent), 9000 Ghent, Belgium
2 Department  of Physics and Astronomy, Ghent University (UGent), 9000 Ghent, Belgium
3 Climate Service Center Germany (GERICS), Helmholtz Zentrum Geesthacht, 20095 Hamburg, Germany
4 Royal Meteorological Institute of Belgium (RMIB), 1180 Brussels, Belgium
5 Latvian Environment, Geology and Meteorology Centre (LEGMC), LV – 1019 Riga, Latvia
6 Nansen International Environmental and Remote Sensing Centre (NIERSC), 199034 St. Petersburg, Russia
7 Remote Sensing Unit, Flemish Institute for Technological Research (VITO), 2400 Mol, Belgium
8 Department of Earth and Environmental Sciences, Faculty of BioScience Engineering, 3001 Heverlee, Belgium
9 Climate Change Application and Research Center, Iskenderun Technical University, 31200 Iskenderun, Turkey

Correspondence: Sara Top (sara.top@ugent.be)

Received: 28 December 2019 – Discussion started: 5 March 2020
Revised: 20 January 2021 – Accepted: 29 January 2021 – Published: 9 March 2021

Abstract. To allow for climate impact studies on human           ature range. This study aims to evaluate whether REMO
and natural systems, high-resolution climate information is      and ALARO-0 provide reliable climate information over the
needed. Over some parts of the world plenty of regional cli-     CAS-CORDEX domain for impact modeling and environ-
mate simulations have been carried out, while in other re-       mental assessment applications. Depending on the evaluated
gions hardly any high-resolution climate information is avail-   season and variable, it is demonstrated that the produced cli-
able. The CORDEX Central Asia domain is one of these             mate data can be used in several subregions, e.g., tempera-
regions, and this article describes the evaluation for two       ture and precipitation over western Central Asia in autumn.
regional climate models (RCMs), REMO and ALARO-0,                At the same time, a bias adjustment is required for regions
that were run for the first time at a horizontal resolution      where significant biases have been identified.
of 0.22◦ (25 km) over this region. The output of the ERA-
Interim-driven RCMs is compared with different observa-
tional datasets over the 1980–2017 period. REMO scores
better for temperature, whereas the ALARO-0 model pre-           1   Introduction
vails for precipitation. Studying specific subregions pro-
vides deeper insight into the strengths and weaknesses of        There is a strong need for climate information at the regional
both RCMs over the CAS-CORDEX domain. For exam-                  to local scale that is useful and usable for impact studies on
ple, ALARO-0 has difficulties in simulating the tempera-         human and natural systems (Giorgi et al., 2009). In order
ture over the northern part of the domain, particularly when     to accommodate for this, the World Climate Research Pro-
snow cover is present, while REMO poorly simulates the           gram (WCRP) Coordinated Regional Climate Downscaling
annual cycle of precipitation over the Tibetan Plateau. The      Experiment (CORDEX) was initiated with the aim of design-
evaluation of minimum and maximum temperature demon-             ing and conducting several high-resolution experiments over
strates that both models underestimate the daily temper-         prescribed spatial domains across the globe. CORDEX cre-
                                                                 ates a framework to perform both dynamical and statistical

Published by Copernicus Publications on behalf of the European Geosciences Union.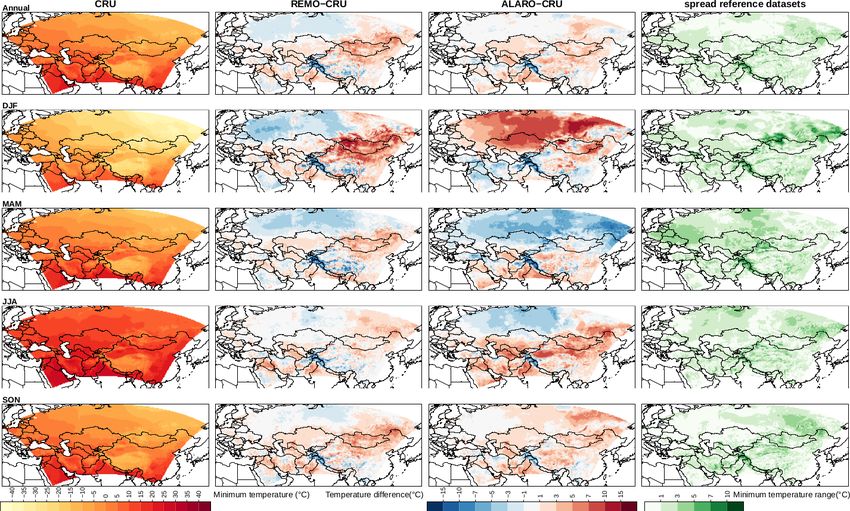
1268                  S. Top et al.: Evaluation of regional climate models ALARO-0 and REMO2015 at 0.22◦ resolution

downscaling, to evaluate these regional climate downscal-         main by evaluating two different RCMs based on multiple
ing techniques, and to characterize uncertainties of regional     scores for temperature (mean, minimum, and maximum) and
climate change projections by producing ensemble projec-          precipitation over the longer period of 38 years.
tions (Giorgi and Gutowski, 2015). Within CORDEX there               In order to fill the knowledge gap over Central Asia two
are large ensembles of model simulations available at differ-     RCMs, ALARO-0 and REMO, were run over this region
ent resolutions for the Africa (Nikulin et al., 2012, 2018),      at 0.22◦ resolution in line with the CORDEX-CORE pro-
Europe (Jacob et al., 2014; Kotlarski et al., 2014), Mediter-     tocol (CORDEX Scientific Advisory Team, 2019). Here we
ranean (Ruti et al., 2016), and North America (Diaconescu         present the model evaluation through the use of so-called
et al., 2016; Whan and Zwiers, 2017; Gibson et al., 2019)         “perfect boundary conditions” taken from reanalysis data and
CORDEX regions (Gutowski et al., 2016). These large en-           by comparing the downscaled results to observed data for the
sembles consist of more than 10 different global–regional         period 1980–2017. Such a study is necessary to gain confi-
climate model (GCM–RCM) combinations. In order to pro-            dence in the RCM downscaling procedure before its appli-
vide such ensembles over all CORDEX regions, coordinated          cation in the context of climate projections for which the
sets of experiments were recently performed or are still on-      RCM is driven by a GCM (Giorgi and Mearns, 1999). The
going for CORDEX regions such as South America (Sol-              methodology for evaluation is partially based on Kotlarski et
man et al., 2013), Central America (Fuentes-Franco et al.,        al. (2014) and Giot et al. (2016), who compared a large en-
2015; Cabos et al., 2019), South Asia (Ghimire et al., 2018),     semble of RCMs over the EURO-CORDEX region with the
East Asia (Zou et al., 2016), South-East Asia (Tangang et         high-resolution E-OBS observational dataset (Hofstra et al.,
al., 2018, 2019; Tuyet et al., 2019), Australasia (Di Virgilio    2009). However, in this study a slightly different approach is
et al., 2019), the Arctic (Koenigk et al., 2015; Akperov et       necessary due to the absence of an ensemble of RCM runs
al., 2018), Antarctic (Souverijns et al., 2019), and the Mid-     over Central Asia. Additionally, in some regions the quality
dle East–North Africa (Almazroui et al., 2016; Bucchignani        of gridded observational datasets, constructed through inter-
et al., 2018). In addition, a new ensemble of climate change      polation or area averaging of station observations, is poor due
simulations covering all major inhabited regions with a spa-      to over-smoothing of extreme values (Hofstra et al., 2010)
tial resolution of about 25 km has been established within the    and/or because of station observations that are nonrepresen-
WCRP CORDEX COmmon Regional Experiment (CORE)                     tative for their large-scale environments. This is particularly
framework to support the growing demands for climate ser-         the case for orographically complex regions such as the Hi-
vices (Remedio et al., 2019). Furthermore, a number of high-      malayas. The current study compares the model simulations
resolution global simulations at climatic timescales, with res-   with different gridded observational datasets and reanalysis
olutions of at least 50 km in the atmosphere and 28 km in the     data. When the different datasets show large deviations and
ocean, have been performed within the Coupled Model Inter-        a large spread then their uncertainty is high and no robust
comparison Project 6 (CMIP6) (Haarsma et al., 2016).              conclusions can be drawn (Collins et al., 2013; Russo et al.,
   While high-resolution ensembles (up to 0.11◦ or 12.5 km        2019).
spatial resolution) are available for certain regions, e.g.,         This study contains two assets: for the first time an in-
EURO-CORDEX (Jacob et al., 2014), for other regions such          depth evaluation of the RCMs ALARO-0 and REMO is per-
as Australasia (Di Virgilio et al., 2019) and the Antarc-         formed at 0.22◦ spatial resolution over the CAS-CORDEX
tic (Souverijns et al., 2019) the first experiments were per-     domain, and we reflect on the impact of the observational
formed only recently. For the CORDEX Central Asia (CAS-           datasets on the model evaluation. Such an analysis is a pre-
CORDEX) domain only a single climate run was publicly             requisite in order to be able to use the climate data in a sound
available through the Earth System Grid Federation (ESGF)         way for later impact studies, e.g., for investigating climate
archive until 2019. This was performed by the Met Office          change impacts on crop yields and biomass production in
Hadley Centre (MOHC) with the regional climate model              forest ecosystems, which will be done in the framework of
(RCM) HadRM3P (Jones et al., 2004) at a resolution of             the AFTER project (Kotova et al., 2018).
0.44◦ , which is insufficient for most impact modeling and           In the following section we describe the applied method-
environmental assessment applications. In addition, climate       ology for this study (Sect. 2). This section contains details
projections with the RegCM model at 0.44◦ resolution for          about the study area, the model description, datasets used
the 2071–2100 period and different emission scenarios were        for the evaluation, and the methodology of the analysis. In
reported in Ozturk et al. (2012, 2016); however, they are not     Sect. 3, we describe the annual cycle, seasonal and annual
available through the ESGF archive. Thus, higher-resolution       means, biases, and the variability of mean, minimum, and
climate data over the CAS-CORDEX region are needed (Ko-           maximum surface air temperature and precipitation. Further,
tova et al., 2018). Recently, Russo et al. (2019, 2020) pre-      we evaluate and provide a discussion of some remarkable
sented model evaluation results of the COSMO-CLM 5.0              anomalies in Sect. 4, and in the final section (Sect. 5) we
model run at 0.22◦ or 25 km resolution over the CAS-              summarize the conclusions.
CORDEX region. In this study we aim to address the scarcity
of reliable climate information over the CAS-CORDEX do-

Geosci. Model Dev., 14, 1267–1293, 2021                                           https://doi.org/10.5194/gmd-14-1267-2021
S. Top et al.: Evaluation of regional climate models ALARO-0 and REMO2015 at 0.22◦ resolution                                  1269

Figure 1. The CAS-CORDEX domain delineated by a red con-            Figure 2. IPCC6 subregions projected on the CAS-CORDEX re-
tour and the main overlapping CORDEX domains (black contour         gion.
lines): Europe (EUR), Arctic (ARC), South-East Asia (SEA), East
Asia (EAS), and MENA projected upon the topography of Eurasia
(geopotential height in meters of the GTOPO30 global digital ele-   the RCM has to cover. While REMO uses the exact rotated
vation model – DEM – 3). All points with orography higher than      lat–long CAS-CORDEX grid (Jacob et al., 2007) described
3000 m are colored white.                                           by the CORDEX community, ALARO-0 has adopted a con-
                                                                    formal Lambert projection (Giot et al., 2016), which implies
                                                                    that the non-rotated boundary box should be applied in order
2     Methods                                                       to define the domain. The grids were set up in such a way
                                                                    that the CAS-CORDEX domain is completely covered by
2.1    CORDEX Central Asia domain and subregions                    the model domain excluding the relaxation zone. The CAS-
                                                                    CORDEX 0.22◦ ALARO-0 inner domain encompasses 333
The CAS-CORDEX domain as shown in Fig. 1 contains
                                                                    by 223 grid boxes, while REMO circumscribes 309 and 201
eastern Europe, a large part of the Middle East (includ-
                                                                    grid boxes in the east–west direction and north–south direc-
ing Saudi Arabia, Jordan, Syria, Iraq, and Iran), and Cen-
                                                                    tion, respectively. The outer domain for both RCMs consists
tral Asia (including Kazakhstan, Uzbekistan, Turkmenistan,
                                                                    of the inner domain plus a relaxation zone of eight grid points
Afghanistan, Pakistan, Tajikistan, Kyrgyzstan, and Mongo-
                                                                    at every boundary.
lia). The majority of Russia and China (excluding the most
                                                                       The CAS-CORDEX domain overlaps with eight other
eastern provinces) and the northern part of India are included
                                                                    CORDEX domains, including the ones covering Europe,
as well. This domain is an exceptional CORDEX domain
                                                                    the Arctic, East Asia, South-East Asia, South Asia, Africa–
in the sense that it barely covers any open ocean. It con-
                                                                    MENA, and the Mediterranean. Both RCMs used in this
tains several important mountain ranges, such as the Ural,
                                                                    study, ALARO-0 and REMO, were already run and evalu-
Caucasus, Altay, and Himalaya, as well as deserts, e.g., the
                                                                    ated over the EURO-CORDEX region (Kotlarski et al., 2014;
Arabian, Karakum, Thar, Taklamakan, and Gobi. Mountain-
                                                                    Giot et al., 2016). Additionally, REMO has been validated
ous environments are of special interest for regional climate
                                                                    over five other overlapping CORDEX regions (Remedio et
modeling since global climate models poorly resolve moun-
                                                                    al., 2019).
tain ranges with a spatial resolution less than 0.50◦ , and
                                                                       In the present paper, the CAS-CORDEX domain was fur-
hence RCMs may have an added value here (Torma et al.,
                                                                    ther subdivided into five subregions according to the IPCC
2015). In addition, the CAS-CORDEX domain contains a
                                                                    reference regions as defined by Iturbide et al. (2020): East
wide range of climatic and bioclimatic zones, such as per-
                                                                    Europe (EEU), West Siberia (WSB), East Siberia (ESB),
mafrost in the north and the hot regions and monsoon-driven
                                                                    West Central Asia (WCA), and the Tibetan Plateau (TIB).
climates with abundant precipitation linked to the Intertropi-
                                                                    These subregions, visualized in Fig. 2, were applied to eval-
cal Convergence Zone (ITCZ) passing in the south.
                                                                    uate the spatial differences in the study area and to investigate
   In order to obtain simulations that allow for coordi-
                                                                    whether there were differences in the simulation of subcon-
nated intercomparisons, the CORDEX initiative prescribes
                                                                    tinental processes.
the minimum inner domain of each CORDEX region that

https://doi.org/10.5194/gmd-14-1267-2021                                              Geosci. Model Dev., 14, 1267–1293, 2021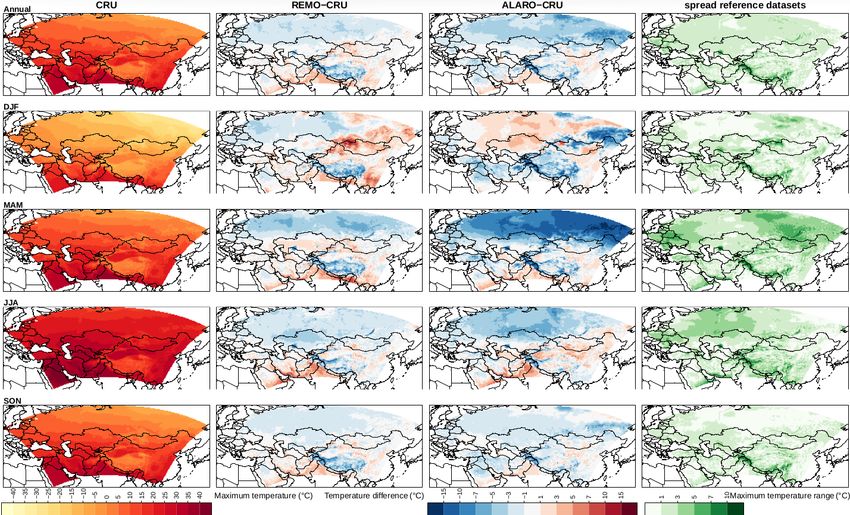
1270                  S. Top et al.: Evaluation of regional climate models ALARO-0 and REMO2015 at 0.22◦ resolution

2.2    Model description and experimental design                 length, surface albedo, surface emissivity, and vegetation pa-
                                                                 rameters. A spin-up period was needed to allow the models
REMO and ALARO-0 are hydrostatic atmospheric circula-            and their surface fields to adjust to the forcing and internal
tion models aimed to run over limited areas. The ALARO-0         model physics (Giot et al., 2016). While for ALARO-0 the
model is a configuration of the ALADIN model (ALADIN             year 1979 was designated as the spin-up year, REMO was
International Team, 1997; Termonia et al., 2018a), which         spun up for 10 years to allow the model to reach an equilib-
is developed, maintained, and used operationally by the 16       rium state for the soil temperature and soil moisture. These
countries of the ALADIN consortium. The dynamical core           soil fields were then used as initial soil conditions when
of the ALADIN model is based on a spectral spatial dis-          restarting the model from 1979. The data produced by both
cretization and a semi-implicit semi-Lagrangian time step-       models have been uploaded to the ESGF data nodes (website:
ping algorithm. The ALARO-0 configuration is based on the        http://esgf.llnl.gov/, last access: 7 July 2020).
physics parameterization scheme 3MT (Modular Multiscale
Microphysics and Transport; Gerard et al., 2009), which          2.3     Reference datasets
handles convection, turbulence, and microphysics. ALARO-
0 has been used and validated for regional climate studies       In order to validate the model results, monthly, seasonally,
(Hamdi et al., 2012; De Troch et al., 2013; Giot et al., 2016;   and annually averaged values for temperature and precipita-
Termonia et al., 2018b).                                         tion were compared with different reference datasets. Grid-
   REMO is based on the Europa Model, the former numeri-         ded datasets are based on interpolated station data and are
cal weather prediction (NWP) model of the German Weather         used instead of station observations to overcome the scale
Service (Jacob, 2001). The model development was initiated       difference between the model and observation field (Tustison
by the Max Planck Institute for Meteorology and is further       et al., 2001). A multitude of datasets were considered to as-
maintained and extended by the Climate Service Center Ger-       sess the reliability of the gridded observational temperature
many (HZG-GERICS). The physical parameterization orig-           and precipitation (Gómez-Navarro et al., 2012). The refer-
inates from the global circulation model ECHAM4 (Roeck-          ence datasets are briefly presented in Table 1, and in the next
ner et al., 1996), but there have been many further develop-     sections we give a more detailed overview of the different
ments (Hagemann, 2002; Semmler et al., 2004; Pfeifer, 2006;      datasets used in this study.
Pietikäinen et al., 2012; Wilhelm et al., 2014). REMO is
                                                                 2.3.1    Climatic Research Unit TS dataset
used in its most recent hydrostatic version, REMO2015, and
the dynamical core uses a leapfrog time stepping with semi-      The gridded Climatic Research Unit (CRU) TS dataset (ver-
implicit correction and an Asselin filter. For both RCMs, the    sion 4.02) contains 10 climate-related variables for the pe-
vertical levels are based on hybrid normalized pressure co-      riod 1901–2018 at a grid resolution of 0.50◦ covering the
ordinates that follow the orography at the lowest levels. For    global land mass (excluding Antarctica) (Harris et al., 2020).
the ALARO-0 experiment 46 levels were used, whereas the          Monthly values of minimum, maximum, and mean near-
REMO run employs 27 levels. More details on the general          surface air temperature and precipitation were used in the
setup of ALARO-0 can be found in Giot et al. (2016), and         current study. This dataset is widely used all over the world
for REMO we refer to Jacob (2001) and Jacob et al. (2012).       in a wide range of disciplines, although some issues have
An overview of the model specifications is given in Table S1     been reported (Harris et al., 2020), with the main concerns in-
in the Supplement.                                               cluding sparse coverage of measurement stations over certain
   In order to evaluate both RCMs, a run driven by a large-      regions, e.g., northern Russia, and the dissimilarities in mea-
scale forcing taken from the ERA-Interim global reanaly-         surement methods that are used by different countries (Harris
sis (Dee et al., 2011) was undertaken for the period 1980–       et al., 2020). In the present paper, this dataset is used as the
2017. A one-way nesting strategy was applied to dynam-           reference, while the spread of the data in all of the datasets is
ically downscale the ERA-Interim data, having a horizon-         used to assess the reliability over the different areas.
tal resolution of about 0.70◦ (approximately 79 km), to a
higher resolution over the CAS-CORDEX domain (Denis              2.3.2    Matsuura and Willmott gridded dataset
et al., 2002). The ERA-Interim forcing data have been pre-
scribed at the lateral boundaries using the Davies (1976) re-    The Matsuura and Willmott (MW) (version 5.01) gridded
laxation scheme, and the downscaling has been performed          dataset of the University of Delaware contains monthly val-
to a horizontal resolution of 0.22◦ (approximately 25 km).       ues at a 0.5◦ resolution based on temperature and precipita-
Both model experiments are continuous runs initialized on        tion station observations. The main differences with the CRU
1 January 1979 and then forced every 6 h at the boundaries up    dataset are the use of different measurement station networks
to 31 December 2017. Furthermore, constant climatological        and spatial interpolation methods (Willmott and Matsuura,
fields for some parameters were used and updated monthly         1995; Harris et al., 2020). Additionally, this dataset only con-
following the methodology of Giot et al. (2016). These in-       tains monthly values of mean near-surface air temperature
clude sea surface temperatures (SSTs), surface roughness         and precipitation, which are used in this study. It is known

Geosci. Model Dev., 14, 1267–1293, 2021                                           https://doi.org/10.5194/gmd-14-1267-2021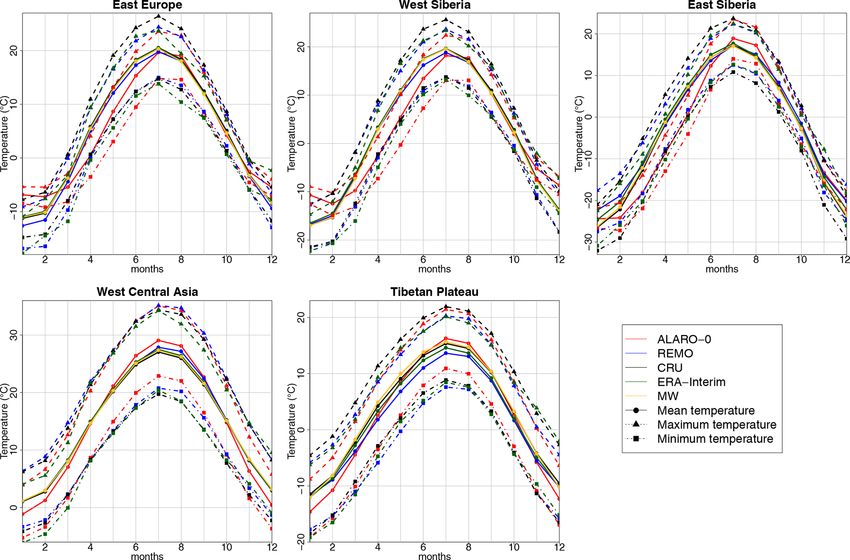
S. Top et al.: Evaluation of regional climate models ALARO-0 and REMO2015 at 0.22◦ resolution                                          1271

Table 1. Overview of the reference datasets used.

 Dataset                  Short     Type       Resolution   Variables used                      Frequency   Temporal      Domain
                          name                                                                              coverage
 Gridded Climatic         CRU       gridded    0.50◦        2 m mean air temperature,           monthly     1901–2018     global land mass
 Research Unit TS                   station                 2 m maximum air temperature,                                  (excluding
 dataset (version 4.02)             data                    2 m minimum air temperature,                                  Antarctica)
                                                            precipitation
 Matsuura and             MW        gridded    0.50◦        2 m mean air temperature,           monthly     1900–2017     global land mass
 Willmot, University                station                 precipitation
 of Delaware                        data
 (version 5.01)
 Global Precipitation     GPCC      gridded    0.50◦ or     precipitation                       monthly     1891–2016     global land mass
 Climatology Centre                 station    0.25◦                                                                      (excluding
 gridded dataset                    data                                                                                  Antarctica)
 (version 2018)
 ERA-Interim              ERA-      reanalysis 0.70◦        2 m mean air temperature,           monthly     1979–2017     global
                          Interim   data                    precipitation

that the MW dataset generally underestimates the precipita-                 to be used as forcing for both RCMs at a spatial resolution of
tion in the central part of the CAS-CORDEX domain, espe-                    0.25◦ . Moreover, the ERA-Interim data are used to study the
cially during spring (Hu et al., 2018). The MW dataset con-                 spread between observational gridded datasets and reanaly-
tains up to 0.4 ◦ C warmer temperatures globally for the latest             sis data. To evaluate precipitation, total monthly precipita-
decades compared to CRU (Harris et al., 2020).                              tion was obtained from the Monthly Means of Daily Forecast
                                                                            Accumulations dataset. The Monthly Means of Daily Means
2.3.3   Global Precipitation Climatology Centre dataset                     data at the 2 m temperature level are used for the mean tem-
                                                                            perature, while the minimum and maximum temperatures are
The Global Precipitation Climatology Centre (GPCC) (ver-                    retrieved by extracting the minimum and the maximum, re-
sion 2018) of the German Weather Service is a monthly land                  spectively, from the 3-hourly ERA-Interim forecasts. Several
surface precipitation dataset at 0.25◦ resolution based on rain             studies have shown that ERA-Interim tends to have a warm
gauge measurements. The GPCC full-data monthly product                      bias in the northern part of the CAS-CORDEX region, es-
(version 2018) contains globally regular gridded monthly                    pecially during winter (Ozturk et al., 2012, 2016). Ozturk et
precipitation totals. This updated version uses “climatologi-               al. (2012) relate this to the insufficient ability of ERA-Interim
cal infilling” to avoid interpolation artifacts for regions where           to produce snow cover in winter. Additionally, ERA-Interim
an entire 5◦ grid is not covered by any station data (Schneider             globally overestimates precipitation, particularly over moun-
et al., 2018). Hu et al. (2018) concluded for the central part              tainous regions (Sun et al., 2018).
of our domain that GPCC is more in line with the observed
station data in Central Asia compared to CRU and MW. For
                                                                            2.4   Analysis methods
this region, they also found that precipitation is underesti-
mated in mountainous areas and precipitation is slightly un-
derestimated overall by GPCC, especially during spring. In                  The grids of the observational and reanalysis datasets gener-
addition, the GPCC has no similar dataset for other variables,              ally differ from the model grid. Therefore, an interpolation to
and thus only precipitation can be validated with this dataset.             one common grid is needed in order to compare them (Kot-
                                                                            larski et al., 2014). The output of the RCMs was upscaled
2.3.4   ERA-Interim                                                         and bilinearly interpolated to the 0.50◦ resolution grid of the
                                                                            observational gridded datasets.
Reanalysis products like ERA-Interim are more continuous                       For ALARO-0 and REMO, hourly values for temperature
in space and time than station data, but they also contain bi-              at 2 m and convective and stratiform rain and snow are avail-
ases. The ERA-Interim reanalysis of the European Centre                     able. The precipitation variables were added up in order to
for Medium-Range Weather Forecasts (ECMWF) is avail-                        obtain the hourly total precipitation, which in turn was used
able from 1979 onwards. The spatial resolution of the dataset               to calculate monthly totals and seasonal and annual means.
is approximately 0.70◦ (T255 spectral) with 60 levels in the                Seasons are defined as meteorological seasons; winter in-
vertical direction from the surface up to 0.1 hPa (Dee et al.,              cludes December, January, and February (DJF). Spring in-
2011). The ERA-interim data have been further interpolated                  cludes March, April, and May (MAM). Summer includes

https://doi.org/10.5194/gmd-14-1267-2021                                                      Geosci. Model Dev., 14, 1267–1293, 2021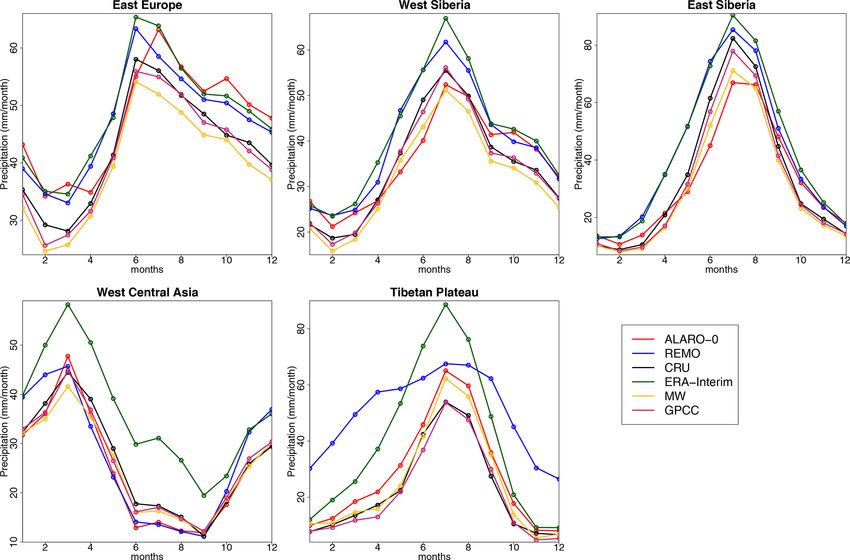
1272                   S. Top et al.: Evaluation of regional climate models ALARO-0 and REMO2015 at 0.22◦ resolution

June, July, and August (JJA), and autumn includes Septem-          3.1   Mean temperature
ber, October, and November (SON).
   The diurnal temperature range was obtained by subtracting
the minimum temperature from the maximum temperature,              Figure 3 shows the mean seasonal and annual temperature
and a height correction was performed for mean, minimum,           observations of CRU, the model biases with respect to CRU,
and maximum temperature assuming a uniform temperature             and the spread between the reference datasets (ERA-Interim,
lapse rate of 0.0064 K m−1 .                                       MW, and CRU) for the 1980–2017 period. Table 2 shows
   The model evaluation was done by calculating different          the spatially averaged mean seasonal and annual CRU tem-
evaluation metrics over the CAS-CORDEX domain and the              perature for the 1980–2017 period over the CAS-CORDEX
defined subregions for the 1980–2017 period. We computed           domain and subregions, the biases and MAE of the RCMs
the monthly, seasonal, and annual climatological means of          (REMO and ALARO-0), and the other reference datasets
the evaluated variables to obtain graphs of the annual cycle       (ERA-Interim and MW) against CRU.
and maps that visualize the spatial patterns of the bias be-          Both RCMs produce similar mean annual temperature pat-
tween the RCMs and reference datasets. The relative bias for       terns in the western part of the domain since they have sim-
precipitation is computed by subtracting the CRU value from        ilar biases with respect to CRU (Fig. 3). Contrasting error
the RCM and dividing it by the CRU value.                          patterns can be seen in the temperature bias of ALARO-0 be-
   The climatological means, biases, and mean absolute er-         tween north and south and for REMO between east and west,
rors (MAEs) were spatially averaged to obtain one mean             with a peak in positively biased temperatures over north-
value over the complete domain and each of the subregions.         western Mongolia. Annual biases generally vary between −3
Moreover, Taylor diagrams were produced in order to study          and 3 ◦ C for both RCMs, with the exception of orographi-
the model performance for the different seasons and for an-        cally complex regions and some areas in northern and east-
nual means. These diagrams supplement the bias analysis by         ern Siberia for ALARO-0. The biases and MAE of the annual
visualizing in a concise way information about the spatial         mean temperature are very comparable between ALARO-
correlation, the centered root mean square error (RMSE), and       0 and REMO (Table 2), with small biases and MAEs that
the ratio of spatial variability (RSV) between the model and       are only slightly larger than the spread of the observational
the observational dataset (Taylor, 2001). These metrics are        datasets.
computed over all grid points of the CAS-CORDEX domain.               On the seasonal timescale, biases over larger areas are
The RSV is defined as the ratio of the model standard devia-       mainly pronounced in winter (DJF) and spring (MAM). In
tion and the standard deviation of the reference dataset (CRU      particular, both models locally show strong biases in the
in this case) averaged over the domain. For the formulas used      northeastern part of the domain for winter, with values rang-
we refer to Appendix A of Kotlarski et al. (2014).                 ing up to 15 ◦ C. Additionally, ALARO-0 shows strong neg-
   Limitations of the observational datasets should be kept in     ative biases up to −15 ◦ C during spring in this area. These
mind when interpreting the evaluation results (Kotlarski et        large biases are reflected by the values in Table 2 for the
al., 2014). These limitations are investigated by comparing        northern subregions EEU, WSB, and ESB for ALARO-0 and
the different observational datasets, and their implications for   the ESB subregion for REMO. Additionally, REMO has a
the evaluation will be described in Sect. 4. The spread be-        cold bias in the western part of Russia during winter, while
tween the different reference datasets (observational datasets     ALARO-0 shows a warm bias. During spring, cold biases
and the ERA-Interim reanalysis dataset) is calculated for          are found for both models in the northern part of the do-
each grid point by computing the difference between the            main, but the biases of ALARO-0 are more pronounced than
maximum and the minimum value of the different datasets            those of REMO (Fig. 3 and Table 2). For the summer (JJA)
for every 3-month period (season) averaged over the 1980–          season, warm biases occur over the southern part of the do-
2017 period.                                                       main for both RCMs, with exception of some regions such
                                                                   as the Himalayas, southeastern China, and the northern bor-
                                                                   der of Iran, which exhibit cold biases. On the contrary, cold
3   Results                                                        biases in summer are overall more dominant in the north.
                                                                   These biases in summer are more pronounced for ALARO-
In this section, the results of the model evaluation are pre-
                                                                   0. The small mean bias during summer (JJA) for ALARO-0
sented with a focus on evaluation metrics of seasonal means
                                                                   over the complete domain (Table 2) is the result of averaging
of mean, minimum, and maximum near-surface air tempera-
                                                                   the warm biases in the south and the cold biases in the north
ture (henceforth denoted as temperature) and seasonal mean
                                                                   (Fig. 3). Both models have the smallest biases and MAE over
precipitation (henceforth precipitation). This is done for the
                                                                   the ESB region in this season (Table 2). Both models show
complete CAS-CORDEX domain and for the five subre-
                                                                   modest bias patterns in autumn (SON), with notably mod-
gions.
                                                                   est warm biases over the eastern part of the domain (Fig. 3).
                                                                   In agreement with Fig. 3 the spatially averaged biases and
                                                                   MAE in Table 2 are small for both RCMs during autumn,

Geosci. Model Dev., 14, 1267–1293, 2021                                            https://doi.org/10.5194/gmd-14-1267-2021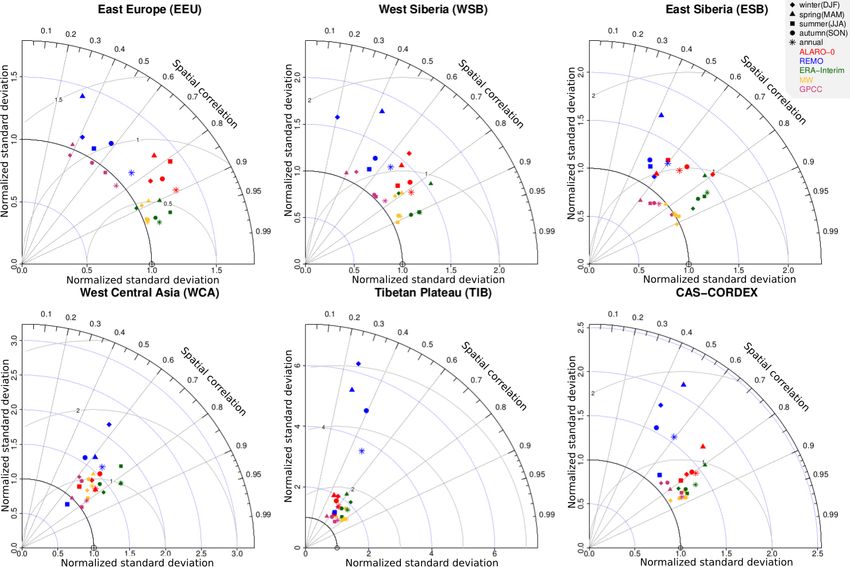
Table 2. Climatological mean CRU temperature (◦ C) for the 1980–2017 period over the CAS-CORDEX domain and subdomains, biases (◦ C) and MAE (◦ C) of the RCMs (REMO and
                                           ALARO-0), and the other reference datasets (ERA-Interim and MW) against CRU.

                                                                                         EEU                                           WSB                                            ESB
                                                                         DJF    MAM        JJA     SON    Annual       DJF    MAM        JJA     SON    Annual       DJF    MAM        JJA     SON     Annual
                                            CRU                       −10.01      5.09   19.08     4.77       4.8   −15.44      2.39   18.16     2.13      1.89   −24.29    −2.34     15.35   −3.66    −3.64
                                            REMO – CRU                 −1.53    −1.42    −1.06   −0.46     −1.11     −0.40    −0.94    −1.22    −0.52    −0.77       3.11   −0.42    −0.13      0.90     0.86
                                            MAE REMO CRU                1.85     2.06     1.11    0.72      1.31      1.94     1.95     1.33     0.86     1.28       3.40    1.78     0.71      1.25     1.40

https://doi.org/10.5194/gmd-14-1267-2021
                                            ALARO – CRU                  3.27   −4.35    −1.56   −0.44     −0.79       4.57   −5.26    −2.16    −0.14    −0.77       1.26   −6.90      0.63     0.57   −1.12
                                            MAE ALARO CRU                3.28    4.36     2.32    0.66      1.22       4.87    5.31     2.79     0.51     1.18       3.97    6.99      2.09     1.45    1.65
                                            ERA-Interim – CRU            0.24   −0.10    −0.15   −0.23     −0.06       0.41     0.06   −0.19    −0.29    −0.01       1.68     1.04     0.49     0.41     0.91
                                            MAE ERA-Interim CRU          0.41     0.3     0.43    0.31      0.25       0.85     0.53    0.62     0.49     0.43       1.94     1.25     0.83     0.80     1.10
                                            MW – CRU                     0.01   −0.42    −0.39   −0.49     −0.32     −0.20    −0.46    −0.36    −0.65    −0.42       0.08     0.12   −0.14    −0.26    −0.05
                                            MAE MW CRU                   0.46    0.52     0.56    0.46      0.46      0.88     0.78     0.73     0.88     0.88       1.55     0.96    0.94     1.55     1.55
                                                                                         WCA                                            TIB                                     CAS-CORDEX
                                                                         DJF    MAM        JJA     SON    Annual       DJF    MAM        JJA     SON    Annual       DJF    MAM        JJA     SON     Annual
                                            CRU                          2.25   14.34    25.98    14.89     14.42    −9.79      3.69   14.36     3.05      2.88    −9.35      5.87    19.23     5.72     5.44
                                            REMO – CRU                 −0.11    −0.05     0.57     0.22      0.16    −0.07    −1.49    −1.16    −0.90    −0.90       0.48   −0.56    −0.33      0.01   −0.11
                                            MAE REMO CRU                1.48     1.64     2.03     1.46      1.47     3.31     2.76     2.50     2.37     2.59       2.33    1.82     1.34      1.20    1.43
                                            ALARO – CRU                −2.13    −0.38     1.70   −0.41     −0.29     −2.57    −1.04      1.29   −0.28    −0.63       0.83   −3.19      0.02   −0.03    −0.60
                                            MAE ALARO CRU               2.77     2.38     2.79    1.59      1.81      3.24     2.92      3.25    1.94     2.32       3.16    4.20      2.42    1.24     1.56
                                            ERA-Interim – CRU          −0.03      0.11    0.32     0.07      0.12    −0.46    −0.62    −0.60    −0.82    −0.62       0.42     0.21     0.16   −0.02      0.19
                                            MAE ERA-Interim CRU         1.26      1.27    1.58     1.21      1.17     1.77     1.95     2.02     1.80     1.77       1.16     1.02     0.98    0.85      0.87
                                            MW – CRU                   −0.09    −0.23     0.08   −0.09     −0.08     −0.46      0.75     0.56    0.14      0.26    −0.41    −0.19    −0.09    −0.43    −0.28
                                                                                                                                                                                                                     S. Top et al.: Evaluation of regional climate models ALARO-0 and REMO2015 at 0.22◦ resolution

                                            MAE MW CRU                  1.53     1.38     1.48    1.53      1.53      2.78      2.22     2.12    2.78      2.78     1.32     1.10     1.07     1.32     1.32

Geosci. Model Dev., 14, 1267–1293, 2021
                                                                                                                                                                                                                     1273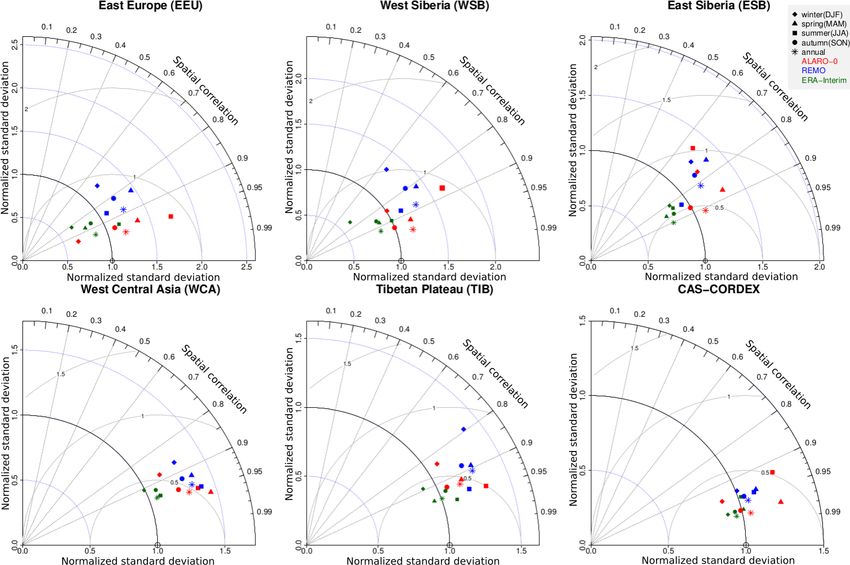
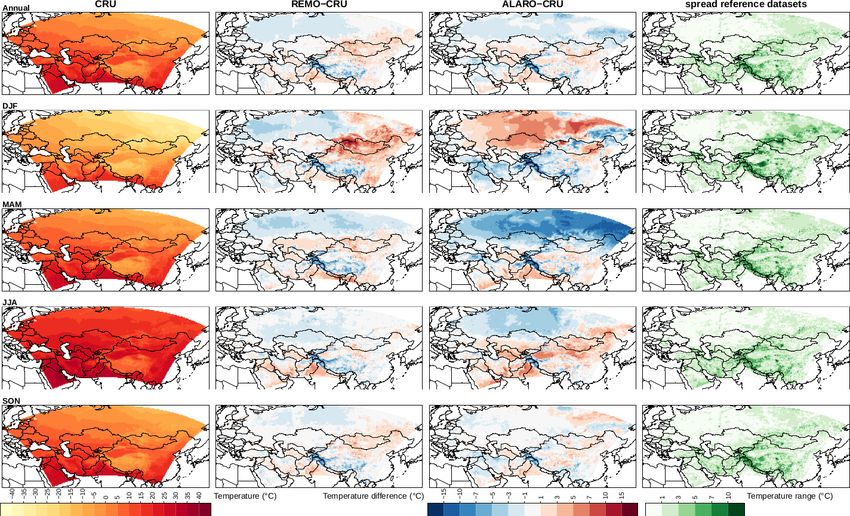
1274                   S. Top et al.: Evaluation of regional climate models ALARO-0 and REMO2015 at 0.22◦ resolution

Figure 3. Left column: mean air temperature (◦ C) at 2 m height over the CAS-CORDEX domain based on the observational CRU dataset for
the 1980–2017 period on an annual level and for winter (DJF), spring (MAM), summer (JJA), and autumn (SON). Middle columns: difference
in mean temperature between models and CRU. Right column: the range in mean temperature (◦ C) between the different reference datasets
(CRU, MW, and ERA-Interim).

especially for eastern Europe (EEU), the western and central         relations with CRU when compared to those of ALARO-0,
Russian region, and Kazakhstan (WSB).                                but they are still high (> 90 %), except for the ESB subre-
   Biases in the high-altitude regions are largely persistent        gion.
throughout the seasons. More specifically, both RCMs have               On the other hand, the Taylor diagrams for the subregions
large negative biases over the Pamir Mountains (Tajikistan)          illustrate how scores calculated over the complete CAS-
and the Himalayas, while they also feature negative biases           CORDEX domain can hide underlying regional patterns.
over the Tibetan Plateau, although this is to a lesser extent        The spatial pattern correlation is lowest during winter for
for ALARO-0 for which this is only clearly visible in the            both RCMs, except for the ESB subregion where ALARO-
winter season.                                                       0 shows a lower spatial correlation during summer. When
   Figure 4 shows the normalized Taylor diagram illustrating         considering the spatial correlation and the RMSE of the dif-
the spatial performance of mean temperature for seasonal and         ferent subregions, both RCMs are closest to the CRU data
annual means for both RCMs (ALARO-0 and REMO), the                   over the WCA subregion. Based on the centered RMSE, the
ERA-Interim reanalysis, and MW observational data with re-           RCMs perform generally best during autumn, except for the
spect to CRU for the five subregions and the complete CAS-           REMO simulations in the subregions WSB and TIB. Dur-
CORDEX domain.                                                       ing the other seasons both RCMs simulate the temperature
   Both models have generally good performance for annual            clearly worse in the northern part of the CAS-CORDEX do-
and seasonal temperature over the CAS-CORDEX domain                  main (EEU, WSB, ESB). Both RCMs overestimate the nor-
since the spatial correlation between the model output and           malized RSV, but ALARO-0 underestimates it in winter over
the CRU data is high (> 90 %), while the centered RMSE               the EEU subregion and in autumn over the WCA subregion.
is small (< 0.5) and the normalized RSV is mostly close              In general, both RCMs simulate the normalized standard de-
to 1. Moreover, the spatial correlation is high (> 90 %) for         viation of the temperature well (RSV deviates less than 0.25
ALARO-0 over all subregions at the annual level. Annual              from 1) during autumn and winter. Additionally, REMO sim-
mean temperatures of REMO have slightly lower spatial cor-           ulates the normalized standard deviation well during summer

Geosci. Model Dev., 14, 1267–1293, 2021                                               https://doi.org/10.5194/gmd-14-1267-2021
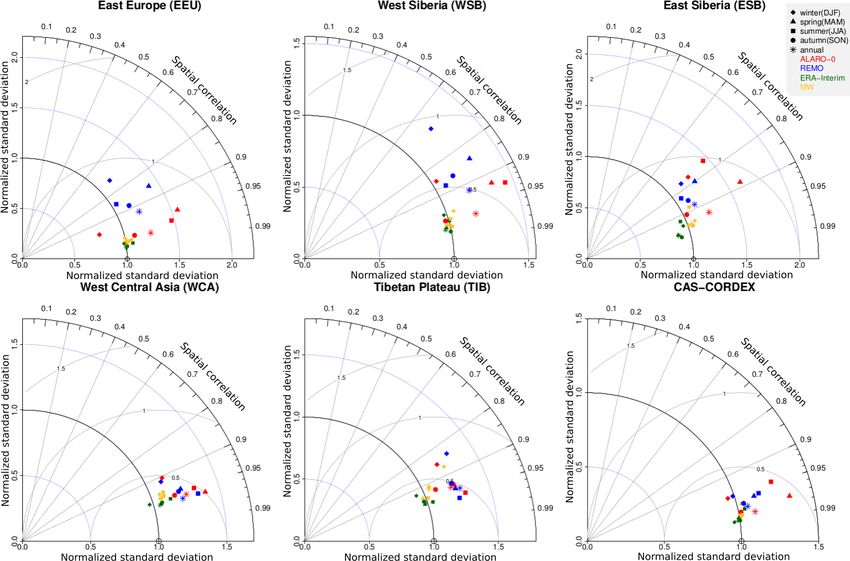
S. Top et al.: Evaluation of regional climate models ALARO-0 and REMO2015 at 0.22◦ resolution                                1275

Figure 4. Normalized Taylor diagram showing the spatial performance of mean temperature for seasonal and annual means for both RCMs
(ALARO-0 and REMO), the ERA-Interim reanalysis, and MW observational data with respect to CRU for the five subregions and the
complete CAS-CORDEX domain.

for the northern subregions. During spring the cold bias in         REMO) compared to the ERA-Interim reanalysis, MW, and
the north is limited to −5 ◦ C for REMO but not for ALARO-          CRU observational data over five subregions. From this fig-
0, which is reflected in a higher RSV for the northern re-          ure, it can be seen that in the northern subregions EEU and
gions. High RSVs are also observed for ALARO-0 in sum-              WSB there is on average a strong warm bias in Decem-
mer over the complete domain (Fig. 4), and this is due to           ber and January for ALARO-0, reaching a maximum of 4.1
the underestimation of the cold temperatures in cold regions,       and 5.8 ◦ C, respectively, during December. REMO simulates
while warm temperatures are overestimated in regions that           winter temperatures (months 12, 1, and 2) within the uncer-
are characterized by warmer temperatures (Fig. 3). This is          tainty range of the observational datasets for WSB and un-
reflected in a normalized standard deviation that is higher         derestimates the temperatures on average by 1.4 ◦ C in Jan-
than the one of REMO (Fig. 4). Comparing the metrics of the         uary for EU. REMO simulates warm biases around 2 ◦ C in
RCMs (Figs. 3, 4 and Table 2) shows that REMO is better in          December and January over ESB. On average there is no
simulating the seasonal variability in temperature compared         strong warm bias observed for ALARO-0 during the winter
to ALARO-0, except for the autumn in all subregions and             months in ESB (Table 2) due to the compensation effect of
winter in the WSB and TIB subregions. On the other hand,            cold biases in both time (Fig. 5) and space (Fig. 3). Further-
ALARO-0 often better captures spatial temperature patterns          more, there is a remarkable cold bias observed for ALARO-
since the spatial pattern correlation is slightly higher than for   0 during spring (months 3, 4, and 5) and June in the north-
REMO, except during winter and summer over the ESB and              ern subregions EEU, WSB, and ESB, reaching up to −7.3 ◦ C
WCA subregions and spring and summer over the TIB sub-              over ESB during April. REMO performs well during spring
region.                                                             months over the northern subregions. From Fig. 5, it can be
   Figure 5 shows the annual cycles of the mean, minimum,           seen that the RCMs simulate the spatially averaged temper-
and maximum temperature for both RCMs (ALARO-0 and                  atures well during the autumn months (months 9, 10, and

https://doi.org/10.5194/gmd-14-1267-2021                                              Geosci. Model Dev., 14, 1267–1293, 2021
1276 S. Top et al.: Evaluation of regional climate models ALARO-0 and REMO2015 at 0.22◦ resolution
Figure 5. Annual cycles of the mean, minimum, and maximum temperature for both RCMs (ALARO-0 and REMO) compared to the
ERA-Interim reanalysis, MW, and CRU observational data over five subregions.
11), since they are within the observational spread or deviate 3.2 Diurnal temperature range
slightly from the observational spread (< 1 ◦ C). The excep-
tions are the spatially averaged temperatures for ALARO-0 Here, we first discuss the model performance of both RCMs
over WSB and WCA in November when the spatially aver- for the minimum and maximum temperature and then the di-
aged temperature deviates 2 ◦ C from CRU. urnal range taken as the difference between the two.
Compared to the northern subregions, ALARO-0 simu- Similar to the mean temperature in Fig. 3, the modeled
lates the annual cycle better for the southern subregions daily minimum temperature averaged over the different sea-
WCA and TIB but slightly overestimates the amplitude of the sons and years during 1980–2017 is compared with the ob-
annual temperature cycle. REMO simulates the mean tem- servational CRU data in Fig. 6. Annual biases of the min-
perature well over the WCA subregion, with only a slight imum temperature over Russia in general vary between −3
overestimation of the temperatures in July and August. In the and 3 ◦ C for REMO and between −1 and 5 ◦ C for ALARO-0,
mountainous area of TIB REMO underestimates the temper- with a few exceptions in the orographically complex regions,
atures, except for January and December. The better results e.g., in the Stanovoy Range and Central Siberian Plateau
in spring, summer, and autumn for ALARO-0 over the sub- where higher biases are found.
region TIB are due to spatial averaging of cold biases in the Compared to ALARO-0, REMO shows larger warm bi-
northern Himalayas and warm biases over the Taklamakan ases over Mongolia during all seasons, except for summer.
Desert; the opposite is true for REMO during winter (Fig. 3). The warm biases for REMO in the eastern part of the domain
This effect is reflected by the large MAE over this subregion are most pronounced during winter, reaching up to 15 ◦ C.
during the mentioned seasons (Table 2). ALARO-0 also shows equally large biases, but they cover the
northern part of the domain. Moreover, strong cold biases are
present in the north during spring for both models, but they
are more pronounced for the ALARO-0 model, with biases
up to −10 ◦ C in the northeastern part of the domain. During
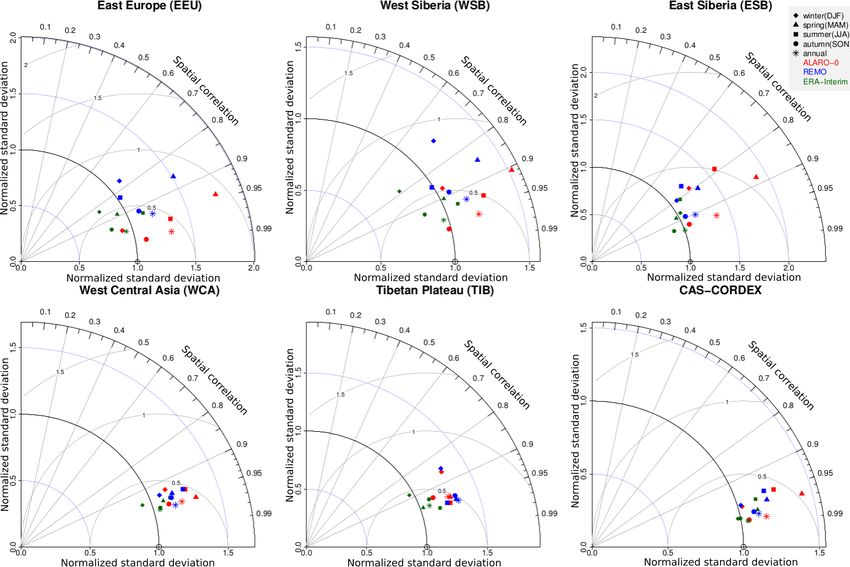
Geosci. Model Dev., 14, 1267–1293, 2021 https://doi.org/10.5194/gmd-14-1267-2021S. Top et al.: Evaluation of regional climate models ALARO-0 and REMO2015 at 0.22◦ resolution 1277 Figure 6. Left column: minimum air temperature (◦ C) at 2 m height over the CAS-CORDEX domain based on the observational CRU dataset for the 1980–2017 period on an annual level and for winter (DJF), spring (MAM), summer (JJA), and autumn (SON). Middle columns: difference in minimum temperature between the models and CRU. Right column: the range in minimum temperature (◦ C) between the different reference datasets (CRU and ERA-Interim). the summer season the biases for REMO are limited between late the minimum temperature accurately over the EEU and −5 and 7 ◦ C except for the Himalayan mountain range, while WSB subregions during summer since the errors are small the ALARO-0 model output has, except for the Himalayas, (MAE < 1 ◦ C). In general ALARO-0 has difficulties in sim- a cold bias up to −7 ◦ C in the northwestern part of Russia ulating the minimum temperature correctly in any season and and a warm bias up to 10 ◦ C in the southern and eastern part is only able to simulate the minimum temperature well over of the domain (Fig. 6). In autumn, both models have a warm the EEU region during autumn. bias over almost the entire domain, except for the cold bi- The normalized Taylor diagrams in Fig. 7 confirm that, in ases in mountainous areas, the Arabian Peninsula, northern general, the RCMs struggle to simulate the spatial pattern of Iran, western Russia, and for REMO also in the central north- minimum temperature well over the northeastern part of the ern part of the domain. The increased minimum temperatures domain (ESB), while on an annual level ALARO-0 is able obtained with the RCMs indicate that they do not capture the to simulate the spatial pattern well. The RCMs simulate the coldest diurnal temperatures. spatial pattern of minimum temperature well over the WCA Table 3 shows the spatially averaged biases and MAE for region. Additionally, ALARO-0 produces minimum temper- minimum temperature during the 1980–2017 period of both atures with a high spatial correlation with CRU over the EEU RCMs and ERA-Interim compared to the minimum tem- subregion compared to REMO. At an annual and seasonal peratures of CRU for the different seasons over the CAS- scale, except for summer in WSB, ESB, and TIB, ALARO-0 CORDEX domain and subregions. These scores confirm that has a slightly better spatial pattern correlation with the min- the RCMs ALARO-0 and REMO are not able to reproduce imum temperatures of the CRU dataset than REMO. On the the minimum temperature over the northern and eastern part other hand, REMO has a better centered RMSE and spatial of the domain during winter. During winter and spring, both variability during summer, except for the WCA region. models simulate minimum temperature best over the sub- Biases in Fig. 8 and Table 4 show that for both RCMs a region WCA, while during summer and autumn they both pronounced cold bias is present for maximum temperatures perform best over the EEU region. REMO is able to simu- over the northern part of the domain at the annual scale and https://doi.org/10.5194/gmd-14-1267-2021 Geosci. Model Dev., 14, 1267–1293, 2021
S. Top et al.: Evaluation of regional climate models ALARO-0 and REMO2015 at 0.22◦ resolution

                                                                                                                                                                                                                                                                            https://doi.org/10.5194/gmd-14-1267-2021
                                                                                                Table 3. Spatial average over the CAS-CORDEX domain and subdomains of climatological mean CRU minimum temperature (◦ C) for the 1980–2017 period, as well as biases (◦ C)
                                                                                                and MAE (◦ C) against CRU for REMO, ALARO-0, and ERA-Interim.
                                                                                                                                               EEU                                           WSB                                            ESB
                                                                                                                              DJF    MAM         JJA    SON     Annual       DJF    MAM        JJA     SON     Annual       DJF    MAM       JJA     SON     Annual
                                                                                                 CRU                       −13.56    −0.03      13.3     0.99      0.24      −20    −3.26     12.24   −2.48      −3.3    −30.12    −9.47     8.78   −9.27     −9.93
                                                                                                 REMO – CRU                 −2.21    −1.29      0.05     0.35    −0.77     −0.67    −1.16    −0.32      0.47    −0.42       3.64    0.87     1.77     2.48      2.18
                                                                                                 MAE REMO CRU                2.73     2.17      0.56     0.90     1.42      2.38     2.24     0.82      1.37     1.49       4.13    2.40     1.86     2.66      2.49
                                                                                                 ALARO – CRU                  5.10   −3.21    −0.79      0.45      0.37      7.15   −4.02    −1.51      1.26     0.69       4.74   −3.92     2.18     2.79      1.43
                                                                                                 MAE ALARO CRU                5.11    3.26     2.45      0.67      0.88      7.24    4.07     2.78      1.36     0.97       5.35    4.10     3.00     2.86      1.73
                                                                                                 ERA-Interim – CRU            0.24   −2.21    −1.38    −0.23     −0.90       0.81   −2.53    −1.19      0.86    −0.52       2.32   −0.83     1.85     2.18      1.38
                                                                                                 MAE ERA-Interim CRU          1.35    2.24     1.50     0.56      1.00       1.60    2.60     1.42      0.96     0.88       2.73    1.38     2.02     2.25      1.62
                                                                                                                                              WCA                                             TIB                                      CAS-CORDEX
                                                                                                                              DJF    MAM         JJA    SON     Annual       DJF    MAM        JJA     SON     Annual       DJF    MAM       JJA     SON     Annual
                                                                                                 CRU                        −3.02      7.93    18.54     7.84      7.87   −16.76    −3.35      7.76   −4.03     −4.04    −14.43    −0.22    13.18     0.40    −0.20
                                                                                                 REMO – CRU                   0.68     0.00     1.07     1.57      0.83      1.00   −1.70    −0.61      0.55    −0.19       0.77   −0.25     0.60     1.09      0.55
                                                                                                 MAE REMO CRU                  2.4     2.10     2.56     2.60      2.29      4.31    3.44     2.29      2.90     2.98       3.02    2.22     1.52     1.96      1.97

                                                                                                                                                                                                                                                                            Geosci. Model Dev., 14, 1267–1293, 2021
                                                                                                 ALARO – CRU                −1.00      0.34     3.05     1.27      0.92    −0.26      0.09     2.44     1.32     0.91       2.85   −1.71     1.10     1.42      0.90
                                                                                                 MAE ALARO CRU               2.43      2.60     3.82     2.30      2.31     2.80      3.06     3.86     2.55     2.71       4.07    3.21     2.93     1.88      1.59
                                                                                                 ERA-Interim – CRU          −0.84    −0.98      0.22     0.80    −0.19     −0.13    −1.44    −0.46      0.47    −0.39       0.39   −1.46     0.00     0.79    −0.08
                                                                                                 MAE ERA-Interim CRU         1.95     1.70      1.68     1.89     1.46      2.11     2.30     2.18      2.14     1.90       1.90    1.96     1.63     1.46     1.33
               1278
S. Top et al.: Evaluation of regional climate models ALARO-0 and REMO2015 at 0.22◦ resolution 1279 Figure 7. Normalized Taylor diagram showing the model spatial performance of the minimum temperature for seasonal and annual means for both RCMs (ALARO-0 and REMO) and ERA-Interim reanalysis with respect to CRU for the five subregions and the complete CAS- CORDEX domain. for all seasons, except for ALARO-0 in winter. During win- ing the Himalayas, the smallest range in biases is obtained ter, ALARO-0 produces warm biases up to 5 ◦ C in the north for both RCMs during this season. Based on the MAE in Ta- and cold biases in the southwest and northeast up to −15 ◦ C, ble 4, both RCMs show the best performance for maximum while REMO has cold biases up to −5 ◦ C in the northwest temperature during autumn, except for REMO over the TIB and up to −15 ◦ C on the Tibetan Plateau. ALARO-0 has the subregion and ALARO-0 over the EEU region. best performance over the EEU region during winter, while Figure 9 shows that for all seasons, both RCMs have a high REMO has the best performance over the WCA subregion spatial correlation (> 90%) and a normalized RSV close to 1 (Table 4 and Fig. 8). Both RCMs have a cold bias over a large for maximum temperature over the WCA subregion. This is area in the north during spring, which is very pronounced also the case for the TIB subregion, excluding the winter sea- for the ALARO-0 model in the northeast (< −15 ◦ C), while son. ALARO-0 has a high spatial correlation over the EEU the biases remain limited to −7 ◦ C for REMO (Fig. 8). The subregion during all seasons and over the WSB subregion ex- numbers in Table 4 confirm that during spring, the maximum cept for winter. Both RCMs struggle the most with reproduc- temperature over the northern part of the domain deviates ing the spatial patterns over the ESB subregion. ALARO-0 strongly (MAE > 2.50 ◦ C) from CRU for both RCMs. Dur- has higher spatial pattern correlations with CRU compared ing summer, these cold biases are reduced, with biases up to to REMO, except for autumn over the TIB subregion and −5 ◦ C for REMO and −10 ◦ C for ALARO-0. Both models winter over the ESB and WCA subregions. have warm and cold biases in the southern part of the do- REMO more often has a normalized RSV value closer to main during spring and summer. In autumn, the cold bias in 1 than ALARO-0 for the different subregions and seasons. the north is limited to −3 ◦ C, but some stronger biases up to Additionally, it is seen that both RCMs overestimate the nor- −7 ◦ C appear in the northeast for the ALARO-0 model. The malized RSV of the maximum temperature for each subre- warm biases during autumn are limited to 5 ◦ C, and, exclud- gion and season, except for winter in EEU and summer and https://doi.org/10.5194/gmd-14-1267-2021 Geosci. Model Dev., 14, 1267–1293, 2021
S. Top et al.: Evaluation of regional climate models ALARO-0 and REMO2015 at 0.22◦ resolution

                                                                                                                                                                                                                                                                            https://doi.org/10.5194/gmd-14-1267-2021
                                                                                                Table 4. Spatial average over the CAS-CORDEX domain and subdomains of climatological mean CRU maximum temperature (◦ C) for the 1980–2017 period, as well as biases (◦ C)
                                                                                                and MAE (◦ C) against CRU for REMO, ALARO-0, and ERA-Interim.
                                                                                                                                              EEU                                           WSB                                            ESB
                                                                                                                             DJF    MAM         JJA    SON     Annual       DJF    MAM        JJA     SON     Annual       DJF    MAM        JJA     SON    Annual
                                                                                                 CRU                       −6.50     10.23    24.91     8.57      9.38   −10.94      8.04   24.13     6.74      7.08   −18.52      4.78    21.97     1.93      2.64
                                                                                                 REMO – CRU                −1.58    −2.27    −2.42    −1.25     −1.89     −0.87    −1.77    −2.44    −1.59    −1.67       2.03    −2.42   −1.62    −0.74     −0.70
                                                                                                 MAE REMO CRU               1.67     2.77     2.43     1.27      1.90      2.03     2.61     2.50     1.69     1.91       2.50     2.81    1.77     1.01      1.33
                                                                                                 ALARO – CRU                 1.34   −6.06    −3.36    −1.47     −2.41       1.97   −7.10    −3.83    −1.68    −2.69      −1.85    −9.87   −1.28    −1.51     −3.64
                                                                                                 MAE ALARO CRU               1.40    6.06     3.47     1.49      2.46       2.54    7.14     3.97     1.71     2.74       3.90     9.94    2.22     1.78      3.80
                                                                                                 ERA-Interim – CRU         −0.48    −2.65    −3.02    −1.33     −1.88     −0.47    −2.13    −2.63    −0.39    −1.41      −0.65    −4.17   −1.14    −0.64     −1.66
                                                                                                 MAE ERA-Interim CRU        0.92     2.65     3.04     1.36      1.88      1.21     2.20     2.75     0.90     1.55       1.78     4.20    1.40     0.99      1.77
                                                                                                                                              WCA                                            TIB                                      CAS-CORDEX
                                                                                                                             DJF    MAM         JJA    SON     Annual       DJF    MAM        JJA     SON     Annual       DJF    MAM        JJA     SON    Annual
                                                                                                 CRU                         7.53     20.8    33.47    21.98    21.01     −2.86    10.73    21.00    10.13      9.81     −4.29    11.97    25.34    11.06     11.09
                                                                                                 REMO – CRU                −0.04      0.18     0.26     0.07      0.11    −1.13    −1.90    −1.15    −1.77    −1.49       0.08    −1.24   −1.07    −0.71     −0.74
                                                                                                 MAE REMO CRU               1.49      1.66     2.00     1.43      1.44     3.22     3.23     2.56     2.88     2.84       2.15     2.49    2.08     1.48      1.75

                                                                                                                                                                                                                                                                            Geosci. Model Dev., 14, 1267–1293, 2021
                                                                                                 ALARO – CRU               −2.31    −1.24      0.15   −1.32     −1.18     −3.68    −2.20    −0.07    −1.47    −1.85      −0.77    −4.84   −1.46    −1.24     −2.08
                                                                                                 MAE ALARO CRU              2.73     2.28      2.16    1.87      1.89      3.96     3.12     2.74     2.24     2.59       2.63     5.54    2.79     1.70      2.61
                                                                                                 ERA-Interim – CRU         −1.25    −1.10    −1.14    −1.33     −1.21     −0.93    −2.03    −1.90    −0.90    −1.45      −0.84    −2.43   −1.77    −0.80     −1.46
                                                                                                 MAE ERA-Interim CRU        2.02     1.76     1.86     1.66      1.61      2.01     2.61     2.93     2.28     2.23       1.53     2.86    2.34     1.36      1.82
               1280
S. Top et al.: Evaluation of regional climate models ALARO-0 and REMO2015 at 0.22◦ resolution 1281 Figure 8. Left column: maximum air temperature (◦ C) at 2 m height over the CAS-CORDEX domain based on the observational CRU dataset for the 1980–2017 period on an annual level and for winter (DJF), spring (MAM), summer (JJA), and autumn (SON). Middle columns: difference in maximum temperature between the models and CRU. Right column: the range in maximum temperature (◦ C) between the different reference datasets (CRU and ERA-Interim). autumn in WSB (Fig. 9). Based on Figs. 8 and 9, both RCMs REMO overestimates the minimum temperatures during the simulate the maximum temperature best during autumn. complete annual cycle for ESB, while the maximum temper- Finally, comparing the minimum to the maximum temper- atures in ESB are only overestimated during winter and un- ature, it can be seen that minimum temperature (Table 3 and derestimated during spring and summer. Both RCMs under- Fig. 5) shows warmer biases than the mean temperature (Ta- estimate the maximum temperatures of CRU for the entire ble 2 and Fig. 3) over the different seasons, except for winter annual cycle over the Tibetan Plateau subregion. ALARO- in EEU and WSB and spring in WSB and TIB. On the other 0 overestimates minimum temperatures during the summer hand, the maximum temperature (Table 4 and Fig. 7) shows months, while REMO slightly overestimates winter and un- colder biases compared with the mean temperature, except derestimates summer minimum temperatures. for winter and spring in WCA and summer in TIB. The in- creased minimum temperatures obtained with the RCMs in- 3.3 Precipitation dicate that they do not capture the coldest diurnal tempera- tures, nor do they capture the warmest diurnal temperatures Figure 10 and Table 5 respectively present the spatial pat- because of the decreased maximum temperatures. From this tern of precipitation and the spatially averaged precipitation it can be concluded that the daily temperature range is gen- over the 1980–2017 period for CRU over the full domain and erally underestimated by both RCMs. subregions; the relative biases and MAE of the RCMs with Moreover, the annual cycles in Fig. 5 show that both respect to CRU during the different seasons and on an annual minimum and maximum temperatures are overestimated by level are presented as well. ALARO-0 during winter in the northern part of the domain, At the annual level, REMO mainly shows a wet bias in while they are underestimated during spring. In summer the the northern and eastern part of the domain and a dry bias model is able to evolve to a more accurate balanced state and in the southwestern part of the domain, while ALARO-0 has to simulate spatially averaged minimum temperatures as they a wet bias in the northwest and southeast (Fig. 10). Further- are observed, resulting in better model results during autumn. more, a strong wet bias is persistent over the annual cycle for https://doi.org/10.5194/gmd-14-1267-2021 Geosci. Model Dev., 14, 1267–1293, 2021
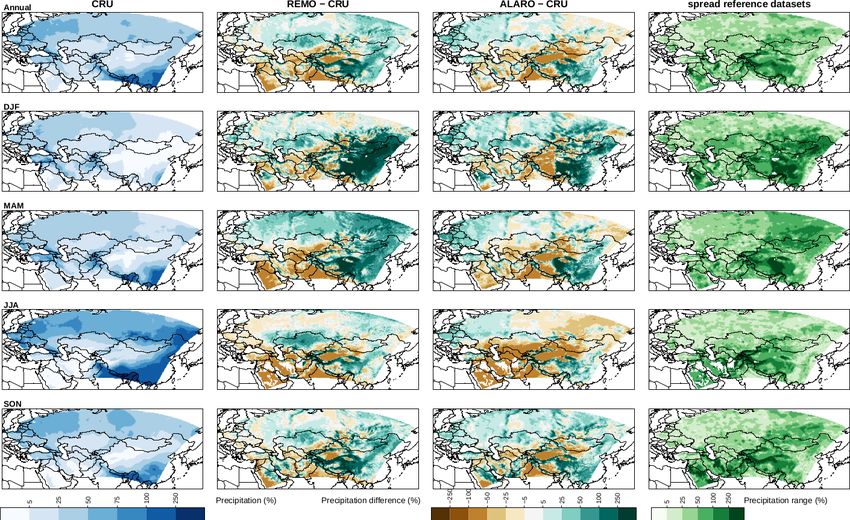
1282                   S. Top et al.: Evaluation of regional climate models ALARO-0 and REMO2015 at 0.22◦ resolution

Figure 9. Normalized Taylor diagram showing the model spatial performance in terms of the maximum temperature for seasonal and annual
means for both RCMs (ALARO-0 and REMO) and ERA-Interim reanalysis with respect to CRU for the five subregions and the complete
CAS-CORDEX domain.

both RCMs over the East Asian monsoon region, with a less            and S1). In summer, both RCMs have a dry bias over the
notable wet bias during summer.                                      southwestern part of the domain. The Taklamakan and Ara-
   For both RCMs the overall bias for precipitation is wet,          bian deserts are located in these areas with a dry bias. In
except for spring and summer in the WCA subregion and                Fig. S4, the absolute dry biases over these regions are less
for ALARO-0 during summer in WSB, winter in WCA, and                 pronounced (> −25 mm per month). The dry biases over the
spring and summer in the ESB subregion. Next to the wet              southwestern part of the domain result in spatially averaged
biases in the monsoon region, both models show dry biases            negative biases for precipitation over the WCA subregion in
over the Taklamakan Desert, except for winter.                       spring and summer for both RCMs (Table 5). Additionally, a
   During winter both RCMs have a strong wet bias in the             smaller relative wet bias is present over the East Asian mon-
eastern part of the domain (Fig. 10 and Table 5). This is partly     soon region during summer compared to the other seasons
due to the low observed precipitation quantities in several          (Fig. 10). This is related to the higher precipitation rates in
regions, e.g., less than 5 mm per month in the Gobi Desert           the southeastern part of the domain during summer due to the
region. Some of the largest relative biases can be found in          East Asian monsoon. Moreover, both RCMs have a dry bias
relatively dry regions, and therefore the absolute biases are        in the northern part of the domain during summer (Fig. S4).
presented in Fig. S4 and Table S2.                                   For REMO this dry bias is situated in the northwestern part
   In spring, a clear wet bias is present for REMO over the          of the domain, and for ALARO-0, a stronger dry bias is sit-
complete northern part of the domain and for ALARO-0 over            uated in the northeastern part of the domain, resulting in a
the northwestern part, while a strong dry bias is present in the     significant dry bias over the ESB subregion (Table 5). Fur-
southwestern part of the domain for both RCMs (Fig. 10).             thermore, the dry bias over the Taklamakan Desert is more
The wet bias for REMO over ESB during spring is low in ab-           pronounced in summer. In autumn, both RCMs mainly pro-
solute values when compared to the subregion TIB (Figs. 12           duce a wet bias over the CAS-CORDEX domain, excluding

Geosci. Model Dev., 14, 1267–1293, 2021                                               https://doi.org/10.5194/gmd-14-1267-2021
You can also read


