Radiative and chemical implications of the size and composition of aerosol particles in the existing or modified global stratosphere - Recent
←
→
Page content transcription
If your browser does not render page correctly, please read the page content below
Atmos. Chem. Phys., 21, 8915–8932, 2021
https://doi.org/10.5194/acp-21-8915-2021
© Author(s) 2021. This work is distributed under
the Creative Commons Attribution 4.0 License.

Radiative and chemical implications of the size and composition of
aerosol particles in the existing or modified global stratosphere
Daniel M. Murphy1 , Karl D. Froyd1,2 , Ilann Bourgeois1,2 , Charles A. Brock1 , Agnieszka Kupc1,2,3 , Jeff Peischl1,2 ,
Gregory P. Schill1,2 , Chelsea R. Thompson1,2 , Christina J. Williamson1,2 , and Pengfei Yu4
1 NOAA     Chemical Sciences Laboratory, Boulder, CO 80305, USA
2 Cooperative   Institute for Research in Environmental Sciences, University of Colorado, Boulder, CO 80309, USA
3 Faculty of Physics, Aerosol Physics and Environmental Physics, University of Vienna, 1090 Vienna, Austria
4 Institute for Environment and Climate Research, Jinan University, Guangzhou, China

Correspondence: Daniel M. Murphy (daniel.m.murphy@noaa.gov)

Received: 28 August 2020 – Discussion started: 22 September 2020
Revised: 28 April 2021 – Accepted: 29 April 2021 – Published: 11 June 2021

Abstract. The size of aerosol particles has fundamental ef-         ratory studies of stratospheric heterogeneous chemistry. We
fects on their chemistry and radiative effects. We explore          then extend the analysis of size-dependent properties to par-
those effects using aerosol size and composition data in the        ticles injected into the stratosphere, either intentionally or
lowermost stratosphere along with calculations of light scat-       from volcanoes. There is no single size that will simultane-
tering. In the size range between about 0.1 and 1.0 µm di-          ously maximize the climate impact relative to the injected
ameter (accumulation mode), there are at least two modes            mass, infrared heating, potential for heterogeneous chem-
of particles in the lowermost stratosphere. The larger mode         istry, and undesired changes in direct sunlight. In addition,
consists mostly of particles produced in the stratosphere,          light absorption in the far ultraviolet is identified as an is-
and the smaller mode consists mostly of particles trans-            sue requiring more study for both the existing and potentially
ported from the troposphere. The stratospheric mode is sim-         modified stratosphere.
ilar in the Northern and Southern Hemisphere, whereas the
tropospheric mode is much more abundant in the North-
ern Hemisphere. The purity of sulfuric acid particles in the
stratospheric mode shows that there is limited production of        1   Introduction
secondary organic aerosol in the stratosphere, especially in
the Southern Hemisphere. Out of eight sets of flights sam-          Stratospheric particles have been studied for over 60 years
pling the lowermost stratosphere (four seasons and two hemi-        (Junge and Manson, 1961; reviewed by Kremser et al., 2016).
spheres) there were three with large injections of specific ma-     The stratospheric aerosol layer has a maximum in mixing
terials: volcanic, biomass burning, or dust. The stratospheric      ratio between about 20 and 25 km altitude. However, the
and tropospheric modes have very different roles for radiative      larger air density at lower altitudes means that the major-
effects on climate and for heterogeneous chemistry. Because         ity of the mass of stratospheric aerosol is in the lowermost
the larger particles are more efficient at scattering light, most   stratosphere, below the maximum in mixing ratio (Yu et al.,
of the radiative effect in the lowermost stratosphere is due to     2016).
stratospheric particles. In contrast, the tropospheric particles        Various trends have been reported for the background
can have more surface area, at least in the Northern Hemi-          stratospheric aerosol at times not influenced by major vol-
sphere. The surface area of tropospheric particles could have       canic eruptions. Deshler et al. (2006) concluded there was
significant implications for heterogeneous chemistry because        little long-term change in background stratospheric aerosol
these particles, which are partially neutralized and contain        from 1971 to 2004. Hofmann et al. (2009) found an increas-
organics, do not correspond to the substances used for labo-        ing trend after 2000, and Friberg et al. (2014) found an in-
                                                                    creasing trend from 1999 to 2008. There has been recog-

Published by Copernicus Publications on behalf of the European Geosciences Union.
8916                                 D. M. Murphy et al.: The size and composition of aerosol particles in the stratosphere

nition that moderate volcanic eruptions frequently influence       2   Methods
the stratospheric aerosol and true non-volcanic “background”
concentrations are not necessarily present just because there      This paper includes data in the lowermost stratosphere from
has been no Pinatubo-scale eruption (Solomon et al., 1996,         the Atmospheric Tomography (ATom) mission with deploy-
Vernier et al., 2011). Different altitudes may exhibit differ-     ments in four seasons during 2016 to 2018. Although the
ent trends (Khaykin et al., 2017). Moderate volcanic erup-         ATom mission was not specifically designed to sample the
tions tend to mask trends in the non-volcanic background           stratosphere, it encountered stratospheric air in both the
(Kremser et al., 2016). The data shown here reinforce the no-      Northern and Southern Hemisphere during its regular ver-
tion of modest but frequent perturbations to the lower strato-     tical profiles. Stratospheric air was encountered periodically
sphere.                                                            at altitudes greater than about 7 km and latitudes poleward
   The overall circulation of air in the stratosphere, with ris-   of about 30◦ N or 35◦ S (Fig. S1 and Table S1 in the Sup-
ing air in the tropics and descending air in the extratropics,     plement). Because the NASA DC8 aircraft has a ceiling of
is mostly fed by air entering at the tropical tropopause. The      about 12 km, stratospheric air was always associated with
lowermost stratosphere is a region at middle and high lati-        low tropopauses, sometimes in tropopause folds. We there-
tudes between the local tropopause and slightly above the al-      fore use ozone rather than altitude as the primary definition
titude of the tropical tropopause. Air in this lowermost strato-   of how far into the stratosphere measurements were taken.
sphere is affected by both downward motion in the extratrop-       If there were mixing with a great deal of tropospheric air, it
ical stratosphere and adiabatic mixing with the troposphere        would reduce the ozone concentration below the thresholds
(Holton et al., 1995). The tropospheric influence can extend       we set for stratospheric measurements. Data below 7 km al-
as high as about 450 K potential temperature (Rosenlof et al.,     titude were excluded just in case there were unusually high
1997). All of the data described here are in the lowermost         ozone concentrations at low altitude.
stratosphere and show the influence of both air from higher           Size distributions for accumulation-mode particles were
in the stratosphere and air from the troposphere.                  measured using two modified commercial laser optical parti-
   The chemical composition of particles in the lower strato-      cle spectrometers: an ultra-high-sensitivity aerosol spectrom-
sphere has been measured by several techniques. Impactor           eter (UHSAS; Droplet Measurement Technologies, Long-
samples collected from the CARIBIC platform have been              mont, USA) from 0.07 to 0.6 µm diameter and a laser aerosol
quantitatively analyzed for N, O, S, K, Fe, and other elements     spectrometer (LAS, TSI Inc., St. Paul, USA) from 0.6 to
(Nguyen and Martinsson, 2007; Friberg et al., 2014; Martins-       ∼ 4.8 µm diameter (Kupc et al., 2018; Brock et al., 2019).
son et al., 2019). The moles of oxygen were approximately          The diameters are based on calibration by ammonium sulfate
4 times the moles of sulfur, plus about 0.2 times the moles        particles. The size resolution of the reported data is 20 bins
of carbon, indicating SO4 in sulfate and sulfuric acid plus        per decade of particle size. Data are recorded at 1 s intervals
some contribution from oxygenated organics. Much of the            although averaging is needed in the stratosphere to improve
detailed information on the chemical composition of aerosols       counting statistics for particles in the LAS size range (Brock
in the lower stratosphere has come from the Particle Analysis      et al., 2019). Ozone measurements are described by Bour-
by Laser Mass Spectrometry (PALMS) instrument (Murphy              geois et al. (2020).
et al., 1998), which analyzes individual particles. These data        Particle composition was measured with the PALMS in-
show that most particles larger than about 110 nm fall into        strument (Thomson et al., 2000; Froyd et al., 2019). A
three distinct types: sulfuric acid with or without meteoric       pressure-controlled aerodynamic focusing inlet brings par-
metals and internally mixed organic–sulfate particles from         ticles into a vacuum where they cross two continuous laser
the troposphere (Murphy et al., 2014). Because the pure sul-       beams. The transit time between the beams measures the
furic acid particles do not contain biomass burning residues,      aerodynamic diameter of each particle. The aerodynamic di-
they are not simply tropospheric particles that have lost or-      ameters are under vacuum conditions with most particles
ganics after entering the stratosphere (Murphy et al., 2007).      much smaller than the mean free path at the inlet exhaust.
Recent data from another single-particle mass spectrometer         Transition flow corrections are considered. Transit times
have found comparable abundances of sulfuric acid particles        were calibrated to known particle sizes before and after ev-
with meteoric metals (Schneider et al., 2021).                     ery field deployment. A 193 nm pulse from an excimer laser
   We extend the previous results to show that the mixed           is triggered when a particle arrives at the second laser beam.
organic–sulfate particles from the troposphere are generally       Either positive or negative ions are analyzed with a time-of-
smaller than both types of sulfuric acid particles. We then        flight mass spectrometer. The polarity was switched every
show how this size difference has significant implications for     few minutes. Most of the data shown here are from positive
light scattering and heterogeneous chemistry.                      ion spectra. Negative ion spectra do not distinguish sulfuric
                                                                   acid with and without meteoric metals because the metal ions
                                                                   only appear in the positive ion spectra.

Atmos. Chem. Phys., 21, 8915–8932, 2021                                             https://doi.org/10.5194/acp-21-8915-2021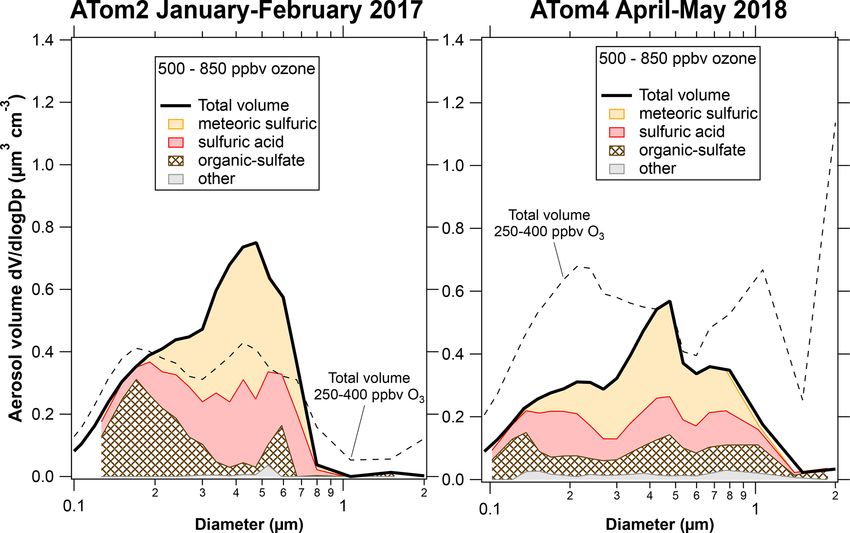
D. M. Murphy et al.: The size and composition of aerosol particles in the stratosphere                                         8917

   The optical size distributions are combined with the             to ± 50 % above 1 µm (Kupc et al., 2018; Brock et al., 2019).
PALMS single-particle composition data for particles larger         Excellent agreement between extinctions calculated from the
than 100 nm to create size distributions that are resolved by       size distributions and independent extinction measurements
composition. In each size range, the number of particles is         indicates that systematic errors may actually be less than this
obtained from the optical size distributions, and the frac-         (Brock et al., 2019). Because PALMS measures aerodynamic
tion of particles with different compositions is obtained from      diameters, mapping the PALMS spectra onto the optical size
PALMS. This combination requires converting the PALMS               distributions requires particle density and shape (Froyd et al.,
aerodynamic diameters to correspond to the optical diame-           2019). These are well known for sulfuric acid particles and
ters (Froyd et al., 2019). The composition-resolved size dis-       less so for some particles, such as dust. How uncertainty in
tributions presented here use wider size bins than the native       density affects the combination of PALMS and optical data
optical particle counter resolution but narrower size bins than     depends on the shape of the size distribution and the num-
the standard ATom products (Froyd et al., 2019). The nar-           ber of types of particles. In cases with flat size distributions
rower bins are possible because of improved statistics after        or where only one dominant type of particle is present, un-
averaging over all of the data within a specific band of ozone      certainty in density introduces very little additional uncer-
and latitude, even if those data were not contiguous in time.       tainty when combing PALMS data with size distributions.
   For the purpose of this study particles are classified into      The uncertainty is larger if there are several types of particles
four basic categories: sulfuric acid with and without mete-         present in a size range with rapidly changing particle volume
oric metals; mixed organic–sulfate particles; and other par-        vs. size. Statistical uncertainty in the fractional organic con-
ticles, including dust. Example spectra are shown in Mur-           tent of mixed particles is less than 10 % if at least dozens of
phy et al. (2014). When appropriate, further distinctions can       mass spectra are averaged (Froyd et al., 2019).
be made, such as separating biomass burning particles from             Calculations of light scattered back to outer space are
other mixed organic–sulfate particles. The sulfuric acid parti-     made using Mie scattering for an optically thin layer uni-
cles, either with or without meteoric metals, originate in the      formly spread over a sunlit hemisphere as described by Mur-
stratosphere. The organic–sulfate and most other particles,         phy (2009), except that these calculations use an atmospheric
such as dust, originate in the troposphere or at the surface        transmittance appropriate for approximately 11 km altitude
and mix into the stratosphere.                                      (Arveson et al., 1969). Changing the solar spectrum over the
   Sources of uncertainty include particle statistics, identify-    entire range from the top of the atmosphere to the surface
ing particle types, the particle volume from the optical par-       gives qualitatively similar results. At the low relative humidi-
ticle counters, and combining the PALMS spectra with the            ties in the stratosphere, water uptake is less important for op-
optical size distributions Overall statistics are excellent, with   tical properties than it is in the troposphere. The mean rel-
approximately 800 000 single-particle mass spectra acquired         ative humidity for the ATom data at ozone > 250 ppbv was
above 7 km altitude during ATom. Of those, approximately            less than 10 %.
78 000 were positive ion spectra at ozone concentrations               A sectional aerosol model (CARMA) coupled with the
larger than 250 ppbv (Table S1). However, low ambient num-          NSF/DOE Community Earth System Model (CESM) is used
ber densities for large particles result in fewer mass spectra      in the study to simulate the composition and size distribu-
of particles larger than about 1 µm, leading to statistical noise   tions of stratospheric aerosols (Yu et al., 2015; Toon et al.,
for large particles visible in the figures in this paper. Ex-       1988). CESM-CARMA tracks two externally mixed groups
cept for ATom4 Northern Hemisphere, particles larger than           of aerosols. The first group consists of pure sulfate parti-
1 µm contributed only a very small fraction of the aerosol          cles (formed through nucleation and condensation of wa-
volume in the lower stratosphere. Classification uncertainty        ter vapor and sulfuric acid) with 20 size bins ranging from
depends on the type of particle. The meteoric-sulfuric par-         0.4 nm to 2.6 µm in diameter; the second group consists
ticles are very distinctive. From manually examining mass           of internally mixed aerosols (containing condensed sulfate,
spectra we estimate that only a few percent are incorrectly         organics, black carbon, salt, and dust) with 20 size bins
classified. Sulfuric acid particles are more difficult to clas-     from 0.1 to 17 µm. The model does not explicitly separate
sify because some tropospheric particles with low organic           meteoric-sulfuric particles from other sulfuric acid particles.
content are similar to stratospheric sulfuric acid particles.       The model includes secondary organic chemistry (Yu et al.,
The criteria used here probably err on the side of underes-         2015). The model is run at a horizontal resolution of 1.9◦
timating tropospheric particles in the lower stratosphere, es-      (latitude) × 2.5◦ (longitude). It has 56 vertical layers from
pecially in the Southern Hemisphere. Using various criteria         the surface to 1.8 hPa with a vertical resolution of ∼ 1 km
for separating organic–sulfate and sulfuric acid particles sug-     near the tropopause.
gests a classification uncertainty of up to 25 % for those parti-
cle types in the lower stratosphere. With sufficient averaging
(minutes), the volume derived from optical size distributions
has an uncertainty propagated from size and flow uncertain-
ties of about +13 %/−28 % in the accumulation mode and up

https://doi.org/10.5194/acp-21-8915-2021                                             Atmos. Chem. Phys., 21, 8915–8932, 2021
8918                                D. M. Murphy et al.: The size and composition of aerosol particles in the stratosphere

3   Composition-resolved size distributions in the                   Of the eight cases in Fig. 1, three have much higher aerosol
    stratosphere                                                  concentrations than the others, for three very different rea-
                                                                  sons. The ATom1 wintertime Southern Hemisphere had a
Figure 1 shows the composition-resolved size distributions        mode of pure sulfuric acid particles. These were most likely
measured in the lowermost stratosphere for the four ATom          produced from SO2 injected into the stratosphere by the Cal-
deployments, separated by the Northern and Southern Hemi-         buco eruption in April 2015, about 16 months before the
sphere. The data are for ozone between 250 and 400 ppbv.          measurements (Bègue et al., 2017). The sulfuric acid parti-
This range of ozone is chosen to be definitely in stratospheric   cles are remarkably pure, except for associated water. This
air and to include data from both hemispheres on all four de-     is consistent with previous data on aerosol volatility and
ployments. For comparison, the median ozone concentration         infrared spectra after the eruption of Mt. Pinatubo (Desh-
at the lapse rate thermal tropopause was slightly less than       ler et al., 1992; Grainger et al., 1993). The size distribu-
100 ppbv. On each panel the thick black line is the size dis-     tion is also quite narrow, with a geometric standard devia-
tribution from the optical particle counters. At each size the    tion, σg , of 1.29 for just the sulfuric acid particles (Table 1).
fraction of particle types from PALMS is shaded. A number         Satellite aerosol retrievals may use wider size distributions.
of features in Fig. 1 are worthy of comment.                      For example, Bauman et al. (2003) use a lookup range for
   The volume distributions show a peak near 400 nm diam-         σg of 1.3 to 2.3 and show that retrievals may not find so-
eter and another peak, or at least a shoulder, near 180 or        lutions if σg ≈ 1.1. The size distribution of these volcanic
200 nm. These sizes are both within what is considered the        particles suggests caution in satellite and lidar retrievals of
accumulation mode. The composition reveals why there are          stratospheric aerosols dominated by one source of particles
two modes. Indeed, without the composition it would be dif-       grown by condensation of sulfuric acid. As can be seen in
ficult to be sure that there were two separate modes. For ex-     Fig. 1, overall size distributions typically are not this nar-
ample, the Wyoming particle counters used on stratospheric        row because they are broadened with particles from multiple
balloon flights (Deshler et al., 2003) do not clearly resolve     sources.
the modes.                                                           The ATom3 Northern Hemisphere had a large tropo-
   The 400 nm mode is from sulfuric acid particles produced       spheric organic–sulfate contribution. More detailed compo-
in the stratosphere, especially those with meteoric metals.       sition shows that these included a large fraction of biomass
The size of these meteoric-sulfuric particles is extremely        burning particles. The ATom3 flights were about 2 months
consistent through both hemisphere and the four deploy-           after Canadian fires produced a massive injection of smoke
ments (Table 1). The primary source of sulfuric acid in the       into the stratosphere, with additional injection rising through
stratosphere, oxidation of carbonyl sulfide, is similar in the    the tropopause due to diabatic heating (Torres et al., 2020).
two hemispheres. The meteoric-sulfuric particles also have        A separate paper is in preparation about the in situ data from
a narrow size distribution, with a typical geometric standard     this wildfire event. The ATom4 springtime Northern Hemi-
deviation of about 1.4 when fit with a lognormal distribution.    sphere had both a large contribution from organic–sulfate
This is consistent with condensational growth, which tends        particles and a remarkable amount of dust at and above the
to lead to narrow size distributions because smaller particles    tropopause. Concentrations at the tropopause often reached
have relatively more surface area for condensation. Sulfuric      several micrograms per standard cubic meter. The dust was
acid particles without meteoric material have more diverse        very widespread: it was measured over both the North At-
sizes except for the volcanically influenced ATom1 Southern       lantic and North Pacific oceans over more than 40◦ of lati-
Hemisphere, when the sulfuric acid particles had a narrow         tude. This may be Asian dust and pollution carried to high
size distribution very similar to the meteoric-sulfuric parti-    altitude in an event similar to that described by Huang et al.
cles.                                                             (2008). The ATom4 and Huang et al. events were both in
   The smaller mode near 200 nm is from mixed organic–            May. A separate paper is also planned about this dust event.
sulfate particles that have mixed into the stratosphere. The         Figure 2 shows the CESM-CARMA model results for the
mass spectra of particles in the smaller mode are essen-          ATom2 flights for the same 250–400 ppbv range of ozone as
tially identical to those of particles in the upper troposphere   the data in Fig. 1. ATom2 is chosen because neither hemi-
(Fig. S2). Unlike studies that relied solely on bulk compo-       sphere was perturbed by volcanic sulfate, biomass burning,
sition (e.g., Martinsson et al., 2019), we identify the tropo-    or dust. The model reproduces the tropospheric mode well in
spheric contribution based on the mass spectra of individ-        the Northern Hemisphere but overestimates it in the South-
ual particles (Murphy et al., 2007). Comparing the Northern       ern Hemisphere. The model reproduces the total volume of
and Southern Hemisphere in Fig. 1, the concentration of the       stratospheric particles well in both hemispheres, but the mod-
smaller mode is larger in the Northern Hemisphere. The up-        eled diameter of these particles is too small. A possible rea-
per troposphere in the Southern Hemisphere has generally          son is that the model does not include meteoric smoke parti-
lower aerosol concentrations, so mixing in a given amount of      cles on which sulfuric acid can condense. That is, the model
tropospheric air will bring in fewer particles than the same      treats both the meteoric-sulfuric and sulfuric acid particles
amount of mixing in the Northern Hemisphere.                      observed by PALMS as a single type. Figure S3 compares

Atmos. Chem. Phys., 21, 8915–8932, 2021                                             https://doi.org/10.5194/acp-21-8915-2021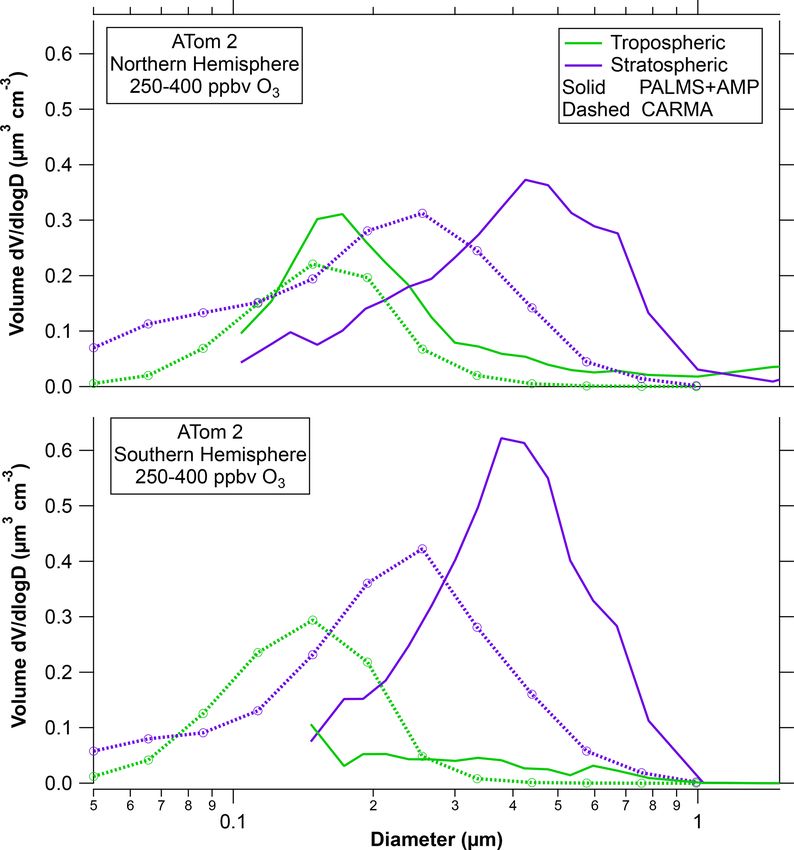
D. M. Murphy et al.: The size and composition of aerosol particles in the stratosphere                                                               8919

Figure 1. Composition resolved size distributions from the lower stratosphere during the Atmospheric Tomography (ATom) mission. The
size distributions from optical particle counter measurements are apportioned at each size into classes of particles based on the PALMS
single-particle composition data. The smallest few size bins sometimes had too few particles with PALMS mass spectra to apportion the
composition. Sizes in all figures are geometric diameter at low relative humidity, and concentrations are per standard cubic centimeter. Fine
structure in some total volume distributions at 0.6 µm and larger may be artifacts due to Mie resonances in the optical particle counter;
minima near 0.2 or 0.3 µm are robust.

Table 1. Total volumes and volumes and lognormal fit parameters for individual types of particles. Lognormal fits were performed for particle
volume, so the fit diameter is for the volume distribution. The volumes and fits are for the size range 0.1 to 1.7 µm diameter except as noted
(first column). Data are for 250–400 ppbv ozone except the last two rows, the data of which are for 500–850 ppbv. Volumes are per standard
cubic centimeter. Fits are to the equation V = a · exp(−(ln D − ln Dfit )2 /(2σ 2 )), where D is the diameter and a is a scaling factor. Each fit
is for a specific component. Fits were not attempted for “other” particles (mostly dust) because they did not generally show a defined mode.
Italics indicate a poor fit to a single lognormal shape.

                         Total volume              Meteoric-sulfuric                      Sulfuric                    Organic–sulfate            Other
                   6 nm–1.7 µm   0.1–1.7 µm    Volume    Fit diam.     Fit σ    Volume      Fit diam.    Fit σ    Volume    Fit diam.   Fit σ    Volume
                    µm3 cm−3     µm3 cm−3     µm3 cm−3      µm                 µm3 cm−3        µm                µm3 cm−3      µm               µm3 cm−3
  ATom1 NH             0.35         0.30       0.046        0.37       1.35     0.103         0.29        1.55    0.150       0.13      1.89     0.004
  ATom2 NH             0.35         0.33       0.083        0.46       1.44     0.115         0.35        2.14    0.124       0.17      1.45     0.005
  ATom3 NH             0.78         0.76       0.150        0.54       1.51     0.160         0.50        1.74    0.436       0.39      2.89     0.024
  Atom4 NH             0.68         0.64       0.066        0.44       1.49     0.175         0.22        2.15    0.292       0.30      2.04     0.107
  ATom1 SH             0.49         0.48       0.101        0.39       1.27     0.330         0.40        1.29    0.050       0.27      1.43     0.011
  ATom2 SH             0.32         0.31       0.110        0.40       1.39     0.147         0.39        1.64    0.052       0.12      1.80     0.001
  ATom3 SH             0.28         0.26       0.056        0.40       1.29     0.088         0.35        1.73    0.120       0.19      1.93     0.003
  ATom4 SH             0.19         0.17       0.040        0.36       1.47     0.090         0.16        2.30    0.033       0.20      2.94     0.004
  ATom2 NH high        0.40         0.39       0.156        0.42       1.36     0.122         0.40        1.64    0.112       0.18      1.36     0.005
  ATom4 NH high        0.37         0.35       0.132        0.41       1.59     0.104         0.31        2.57    0.093       0.38      3.64     0.021

https://doi.org/10.5194/acp-21-8915-2021                                                                Atmos. Chem. Phys., 21, 8915–8932, 2021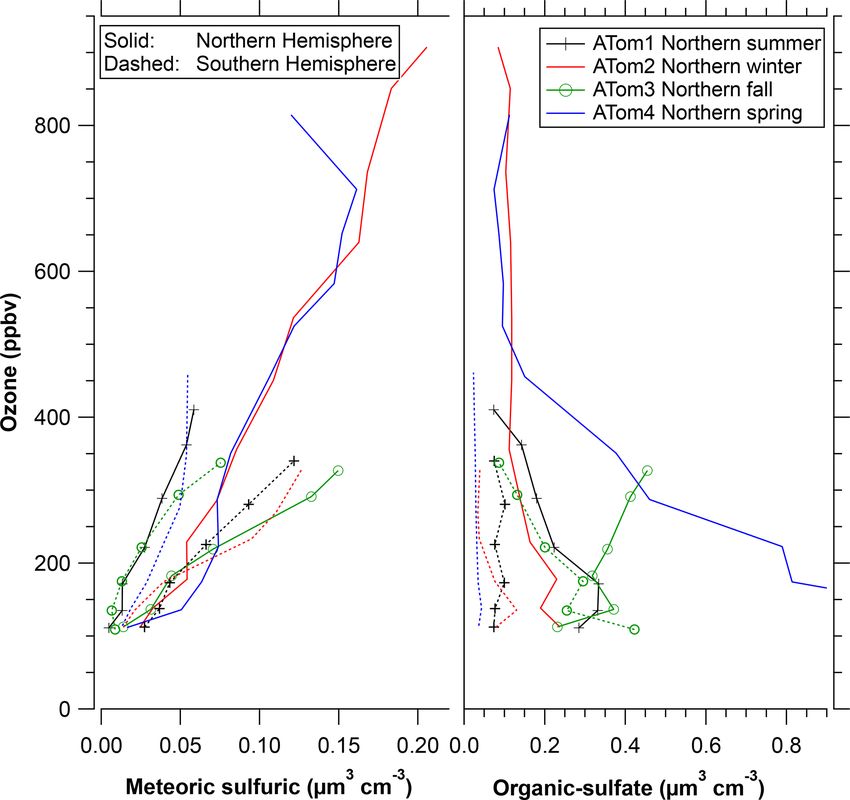
8920 D. M. Murphy et al.: The size and composition of aerosol particles in the stratosphere
and sulfuric particles, or their precursors, from near the sur-
face as well as dust.
Figure 4 can also be used to illustrate what features of the
size distributions are more certain or uncertain. The positions
and widths of the modes are robust, as are broad features such
as the presence of a bimodal organic–sulfate distribution for
ATom3. Narrow variations in the distributions, such as the
minimum near 0.55 µm in the ATom3 distribution, could be
due to gain stitching or Mie scattering effects in the optical
particle counters. In the bottom panel, the increased concen-
tration of particles larger than 1 µm during ATom4 compared
to the other deployments is robust, but the sharpness of the
increase at 2 µm could easily be due to limited statistics for
large particles.
4 Vertical profiles
The shaded regions in Fig. 1 can be integrated over all sizes
to determine the volume associated with each type of parti-
cle and then multiplied by a density to determine the mass.
Figure 5 shows vertical profiles of the volume concentrations
for the meteoric-sulfuric particles and organic–sulfate parti-
Figure 2. A comparison of the CARMA bin microphysics aerosol
cles. As expected for a high-altitude source, the concentra-
model in the CESM climate model with observed size distributions
during ATom2. Total particle volumes are proportional to areas un-
tion of meteoric-sulfuric particles increases with ozone con-
der each curve. The PALMS stratospheric particles are the sulfu- centration. Except for the ATom3 wildfire biomass burning
ric acid and meteoric-sulfuric acid types. Tropospheric particles are injection, the concentration of organic–sulfate particles de-
mixed organic–sulfate particles and less common other types. The creased with increasing ozone or, in one case, stayed roughly
model tracks stratospheric and tropospheric particles separately. constant. The concentration of the meteoric-sulfuric parti-
cles is fairly consistent between hemispheres and deploy-
ments. More measurements are needed to see if the small sea-
sonal differences are persistent in other years. In contrast, the
the Northern Hemisphere ATom data to Wilson et al. (2008). concentration of organic–sulfate particles was larger in the
Consistent with the ATom observations, the tropospheric par- Northern Hemisphere than in the Southern Hemisphere and
ticle mode at about 200 nm is in some cases distinct from the varied considerably between deployments. It is worth not-
larger stratospheric mode. ing that the highest concentration of tropospheric particles in
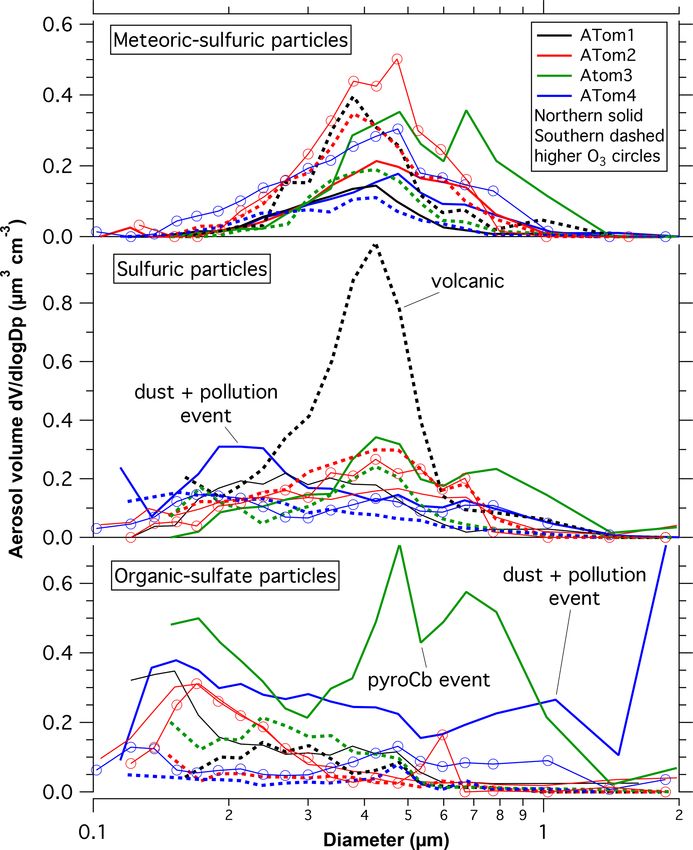
Figure 3 shows composition-resolved size distributions each hemisphere, ATom3 for the Southern Hemisphere and
further into the stratosphere with ozone between 500 and ATom4 for the Northern Hemisphere, was observed during
850 ppbv. Only the Northern Hemisphere during ATom2 and local springtime.
ATom4 had significant amounts of PALMS data in this ozone Figure 6 shows the ratio of the C+ peak, an indicator of
range. For ATom2, the primary difference at higher ozone organic content, to two peaks indicative of sulfate or sulfu-
was more meteoric-sulfuric particles, a result also found by ric acid. The top axis gives an approximate mass fraction of
Schneider et al. (2021). The large mixing event of dust and organics adapted from calibrations described by Froyd et al.
other tropospheric particles during ATom2 barely affected (2019). The vertical axis of ozone serves as a measure of
“altitudes” of more than 500 ppbv ozone. Figure 4 has some distance into the stratosphere. The organic content is sepa-
of the data in Figs. 1 and 3 replotted to emphasize the size rated by particle type, something not possible with bulk anal-
distributions of each component. The size distributions of the ysis. That the stratospheric and tropospheric particle compo-
meteoric-sulfuric particles are extremely consistent. The size sitions remain distinct implies that there is very limited re-
distributions of the sulfuric acid particles without meteoric distribution of semi-volatile organics between particles. Like
content are usually broader, possibly indicating more diverse most upper-tropospheric particles, the organic–sulfate par-
sources. One exception is the very narrow size distribution of ticles are internally mixed with on average about 40 % to
the particles after the Calbuco eruption. The ATom3 Northern 80 % organic material by mass. There is little variation with
Hemisphere has a mode of larger organic particles from the ozone, indicating a long lifetime for the organic material as
pyrocumulus injection event. The dust event in the Northern well as little uptake of sulfuric acid. The latter is consistent
Hemisphere during ATom4 also brought up organic–sulfate with most of the sulfuric acid coming from carbonyl sulfide
Atmos. Chem. Phys., 21, 8915–8932, 2021 https://doi.org/10.5194/acp-21-8915-2021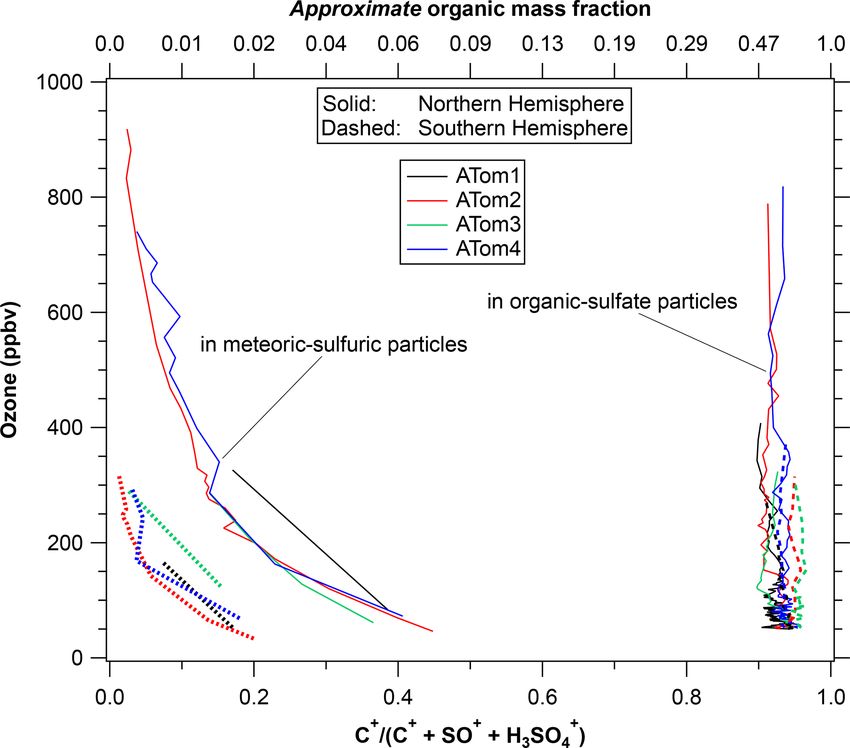
D. M. Murphy et al.: The size and composition of aerosol particles in the stratosphere                                                     8921

Figure 3. Composition-resolved size distributions for the times when data are available for ozone greater than 500 ppbv, all in the Northern
Hemisphere. The dashed curves are to facilitate comparison with Fig. 1.

                                                                          Figure 5. Profiles of the volume concentration of two types of parti-
                                                                          cles in the lower stratosphere, using ozone as a surrogate for a verti-
                                                                          cal coordinate. This does not include particles smaller than 0.1 µm.
                                                                          Sulfuric acid particles with meteoric metals have a high-altitude
Figure 4. Size distributions of several types of particles in the lower   source, whereas organic–sulfate particles, as selected by their mass
stratosphere. Northern Hemisphere data are solid, and Southern            spectra, originate in the troposphere. The organic–sulfate particles
Hemisphere data are dashed. Data are from 250 to 400 ppbv ozone           are more abundant in the Northern Hemisphere than they are in the
except the curves with circles, the data of which are at more than        Southern Hemisphere.
500 ppbv ozone. The three major events are noted where they may
have influenced the size distributions. Lognormal fits are given in
Table 1.

https://doi.org/10.5194/acp-21-8915-2021                                                     Atmos. Chem. Phys., 21, 8915–8932, 2021
8922 D. M. Murphy et al.: The size and composition of aerosol particles in the stratosphere
A new finding from ATom is that there is a very dis-
tinct and consistent difference between the hemispheres in
the small amount of organic content that does form in the
meteoric-sulfuric acid particles. Since the particles start from
similar formation processes much higher in the stratosphere,
we conclude that there is more condensable or reactive or-
ganic vapor in the Northern Hemisphere lower stratosphere.
This could be either gas-phase species mixed from the tropo-
sphere or semi-volatile organics transferring from organic–
sulfate particles.
Adding a few percent mass to the meteoric-sulfuric parti-
cles represents a very small amount of organic vapor. With-
out knowing uptake coefficients the amount of vapor cannot
be determined uniquely, but a representative calculation is
that 1 or 2 pptv of an organic gas-phase species with molec-
ular weight of about 100 Da that reacts with sulfuric acid on
every collision would add few percent mass to a 450 nm par-
ticle in a few months. The same order of magnitude can be
obtained by noting from Fig. 5 that at 200 ppbv ozone there
Figure 6. The organic content of two types of stratospheric particles is about 100 ng standard m−3 of meteoric-sulfuric particles.
using ozone as a surrogate for altitude. Shown are the relative areas One percent by mass of these particles corresponds to about
of the C+ peak in the mass spectra relative to two peaks indica-
1 ppt by mass of air. We conclude that an order of magni-
tive of sulfate. The top axis is an approximate mass fraction. The
organic–sulfate particles are about 40 % to 70 % organic by mass,
tude for highly condensable organic vapor in the lowermost
consistent with a tropospheric source. The sulfuric acid particles stratosphere is a few parts per trillion in the Northern Hemi-
have near-zero organic content well into the stratosphere, increas- sphere and less in the Southern Hemisphere. A less reactive
ing up to a few percent by mass near the tropopause. There was a or condensable organic molecule could be present at a corre-
strong difference in the organic content of the sulfuric acid particles spondingly higher concentration.
between the hemispheres. Each point is the average of about 200
mass spectra.
5 Radiative and chemical implications
above 20 km rather than SO2 near the tropopause (Kremser The different sizes of the sulfuric acid and organic–sulfate
et al., 2016; Rollins et al., 2017). That there are two types particles lead to substantial differences in their radiative and
of particles with different compositions present in the same chemical effects. Important properties are the amount of in-
air also means that any semi-volatile gas-phase organics and frared heating, the amount of light scattered, implications
ammonia cannot be in equilibrium with both types of parti- for photolysis, the surface area available for heterogeneous
cles. Gas-phase ammonia concentrations must be extremely chemistry, and the mass sedimentation rate.
low or else the stratospheric sulfuric acid particles would be A key part of the radiative implications is the efficiency of
slowly neutralized. Even small amounts of gas-phase ammo- light scattering as a function of particle size. Figure 7 shows
nia can strongly modulate new particle formation in the lower the mass scattering efficiency as a function of particle size
stratosphere (Williamson et al., 2021). averaged over the solar spectrum and a sunlit Earth. Calcula-
There is some limited uptake of organics onto the strato- tions are for a real refractive index of 1.45 and minimal ab-
spheric particles, although the maximum organic concen- sorption. Atmospheric extinction is determined by the solid
tration is still much less than for tropospheric particles. total scattering curve. Much of the light scattered by particles
Meteoric-sulfuric particles definitely formed in the strato- continues downward to the Earth and so does not directly af-
sphere, so any significant organic content indicates net up- fect climate. Separating out the light scattered to outer space
take of organics. Their organic content grows as the parti- (dashed curve) gives a maximum that is slightly broader and
cles descend to the lowermost stratosphere and the upper tro- shifted to smaller sizes than light extinction. Over much of
posphere. The meteoric-sulfuric particles contain much less the size range of particles that scatter light efficiently, only
than 1 % organic mass at altitudes with ozone greater than about one-fifth of the light that is scattered goes to outer
500 ppbv and as much as 2 % to 4 % near the tropopause space; the remainder becomes diffuse light. This is a reason
in the Northern Hemisphere. Such limited formation of sec- for the large increases in diffuse light (with decreases in di-
ondary organic mass in the lowermost stratosphere is con- rect sunlight) after volcanic eruptions (Murphy, 2009).
sistent with previous PALMS measurements (Murphy et al., Figure 7 also shows an estimate of the importance of in-
2007). frared absorption. Infrared absorption is estimated by adapt-
Atmos. Chem. Phys., 21, 8915–8932, 2021 https://doi.org/10.5194/acp-21-8915-2021D. M. Murphy et al.: The size and composition of aerosol particles in the stratosphere 8923
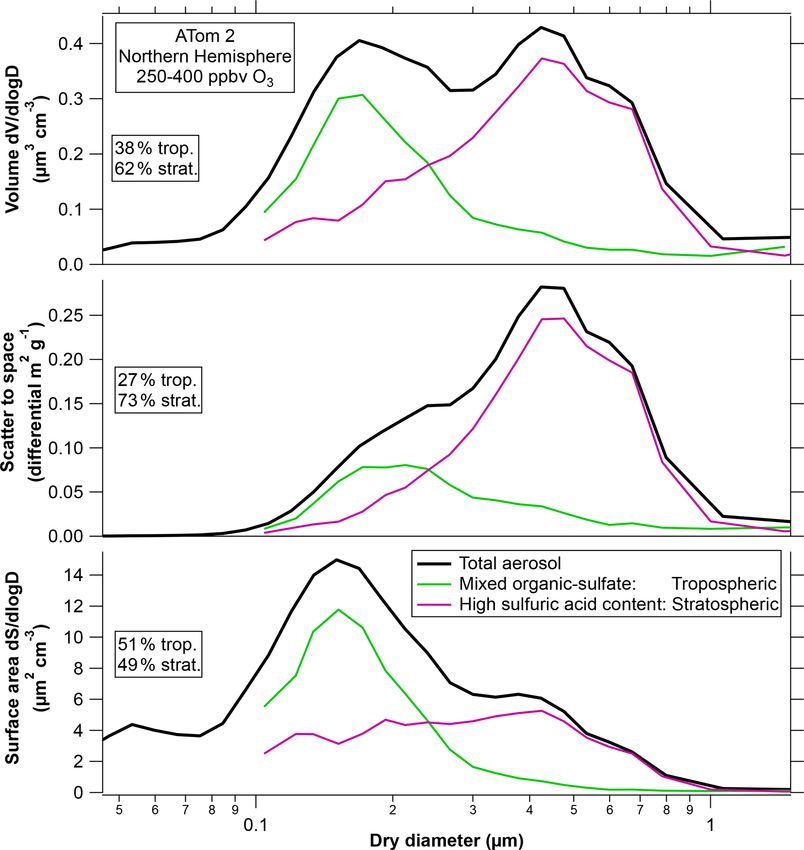
Figure 7. The mass scattering efficiency of particles with a refrac-
tive index similar to sulfuric acid calculated from Mie scattering. Figure 8. The composition-resolved size distribution from Fig. 1 for
Shown are the total scattered light, the light scattered away from the the ATom2 Northern Hemisphere weighted by volume, light scat-
Earth to space, and their ratio. Larger particles have more forward tered to outer space, and surface area. The two sulfuric acid cat-
scattering and therefore a smaller fraction scattered to space. The egories (with and without meteoric metals) have been combined.
lowest curve shows the climate impact after an approximate cor- Percentages refer to sizes above 0.1 µm only. ATom2 is chosen as
rection for warming due to infrared absorption. The infrared heat- an example; Fig. S4 shows the percentage contributions of various
ing is the difference between the two lower dashed curves. Particles particle types to these processes for other deployments and for the
smaller than about 0.1 µm or larger than about 4 µm warm the Earth Southern Hemisphere. Scaling to net thermal infrared heating gives
(Lacis et al., 1992). Tropospheric particles containing ammonium relative contributions nearly identical to volume in the top panel.
sulfate or other substances with higher refractive indices would shift Scaling to sedimentation rate gives a similar shape to the middle
the curves to slightly larger diameters. panel.
combined. Of the particles larger than 0.1 µm diameter, about
ing a calculation from Lacis et al. (1992), who showed 39 % of the volume was organic–sulfate particles from the
that heating exceeded shortwave cooling for several different troposphere, and 61 % was sulfuric acid particles from the
types of particles when their diameters were more than about stratosphere (including both those with and without mete-
4 µm. Since infrared absorption per unit mass is almost in- oric metals). The percentage contribution to each parameter
dependent of size, an approximate net cooling was estimated in Fig. 8 by stratospheric aerosol will be somewhat larger at
by subtracting a constant from the calculated shortwave scat- ambient conditions because sulfuric acid has some water up-
tering per unit mass to space such that the net was zero at take even at < 10 % relative humidity. Ambient sulfuric acid
4 µm diameter. The vertical scale of the net cooling curve is particles may have roughly 5 % to 15 % larger diameters than
consistent with the scattering curves. For example, at peak measured in the warm aircraft cabin.
scattering efficiency near 0.5 µm, infrared effects reduce the
cooling of the Earth by stratospheric aerosol by 10 % to 15 %. 5.1 Infrared heating
The top panel of Fig. 8 replots the chemically resolved size
distribution for ATom2 in the wintertime Northern Hemi- An important property for stratospheric particles is their ab-
sphere. This was chosen as an example because it is similar to sorption and emission of infrared radiation. Infrared proper-
several other locations and seasons, such as ATom1 summer- ties are more important for stratospheric aerosols than very
time Northern Hemisphere and ATom3 springtime Southern low altitude aerosols because the latter are close to the sur-
Hemisphere. There was more sampling time in the ATom2 face temperature and so absorb and emit similar amounts of
Northern Hemisphere stratosphere, so the particle statistics energy.
are better, with mass spectra of about 10 000 particles. In Infrared absorption by stratospheric particles is important
Fig. 8 the two sulfuric acid particle categories have been for two reasons. First, it heats the stratosphere around the par-
https://doi.org/10.5194/acp-21-8915-2021 Atmos. Chem. Phys., 21, 8915–8932, 20218924 D. M. Murphy et al.: The size and composition of aerosol particles in the stratosphere
ticles. Changes in circulation due to infrared heating were re- in light scattering to outer space per unit mass. The ATom
sponsible for significant changes in ozone after the Pinatubo mission took place during a time with small volcanic influ-
eruption (Labitzke and McCormick, 1992; Pitari and Rizi, ence. In contrast, particles shortly after the Pinatubo erup-
1993). The heating-induced changes in ozone were as large tion had volume mean diameters greater than 0.7 µm (Wilson
as or larger than those due to heterogeneous chemistry. There et al., 2008; Fig. S3), large enough that their mass scattering
are additional feedbacks on the circulation after changes in efficiency decreased. Figure S4 shows the relative extinction
infrared heating due to changes in ozone and water vapor due to various particle types for cases other than the ATom2
(Visioni et al., 2017). Infrared heating is largest in the lower Northern Hemisphere used as an example in Fig. 8.
stratosphere, where the temperature contrast with the surface
is greatest (Lacis, 2015). 5.3 Heterogeneous chemistry
Second, infrared absorption by stratospheric particles off-
sets some or even all of the shortwave cooling of the Particle size can affect heterogeneous chemistry. Reactions
Earth. For sulfuric acid particles similar to those after the with sulfuric acid particles that are important to stratospheric
Pinatubo eruption, longwave heating offset roughly 25 % of chemistry span the range from reactions that occur in the in-
the shortwave cooling (Hansen et al., 2005). This increases terior of liquid particles and hence are proportional to volume
to about 50 % for large injection rates because larger parti- to reactions that occur on the surface and hence are propor-
cles (> 0.6 µm) become increasingly less efficient at scatter- tional to surface area (Hanson et al., 1994). Heterogeneous
ing sunlight to outer space (Fig. 7) compared to their volume chemistry can be especially important within or at the edge
(Niemeier and Timmreck, 2015). Large particles can even of the polar vortex (Solomon et al., 2015; Stone et al., 2017).
cause net warming: alumina with the size distribution from The bottom panel of Fig. 8 shows the size distribution
rocket emissions was calculated to cause net warming (Ross weighted by surface area rather than volume. For these con-
and Sheaffer, 2014). ditions surface reactions are closely proportional to surface
For wavelengths much larger than the particles, absorption area; gas-phase diffusion is a minor correction. For the case
and emission are approximately proportional to total particle shown in Fig. 8, the organic–sulfate particles from the tropo-
volume (and the material) and do not depend on particle size sphere are about half of the surface area in the lowermost
(van de Hulst, 1981). Therefore, net thermal infrared heating stratosphere. This is significant because, whereas strato-
is insensitive to the size of particles and will approximately spheric heterogeneous chemistry on sulfuric acid has been
follow the volume distribution in the top panel of Fig. 8. For extensively studied, little is known about the same reactions
ATom2, most of the volume distribution was composed of on organic–sulfate particles. Figure 8 shows ATom2 North-
particles of stratospheric origin, but that was not always the ern Hemisphere as an example. Surface area fractions for
case (Fig. 1). The infrared effects of the tropospheric parti- other cases are shown in Fig. S4.
cles found in the lower stratosphere are hard to assess. Long- The organic–sulfate particles differ from the sulfuric acid
wave radiative heating depends not only on the strength of particles in important ways. Most obviously, they contain
the absorption bands but also on their overlap with atmo- a high proportion of organics that may participate in new
spheric windows in the infrared spectrum. The presence of chemistry with halogen radicals. Iodine in particular may
a significant fraction of organic material has unknown im- react with organic aerosols (Murphy and Thomson, 2000;
plications for infrared heating. Like sulfate, infrared heating Pechtl et al., 2007). Although not fully neutralized, the
will be proportional to the volume of organic aerosol, but the organic–sulfate particles are not nearly as acidic as the rel-
absolute amount of heating depends on how aerosol absorp- atively pure sulfuric acid particles. This can be determined
tion features correlate with gas-phase absorption or window from acid cluster peaks in the PALMS mass spectra. Some
regions in the infrared spectrum. We are not aware of any chlorine activation reactions that lead to ozone destruction
infrared spectra of organic material in aerosols in the strato- are acid-catalyzed (Burley and Johnston, 1992) and there-
sphere or upper troposphere. fore may be slower on partially neutralized particles. The
organic–sulfate particles also contain less water – sulfuric
5.2 Scattering of visible light acid is extremely hygroscopic compared to other species at
the low relative humidities in the stratosphere. The avail-
The middle panel in Fig. 8 shows the size distribution ability of condensed water for heterogeneous reactions could
weighted by the amount of sunlight scattered to outer space, be further reduced if the organic–sulfate particles are glassy
which is relevant for shortwave climate effects. Weighting at the low temperatures and humidity in the stratosphere
the size distribution by the light extinction would shift the (Krieger et al., 2012; Price et al., 2014).
peak just slightly further to larger particles. Because of their
size, the sulfuric acid particles contribute a greater fraction of 5.4 Sedimentation
the light scattering than their mass fraction. In fact, compar-
ing Figs. 1 and 7, the most abundant size of the sulfuric acid Sedimentation is a key process in the stratospheric aerosol
particles in the lower stratosphere was close to the maximum budget (Wilson et al., 2008). It is more important in the
Atmos. Chem. Phys., 21, 8915–8932, 2021 https://doi.org/10.5194/acp-21-8915-2021D. M. Murphy et al.: The size and composition of aerosol particles in the stratosphere 8925
stratosphere than it is near ground level partly because par- absorption, with one reducing and the other increasing ozone
ticles fall faster at lower air density. A bigger reason sedi- (Pitari and Rizi, 1993). The individual effects were several
mentation is important in the stratosphere is the relevant time percent of the ozone column, with the net impact difficult
scale: a fall speed of 1 km per month would be unimportant to assess because their simple model did not include NOx
in the lower troposphere but can control the residence time of or halogen chemistry. The imaginary refractive index of the
a particle in the stratosphere. Particles larger than about 1 µm organic–sulfate particles at wavelengths below 242 nm is not
diameter have sedimentation rates greater than 10 km yr−1 known but could easily be large enough to lead to significant
in the lower stratosphere. The sedimentation flux as a func- absorption compared to scattering.
tion of size, shown in Fig. S5, is similar to the light scatter-
ing panel in Fig. 8. For the ATom2 example used in Fig. 8,
the sulfuric acid particles have roughly twice the volume of 6 Discussion
the organic–sulfate particles. Their source strength must be
somewhere between about twice as large as the tropospheric We have shown in Sects. 3 and 4 that there are two distinct
particles (if loss is controlled by bulk air motion) and 3 times particle populations in the lowermost stratosphere, those of
as large (if loss is controlled by sedimentation). tropospheric origin and those of stratospheric origin, and that
these have different size distributions. We have also shown in
5.5 Ultraviolet scattering and absorption Sect. 5 that these two populations, because of their different
chemical composition, have different radiative efficiency and
Absorption and scattering of ultraviolet light are distinct surface area per unit mass. These results motivate more gen-
from that of visible light because of the impact on photol- eral calculations about the radiative and chemical effects of
ysis rates. Light scattering by stratospheric aerosol changes particles as a function of size. Because we are concerned with
the path length of light in the stratosphere, which in turn the climate implications of stratospheric particles, we will
changes photolysis rates (Huang and Massie, 1997; Pitari compare the sunlight scattered to outer space with various
et al., 2014). The calculations are complex because Rayleigh parameters such as surface area and sedimentation rate. The
scattering in the ultraviolet leads to strong effects from multi- presence of more than one type of particle in the stratosphere
ple scattering (Bian and Prather, 2002), especially at twilight also motivates investigating why different types of particles
or if a scattering aerosol layer is located above gas-phase ab- have different sizes.
sorption (Davies, 1993; Anderson et al., 1995). In addition,
the long path lengths magnify the importance of any absorp- 6.1 Complex controls on particle size
tion of ultraviolet light by aerosols.
The scattering of ultraviolet light peaks at smaller particle The previous sections demonstrate that particle size is im-
sizes than for sunlight. This means that the smaller tropo- portant for many of the properties relevant to climate and
spheric organic particles contribute substantially to the scat- chemical effects. In the real world, one cannot instantly fill
tering of ultraviolet light. The relative contributions to scat- a box with monodisperse particles of a chosen size, the way
tering of light at < 240 nm are shown in Fig. S5 and are simi- one might in a model. It is important to understand what con-
lar to the surface area panel in Fig. 8 except that sizes smaller trols the size distribution of particles in the stratosphere and
than about 80 nm and larger than about 600 nm contribute how it will change with additional aerosol or precursors such
less to UV scattering than they do to surface area. as sulfur dioxide. The mean particle diameter in the strato-
One important wavelength band is 200 to 242 nm, where sphere is not a constant but varies with the aerosol loading,
photolysis of O2 is responsible for formation of ozone and altitude, and latitude (English et al., 2012).
photolysis of N2 O produces odd nitrogen (NOy ) (Brasseur The size of particles in the unperturbed or perturbed strato-
and Solomon, 1986). For purely scattering particles, changes sphere can be understood in two complementary ways. The
in photolysis in this wavelength range are reduced by large first way, a top-down approach, says that for a given mass of
cancellations in direct and diffuse light (Michelangeli et al., stratospheric aerosol the more particles there are, the smaller
1989). Light scattering by the El Chichón volcanic cloud was they must be. The second way, a bottom-up approach, con-
estimated to reduce O2 photolysis by about 10 % (Michelan- siders how the size of each particle is set by a balance of
geli et al., 1989). The overall effect of scattering seems to be growth and removal processes in the stratosphere.
to reduce ozone formation (Pitari et al., 2014). For the top-down approach, one must consider at least
Unlike purely scattering particles, absorbing particles three sources of particle number in the stratosphere. Particles
would not have a similar partial cancellation between direct come down from the mesosphere, particles come up from the
and diffuse sunlight. Huang and Massie (1997) examined the troposphere, and new particles can form in the stratosphere
effect of substituting ash with visible and UV absorption for (Murphy et al., 2014). The meteoric source of particles to
non-absorbing sulfuric acid in a simple model of photolysis the stratosphere is mostly “smoke” consisting of material
after a volcanic eruption. There are competing effects on the that evaporated from ablating meteoroids and condensed into
ozone column because both JO2 and JO3 are reduced by UV new particles high in the atmosphere. Much of this material
https://doi.org/10.5194/acp-21-8915-2021 Atmos. Chem. Phys., 21, 8915–8932, 20218926 D. M. Murphy et al.: The size and composition of aerosol particles in the stratosphere
descends near the winter poles (Bardeen et al., 2008). Sec-
ond, tropospheric particles provide an important source of
stratospheric particles below 20 km altitude (Yu et al., 2016).
The fate of tropospheric particles entering the stratosphere
is poorly represented in most models. New particle forma-
tion is also important for the stratosphere. The pure sulfuric
acid category in Fig. 1 is probably from growth of particles
formed in (or at the edge of) the stratosphere. One formation
region is near the tropical tropopause with upward transport
into the stratosphere (Brock et al., 1995; English et al., 2011).
There is probably also formation of new sulfuric acid parti-
cles higher in the stratosphere over the winter poles (Wilson
et al., 1989), although this must be distinguished from me-
teoric smoke descending in the same regions (Curtius et al.,
2005).
Adding sulfuric acid or its precursors, either from vol-
canoes or by potential intentional injection, will have com-
plex effects on new particle formation, with not only more
vapor to condense but also more surface area sink. In con-
trast, injected solid particles would provide a surface sink
for background sulfuric acid from oxidation of carbonyl sul-
fide, likely reducing new particle formation. This implies that Figure 9. Calculated net cooling per unit volume, surface area, and
injected solid particles would probably change the size of sedimentation velocity. Each curve is normalized so the maximum
the natural sulfuric acid particles in the stratosphere. Suffi- point is unity. For example, 0.2 µm particles have about one-tenth
ciently small injected solid particles might reach high alti- the net cooling per unit surface area as 1 µm diameter particles.
tudes where existing sulfuric acid particles have evaporated Particles of about 0.5 µm diameter give the most cooling per unit
(Weisenstein et al., 2015; Jones et al., 2016). There could be mass and the most cooling per amount of infrared heating of the
unknown effects if they were later entrained in descending stratosphere (volume and infrared heating have the same normal-
air in the winter polar regions. ized curves). Particles of about 0.3 µm diameter give the most cool-
The bottom-up approach considers how the size of strato- ing per unit sedimentation rate. Calculations of sunlight reflected
to outer space are for a single size aerosol averaged over the solar
spheric particles is determined by a balance of growth and
spectrum and zenith angles characteristic of the sunlit Earth. The
removal processes. Particles grow by coagulation and by con-
wavelength averaging eliminates the oscillations from Mie scatter-
densation of sulfuric acid and other species. Coagulation in ing.
the unperturbed stratosphere is slow except for special sit-
uations such as shortly after new particle formation (Brock
et al., 1995; Hamill et al., 1997). Coagulation increases non-
linearly with aerosol concentration, so it becomes more sig- 6.2 Impacts on the stratosphere as a function of size
nificant after volcanic eruptions (Pinto et al., 1989) or large
injection scenarios (Weisenstein et al., 2015). In these cases, The preceding section suggests that the ultimate size of par-
coagulation helps drive the extra mass primarily to larger ticles is set by multiple processes and is not easy to predict.
particles rather than more numerous particles (Heckendorn We therefore examine a range of particle sizes for calcula-
et al., 2009; Niemeier and Timmreck, 2015). Both sedimen- tions of how the cooling of the Earth compares to other pro-
tation and downward motion are important removal pro- cesses such as heating of the stratosphere and the potential
cesses (Wilson et al., 2008). for heterogeneous chemistry. Figure 9 shows an estimate of
One implication of having multiple sources of particles net cooling compared to particle volume, surface area, and
in the stratosphere is that there is no single response to in- sedimentation rate as a function of particle diameter in the
jected material. It is only in the last few years that strato- lower stratosphere.
spheric models have incorporated multiple sources of parti- Because scattering has a much stronger size dependence
cles along with detailed microphysics (Pitari et al., 2014; Yu than infrared absorption, the size that has the least infrared
et al., 2016; Mills et al., 2017). There is still considerable un- absorption for a given amount of shortwave climate impact is
certainty in quantitatively understanding the size of particles about 0.5 µm diameter (filled circles). This is true regardless
in the current stratosphere, let alone after a perturbation. Fig- of details of the infrared spectrum of the particles. Larger or
ure 2 demonstrates that a detailed microphysics model of the smaller particles will be less effective at cooling the Earth
stratosphere did not grow the sulfuric acid particles to large and will cause more stratospheric circulation changes for a
enough sizes. given amount of cooling. Sufficiently large (> 4 µm) or small
Atmos. Chem. Phys., 21, 8915–8932, 2021 https://doi.org/10.5194/acp-21-8915-2021You can also read