Relevance of acoustic methods to quantify bedload transport and bedform dynamics in a large sandy-gravel-bed river - Earth Surface Dynamics
←
→
Page content transcription
If your browser does not render page correctly, please read the page content below
Earth Surf. Dynam., 9, 423–444, 2021
https://doi.org/10.5194/esurf-9-423-2021
© Author(s) 2021. This work is distributed under
the Creative Commons Attribution 4.0 License.

                    Relevance of acoustic methods to quantify
                    bedload transport and bedform dynamics
                         in a large sandy-gravel-bed river
            Jules Le Guern1 , Stéphane Rodrigues1,2 , Thomas Geay3 , Sébastien Zanker4 , Alexandre Hauet4 ,
              Pablo Tassi5,6 , Nicolas Claude5,8 , Philippe Jugé7 , Antoine Duperray1 , and Louis Vervynck1
                                 1 UMR   CNRS CITERES, University of Tours, Tours, France
                    2 Graduate School of Engineering Polytech Tours, University of Tours, Tours, France
                                            3 BURGEAP R & D, Grenoble, France
                                    4 EDF, Division Technique Générale, Grenoble, France
                5 EDF R & D – National Laboratory for Hydraulics and Environment (LNHE), Chatou, France
                                  6 Saint-Venant Laboratory for Hydraulics, Chatou, France
                               7 CETU Elmis Ingénieries, University of Tours, Chinon, France
                             8 EDF, Centre Ingénierie Hydraulique, La Motte Servolex, France

                                 Correspondence: Jules Le Guern (leguern@univ-tours.fr)

                                Received: 21 September 2020 – Discussion started: 7 October 2020
                           Revised: 29 March 2021 – Accepted: 19 April 2021 – Published: 27 May 2021

       Abstract. Despite the inherent difficulties in quantifying its value, bedload transport is essential for under-
       standing fluvial systems. In this study, we assessed different indirect bedload measurement techniques with a
       reference direct bedload measurement in a reach of a large sandy-gravel-bed river. An acoustic Doppler current
       profiler (aDcp), the dune tracking method (DTM) and hydrophone measurement techniques were used to deter-
       mine bedload transport rates by using calibration with the reference method or by using empirical formulas. This
       study is the first work which attempted to use a hydrophone to quantify bedload rates in a large sandy-gravel-
       bed river. Results show that the hydrophone is the most efficient and accurate method for determining bedload
       fluxes in the Loire River. Although further work is needed to identify the parameters controlling self-generated
       sediment noise, the calibration procedure adopted in this study allows a satisfactory estimation of bedload trans-
       port rates. Moreover, aDcp and hydrophone measurement techniques are accurate enough to quantify bedload
       variations associated with dune migration.

1   Introduction                                                  nels (Best, 1988; Bertoldi et al., 2009; Rodrigues et al., 2015;
                                                                  Claude et al., 2014) and to reproduce satisfactorily morpho-
Worldwide, rivers are in crisis (Vörösmarty et al., 2010).        dynamic processes with numerical modelling (Mendoza et
While changes in flow characteristics and fragmentation are       al., 2017; Cordier et al., 2020).
well known (Grill et al., 2019), the impacts of human ac-            However, in large rivers, this parameter remains difficult
tivities on the sediment budgets are as yet underrepresented      to estimate, mainly due to human and material resources re-
(Kondolf et al., 2018). The quantification of bedload trans-      quired to collect accurate measurements. Among the avail-
port is a key element to understand, manage and restore the       able tools, indirect measurement techniques are promising
physical and ecological functioning of fluvial systems. It is     alternatives to direct measurements that are often cumber-
a prerequisite to an accurate estimation of global sediment       some to implement and can be time-consuming and perilous
budgets delivered by rivers to oceans (Syvitski and Milliman,     (Gray et al., 2010). Since the 2000s, numerous studies have
2007), to better understand bedform dynamics in river chan-       been carried out to process the signal captured by an acous-

Published by Copernicus Publications on behalf of the European Geosciences Union.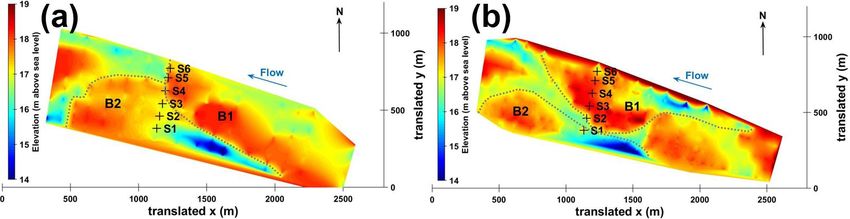
424 J. Le Guern et al.: Relevance of acoustic methods to quantify bedload transport and bedform dynamics
tic Doppler current profiler (aDcp) as a tool for determining median diameter (D50 ) of 0.9 mm. The D50 varies between
the apparent bedload velocity (Rennie et al., 2002; Rennie 0.3 and 3.1 mm with a standard deviation of 0.4 mm. The
and Villard, 2004; Rennie and Millar, 2004; Kostaschuk et 90th percentile of the sediment grain size distribution (D90 )
al., 2005; Villard et al., 2005; Gaeuman and Jacobson, 2006, is variable with a median value of 3.3 mm varying from
2007; Holmes, 2010; Ramooz and Rennie, 2010; Latosinski 0.5 to 15.7 mm. Hydraulic conditions varied according to
et al., 2017; Conevski et al., 2019, 2020a). The use of passive discharge between 0.5 and 5.4 m for the water depth, and
acoustic instruments has also been widely used to quantify between 0.2 and 1.4 m s−1 for the water velocity (median
bedload transport. Even though these latter techniques have water depth and water velocity are 1.9 m and 0.9 m s−1 , re-
been developed through the application of measurement tools spectively). The width-to-depth ratio ranges from 120 to 550
such as geophones or hydrophones, their domain of applica- depending on discharge variations. The mean annual dis-
bility is restricted to the study of rivers with coarse sediments charge at the Saumur gauging station (approx. 30 km up-
(Barton et al., 2010; Hilldale et al., 2014; Marineau et al., stream) is 680 m3 s−1 , with a 2-year flood of 2700 m3 s−1 .
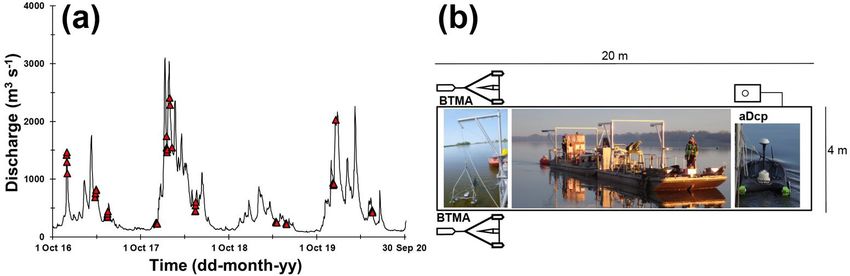
2016; Geay et al., 2017). This study aims to develop the use Surveys were conducted during various hydrological condi-
of passive acoustic technique in large sandy-gravel-bed rivers tions, with flow discharges ranging from 200 to 2400 m3 s−1
for quantifying bedload rates and bedform dynamics. (Fig. 2a).
In sandy-gravel-bed rivers, the presence of bedforms is Bars are characterized by an average wavelength of
generally used to indirectly estimate bedload transport (Si- 1300 m, corresponding to approximately 3 times the chan-
mons et al., 1965). Single-beam (Peters, 1978; Engel and nel width. The mean bar height is 1.5 m. At submerged con-
Lau, 1980) or multibeam echosounders (Nittrouer et al., ditions, bars can migrate with a celerity of 0.5 to 2 m d−1 .
2008; Leary and Buscombe, 2020) are tools usually adopted During floods, the bar celerity can increase up to 4 m d−1
to determine morphological parameters (such as bedform (Le Guern et al., 2019a). During floods, dunes are superim-
height, wavelength and celerity) or to estimate sediment bud- posed on bars, whose height, wavelength and mean celerity
get (Frings et al., 2014). These bathymetrical surveys are of- are approximately 0.3, 4.4 and 32 m d−1 , respectively.
ten carried out simultaneously with sediment sampler mea-
surements (Gaeuman and Jacobson, 2007; Claude et al., 3 Materials and methods
2012) to calibrate the signal with a direct reference although
the latter are intrusive and characterized by a low spatial rep- Direct measurements of bedload sediment transport rates
resentativeness. These drawbacks can therefore limit the ap- were performed using pressure-difference samplers. This
plicability of these measurement techniques, in particular for conventional approach was used to evaluate three indirect
large lowland rivers. acoustic methods: the apparent bedload velocity assessed
In this work, we compare the efficiency of active and from aDcp measurements, the dune tracking method (DTM)
passive acoustic techniques to quantify bedload transport. inferred using single-beam echosounding and the self-
The investigation took place in a reach of the Loire River generated noise (SGN) of sediments measured using a hy-
(France), which is characterized by a sandy-gravel bed drophone. A total of 72 surveys were performed from Octo-
evolving through bars and superimposed dune migration ber 2016 to May 2020 (discharge ranging between 210 and
(Le Guern et al., 2019b). 2290 m3 s−1 ) including 43 surveys with bedload samplers
The main objectives of this study were (1) to compare presented in Fig. 2a (Appendix A).
indirect methods for estimating bedload with bedload esti-
mates based on physical samples; (2) to estimate the accu-
3.1 Bedload rates obtained using pressure-difference
racy of acoustic methods to measure cross-sectional varia-
samplers
tions of bedload fluxes for various discharge conditions; and
(3) to investigate the capabilities of hydrophones and aDcps Bedload transport rates were measured using two synchro-
at capturing bedload variations along bedforms. nized bedload transport meter Arnheim (BTMA) samplers,
consisting of a sampling basket mounted on a frame. The
sampling baskets have a rectangular mouth 0.05 m high and
2 Study site 0.085 m wide. A complete description of the sampler can
be found in de Vries (1979) or in Eijkelkamp (2003). De-
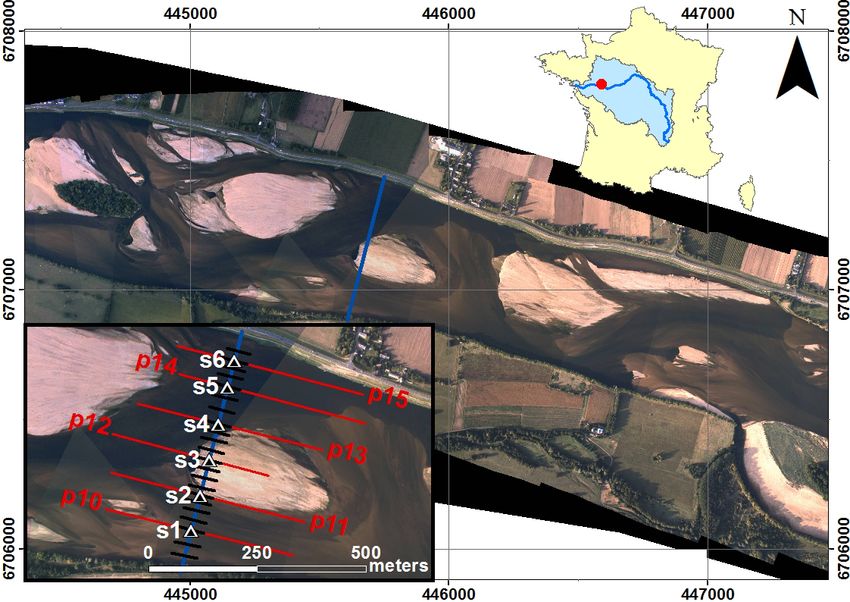
The study site is located near Saint-Mathurin-sur-Loire, in vices were mounted on a 20 m long boat stabilized using
the lower reach of the Loire River (France), approximately two anchors (Fig. 2b). These two samplers were deployed
150 km upstream of the mouth of the Loire River. The study on six sampling points (S1 to S6) distributed along a cross
reach is 2.5 km long, 500 m wide and nearly straight, with a section (Fig. 1). At each sampling point, 10 samples were
bed slope of 0.02 % (Fig. 1). During this work we measured collected with each BTMA (20 in total), and volumes of each
the grain size distribution and flow characteristics at differ- samples were measured in situ with a graduated cone (Imhoff
ent locations along a cross section (Fig. 1). The riverbed is cone). Collected volumes were integrated over at least 2 min.
composed of a mixture of siliceous sands and gravels with a All sample volumes from each BTMA were merged for siev-
Earth Surf. Dynam., 9, 423–444, 2021 https://doi.org/10.5194/esurf-9-423-2021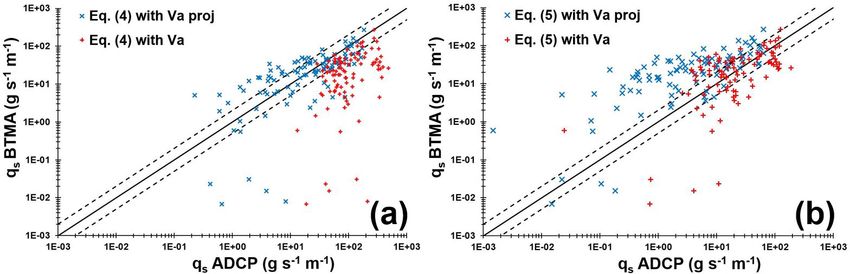
J. Le Guern et al.: Relevance of acoustic methods to quantify bedload transport and bedform dynamics                                   425

Figure 1. Aerial photographs of the study site in 2017 (courtesy of Dimitri Lague, University of Rennes, France) with location of sampling
points (white triangles) on the sediment transport gauging cross section (blue line), bathymetric profiles (red lines) and hydrophone drifts
(black lines).

Figure 2. (a) Distribution of bedload sampling surveys along the hydrograph of Saumur gauging station located about 30 km upstream from
the study site. (b) Scheme of the main boat and disposition of monitoring facilities. Bedload transport meter Arnheim (BTMA) samplers;
acoustic Doppler current profiler (aDcp).

ing analysis (leading to two sediment samples per sampling              volumetric sediment concentration (assumed to be equal
point; one for each BTMA). Then, the average volume of                  to 0.65). Suggested values of α and b were adopted from
caught sediments from the two BTMAs was computed and                    Boiten (2003), who mentioned that the trap efficiency factor
converted into instantaneous unit bedload rates as follows:             does not include the possible losses of sediment finer than
            V                                                           0.3 mm (mesh size opening). Sampler positions and sampling
qs BTMA =     αερs × 103 ,                                     (1)      quality were controlled by using two cameras mounted on
            b
                                                                        the BTMAs, but records during flood events were unusable.
where qs BTMA is the unit bedload transport rate (g s−1 m−1 ),          The increase in the water depth limits the light at the bottom
α is the trap efficiency factor based on calibration (α =               of the water column and the addition of a mounted light did
2), V is the mean volume of the instantaneous sediment                  not improve the visibility because of particles in suspension.
catch (m3 s−1 ), b is instrument’s mouth width (b = 0.085 m),           Sediment samples were analysed using the standard sieving
ρs is the sediment density (2650 kg m−3 ) and ε is the

https://doi.org/10.5194/esurf-9-423-2021                                                       Earth Surf. Dynam., 9, 423–444, 2021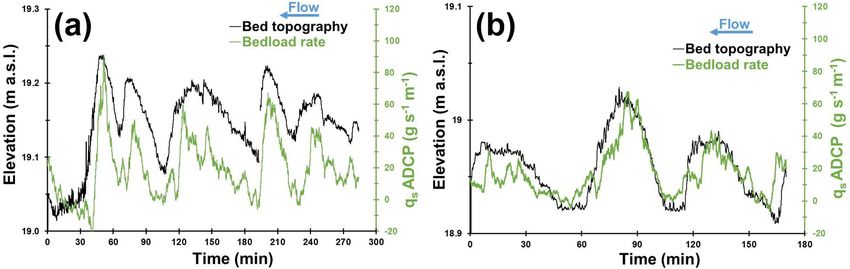
426               J. Le Guern et al.: Relevance of acoustic methods to quantify bedload transport and bedform dynamics

technique (Folk and Ward, 1957) to determine the grain size       point. This method assumes that bedload is orientated in the
distribution (GSD) using the tool “GRADISTAT” developed           same direction as the main flow. According to Rennie et
by Blott and Pye (2001). Uncertainties associated with the es-    al. (2002), the bedload transport rate per unit width (qs ADCP ,
timation of the unit bedload were calculated following Frings     g s−1 m−1 ) can be computed from two different kinematic
and Vollmer (2017).                                               models, the first of which is
                                                                           4
3.2   Apparent bedload velocity from aDcp                         qs ADCP = ρs rVa proj × 103 ,                                   (4)
                                                                           3
Simultaneously with the BTMA measurements, an aDcp was            where r = D50 /2 is the particle radius, D50 is the me-
installed on the boat (Fig. 2b). Measurements were per-           dian sediment diameter (m) and ρs is the sediment density
formed using a SonTek RiverSurveyor M9 (bi-frequency,             (2650 kg m−3 ). In this model, it is assumed the maximum
1 and 3 MHz) or a Teledyne RD Instruments Rio Grande              bedload thickness is a single particle. The second model is
(1.2 MHz). The sampling time needed to get a stable ap-
parent velocity is in the range of 3 min for the case without     qs ADCP = Va proj ds cb ρs ,                                    (5)
bedforms (Conevski et al., 2019) and 25 min (Rennie et al.,
2002). In our study the sampling time was between 5 and           where cb is the concentration of the active transport layer
190 min. The aDcp was coupled with a RTK GPS Magel-               considered as the saltation height (van Rijn, 1984), and the
lan ProFlex 500 receiving position corrections via the Teria      van Rijn (1984) formulation was adopted to compute the ac-
network (centimetre level accuracy). The aDcp measurement         tive layer thickness (ds ) as a function of the hydraulic condi-
allowed the use of both an empirical approach and calibra-        tion and sediment grain size:
tion approach for comparison with sediment sampler mea-
surements. The apparent bedload velocity Va was estimated         ds = 0.3D∗0.7 T 0.5 D50 ,                                       (6)
from the bottom tracking signal, allowing the identification                  T
                                                                  cb = 0.18 c0 ,                                                  (7)
and the position of the river bed. In the case of a mobile bed,               D∗
the Doppler shift of the backscattered acoustic pulse of the                2
                                                                        u − (u∗cr )2
                                                                          0
bottom track depends on the boat velocity and on the bed ve-      T = ∗                    ,                                      (8)
locity. According to Rennie et al. (2002), the apparent bed-                 (u∗cr )2
load velocity can be estimated using                                            u
                                                                  u0∗ =                   ,                                     (9)
                                                                                      12d
                                                                        5.75 log 3D
Va = VGPS VBT ,                                            (2)                          90

where VGPS and VBT are the boat velocity according to GPS         where c0 is the maximum bedload concentration (0.65), T is
reference and bottom track respectively. Even if the boat         the transport stage parameter that reflects the sediment mo-
was anchored, the GPS signal was used in Eq. (2) to cor-          bility, u0∗ is the bed shear velocity related to the grain (m s−1 ),
rect apparent bedload velocity from small lateral displace-       d is the mean water depth (m), u is the mean flow veloc-
ments observed. When the GPS signal was poor or missing,          ity measured from the aDcp (m s−1 ), and u∗cr is the critical
VGPS was considered as null, and Va resulted only from the        bed shear velocity (m s−1 ) calculated from the Shields curve
bottom track signal VBT (representing 15 % of the dataset).       (Van Rijn, 1984) and function of grain size through the scaled
Following Jamieson et al. (2011), the apparent velocity Va        particle parameter D∗ :
was calculated for the north and east velocity components                                   1
(VaE and VaN , respectively), limiting the overestimation es-                     (s − 1)g    3
                                                                  D∗ = D50                        ,                              (10)
pecially in areas where inconsistent directionsq
                                               and low mag-                          ν2
nitudes of bedload velocity were found: Va = VaE   2 +V2 .
                                                        aN        where g is the acceleration of the gravity (m s−2 ), ν is the
   To avoid compass and GPS issues, and to eliminate the          kinematic viscosity (m2 s−1 ) and s is the sediment density
effect of residual lateral displacement of the anchored boat,     ratio. For the range of grain size of this study, u∗cr is com-
the apparent bedload velocity was projected onto the flow         puted as follows:
direction using
                                                                                       h                      i0.5

                     wdir BT − bdir BT
                                                                 10 < D∗ ≤ 20; u∗cr = 0.04D∗−0.1 (s − 1)gD50      ,             (11)
Va proj = Va · cos                     ·π ,               (3)
                           180                                                           h                      i0.5
                                                                  20 < D∗ ≤ 150; u∗cr = 0.013D∗0.29 (s − 1)gD50      .           (12)
with wdir BT the flow direction with bottom track reference
and bdir BT the boat direction with the bottom track reference    In order to evaluate the sensibility of the apparent bedload
(in degree). Equation (3) gives a value of apparent bedload       post-processing, the two kinematic models (Eqs. 4 and 5)
transport velocity for each time step (approximately equal to     were tested using raw apparent bedload velocity (Va ) and
1 s) that was averaged to obtain a value for each sampling        projected apparent bedload velocity (Va proj ).

Earth Surf. Dynam., 9, 423–444, 2021                                                   https://doi.org/10.5194/esurf-9-423-2021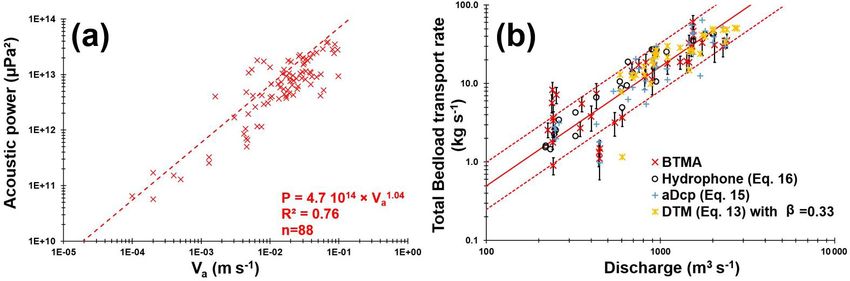
J. Le Guern et al.: Relevance of acoustic methods to quantify bedload transport and bedform dynamics                         427

   To assess the capability of the aDcp to detect bedforms         was assessed for β = [0.33; 0.57], as proposed by Engel and
through the evolution of apparent bedload velocity, three sur-     Lau (1980) and Wilbers (2004). Considering the accuracy of
veys were conducted by positioning the aDcp 0.6 m above the        the bathymetrical echosounding relative to the dune size, the
river bed. This experimental scheme was adopted to avoid           sinuosity of dune crests and the representativeness of dune
lateral movements of the boat, to be as close as possible to       celerity, only profiles with a mean dune height greater than
the river bed and to reduce the space between beams. This          0.1 m and more than 10 dunes were considered.
configuration permitted us to fix the footprint for each beam
to about 0.0046 m2 and a distance of 0.56 m between op-            3.4    Hydrophone and acoustic power
posed beams. This allowed us to describe the apparent bed-
load velocity with a finer accuracy, especially in the presence    Passive acoustic monitoring was performed with a Teledyne
of bedforms of 0.2 m height and 3.9 m length (on average).         RESON Hydrophone TC4014-5 (sensitivity of −180 dB)
These surveys were performed for several hours (from 2.1 to        plugged into an EA-SDA14 card from RTSYS. This device
4.7 h) to capture the migration of more than one dune pass-        has a large frequency range from 0.015 to 480 kHz, with
ing under the device. The value of apparent bedload velocity       a linear response until 250 kHz (±3 dB). The beam pattern
was smoothed by using a moving window with an average of           of the hydrophone is omnidirectional. The hydrophone has
500 points (approximately 500 s) to remove the outliers from       been deployed following the protocol proposed by Geay et
the raw dataset. In the present study, all negative values were    al. (2020). Longitudinal profiles were defined on the sedi-
excluded from the comparison with BTMA measurements                ment transport sampling section (22 profiles; see Fig. 1). The
(16 % of apparent velocity values).                                boat was positioned upstream of the sediment transport gaug-
                                                                   ing section and left adrift at flow velocity. Depending on the
3.3   Bathymetrical echosounding and dune tracking
                                                                   water depth, the hydrophone was installed at a constant depth
      method
                                                                   between 0.4 and 0.7 m below the water surface. Data acquisi-
                                                                   tion was stopped after the boat crossed the sediment transport
A single beam echosounder Tritech PA500 (0.5 kHz) cou-             gauging section. The drift duration ranged between 15 and
pled with a RTK GPS LEICA Viva GS25 was used for                   140 s, depending on the flow velocity (mean time of 31 s).
high-frequency bathymetric surveys to determine bar and            For each drift, a spectral probability density (SPD) was com-
dune morphodynamics along six longitudinal profiles (about         puted (Merchant et al., 2013). Then, a median power spec-
400 m long) centred on sampling points indicated in Fig. 1.        tral density (PSD) was computed as proposed by Geay et
Dune height (HD ) and wavelength (λD ) were estimated using        al. (2017). Median PSD is preferred to mean PSD as it fil-
the bedform tracking tool (BTT) based on the zero-crossing         ters out anomalous acoustic events such as the hydrophone
method (Van der Mark and Blom, 2007). Dune celerity (CD )          impinging the riverbed. The acoustic power (P ) for each
was estimated with the dune tracking method (DTM, Simons           drift was computed by integrating the median PSD over a
et al., 1965; Engel and Lau, 1980) following the dune crests       range of frequency comprised between fmin (15 kHz) and
between two subsequent bathymetric surveys for a mean in-          fmax (350 kHz) (Geay et al., 2020):
terval time equal to 40 min. The interval time needs to be ad-
                                                                          f
                                                                          Zmax
justed with discharge because of the dune celerity variation
from one survey to another. The determination of a proxy           P=           PSD(f )df.                                   (14)
to evaluate sediment transport directly from DTM measure-                fmin
ments is difficult because dune migration is a function of
several parameters. A semi-empirical equation that accounts        The minimum frequency was chosen to avoid hydrodynamic
for these parameters was used to compare bedload transport         and engine noises, while the maximum frequency was set
rates with the reference measurement. The computed dune            by the upper limit frequency of the device and was ad-
parameters were used to calculate the unit bedload trans-          justed relative to PSD. Finally, the nearest hydrophone drift
port rate (qs DTM , g s−1 m−1 ) using the formula by Simons        for each BTMA sampling point was selected. Hydrophone
et al. (1965):                                                     drifts and sampler measurements were not synchronized.
                                                                   Several tests were carried out to ensure that these acoustic
qs DTM = (1 − λ)ρs HD CD β × 103 ,                         (13)    power variations were not related to the distance between
where HD is the mean dune height along the profile (m),            the hydrophone and the river bed. As no theoretical expres-
CD is the median dune celerity (m s−1 ) and β is the bed-          sion has been developed to estimate bedload rates from hy-
load discharge coefficient equal to 0.5 for a perfect triangular   drophone measurements, only the calibration approach was
dune shape. The β coefficient neglects the volume of bypass-       implemented.
ing material from previous dunes or exchanges between bed-
load and suspended load (Wilbers, 2004). Due to its large
variability (Van den Berg, 1987; Ten Brinke et al., 1999;
Wilbers, 2004), the sensibility of the bedload transport rate

https://doi.org/10.5194/esurf-9-423-2021                                                     Earth Surf. Dynam., 9, 423–444, 2021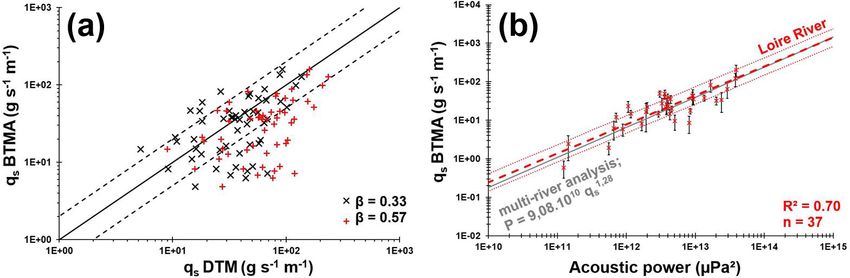
428                J. Le Guern et al.: Relevance of acoustic methods to quantify bedload transport and bedform dynamics

                                                                     the indirect method and the bedload rate using BTMA. Com-
                                                                     puted bedload layer volume concentration (Eq. 7) varies be-
                                                                     tween 0.005 and 0.1 (0.03 on average). Bedload layer thick-
                                                                     ness (ds ) (Eq. 6) ranges between 1D50 and 7D50 (5D50 on
                                                                     average). Bedload rates computed using Eq. (5) underesti-
                                                                     mate BTMA bedload rates with only 24 % of the dataset with
                                                                     a discrepancy ratio between 0.5 and 2 (Fig. 4b). By consid-
                                                                     ering apparent bedload velocity without projection onto the
                                                                     flow direction, the kinematic model (Eq. 5) satisfactorily es-
                                                                     timates BTMA bedload rates with 41 % of the dataset with a
                                                                     discrepancy ratio between 0.5 and 2. Conversely, using raw
                                                                     apparent bedload velocity in Eq. (4) leads to only 33 % of
                                                                     the dataset varying with a factor of 2 against 54 % with pro-
                                                                     jected Va (Fig. 4a). According to these results, Eq. (4) better
Figure 3. Unit bedload transport rates measured with BTMA sam-       describes the sampler bedload rates with projected apparent
plers as a function of the apparent bedload velocity measured with   bedload velocity, whereas raw apparent bedload velocity is
aDcp. The red dashed line represents the RMA regression of the       preferred with Eq. (5). Some outlier data are observed for
Loire River. Compare with other site-specific calibration curves     BTMA bedload discharge lower than 0.1 g s−1 m−1 . These
(Conevski et al., 2020a; Rennie et al., 2017). Blue marks repre-     points correspond to low-flow conditions for which bedload
sent negative apparent bedload velocity values excluded from this    samplers could underestimate bedload fluxes (gap between
regression.
                                                                     the sampler mouth and the riverbed).
                                                                        It appears difficult to estimate bedload rates only from
                                                                     dune celerity by assuming a direct relation between dune
4     Results
                                                                     celerity and bedload transport rates measured with BTMA.
                                                                     Estimation of bedload transport rates from dune morphol-
4.1    Comparison between acoustics and direct bedload
                                                                     ogy has been performed by using the empirical formula
       transport rate measurements
                                                                     of Simons et al. (1965) (Eq. 13). The dataset is composed
The BTMA dataset is composed of 135 unit bedload rates               of 49 DTM profiles with associated BTMA samples (Ap-
calculated from 2628 individual sediment samples. This               pendix C). The mean dune height and length vary from 0.1 to
dataset represents an average of 19 samples on each sam-             0.5 m and 1.3 to 12 m, respectively. The median dune celerity
pling point to compute unit bedload rates (minimum of 5 and          varies between 13 and 61 m d−1 . According to Fig. 5a, bed-
maximum of 57 samples). Bedload rates measured using the             load rates estimated with a discharge coefficient β = 0.33 are
BTMAs ranged between 0.01 and 268 g s−1 m−1 . The stan-              in agreement with BTMA bedload rates with 67 % of values
dard deviation of unit bedload rates increased with discharge        in a factor of 2 of the perfect correlation compared with 49 %
with a mean value of 33 g s−1 m−1 . This illustrates the spatio-     of values for a discharge coefficient of 0.57 (Fig. 5a). The
temporal variability of sediment transport induced by bed-           definition of the discharge coefficient proposed by Engel and
form migration.                                                      Lau (1980) is better adapted for the observed dune shapes
   The aDcp dataset is composed of 96 simultaneous mea-              found in the Loire River which are characterized by mean
surements of apparent bedload velocity and BTMA sam-                 steepness (HD /LD ) approximately equal to 0.05 (in line with
plings (Fig. 3 and Appendix B). The mean apparent bed-               other observations on the Loire River; Claude et al., 2012;
load velocity is 0.02 m s−1 , and the maximum value was              Rodrigues et al., 2015; Wintenberger et al., 2015).
0.11 m s−1 . A reduced major axis (RMA) regression has been             Even if the statistical representativeness is lower than other
computed between these two variables with a coefficient of           methods (n = 37, Appendix D), the RMA regression be-
determination (COD) R 2 equal to 0.51:                               tween the acoustic power and BTMA sampling is better
                                                                     (R 2 = 0.70), and 60 % of values vary between a factor of 2
qs = 1456Va − 2.44.                                          (15)    (Fig. 5b). As a consequence, a new equation to estimate sed-
                                                                     iment transport from acoustic power is proposed:
As shown in Fig. 3, this site-specific calibration procedure
                                                                     P = 6.6 × 10¹⁰ qs1.32 .                                     (16)
at a reach of the Loire River is consistent with the dataset
already published on several world large rivers (Rennie et           This calibration curve is similar to observations performed
al., 2017).                                                          by Geay et al. (2020) on 14 study sites distributed on 11 dif-
   To evaluate the accuracy of a method against a reference,         ferent rivers despite the use of different instruments (sampler
the discrepancy ratio is classically employed in the literature      and hydrophone) and the integration of median PSD over a
(Van Rijn, 1984; Van den Berg, 1987; Batalla, 1997) and is           wider range of frequency in the present study. Moreover, the
defined as the ratio between the bedload rate estimated with         median PSD differ from the Isère River (Petrut et al., 2018)

Earth Surf. Dynam., 9, 423–444, 2021                                                    https://doi.org/10.5194/esurf-9-423-2021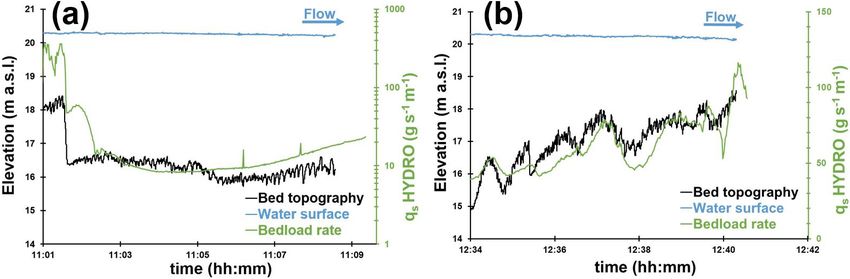
J. Le Guern et al.: Relevance of acoustic methods to quantify bedload transport and bedform dynamics                                      429

Figure 4. The log–log correlation between bedload rates measured with BTMA sampler and calculated using (a) Eq. (4) and (b) Eq. (5).
The solid black line represents the perfect correlation and dashed black lines represent a factor of 2 above and below the perfect correlation.

Figure 5. (a) The log–log correlation between bedload rates measured with BTMA samplers and bedload rates calculated using Eq. (13).
The solid black line represents the perfect correlation and dashed black lines represents a factor of 2 of the perfect correlation. (b) Unit
bedload rates measured with BTMA samplers as a function of acoustic power measured with hydrophone. Dashed red lines represent the
RMA regression with envelopes curves of a factor of 2 of the bedload rates. Compare with Geay et al. (2020).

and from Drau River (Geay et al., 2017). These rivers are                 Table 1. Coefficient of determination (COD) between dune param-
characterized by coarser sediments (see Fig. 6a) and the cen-             eters and acoustic methods (log values).
tral frequency of the PSD decrease with an increasing D50 .
These observations are in line with Thorne’s (1986) theory.                                  P       Va     qs BTMA      HD     CD
The central frequency of the median spectrum of the Loire                            HD     0.20     0.27     0.16       –       –
River is approximately equal to 140 kHz. The frequency band                          CD     0.22     0.24     0.36      0.22     –
of the bedload is shifted towards high frequencies due to finer
grain size.
   The acoustic power corresponding to the integration of the
spectrum over a range of frequency is related to the grain
size (Thorne, 1985) and sediment kinematics (Gimbert et                   correlated with mean dune morphological parameters (Ta-
al., 2019). To analyse the effect of sediment mobility on                 ble 1).
the acoustic power, the transport stage parameter (Van Rijn,                 The apparent bedload velocity estimated by aDcp is the ve-
1984) is calculated. The power law adjusted between these                 locity of the top layer velocity or dynamical active layer (sed-
two parameters provides evidence for a positive evolution of              iment being transported over a dune), whereas the dune celer-
the acoustic power with sediment mobility (Fig. 6b).                      ity is the mobility of the exchange event active layer, accord-
   The comparison can be performed between indirect meth-                 ing to Church and Haschenburger (2017). It must be noted
ods to discuss the acceptability of the BTMA reference. The               that apparent bedload velocity is higher than dune celerity by
apparent bedload velocity and the acoustic power are poorly               a factor approximately equal to 100. On the other hand, the
                                                                          apparent bedload velocity is positively correlated with the

https://doi.org/10.5194/esurf-9-423-2021                                                           Earth Surf. Dynam., 9, 423–444, 2021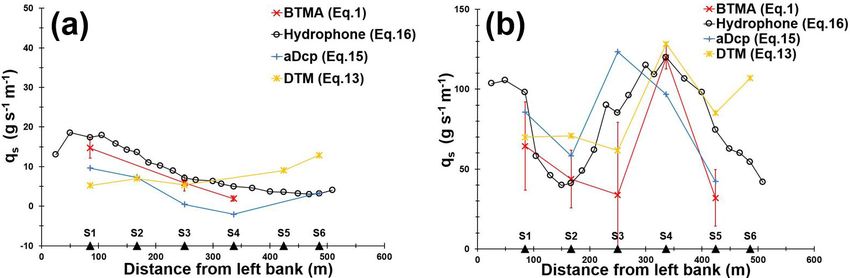
430                J. Le Guern et al.: Relevance of acoustic methods to quantify bedload transport and bedform dynamics

Figure 6. (a) Comparison of PSD from three rivers with varying D50 (PSD of the Drau River and the Isère River are extracted from a single
measurement, PSD of the Loire River is the median PSD from 450 measurements). (b) Transport stage parameter (from Van Rijn, 1984) as
a function of acoustic power.

Figure 7. (a) Acoustic power as a function of apparent bedload velocity. (b) Cross-section-integrated bedload transport rates as a function
of discharge.

acoustic power. The COD of the RMA regression is equal                  4.2     Spatial distribution of bedload in a sandy-gravel-bed
to 0.76 (Fig. 7a).                                                              river with migrating bedforms
   Before focusing on the spatial distribution of unit bedload
rates, total bedload rates are calculated by interpolating unit         4.2.1    Determination of bedload transport on a cross
bedload rates between sampling points on the cross section                       section using acoustics methods
for each method. The COD of the RMA regression estab-                   To compare the spatio-temporal distribution of bedload trans-
lished between BTMA bedload rates and water discharge                   port rates, sediment transport sampling was performed on
is 0.71 (Fig. 7b) with 77 % of the values varying within a              the same cross section for all surveys and for various dis-
factor of 2. The dispersion of bedload rates is higher for              charge conditions. Two surveys with contrasting discharge
low water discharge (less than the mean annual discharge of             conditions and different bed configurations are presented
680 m3 s−1 ). Bedload rates are estimated from Eqs. (3), (15)           (Fig. 8) to illustrate the capability of acoustic methods to de-
and (16), for the DTM, the aDcp and the hydrophone, re-                 termine bedload active width in a river reach characterized
spectively. Both the hydrophone and DTM bedload rates are               by the presence of macroforms and superimposed mesoforms
less scattered with 96 % of values with a discrepancy ratio             (sensu lato, Jackson, 1975).
between 0.5 and 2, compared with 82 % for the aDcp.                        In May 2018, a bar (B1, Fig. 8a) was located just up-
                                                                        stream of the sediment gauging section from the centre to
                                                                        the right part of the channel. In the left part of the chan-
                                                                        nel, BTMA sampling was performed on the stoss side of
                                                                        another bar (B2, Fig. 8a). Consequently, bedload rates grad-
                                                                        ually rose from the centre of the channel (2 g s−1 m−1 , S4)

Earth Surf. Dynam., 9, 423–444, 2021                                                        https://doi.org/10.5194/esurf-9-423-2021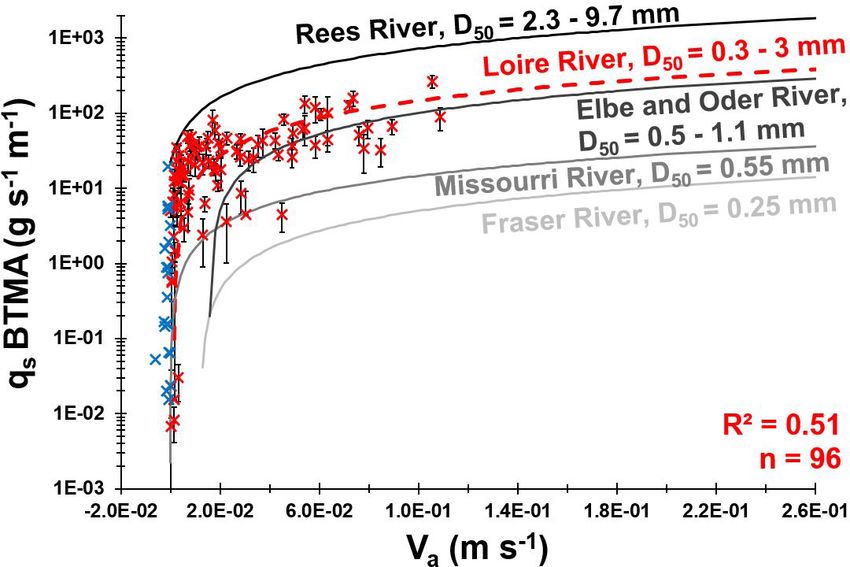
J. Le Guern et al.: Relevance of acoustic methods to quantify bedload transport and bedform dynamics                                   431

Figure 8. Digital elevation models (obtained using natural-neighbour interpolation of single beam bathymetrical surveys) showing location of
sampling points with respect to bar location during (a) the survey of 17 May 2018 (Q = 604 m3 s−1 ) and (b) the survey of 19 December 2019
(Q = 2050 m3 s−1 ).

Figure 9. Lateral distribution of unit bedload rates assessed from different methods for two surveys performed: (a) 17 May 2018 (Q =
604 m3 s−1 ) and (b) 19 December 2019 (Q = 2050 m3 s−1 ), respectively.

to the left part of the channel (15 g s−1 m−1 , S1) except for          dune celerity. ADcp underestimates whereas the hydrophone
the DTM (Fig. 9a). The intensity of bedload transport rates             method overestimates the unit bedload rate compared with
was evaluated for each acoustic signal from regression equa-            BTMA measurements.
tions established above (Eqs. 13, 15 and 16, for DTM, aDcp                 In December 2019 (Fig. 9b), the flow discharge was higher
and hydrophone, respectively). The linear equation of aDcp              (2050 m3 s−1 ) than the value observed in May 2018 (Q =
calibration allow the calculation of negative bedload flux for          604 m3 s−1 ), and measured bedload rates ranged between
apparent bedload velocity below 0.0016 m s−1 (Fig. 9a, S4).             32 and 120 g s−1 m−1 . Due to the bar migration, the bed con-
ADcp and hydrophone signals followed the same trend as                  figuration was different. Bar B1 reached the sediment gaug-
the BTMA measurement. In the right part of the channel, no              ing cross section. As a consequence, sampling points S3
reference measurements were available (S5 and S6), but all              to S6 were located on the stoss side of bar B1 (Fig. 8b).
acoustic signals followed the same trend (increasing bedload            The sampling point S2 was located just downstream of the
transport rates). The bedload rates estimated with the DTM              bar front where the velocity and sediment transport rates
were lower than the reference in the left part of the channel.          were lower (Fig. 8b). The high spatial resolution of the hy-
This can be explained by the reduced number of dunes in                 drophone measurements confirmed that the preferential bed-
this area that caused a higher uncertainty in dune celerity de-         load active width was located between 250 and 450 m from
termination. In the right part, the proximity of the bar-front-         the left bank (Fig. 9b). For this survey, acoustic signals
induced lower bedload transport rates measured with aDcp                (i.e. acoustic power, apparent bedload velocity) followed the
and hydrophone. DTM integrates sediment dynamics over a                 same evolution pattern as samplers along the cross section
longitudinal profile that does not necessarily reflect the bed-         except for S3. Bedload transport rates determined with the
load transport conditions at a local scale. Due to the lee ef-          DTM did not follow the trend of bedload rates determined
fect provided by the proximity of the bar front, dunes were             with aDcp and hydrophone at the proximity of bar front and
not present downstream of the bar, and only dunes located               near the bank as in the previous survey (S2 and S6). The
on the stoss side of the bar were used to calculate the mean

https://doi.org/10.5194/esurf-9-423-2021                                                       Earth Surf. Dynam., 9, 423–444, 2021
432                J. Le Guern et al.: Relevance of acoustic methods to quantify bedload transport and bedform dynamics

Figure 10. Bedload rates calculated using Eq. (15) and bed topography obtained during a static measurement performed using an aDcp:
(a) survey done on 20 May 2020 (Q = 470 m3 s−1 ; mean water depth = 1.04 m) and (b) survey done on 29 May 2019 (Q = 210 m3 s−1 ;
mean water depth = 0.85 m).

Figure 11. Bedload rates calculated on bedforms using the hydrophone and Eq. (16) near a bar front (a) and on a dune field (b). Bed
topography and water surface along two longitudinal bathymetric profiles for the 8 February 2018 survey, Q = 1550 m3 s−1 : (a) P10, mean
water depth = 3.8 m. The profile length from 11:01 to 11:09 LT corresponds to 400 m; (b) P12, mean water depth = 3.4 m. The profile length
from 12:34 to 12:41 LT corresponds to 518 m.

hydrophone model overestimated the sediment transport in               (Fig. 10a, between 8 and 42 min, 96 and 107 min, 185 and
comparison with the BTMAs for S1, S3 and S5.                           193 min, and 227 and 230 min; Fig. 10b, between 48 and
                                                                       55 min and 153 and 162 min). The mean time recorded be-
4.2.2   Sediment transport processes on bedforms
                                                                       tween two successive dune crests was 1 h.
        analysed from aDcp and hydrophone
                                                                          Hydrophone drifts showed that the longitudinal evolution
                                                                       of acoustic power can be correlated with changes in elevation
The aDcp computed bedload rates evolved according to bed-              of the riverbed due to dune and bar presence. For instance, in
form location for fixed measurements performed on dunes                the presence of a 2 m high bar front, the bedload rate signif-
of height ranging between 0.05 and 0.2 m (Fig. 10a and b).             icantly decreased, illustrating the lee effect that is character-
Higher bedload rates were found on the crest of the dune and           ized by a decrease in bedload sediment transport (Fig. 11a).
lower values in the trough. The amplitude of bedload rates             This shows that the hydrophone is sensitive enough to de-
between crest and trough for low-flow conditions (Fig. 10b)            tect this local phenomenon induced by the presence of a bar
ranged between 42 and 67 g s−1 m−1 . For higher-flow con-              front immediately upstream. The bedload rates range from
ditions, it varied between 45 and 91 g s−1 m−1 (Fig. 10a).             about 8 g s−1 m−1 on the bar crest to 376 g s−1 m−1 in the
These values were extracted considering bedload rates in the           bar trough (1 × 10¹² to 1.7 × 10¹⁴ µPa2 of acoustic power,
trough as equal to zero (not negative). The aDcp linear re-            respectively). According to flow velocity measurements, it
gression (Eq. 15) did not allow the calculation of bedload             appears that a 2 m high bar front can influence flow velocity
transport rates due to negative apparent bedload velocity.             and bedload transport rates up to the reattachment point lo-
This is the case downstream from the lee face of the dunes

Earth Surf. Dynam., 9, 423–444, 2021                                                       https://doi.org/10.5194/esurf-9-423-2021
J. Le Guern et al.: Relevance of acoustic methods to quantify bedload transport and bedform dynamics 433
cated approximately 100 m downstream. Downstream of the (n = 582 samples). In our study, the downstream reach of
bar front, the bedload transport rate increased at 11 h 6 min the Loire River shows smaller slope (S = 0.02 %), a wider
(Fig. 11a), which would be in coincidence with the flow reat- channel (W = 500 m), and a median grain size ranging be-
tachment point. Further downstream, the bedload transport tween 0.3 and 3.1 mm (n = 450 samples). The hydrophone
rate increased from 8.5 to 23.4 g s−1 m−1 (representing re- is therefore an efficient tool for sediment transport gauging,
spectively an acoustic power of 1.2×10¹² to 4.1×10¹² µPa2 ), allowing the measurement of numerous sampling points (av-
where dunes exhibit a more regular shape increasing their erage of 17 sampling points) during a relatively shorter time
amplitudes from 0.02 to 0.4 m, approximately. On the left period (1 h). This high spatial discretization makes the hy-
part of the channel (Fig. 11b), the drift was located at the drophone functional over a wide range of discharges (even
stoss side of a bar where larger dunes were observed (about for low water discharge; Fig. 5b) by catching the high spa-
1 m in height) with superimposed small dunes (height ap- tial variability of bedload transport. It should be pointed that
proximately equal to 0.3 m). The bedload transport rate cal- the regression calculated in the present study (Eq. 16) is ob-
culated above these bedforms increased near the crests of tained from unit bedload rates (from several samples) and the
the large dunes (about 80 g s−1 m−1 ) and decreased in the acoustic power resulting in a unique acoustical drift, whereas
troughs (about 50 g s−1 m−1 ) where superimposed bedforms Geay et al. (2020) compared averaged cross-section bedload
were smaller (Fig. 11b). rates and acoustic power. Despite these differences, the data
presented above corroborate the results by Geay et al. (2020)
and support their conclusions concerning the determination
5 Discussion
of a global calibration curve between acoustic power and
5.1 Relevance of acoustics for computing bedload
bedload rates by extending its application to the lowland
transport rates
sandy-gravel-bed rivers. Although this needs to be confirmed
by further investigations to better understand parameters that
Despite their lack of accuracy and their low spatial represen- control the acoustic power measured (such as the propaga-
tativeness, samplers allow a direct measurement of bedload tion of sound waves in water (Geay et al., 2019), their atten-
and represent the only reference measurement of bedload in uation, the saltation length, associated impact celerity or sed-
the field. The presence of bars affect sediment transport lo- iment grain size), results presented in this study suggest that
cally and make the sampling method very sensitive to the lo- the hydrophone method could be an efficient way to measure
cation of the sampling point. For low water discharge (below and to map bedload transport rates on a wider range of fluvial
mean annual discharge, 800 m3 s−1 ), bars are above the wa- systems.
ter line and considerably reduce the width where sediment Several laboratory studies have been carried out (Ramooz
transport occurs. The number of sampling points decreases and Rennie, 2010; Conevski et al., 2019, 2020b) and rivers
with discharge (because bars were not flooded) leading to a instrumented with aDcp to determine bedload rates (Rennie
higher bedload rate variability (Fig. 7b). Moreover, in weak et al., 2002; Rennie and Millar, 2004; Gaeuman and Jacob-
bedload transport conditions, the BTMA sampler most likely son, 2006; Gaeuman and Pittman, 2010; Brasington et al.,
performed with reduced efficiency initially calibrated to 50 % 2011; Conevski et al., 2020a). Recent works have been car-
(Van Rijn and Gaweesh, 1992; Gaweesh and van Rijn, 1994; ried out on two rivers (Elbe, Oder) similar to the Loire River
Banhold et al., 2016). The presence of dunes influences the in term of grain size characteristics, flow and shear velocity,
performance of the sampler by preventing the exact position- and water depth (Conevski et al., 2020a). Even if the correla-
ing of sampler mouth on the river bed. These deficiencies tion between apparent bedload velocity and bedload rates is
lead to a large uncertainty in bedload estimation which set significant, this calibration equation (Eq. 15) was obtained
the limits of the comparison with other methods. from two very similar rivers. Despite these observations,
The use of hydrophones to estimate bedload transport there is no general agreement between bedload rates and
in a lowland sandy-gravel-bed river constitutes a new re- apparent velocity (Rennie and Villard, 2004; Rennie et al.,
search topic. As discussed by several authors, the use of hy- 2017). The response of aDcp to bedload transport depends on
drophones was so far restrained to gravel-bed rivers (Bedeus several parameters. The variation of the impulse frequency,
and Ivicsics, 1963; Barton et al., 2010; Hilldale et al., 2014; the pulse length, beam focusing or associated internal signal
Thorne, 2014; Marineau et al., 2016; Geay et al., 2017) or processing (broadband or narrowband) can lead to different
marine environments (Thorne et al., 1984; Thorne, 1986; estimation of the apparent bedload velocity for the same sed-
Blanpain et al., 2015). More recently, Geay et al. (2020) iment transport conditions (Conevski et al., 2020a). These
highlighted that the acoustic power measured with a hy- parameters vary from one device to another (RDI/SonTek;
drophone can be correlated to the sampler measurements of Conevski et al., 2020b). The aDcp pulse samples a volume
bedload in fluvial environments characterized by bed slopes of the riverbed (Rennie et al., 2002), which can lead to a
varying between 0.05 % and 2.5 % and channel width rang- biased estimation of Va : (i) an underestimation in the case
ing between 8 and 60 m. In these mountainous environ- of high roughness of the riverbed with most of the reflected
ments, the median grain size ranged between 0.9 and 62 mm pulse scattered by the immobile particles below the active
https://doi.org/10.5194/esurf-9-423-2021 Earth Surf. Dynam., 9, 423–444, 2021434 J. Le Guern et al.: Relevance of acoustic methods to quantify bedload transport and bedform dynamics layer (Conevski et al., 2019) or (ii) an overestimation in the to estimate its effect on calibration curve and kinematic mod- case of high concentration of the bedload layer (Rennie et els. al., 2017) or sand particles in suspension near to the riverbed Contrarily to the aDcp, the DTM allows the investiga- (water bias; Rennie and Millar, 2004). Even if a general trend tion of the “event active layer” (Church and Haschenburger, seems to be highlighted by the river comparison (Fig. 3) with 2017). The DTM is not a punctual measurement of bedload. an increasing bedload rate as grain size increases for a con- Consequently, in the presence of macroforms such as bars, stant Va , the relationship between grain size and Va cannot it is difficult to compare with BTMA samples because it be easily determined in response to all variables mentioned takes into account dunes that are not necessarily present at above. One explanation of this trend could be that suspended the BTMA sampling point (typically downstream of a bar on sands could contribute to the bottom tracking signal with- the lee side). To some extent, the DTM and BTMA meth- out being caught by the sampler (Rennie et al., 2017). More- ods integrate bedload longitudinally at different scales. The over, the accuracy of the measurement on a single cross sec- presence of a local disturbance (or migrating bedform at low tion depends on the water depth heterogeneity that in turn celerity) will affect the measurement. The determination of influences the aDcp footprint and makes the aDcp method dune celerity by post-processing is time-consuming com- location sensitive when bedforms are present (Fig. 9b). Es- pared with the determination of dune morphology and the timation of bedload rates using empirical equations is lim- existing open-access post-processing tools. In order to de- ited by the number of variables that are difficult to measure termine bedload rates with empirical equations, this method in the field (e.g. thickness and concentration of active layer; needs a calibration coefficient that is difficult to measure in Kostaschuck et al., 2005; Villard et al., 2005; Holmes, 2010; field studies (Ten Brinke et al., 1999; Wilbers, 2004). More- Latosinski et al., 2017; Conevski, 2018). The results shown over, physical samplers sample the dynamical active layer in Fig. 4a suggest that Eq. (4) estimates sampler bedload and thus are more comparable to the hydrophones and aD- rates if the projected bedload velocity is used. This kinematic cps. Nevertheless, DTM remains an accurate method to es- model does not account for the thickness or the sediment timate bedload transport in the Loire River (Fig. 5a) where concentration of the bedload layer and assumes that bedload dunes are present and high enough (over the mean annual transport never exceeds the size of a single particle assessed discharge). as uniform in terms of grain size (Rennie et al., 2002). These As suggested by previous authors, both an aDcp (Ken- assumptions seem not to be appropriate for a sandy-gravel- ney, 2006) and a hydrophone (Bedeus and Ivicsics, 1963) bed river. The active layer thickness should increase as sus- allow a reliable representation of bedload fluxes on a cross pended bed material load increases. Nevertheless, results are section through the regressions with bedload rates obtained in agreement with BTMA bedload rates (Fig. 4a). This can be using samplers. Figure 9a and b highlight the benefits of explained by an underestimation of the apparent bedload ve- the use of acoustic devices for the determination of bed- locity when it is projected in the flow direction. On the other load transport rates in large sandy-gravel-bed rivers. In the hand, Van Rijn (1984) defined the bedload layer thickness present study, the time needed in the field to complete the equal to the saltation height. The computed values of bed- BTMA, DTM, aDcp and hydrophone methods (the red, yel- load layer thickness are coherent with other estimations per- low, blue and black lines of Fig. 9b, respectively) are about formed on comparable rivers (Conevski et al., 2020a). Equa- 1 d, 4 h, 1.5 h and 45 min, respectively. These times were es- tion (5) better estimates sampler bedload rates using the raw timated including the time needed to position and anchor the bedload velocity (Fig. 4b). If we consider that cb and ds are boat at each sampling point. This underlines the high poten- well estimated by van Rijn equations (Eqs. 6 and 7), these tial of hydrophones to quantify bedload in large rivers with results confirm that the projection of the apparent bedload high spatial variability of sediment transport and map bed- velocity decreases the bedload velocity magnitude when the load sediment fluxes at a large scale as proposed by Williams bedload direction differs from flow direction (e.g. bed slope et al. (2015) using the aDcp. Moreover, all indirect methods effects). The influence of bedload velocity projection appears tested here seem to be able to quantify total bedload trans- to be important when bedload is computed using kinematic port as efficiently as the direct method (Fig. 7b), but special models. Nevertheless, the calibration curve seems to be in care should be taken with local estimation of bedload rates agreement with other studies. Although the application do- (Fig. 9a and b). main of Eq. (4) does not correspond to the conditions in the Finally, regarding the correlation of aDcp and hydrophone Loire River, the decrease in projected Va seems to compen- with BTMA (Figs. 3 and 5b), we can raise the question of the sate for the overestimation of bedload rates when the raw reference method. Indeed, the regression between an aDcp apparent bedload velocity is used. This is the opposite for and a hydrophone is more significant (R 2 = 0.76), and it Eq. (5), which accounts for bedload layer thickness and sedi- could be the quality and the accuracy of BTMA sampling ment concentration. In this case, the projection of Va leads to that reduce the quality of indirect measurement regressions. an underestimate of bedload rates. Further works need to be done to improve the post-processing of Va by recently pub- lished filtering procedures (Conevski et al., 2019, 2020a) and Earth Surf. Dynam., 9, 423–444, 2021 https://doi.org/10.5194/esurf-9-423-2021
J. Le Guern et al.: Relevance of acoustic methods to quantify bedload transport and bedform dynamics                         435

5.2   Hydrophone and aDcp sensitivity to bedform                  low the observation of changes in the acoustic power along
      observations                                                the bedform stoss sides. On the contrary, for higher dunes
                                                                  (HD = 1 m, Fig. 11b) the bedload-generated noise can be
Passive (hydrophone) and active (aDcp) acoustic devices are       well recorded by the hydrophone. A hydrophone senses all
rarely used to analyse the bedload transport rates associ-        noises that are propagating in the water column. Therefore,
ated with bedforms in relatively large lowland rivers. Sev-       the hydrophone can record noises that are far away from its
eral studies mention differences in apparent bedload veloc-       location. Noises are more and more attenuated with increas-
ity according to the location on bedforms (Rennie and Mil-        ing distance (Geay et al., 2019). Particularly, when there is
lar, 2004; Villard and Church, 2005; Gaeuman and Jacobson,        little bedload noise close to the hydrophone, the hydrophone
2006; Holmes, 2010; Latosinski et al., 2017). These authors       can sense the bedload noise that is generated far away. This
have shown that apparent bedload velocity increases from          behaviour could explain why the hydrophone tends to over-
trough to crest of the dune and confirmed previous obser-         estimate bedload fluxes when bedload fluxes are weak espe-
vations made with samplers (Kostachuck and Villard, 1996;         cially immediately downstream of a bar front (Fig. 9b).
Carling et al., 2000). These observations were made on large          Hydrophone lower detection limit was not reached during
dunes that migrate too slowly to allow a continuous mea-          our study whereas the dispersion of bedload rates measured
surement along bedforms. Our study complements these ob-          with samplers for low apparent bedload velocity (Fig. 3) sug-
servations by providing a fixed and continuous measurement        gests that the lower detection limit of the apparent bedload
of apparent bedload velocity and providing bedload trans-         velocity by the aDcp seems to be about 1 cm s−1 (Rennie et
port rate estimation based on a calibration curve. The mean       al., 2017). This lower detection limit of the apparent bedload
time between two subsequent crests (1 h) shows that even for      velocity should be reduced to the bottom track uncertainty by
small bedforms (HD = 0.05 to 0.2 m; Fig. 10a and b), the          using our protocol with a submerged and fixed aDcp device.
aDcp location significantly influences the bedload rates cal-
culated over a dune field (0.03 to 0.08 m s−1 of difference
between crest and trough). This suggests that care should be      6   Conclusions
taken using this method on river beds where large dunes are
present but also when small dunes are migrating. According        In this work, direct (BTMA samplers), active (aDcp and
to Rennie and Millar (2004), the sampling area diameter in-       DTM) and passive (hydrophone) acoustic measurements of
creases with the water depth and is approximately equal to        bedload transport rates were compared in a large, sandy-
flow depth. Our protocol minimizes the water depth by sub-        gravel-bed river characterized by the presence of bars and
merging the aDcp and therefore minimizes the beams sam-           superimposed dunes. Calibration curves between apparent
pling diameter, hence minimizing the probability of sampling      bedload velocity measured using aDcp and bedload rates
on the stoss or lee sides of the same dune simultaneously.        measured using BTMA samplers were established but re-
   In our study context, the acoustic power recorded by the       main site-specific and dependent on grain size. DTM seemed
hydrophone was not affected by the distance between the           to be inappropriate where macroforms are present, as it in-
hydrophone and the river bed. To our knowledge, there are         fluences the location and the size of superimposed meso-
no references mentioning investigations on bedload trans-         forms. The calculation of bedload rates with empirical for-
port rates associated with bedforms using a hydrophone. At        mulas is sensitive to the bedload discharge coefficient for
a large time step (mean aDcp and hydrophone samples), the         DTM and to the thickness and concentration of the active
apparent bedload velocity and the acoustic power did not          layer for aDcp. These parameters remain difficult to mea-
follow the observed trend of mean bedform characteristics         sure in the field. Results presented in this study highlight the
derived from DTM measurement (dune celerity and dune              potential of the hydrophone for the quantification and map-
height). This could be explained by the difference of spa-        ping of bedload transport rates in relatively large river chan-
tial scales between DTM and other methods. For a smaller          nels where migrating bedforms are present. Previously hy-
time step, our results showed that acoustic power is able to      drophones have mainly been used to monitor bedload trans-
describe the influence of bars on bedload sediment transport      port rates in gravel-bed rivers. This study consolidates a re-
(Fig. 11a). Moreover, as for the aDcp, the hydrophone also        cent study (Geay at al., 2020) by extending a general calibra-
detects the theoretical pattern of bedload transport rates as-    tion curve to large sandy-gravel-bed rivers. The hydrophone
sociated with bedform migration. As shown by Reesink et           global calibration curve allows a good representation of the
al. (2014), the lee effect generated by bar fronts influences     bedload flux evolution through a cross section. The method
the development of dunes downstream. Specifically, the hy-        is more affordable to implement and more efficient than the
drophone is able to record the decrease in the acoustic power     reference method. This might allow mapping bedload trans-
immediately downstream of the bar front and its progres-          port rates by interpolating acoustic power along several cross
sive increase downstream (translated by the development of        sections performed on a large sandy-gravel-bed river. More-
dunes at about 11:06 LT, Fig. 11a). In the present study, dunes   over, acoustic devices (aDcp and hydrophone) are able to
smaller than 0.4 m (Fig. 11a) were not high enough to al-         capture the evolution of bedload signal along bedform stoss

https://doi.org/10.5194/esurf-9-423-2021                                               Earth Surf. Dynam., 9, 423–444, 2021
You can also read