Increased new particle yields with largely decreased probability of survival to CCN size at the summit of Mt. Tai under reduced SO2 emissions - Recent
←
→
Page content transcription
If your browser does not render page correctly, please read the page content below
Atmos. Chem. Phys., 21, 1305–1323, 2021
https://doi.org/10.5194/acp-21-1305-2021
© Author(s) 2021. This work is distributed under
the Creative Commons Attribution 4.0 License.

Increased new particle yields with largely decreased probability
of survival to CCN size at the summit of Mt. Tai
under reduced SO2 emissions
Yujiao Zhu1,2 , Likun Xue1,3 , Jian Gao4 , Jianmin Chen5 , Hongyong Li1 , Yong Zhao6 , Zhaoxin Guo6 , Tianshu Chen1 ,
Liang Wen1 , Penggang Zheng1 , Ye Shan1 , Xinfeng Wang1 , Tao Wang7 , Xiaohong Yao8 , and Wenxing Wang1
1 Environment  Research Institute, Shandong University, Qingdao 266237, China
2 StateKey Laboratory of Organic Geochemistry, Guangzhou Institute of Geochemistry, Chinese Academy of Sciences,
Guangzhou 510640, China
3 Collaborative Innovation Center for Climate Change, Jiangsu Province, Nanjing 210023, China
4 Chinese Research Academy of Environmental Sciences, Beijing 100012, China
5 Shanghai Key Laboratory of Atmospheric Particle Pollution and Prevention (LAP3), Department of Environmental Science

& Engineering, Fudan University, Shanghai 200433, China
6 Taishan National Reference Climatological Station, Tai’an 271000, China
7 Department of Civil and Environmental Engineering, Hong Kong Polytechnic University, Hong Kong SAR 99907, China
8 Key Lab of Marine Environmental Science and Ecology, Ministry of Education,

Ocean University of China, Qingdao 266100, China

Correspondence: Likun Xue (xuelikun@sdu.edu.cn) and Xiaohong Yao (xhyao@ouc.edu.cn)

Received: 16 April 2020 – Discussion started: 14 May 2020
Revised: 10 December 2020 – Accepted: 10 December 2020 – Published: 29 January 2021

Abstract. Because anthropogenic sulfur dioxide (SO2 ) emis-      the campaign-based comparison showed that the occurrence
sions have decreased considerably in the last decade, PM2.5      frequency, in which the maximum geometric median diam-
pollution in China has been alleviated to some extent. How-      eter of the grown new particles (Dpgmax ) was > 50 nm, de-
ever, the effects of reduced SO2 on the particle number con-     creased considerably from 43 %–78 % of the NPF events be-
centrations and subsequent contributions of grown new par-       fore 2015 to < 12 % in 2017–2018. Assuming > 50 nm as a
ticles to cloud condensation nuclei (CCN) populations, par-      CCN threshold size at high supersaturations, the observed net
ticularly at high altitudes with low aerosol number loadings,    CCN production decreased from 3.7 × 103 cm−3 (on aver-
are poorly understood. In contrast, the increase in provincial   age) in the five campaigns before 2015 to 1.0 × 103 cm−3 (on
forest areas in China with rapid afforestation over the last     average) in the two campaigns in 2017–2018. We argue that
few decades expectedly increases the biogenic emissions of       the increases in the apparent FR and NMINP are mainly de-
volatile organic compounds and their oxidized products as        termined by the availability of organic precursors that partici-
nucleating precursors therein. In this study, we evaluated the   pate in nucleation and initial growth, whereas the decrease in
campaign-based measurements made at the summit of Mt.            the growth probability is caused by the reduced emissions of
Tai (1534 m a.s.l.) from 2007 to 2018. With the decrease in      anthropogenic precursors. However, large uncertainties still
SO2 mixing ratios from 15 ± 13 ppb in 2007 to 1.6 ± 1.6 ppb      exist because of a lack of data on the chemical composition
in 2018, the apparent formation rate (FR) of new particles       of these smaller particles.
and the net maximum increase in the nucleation-mode parti-
cle number concentration (NMINP) in the spring campaign
of 2018 was 2- to 3-fold higher than those in the spring
campaign of 2007 with almost the same occurrence fre-
quency of new particle formation (NPF) events. In contrast,

Published by Copernicus Publications on behalf of the European Geosciences Union.
1306                          Y. Zhu et al.: Increased new particle yields with decreased survival probability to CCN size

1   Introduction                                                   2014; Kalivitis et al., 2019). Moreover, a slight upward trend
                                                                   in the particle formation and growth rates was observed in
Atmospheric new particle formation (NPF) is regarded as            Pallas and Hyytiälä, attributable to the increased biogenic
an important source of aerosol particles in terms of num-          VOC (BVOC) emissions (Asmi et al., 2011; Nieminen et al.,
ber concentrations, and the newly formed particles can grow        2014).
into a variety of sizes with different health and climate ef-         In China, the earliest observation of NPF events started in
fects. For example, particles larger than 50–80 nm may act         approximately 2004 in Beijing (Wu et al., 2007). The com-
as cloud condensation nuclei (CCN), whereas those larger           parison of tens of independent experiments showed that the
than 100 nm may directly affect solar radiation (Kulmala           NPF frequency has remained relatively constant until recent
and Kerminen, 2008; Kerminen et al., 2012; Seinfeld and            years, possibly due to the reduced production and reduced
Pandis, 2012). Sulfuric acid (H2 SO4 ) is considered as the        loss rate of H2 SO4 ; these phenomena may have canceled
key nucleating precursor for NPF, and other species, such as       each other out to some extent in Beijing (Chu et al., 2019;
ammonia (NH3 ), amines, and highly oxygenated molecules            Li et al., 2020). In addition, a recent study reported that
(HOMs, the oxidation products of volatile organic com-             China has experienced rapid afforestation by a net increase
pounds (VOCs)), can also participate and enhance nucleation        of ∼ 18 % in leaf area from 2000 to 2017 with provincial for-
in the continental troposphere (Ehn et al., 2014; Tröstl et al.,   est areas increasing by between 0.04 and 0.44 million ha yr−1
2016; Yao et al., 2018; Kerminen et al., 2018; Chu et al.,         over the past 10 to 15 years, leading to an increase in the CO2
2019; Lee et al., 2019). The subsequent growth of new par-         sink based on long-term observations over large spatial scales
ticles is affected by not only the abovementioned precursors       (Chen et al., 2019; Wang et al., 2020). BVOC emissions in
but also the semivolatile compounds (Riipinen et al., 2012;        China are reasonably expected to have increased over the past
Ehn et al., 2014; Tröstl et al., 2016).                            decades (Zhang et al., 2016; Chen et al., 2018). Considering
   NPF events have been reported widely throughout the             the key roles of oxidized BVOCs in NPF events (Riipinen
world, including in severely polluted urban and rural areas        et al., 2012; Ehn et al., 2014; Tröstl et al., 2016; Chu et al.,
in China that experience high sulfur dioxide (SO2 ) concen-        2019), the responses of NPF in China in terms of their oc-
trations and high aerosol loading (Kulmala et al., 2004; Gao       currence frequency, intensity, and potential impacts on the
et al., 2009; Guo et al., 2012; Nie et al., 2014; Kerminen         climate to reduced anthropogenic SO2 emissions may not be
et al., 2018; Chu et al., 2019). In the last few decades, an-      the same as those observed in Europe and North America.
thropogenic emissions of gaseous and particulate air pollu-        However, the long-term changes in NPF intensities and the
tants in China have been reduced substantially due to rigor-       subsequent growth of new particles have not been studied in
ous emission control policies. Between 2007 and 2018 (the          China, where the anthropogenic emissions of various air pol-
observation period in this study), the national total SO2 emis-    lutants and biogenic emissions of VOCs have been changing
sions decreased by 67 % (from 24.7 million to 8.2 million          in opposite directions in the past decade.
tons), and the national average ambient SO2 concentrations            In this study, we analyzed the measurement data of particle
decreased by 73 % (from 17.9 to 4.9 ppb; see Fig. S1 in the        number concentrations, chemical compositions, trace gases,
Supplement). The North China Plain (NCP) region experi-            and meteorological parameters collected at the summit of Mt.
ences the most severe SO2 pollution, which has a visibly de-       Tai (36.25◦ N, 117.1◦ E; 1534 m a.s.l.) during seven observa-
creased trend since 2011 (Krotkov et al., 2016; Fan et al.,        tional campaigns from 2007 to 2018. Mt. Tai is the highest
2020). Such huge reductions in SO2 emissions may alter the         mountain in the NCP, located at the region’s center, and the
frequency and intensity of NPF events and the subsequent           observation station has been widely deployed to investigate
growth of new particles. The changes in the mixing ratios          regional air pollution as well as transport and chemical pro-
of VOC components, ambient oxidants, aerosol loading, and          cesses in the NCP (Gao et al., 2005; Li et al., 2011; Sun et al.,
meteorological factors may also influence NPF events, yield-       2016; Wen et al., 2018). Moreover, the summit is close to the
ing more complex and uncertain feedback (Kulmala and Ker-          top of the planetary boundary layer, or even in the free tro-
minen, 2008; Zhang et al., 2012).                                  posphere sometimes, and is characterized by relatively few
   The long-term changes in NPF events under lower SO2             pre-existing particles, strong UV solar radiation, and low am-
conditions have been studied in several cities in Europe           bient temperature, which favor NPF events (Li et al., 2011;
and the US. For example, decreased NPF frequency and re-           Shen et al., 2016a; Lv et al., 2018). The tree coverage areas
duced new particle yields were associated with decreases           around the sampling site evidently increased from 2003 to
in SO2 concentrations in Pittsburgh (US), Rochester (US),          2016 based on MODIS satellite data (Fig. S2 in the Supple-
and Melpitz (Germany) (Hamed et al., 2010; Y. Wang et              ment). The contribution of new particles to the CCN popula-
al., 2011; Wang et al., 2017; Saha et al., 2018). In contrast,     tion, compared with that of primary particles, reportedly in-
long-term studies in Pallas (Finland), Hyytiälä (Finland), and     creases above the boundary layer, indicating a critical role of
Crete (Greece) observed no trends in NPF frequencies de-           high-altitude NPF in cloud formation and the related climate
spite considerable decreases in the ambient SO2 concentra-         impacts (Merikanto et al., 2009). The main goals of this study
tions all over Europe (Asmi et al., 2011; Nieminen et al.,         were (1) to examine the effects of reduced SO2 emissions on

Atmos. Chem. Phys., 21, 1305–1323, 2021                                              https://doi.org/10.5194/acp-21-1305-2021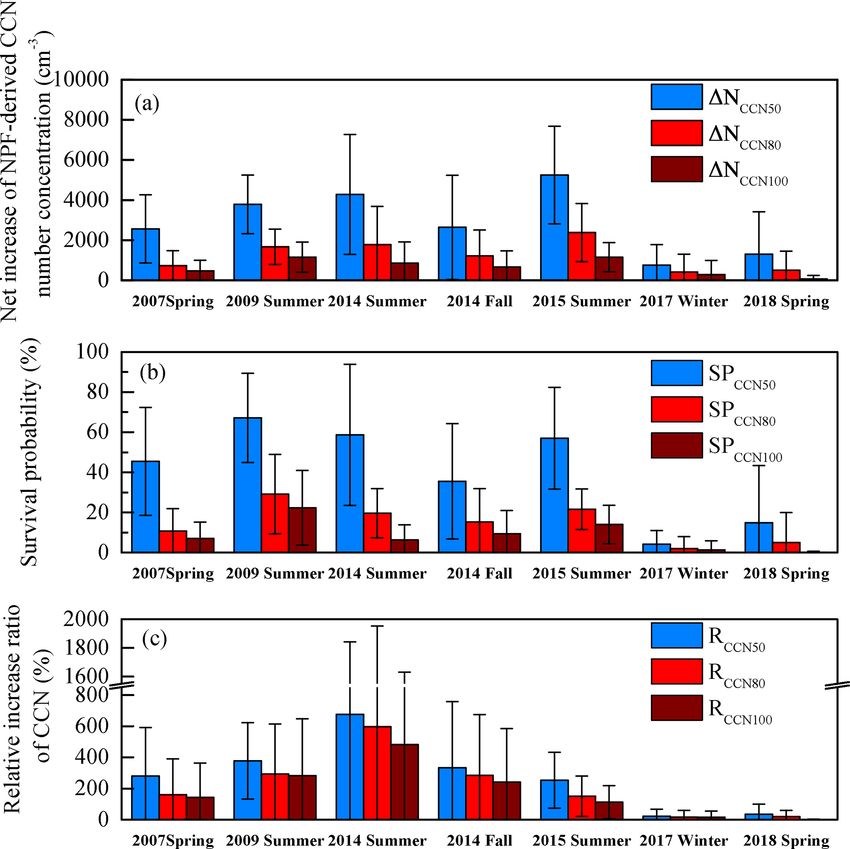
Y. Zhu et al.: Increased new particle yields with decreased survival probability to CCN size                                 1307

regional NPF events at a high altitude (from the upper bound-      and those after had a negligible influence on the net increases.
ary layer to the lower free troposphere), i.e., the changes in     In addition, the use of the 10–153 nm particles in 2007 may
the NPF frequency, intensity, and subsequent growth of new         lead to underestimation of the particle number concentration,
particles; (2) to quantify the potential contribution of new       as detailed in the Supplement.
particles to the CCN population and its changes under de-              The WPS instrument was calibrated and/or repaired ev-
creasing SO2 emissions; and (3) to rationalize the variation       ery 1–2 years by its vendor. The regular maintenance al-
patterns of the NPF characteristics and CCN parameters in          lowed the WPS to perform well based on the recent com-
terms of observational concentrations of gaseous precursors        parison results of the WPS and a new scanning mobility par-
and their origins and atmospheric behaviors. Note that all         ticle sizer (SMPS, Grimm, Germany) in the summer of 2020,
these changes in the study area should occur under the back-       as shown in Fig. S3 in the Supplement. The regular calibra-
ground of an increase in BVOCs and their oxidized products         tion parameters included the DMA sample/sheath flow, LPS
as nucleating precursors over the decade in China, although        sample/sheath flow, DMA/CPC pressure, DMA voltage, and
no studies can confirm the decadal increase in nucleating pre-     DMA/ambient temperature. Polystyrene latex (PSL) spheres
cursors from biogenic VOCs because of the lack of related          (NIST, USA) with mean diameters of 100.7 and 269 nm were
analytic technologies in the past.                                 used for calibration. At the beginning of each campaign, the
                                                                   zero points of the DMA, CPC, and LPS were checked using
                                                                   a purge filter at the inlet. Sometimes the WPS operated im-
2     Methods                                                      properly and the data were excluded from the analysis (see
                                                                   Fig. S4 in the Supplement for the occasional unexpected er-
2.1    Experiment                                                  rors in three channels around 213 nm). In addition, we re-
                                                                   produced the PM2.3 mass concentration from the WPS data
This study comprised seven intensive campaigns from 2007           and found that it was reasonably comparable to the measured
to 2018, and the details are summarized in Table 1. The dura-      PM2.5 , further supporting the accuracy of the WPS data. De-
tion of each campaign varied from 18 to 71 d. The measure-         tails can be found in Fig. S5 in the Supplement.
ment data obtained in the four campaigns in 2007, 2014, and            The trace gases were monitored during each campaign.
2015 have been reported by Gao (2008) and Lv et al. (2018).        SO2 was measured using an ultraviolet fluorescence ana-
Here, all of the available data were combined to examine the       lyzer (Model 43C, Thermo Electron Corporation, USA), O3
effects of reduced SO2 emissions on regional NPF events.           was monitored using two ultraviolet absorption analyzers
   All measurements were obtained using commercial instru-         (Model 49C, Thermo Electron Corporation, USA, or Model
ments, which were housed in a container and have been de-          400U, Advanced Pollution Instrumentation Inc., USA), and
scribed in previous studies (e.g., Zhou et al., 2009; Lv et al.,   NO and NO2 were monitored using a chemiluminescence
2018). During the seven campaigns, the particle number size        analyzer (Model 42C or 42i, Thermo Electron Corporation,
distributions (PNSDs) were monitored using a wide-range            USA) equipped with a blue light converter before August
particle spectrometer (WPS; Model 1000XP, MSP Corpora-             2014 and subsequently using a chemiluminescence analyzer
tion, USA) at ambient relative humidity (RH). Conductive           (Model T200U, API, USA) and a cavity-attenuated phase-
tubes (TSI 1/4 in.) were used for the WPS sampling, and            shift spectroscopy instrument (Model T500U, API, USA), re-
the length of the tube was kept at approximately 2 m in each       spectively. For the SO2 , O3 , NO, and NO2 analyzers, we per-
campaign. The WPS combines a differential mobility ana-            formed multipoint calibrations every month and changed the
lyzer (DMA), a condensation particle counter (CPC), and a          filter every two weeks. The detection limits of SO2 , O3 , NO,
laser particle spectrometer (LPS). The DMA and CPC can             and NO2 were 1, 0.4, 0.04, and 0.4 ppb, respectively. PM2.5
measure particles in the 10–500 nm (or 5–500 nm in the ad-         was measured using a TEOM 1400a in 2007 and a Thermo
vance mode) size range in 48 channels. The DMA was oper-           5030 SHARP after 2014. This device was calibrated by mass
ating in the voltage-scanning mode. The LPS covers the size        foil calibration according to the instrument manual and the
range of 350 nm–10 µm and is divided into 24 channels. In          detection limit was 0.5 µg m−3 . The inorganic water-soluble
this study, the detection limit of the DMA was 10 nm in 2007       ions in PM2.5 together with the acid and alkaline gases were
and 2009, while it was 5 nm in 2014, 2015, 2017, and 2018.         measured using an online ambient ion monitor (URG-AIM
For consistency, the particles sized 10–300 nm were used for       9000B, URG Corporation, USA; only for water-soluble ions
the calculations in all campaigns except for that in spring of     in PM2.5 ) in 2007 and using a Monitor for Aerosols and
2007, when the data of > 153 nm particles were missing, so         Gases (MARGA; ADI20801, Applikon-ECN, Netherlands)
we used the data of 10–153 nm particles instead for the cal-       in the five campaigns from 2014 onward. A multipoint cal-
culation. The net increases in the number concentrations of        ibration was performed for the online MARGA before and
10–25 nm particles during the initial several hours of NPF         after the field campaigns to examine the sensitivity of the
events were over 1–2 orders of magnitude in this study, e.g.,      detectors. The detection limits were determined to be 0.05,
                                                                                                                    2−
in Fig. 1b, d. The uncertainties of the measured particle num-     0.05, 0.04, and 0.05 µg m−3 for Cl− , NO−                    +
                                                                                                              3 , SO4 , and NH4 ,
ber concentrations at approximately 10 nm in 2007 and 2009         respectively. More details about the instrument calibration

https://doi.org/10.5194/acp-21-1305-2021                                            Atmos. Chem. Phys., 21, 1305–1323, 2021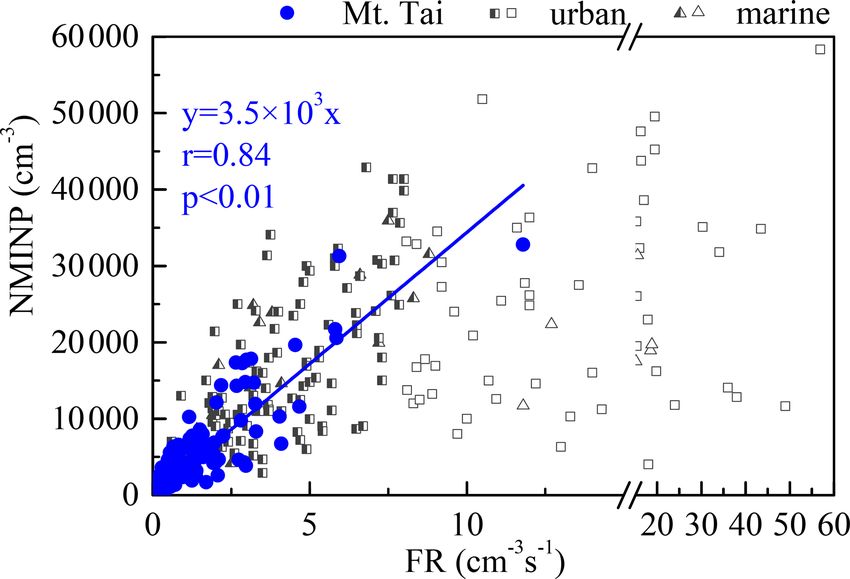
1308                          Y. Zhu et al.: Increased new particle yields with decreased survival probability to CCN size

Table 1. Summary of the seven observation campaigns at Mt. Tai.

                Campaign                Species                                    Instruments            Resolution
                Spring 2007             PNSD in 10 nm–10 µm                        WPS, MSP 1000XP        8 min
                22 Mar–24 Apr 2007      SO2 , O3 , NO, and NO2                     Thermo 43C, 49C, 42C   1 min
                                        PM2.5                                      TEOM 1400a             1 min
                                        Water-soluble ions in PM2.5                URG-AIM 9000B          1h
                Summer 2009             PNSD in 10 nm–10 µm                        WPS, MSP 1000XP        8 min
                12–29 Jun 2009          SO2 , O3 , NO, and NO2                     Thermo 43C, 49C, 42C   1 min
                Summer 2014             PNSD in 5 nm–10 µm                         WPS, MSP 1000XP        5 min
                26 Jul–27 Aug 2014      SO2 , O3 , NO, and NO2                     Thermo 43C, 49C, 42i   1 min
                                        PM2.5                                      Thermo 5030 SHARP      1 min
                                        Ions in PM2.5 , acid, and alkaline gases   MARGA, ADI20801        1h
                Fall 2014               PNSD in 5 nm–10 µm                         WPS, MSP 1000XP        5 min
                21 Sep–30 Nov 2014      SO2 , O3                                   Thermo 43C, 49C        1 min
                                        NO, NO2                                    API T200U, T500U       1 min
                                        PM2.5                                      Thermo 5030 SHARP      1 min
                                        Ions in PM2.5 , acid, and alkaline gases   MARGA, ADI20801        1h
                Summer 2015             PNSD in 5 nm–10 µm                         WPS, MSP 1000XP        5 min
                16 Jun–25 Jul 2015      SO2 , O3                                   Thermo 43C, 49C        1 min
                                        NO, NO2                                    API T200U, T500U       1 min
                                        PM2.5                                      Thermo 5030 SHARP      1 min
                                        Ions in PM2.5 , acid, and alkaline gases   MARGA, ADI20801        1h
                Winter 2017             PNSD in 5 nm–10 µm                         WPS, MSP 1000XP        5 min
                26 Nov–30 Dec 2017      SO2 , O3                                   Thermo 43C, API 400U   1 min
                                        NO, NO2                                    API T200U, T500U       1 min
                                        PM2.5                                      Thermo 5030 SHARP      1 min
                                        Ions in PM2.5 , acid, and alkaline gases   MARGA, ADI20801        1h
                Spring 2018             PNSD in 5 nm–10 µm                         WPS, MSP 1000XP        5 min
                5 Mar–8 Apr 2018        SO2 , O3                                   Thermo 43C, API 400U   1 min
                                        NO, NO2                                    API T200U, T500U       1 min
                                        PM2.5                                      Thermo 5030 SHARP      1 min
                                        Ions in PM2.5 , acid, and alkaline gases   MARGA, ADI20801        1h

can be found in Wen et al. (2018) and Li et al. (2020). Data           (2005) and Kulmala et al. (2012), three features had to be
on the meteorological parameters including temperature (T ),           met for an event to qualify as NPF: (1) distinctly new nu-
RH, wind speed, wind direction, and precipitation were pro-            cleation mode particles must appear in the size distribution;
vided by the Mt. Tai Meteorological Station.                           (2) the new mode should prevail over a time span of hours;
   The air mass back trajectories were calculated using                and (3) the new mode should show signs of growth. All three
the Hybrid Single Particle Lagrangian Integrated Trajectory            features are required for a day (00:00–23:59 LT) to be clas-
(HYSPLIT) model. The input meteorological data (Global                 sified as an NPF day. Otherwise, the day is classified as a
Data Analysis System (GDAS) data) were used with a                     non-NPF day.
1◦ latitude–longitude resolution. A trajectory ending height              The initial time of an NPF event was defined as when new
of 1400 m a.g.l. was selected because the terrain height on            nucleation-mode particles started to be observed (e.g., t0 in
Mt. Tai was approximately 150 m in the GDAS data.                      Fig. 1b, d). The end time of an NPF event was defined as
                                                                       the new particle signal dropping to a negligible level and the
2.2     Calculation methods                                            total particle number concentrations approaching the back-
                                                                       ground levels before the NPF event. In cases with the in-
2.2.1    Definition of NPF events and relevant parameters              vasion of other plumes, the end time was determined to be
                                                                       when the new particle signals were suddenly overwhelmed
In this study, particles with diameters smaller than 25 nm             by plumes and could no longer be identified (e.g., the end
were defined as nucleation mode particles (Kulmala et al.,             times in Fig. 1b, d). The NPF event duration was defined as
2012). Following the criteria proposed by Dal Maso et al.

Atmos. Chem. Phys., 21, 1305–1323, 2021                                                  https://doi.org/10.5194/acp-21-1305-2021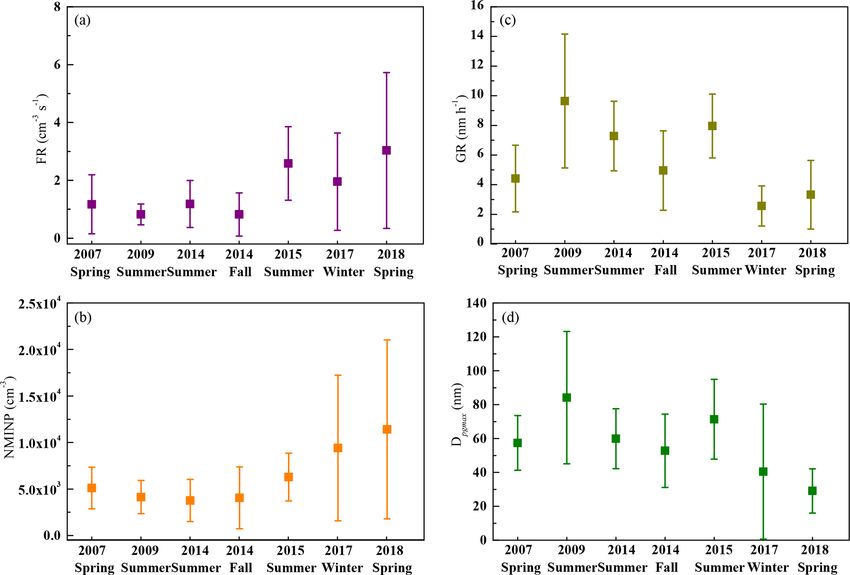
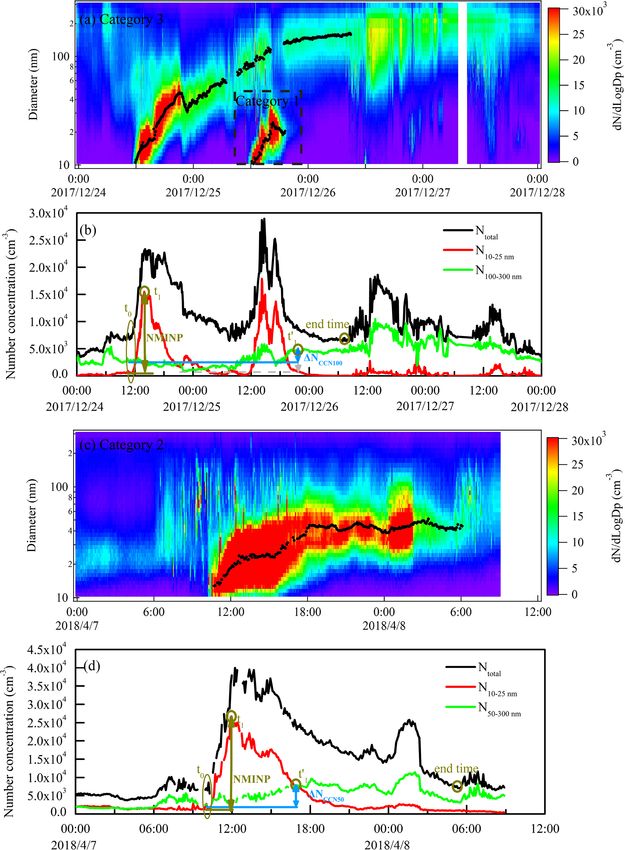
Y. Zhu et al.: Increased new particle yields with decreased survival probability to CCN size                                         1309

Figure 1. Examples of NPF events in three categories. Black dots in the figures are the fitted Dpg . (a) Category 1 on 25 December 2017, in
which Dpgmax was 24 nm (< 50 nm), and Category 3 on 24 December 2017, in which Dpgmax grew to 163 nm (> 80 nm); (c) Category 2 on
7 April 2018, in which Dpgmax grew to 53 nm (50–80 nm). (b, d) Schematic diagram of t0 , t1 , t10 , NMINP, and 1NCCN100 /1NCCN50 on
24 December 2017 and 7 April 2018 NPF events (a few spikes have been removed from d).

the time duration between the initial time and end time of an           rate (GR), and condensation sink (CS) (Sihto et al., 2006;
NPF event. Note that the detection limit of WPS was 10 nm,              Kulmala et al., 2012). The apparent FR of new particles is
but the particles were nucleated at critical cluster sizes of ap-       calculated based on nucleation-mode particles with sizes of
proximately 1–1.5 nm. Therefore, the NPF actually occurred              10–25 nm. The GR is quantified by fitting the geometric me-
at some time prior to our observation, and the actual duration          dian diameter of new particles (Dpg ) during the whole par-
should be longer than our calculation.                                  ticle growth period (Zhu et al., 2014, 2019). The size range
   Three parameters are commonly used to evaluate NPF                   of Dpg varies from event to event. Details of the calculation
characteristics, viz., apparent formation rate (FR), growth             equations can be found in the Supplement. Note that the lack

https://doi.org/10.5194/acp-21-1305-2021                                                  Atmos. Chem. Phys., 21, 1305–1323, 2021
1310                          Y. Zhu et al.: Increased new particle yields with decreased survival probability to CCN size

of measurements of > 153 nm particles in the spring cam-           particles larger than 100 nm can directly impact the climate
paign of 2007 may lead to an underestimation of the CS. We         by scattering and absorbing solar radiation (Charlson et al.,
tested the possible underestimation using the data measured        1992; Seinfeld and Pandis, 2012). In this study, we intro-
in 2018 by comparing the CS values calculated for the mea-         duced three terms: the net increase in the NPF-derived CCN
sured number concentrations of particles in the 10–153, 10–        number concentration (1NCCN ), the apparent survival proba-
300, and 10–2500 nm size ranges. The use of the 10–153 nm          bility (SP) of new particles to the CCN sizes, and the relative
particles may lead to ∼ 50 % underestimation of the CS com-        increase ratio of the CCN population (RCCN ). Three sizes,
pared to that using the 10–2500 nm particles. Thus, the CS         viz., 50, 80, and 100 nm, were defined as the CCN threshold
value from the 10–153 nm particles in the spring campaign          sizes. 1NCCN was calculated following the method of Rose
of 2018 was compared with that obtained in the spring cam-         et al. (2017):
paign of 2007. However, the CS values from the 10–300 nm
particles accounted for approximately 94 % of those from           1NCCN = NCCN (t10 ) − NCCN (t0 ),                          (2)
the 10–2500 nm particles. Thus, the CS values from the 10–
300 nm particles were used throughout the study, except in         where the NCCN terms represent the potential CCN number
2007.                                                              concentrations and were estimated from the number concen-
   Another two metrics were applied to characterize the NPF        trations of particles larger than 50, 80, and 100 nm (NCCN50 ,
events, i.e., the net maximum increase in the nucleation-          NCCN80 , and NCCN100 , respectively); t0 is the time when an
mode particle number concentration (NMINP) and the max-            NPF event is initially observed, the same as that in Eq. (1);
imum size of Dpg (Dpgmax ). The two metrics were proposed          and t10 is the time when NCCN reaches the maximum value
in our previous studies (Zhu et al., 2017, 2019). The NMINP        during the new particle growth periods. Each concentration
indicated the intensity of an NPF event, which was calculated      was taken as a 1 h average. The 1NCCN term eliminates the
as                                                                 influence of pre-existing particles. A schematic diagram of
NMINP = N10–25 nm (t1 ) − N10–25 nm (t0 ),                  (1)    NCCN100 and NCCN50 can be found in Fig. 1b, d.
                                                                      The SP was calculated as described by Zhu et al. (2019):
where N10–25 nm is the sum of the nucleation-mode parti-
cle number concentrations, and t0 and t1 represent the time        SP = 1NCCN /NMINP.                                         (3)
when an NPF event is initially observed and the time when
N10–25 nm reaches the maximum value, respectively. Fig-            Note that the spatial–temporal heterogeneity during NPF
ure 1b, d shows the schematic diagram of the NMINP.                events may result in high SPs. If the observed 1NCCN ex-
   Note that a few spikes were occasionally observed with          ceeded the NMINP and the calculated SPs exceeded 100 %,
a broader particle number size distribution during the NPF         it suggested that Eq. (3) was not applicable in these cases,
period. These spikes were excluded in the calculation of the       and SP was therefore not calculated.
FR, GR, Dpg , NMINP, and CCN parameters (described in                 The RCCN values were the ratios of the NPF-derived CCN
Sect. 2.2.2) because they may reflect primary particles from       to the pre-existing CCN and were calculated as follows:
localized sources (Liu et al., 2014; Man et al., 2015; Zhu et
al., 2017).
                                                                   RCCN = 1NCCN /NCCN (t0 ).                                  (4)
   According to the different sizes of Dpgmax , the NPF events
were classified into three categories (as shown in Fig. 1).
In Category 1 events (e.g., 25 December 2017, Fig. 1a), the        Moreover, Fig. 1b shows that the choice of t0 may lead to
new particles grow to a Dpgmax of < 50 nm and are too small        underestimation of 1NCCN to some extent in the presence of
to serve as CCN. In Category 2 events (e.g., 7 April 2018,         spatial–temporal heterogeneity of pre-existing particles with
Fig. 1b), the new particles grow to a Dpgmax of 50–80 nm. In       diameters larger than 50 nm. In these cases, the mean value of
Category 3 events (e.g., 24 December 2017, Fig. 1a), the new       NCCN in the percentiles smaller than the 5th during the whole
particles grow to Dpgmax of > 80 nm. The NPF events in Cat-        NPF event may more accurately represent the background
egories 2 and 3 can be regarded as climate-relevant events.        (see the gray dashed line in Fig. 1b). However, this method
                                                                   may also introduce more subjective factors and therefore was
2.2.2   CCN parameters                                             not adopted in this study.
                                                                      In addition, the maximum geometric median diameter of
In the absence of direct CCN measurements, the potential           the grown new particles never exceeded 89 nm in spring
contribution of new particles to the CCN population can            2007. Considering the log-normal distribution of the grown
be estimated from the particle number size distribution (Li-       new particles, the number concentration of grown new parti-
havainen et al., 2003; Rose et al., 2017). Theoretically, parti-   cles with diameters > 153 nm was less than 15 % (Fig. S6 in
cles larger than 50 nm (i.e., 80 nm) can be activated as CCN       the Supplement). Thus, it is safe to say that the lack of data
under quite high (moderate) supersaturation (Dusek et al.,         for > 153 nm particles had a negligible effect on the calcu-
2006; Petters and Kreidenweis, 2007; Ma et al., 2016), and         lated 1NCCN50 , 1NCCN80 , and 1NCCN100 in 2007.

Atmos. Chem. Phys., 21, 1305–1323, 2021                                             https://doi.org/10.5194/acp-21-1305-2021
Y. Zhu et al.: Increased new particle yields with decreased survival probability to CCN size 1311
2.2.3 Sulfuric acid proxy
The proxy for the H2 SO4 concentration could be roughly es-
timated based on the solar radiation (SR), SO2 concentra-
tion, CS, and RH as follows (Mikkonen et al., 2011; Lv et
al., 2018):
[H2 SO4 ] = 8.21 × 10⁻³ ·k·SR·[SO2 ]0.62 ·(CS·RH)−0.13 , (5)
where k is a temperature-dependent reaction rate constant
and SR was estimated from the HYSPLIT model.
The contribution of H2 SO4 vapor to the particle growth
from Dp0 to Dp1 can be expressed by the following equation
(Kulmala et al., 2001):
R = ([H2 SO4 ]avg /C) × 100 %, (6)
where [H2 SO4 ]avg is the average concentration of H2 SO4
Figure 2. Occurrence frequencies of NPF events in different cate-
during the particle growth period and C is the total concen-
gories at Mt. Tai during the seven observation campaigns.
tration of condensable vapor for the particle growth from Dp0
to Dp1 , which can be calculated as described by Kulmala et
al. (2001). Notably, uncertainty may exist in the estimated
2018 (3 %) were significantly lower than those before (14 %–
contribution of the SO2 concentrations and radiation inten-
39 %; p < 0.05), even in comparison with the relatively low
sity to H2 SO4 , as well as in the contribution of H2 SO4 to the
NPF frequencies in the summer of 2015 (15 %) and the fall
particle growth.
of 2014 (14 %). When the sums of the Category 2 and 3 NPF
frequencies in each campaign were normalized by the cor-
3 Results responding total NPF frequency, the boundary was clearer,
i.e., the normalized sum values were as high as 43 %–78 %
3.1 Variation in the NPF frequency before 2015 and < 12 % in 2017–2018. Clearly, the newly
formed particles observed at Mt. Tai in 2017–2018 were less
During the seven campaigns, NPF events were observed on climatically relevant than those before 2015 (64 %–78 % in
106 of the 265 sampling days. As shown in Fig. 2, the NPF the three summer campaigns versus 43 % and 59 % in the
frequencies in the three seasons of different years were sur- fall and spring campaigns), despite the comparable NPF fre-
prisingly almost the same, i.e., 50 % in the spring of 2007, quencies.
50 % in the summer of 2009, 49 % in the winter of 2017, and
51 % in the spring of 2018. However, the NPF frequency de- 3.2 Variations in the apparent FR, NMINP, GR, and
creased to 42 % in the summer of 2014, 33 % in the fall of Dpgmax
2014, and 20 % in the summer of 2015. The low NPF fre-
quencies were likely caused by perturbations from meteo- We used four metrics, i.e., the apparent FR, NMINP, GR, and
rological conditions. For example, there were 15 rainy days Dpgmax , to characterize the NPF events and evaluate the po-
out of the 40 sampling days during the 2015 summer cam- tential climate impacts of the grown new particles (Fig. 3).
paign, but only 3 rainy days out of the total 18 sampling During the four campaigns in 2007, 2009, and 2014, the cal-
days in the 2009 summer campaign. Moreover, the solar ra- culated apparent FR varied narrowly in each campaign and
diation averaged over the 2009 summer campaign was 1.4 the campaign average narrowed to 0.8–1.2 cm−3 s−1 . The
times that of the 2015 summer campaign (Fig. S7 in the Sup- apparent FR increased in the three subsequent campaigns,
plement). These factors may have caused the NPF frequency i.e., 2.6 ± 1.3 cm−3 s−1 in 2015, 2.0 ± 1.7 cm−3 s−1 in 2017,
in the 2009 summer campaign to be close to that in the other and 3.0 ± 2.7 cm−3 s−1 in 2018. The apparent FRs were 3–7
season campaigns but that of the 2015 summer campaign to times lower than those obtained from the measurements with
be lower. a lower limit of 3 nm of the twin differential mobility particle
When Categories 1, 2, and 3 of the NPF events were exam- sizer (TDMPS) and neutral cluster and air ion spectrometer
ined separately, the Category 1 NPF frequencies in the winter (NAIS) at the same site during previous campaigns (Shen et
of 2017 (43 %) and the spring of 2018 (49 %) were signifi- al., 2016a, b; Lv et al., 2018).
cantly higher than those before (5 %–21 %; p < 0.05). Cate- The NMINP showed a temporal variation pattern sim-
gory 2 events were absent in the winter of 2017, whereas Cat- ilar to that of the apparent FR (Fig. 3b). The cam-
egory 3 events were absent in the spring of 2018. The sums paign average NMINP varied in a narrow range of
of the Category 2 and 3 NPF frequencies in 2017 (6 %) and 3.8–5.1 × 103 cm−3 in 2007–2014 but then increased to
https://doi.org/10.5194/acp-21-1305-2021 Atmos. Chem. Phys., 21, 1305–1323, 20211312 Y. Zhu et al.: Increased new particle yields with decreased survival probability to CCN size
Figure 3. Campaign average of the new particle formation rate (FR, a), the net maximum increase in the nucleation-mode particle number
concentration (NMINP, b), the new particle growth rate (GR, c), and the maximum geometric median diameter of the grown new particles
(Dpgmax , d) during the seven observation campaigns. The error bars are the standard deviations.
6.3 ± 2.6 × 103 cm−3 in 2015, 9.4 ± 7.9 × 103 cm−3 in 2017, was only 60 ± 18 nm in the summer of 2014, followed by
and 1.1 ± 1.0 × 104 cm−3 in 2018. The increase in the 57 ± 16 nm in the spring of 2007, 53 ± 22 nm in the fall of
NMINP should enhance the contribution of NPF events to 2014, and 40 ± 40 nm in the winter of 2017. The campaign
the ambient particle number concentration, but the NMINP average Dpgmax in the spring of 2018 was the lowest, i.e.,
at Mt. Tai before 2015 was only approximately 1/4–1/2 of 29 ± 13 nm, although the campaign average GR was even
those of our previous observations in urban and marine at- larger than that in the winter of 2017. These findings indicate
mospheres (Zhu et al., 2017, 2019). that Dpgmax is clearly determined not only by the GR but also
The variations in GR were strongly seasonally dependent by unidentified factors, which is addressed in Sect. 4.2.
(Fig. 3c). Higher GRs were generally observed in the sum- In summary, we found that the apparent FR and NMINP in
mer campaigns, with the three campaign averages in the the spring campaign of 2018 were higher than those of 2007.
range of 7.3–9.6 nm h−1 . The higher GRs in summer were The GR showed strong seasonal dependence. The Dpgmax
due to the higher photochemical reactions and biological ac- was significantly lower in 2018, but the GR alone could not
tivities, which is consistent with those reported in the liter- explain the lower values.
ature (Kulmala et al., 2004; Chu et al., 2019). The reverse
was true in winter, and a lower GR was expectedly observed 3.3 Potential contribution to CCN production from the
in the winter of 2017, i.e., 2.3 ± 1.3 nm h−1 . The GRs in the NPF events
fall and spring campaigns ranked between those of the sum-
mer and winter campaigns. For example, the average GR was Direct measurements of the CCN were not available; there-
4.9 ± 2.7 nm h−1 in the fall of 2014. The average GR in the fore, the potential contributions of the grown new parti-
spring of 2007 (4.4 ± 2.3 nm h−1 ) was slightly higher than cles to the CCN population were estimated using Eqs. (2)–
that in the spring of 2018 (3.3 ± 2.3 nm h−1 ), although the (4). The contributions varied considerably between cam-
apparent FR and NMINP increased considerably in the latter paigns (Fig. 4). In general, the NPF-derived CCNs were sea-
spring campaign. sonally dependent, i.e., the highest number concentrations
The Dpgmax is partially determined by the GR. The largest occurred in summer, followed by spring, fall, and winter.
campaign average Dpgmax of 84 ± 39 nm appeared as ex- With an increase in the threshold diameters, roughly corre-
pected in the summer of 2009, followed by 71 ± 24 nm in sponding to a decrease in supersaturation from > 0.6 % to
the summer of 2015. However, the campaign average Dpgmax < 0.1 % (Li et al., 2015), the estimated contributions de-
creased because new particles were continuously removed
Atmos. Chem. Phys., 21, 1305–1323, 2021 https://doi.org/10.5194/acp-21-1305-2021Y. Zhu et al.: Increased new particle yields with decreased survival probability to CCN size 1313
either by coagulation or atmospheric deposition during the Hamed et al., 2010; Y. Wang et al., 2011; Wang et al., 2017;
particle growth. During the three summer campaigns in 2009, Saha et al., 2018). However, this was not the case at the sum-
2014, and 2015, larger NPF-derived CCNs were estimated mit of Mt. Tai, where the NPF occurrence frequencies were
with average 1NCCN50 , 1NCCN80 , and 1NCCN100 values of almost invariant in the spring of 2007, summer of 2009, win-
4.4 ± 2.5 × 10³ , 1.9 ± 1.5 × 10³ , and 1.0 ± 0.9 × 103 cm−3 , ter of 2017, and spring of 2018. The observed SO2 mixing ra-
respectively. Overall, the values decreased by approximately tios in this study decreased considerably from 15 ± 13 ppb in
50 % in the spring of 2007 and the fall of 2014. The 2007 to 1.6 ± 1.6 ppb in 2018 (the SO2 during the NPF peri-
NPF-derived CCNs in these five campaigns were larger ods decreased from 17 ± 11 to 2.8 ± 1.8 ppb, Fig. 5a). In ad-
than those reported in previous studies for the same sea- dition, the SO2 emissions in China were reduced by approxi-
son at Mt. Chacaltaya (5240 m, Bolivia) and Botsalano mately two-thirds from 2007 to 2018 (Fig. S1 in the Supple-
(1424 m, South Africa) (Kerminen et al., 2012; Rose et al., ment), where the sharpest reduction occurred in 2015–2016
2017). In comparison, extremely low NPF-derived CCNs owing to stringent mitigation policies.
were observed in 2017 and 2018, i.e., 1NCCN50 of only As the calculated CSs before the NPF events in the 2017
1.1 ± 1.7 × 103 cm−3 , 1NCCN80 of 0.5 ± 0.9 × 103 cm−3 , and 2018 campaigns were higher than those in the 2007 and
and 1NCCN100 of 0.2 ± 0.5 × 103 cm−3 . 2009 campaigns (Fig. 5b), CSs were unlikely to be the cause
High SPs were found during the three summer campaigns for the lack of decreases in the NPF occurrence frequency
in 2009, 2014, and 2015, with average SPCCN50 , SPCCN80 , in 2017 and 2018. It has been reported that a low CS is not
and SPCCN100 values of 61 %, 23 %, and 14 %, respectively necessary to promote NPF occurrence at altitudes higher than
(Fig. 4b). The SPs decreased by approximately 30 % in the 1000 m (Sellegri et al., 2019). Thus, other factors such as me-
spring of 2007 and the fall of 2014. In 2017 and 2018, the teorological conditions and biogenic precursors (e.g., amines
average SPCCN50 , SPCCN80 , and SPCCN100 were only 10 %, and highly oxidized organics) may overwhelm the effects of
4 %, and 1 %, respectively, indicating that only a minor frac- SO2 and CS on the NPF occurrence frequency at Mt. Tai.
tion of new particles could grow to CCN sizes before being Note that the increased CSs in the last decade are also found
scavenged. on the basis of our independent unpublished measurements
Figure 4c shows the percentage increase in the NPF- made at a coastal megacity of northern China, which is out
derived CCN relative to the pre-existing CCN. The per- of the scope of this study.
centages were the highest in the summer of 2014, e.g., We further conducted a few statistical tests to explore the
6.8 × 10² %, 6.0 × 10² %, and 4.8 × 10² % for RCCN50 , association of the apparent FR and NMINP with SO2 . The
RCCN80 , and RCCN100 , respectively. This finding could be at- correlation analysis using the campaign averages showed
tributed to the combination of high 1NCCN and low num- weak negative correlations for the apparent FRs and NMINPs
ber concentrations of pre-existing particles in that cam- with the SO2 mixing ratios (r = 0.4 and 0.3, respectively;
paign (Figs. S8–S9 in the Supplement). In the remaining both p > 0.05). Again, these results implied that other fac-
four campaigns during 2007–2015, the percentages still ex- tors overwhelmed the effect of the SO2 mixing ratios on the
ceeded 100 %, i.e., 2.5 × 10² %–3.8 × 10² % for RCCN50 , apparent FRs and NMINPs. When the observations were an-
1.5 × 10² %–2.9 × 10² % for RCCN80 , and 1.1 × 10² %– alyzed case by case, the correlations of the apparent FRs and
2.8 × 10² % for RCCN100 . These ratios are within the range NMINPs with the SO2 mixing ratios were even weaker, with
reported in the literature (50 %–1.1 × 10³ %), although the r = −0.12 and −0.14, respectively (both p > 0.05). Simi-
calculation methods of the studies were slightly different lar results were found when the estimated H2 SO4 vapor was
(Lee et al., 2019). However, in 2017 and 2018, the percent- used for correlation analysis (r = −0.12 and −0.13, respec-
ages decreased considerably, e.g., < 40 % for RCCN50 and tively; both p > 0.05). The scatter plots are shown in Fig. S10
< 20 % for RCCN80 and RCCN100 . in the Supplement.
Recall that the occurrence frequencies of NPF were also
almost the same in the spring of 2007 and 2018, at high
4 Discussion values of 50 %–51 %, implying that ambient factors in both
campaigns favored NPF. Table 2 provides a comprehensive
4.1 Question 1: what caused the unexpected responses comparison of the measured air pollutants of the two spring
of NPF to decreasing SO2 concentrations? campaigns. The decrease in the SO2 , estimated H2 SO4 , and
NH3 concentration did not explain the increases in the FRs
H2 SO4 oxidized from ambient SO2 is one of the most im- and NMINP in 2018. Although amines were not measured,
portant precursors for atmospheric nucleation. Decreases in they are usually highly correlated with NH3 (Xie et al.,
ambient SO2 mixing ratios, e.g., an annual average concen- 2018). Based on the unique roles of HOMs in enhancing at-
tration decreases from 9 to 1 ppb in Pittsburgh, 5 to 3 ppb mospheric nucleation and promoting the growth of new par-
in Rochester, and 5 to 2 ppb in Melpitz, have been reported ticles (Paasonen et al., 2010; Ehn et al., 2014; Kerminen et
to cause 40 %–60 % reductions in the NPF occurrence fre- al., 2018), it was speculated that HOMs played an impor-
quency and 40 %–70 % reductions in the NPF intensity (e.g., tant role in the unexpected responses of NPF to lower SO2 in
https://doi.org/10.5194/acp-21-1305-2021 Atmos. Chem. Phys., 21, 1305–1323, 20211314 Y. Zhu et al.: Increased new particle yields with decreased survival probability to CCN size Figure 4. Campaign average of the net increase in the NPF-derived CCN number concentration (1NCCN , a), the survival probability of new particles growing to CCN sizes (SPCCN , b), and the relative increase ratio of the CCN population (RCCN , c) during the seven observation campaigns. The error bars are the standard deviations. 2018. Increased HOMs were expected on the NPF event days and m and n are integers; Zhang et al., 2012), the apparent FR on the basis of the rapid afforestation over the last decade in is controlled by the concentrations of both H2 SO4 vapor and China (Chen et al., 2019; Wang et al., 2020) and the increase organic vapor. We then considered two technical terms, i.e., in the forest areas upwind from the sampling site from the the total concentration of H2 SO4 vapor and the consumed west to north. NPF events frequently took place when the air amount of H2 SO4 vapor for NPF. Unlike the apparent FR, the mass came from these directions(Fig. S2 in the Supplement). NMINP was always determined by the consumed amount of However, we had no measurements of HOMs. Nevertheless, H2 SO4 vapor, which may or may not have a positive correla- the correlation between the FR and NMINP at Mt. Tai ap- tion with the total concentration of H2 SO4 vapor. The linear pears to support the hypothesis as presented below. correlation between the FR and NMINP suggests one possi- During the 106 cases of NPF events, the apparent FR bility, i.e., the H2 SO4 vapor was sufficient and the availability and NMINP showed a good linear correlation (r = 0.84, p of organic vapor determined both the FR and the consumed < 0.01) (Fig. 6). The fitted equation was highly consistent amount of H2 SO4 vapor proportional to the NMINP. Previ- with those derived for urban and marine atmospheres (Man et ous field measurements have shown that gaseous H2 SO4 at al., 2015; Zhu et al., 2017, 2019; Ma et al., 2020). The strong concentrations of 105 molecules cm−3 is necessary for NPF linear relationship between the apparent FR and NMINP sug- (McMurry et al., 2005; Nieminen et al., 2009; Erupe et al., gested that H2 SO4 vapor was sufficient for nucleation, and 2010; Lee et al., 2019). In this study, the estimated H2 SO4 the NPF intensity was very likely determined by the abun- concentration was in the range of 106 –107 molecules cm−3 dance of organic vapors available for participating in nu- and was theoretically sufficient for NPF (Table 2). Under cleation. Following the equation in the literature, i.e., FR other conditions, poor correlations are expected between the = kNucOrg [H2 SO4 ]m [NucOrg]n (where kNucOrg is a constant, Atmos. Chem. Phys., 21, 1305–1323, 2021 https://doi.org/10.5194/acp-21-1305-2021
Y. Zhu et al.: Increased new particle yields with decreased survival probability to CCN size                                                   1315

Figure 5. Campaign average of SO2 mixing ratios (average during NPF periods, a), CS (1 h prior to NPF events, b), NO2 + O3 (average
during new particle growth periods, c), and NPF event durations (d) during the seven observation campaigns. The error bars are the standard
deviations.

Table 2. Meteorological conditions and air pollutants during the formation and growth periods of new particles in the spring campaigns in
2007 and 2018.

                   Parameters                                                          2007 spring                  2018 spring
                                                                               Formation         Growth       Formation        Growth
                   T (◦ C)                                                      5.8 ± 3.2      7.1 ± 3.3       3.5 ± 5.8      5.3 ± 5.9
                   RH (%)                                                        54 ± 22         52 ± 18        45 ± 17         46 ± 17
                   SO2 (ppb)                                                  16.7 ± 10.9 20.2 ± 13.0          2.6 ± 1.8      2.5 ± 1.5
                   NH3 (ppb)                                                  12.6 ± 18.0 11.2 ± 17.0          6.5 ± 9.5      6.6 ± 7.2
                   NO2 + O3 (ppb)                                              63.7 ± 8.4     70.1 ± 9.7     61.3 ± 14.0 63.8 ± 14.3
                   PM2.5 (µg m−3 )                                            56.5 ± 33.0 71.1 ± 49.0        30.3 ± 21.8 29.2 ± 20.4
                   SO2−
                      4 (µg m )
                                −3                                            16.4 ± 11.0     18.5 ± 9.7       3.3 ± 2.4      3.6 ± 2.7
                      −        −3
                   NO3 (µg m )                                                  7.4 ± 5.7      7.4 ± 4.8       6.3 ± 5.1      6.7 ± 5.5
                   NH+4 (µg m )
                               −3                                               5.5 ± 4.2      6.1 ± 3.5       2.3 ± 1.7      2.2 ± 1.6
                   Calculated H2 SO4 (107 molecules cm−3 )                      8.8 ± 4.9      9.4 ± 4.5       2.2 ± 1.1      2.4 ± 1.0
                   [H2 SO4 ]avg /C (%)                                            59 ± 23        36 ± 18        23 ± 10          11 ± 7
                   VOCs (ppb)                                                         7.0 ± 5.7a                     16.1 ± 6.5
                   OC (µg m−3 )                                                       6.1 ± 3.0b                     5.5 ± 2.0c
                   EC (µg m−3 )                                                       1.8 ± 1.6b                     1.3 ± 0.6c
                 a Mao et al. (2009). b Z. Wang et al. (2011). c Dong et al. (2020).

FR and NMINP, e.g., with FR > 8 cm−3 s−1 reported in pre-                               et al., 2014; Ma et al., 2019). During our observations, the
vious studies (open markers in Fig. 6).                                                 total VOCs (including C2 –C10 ) mixing ratios approached
   Previous studies have reported that the BVOC emissions                               16.1 ± 6.5 ppb in the 2018 spring campaign, which was al-
over the NCP have increased in the last decade because of                               most double that (including C4 –C12 ) in the June 2006 cam-
the afforestation and accelerating global warming (Stavrakou                            paign (Mao et al., 2009; no data from the spring 2007 cam-

https://doi.org/10.5194/acp-21-1305-2021                                                                   Atmos. Chem. Phys., 21, 1305–1323, 2021
1316 Y. Zhu et al.: Increased new particle yields with decreased survival probability to CCN size
certain long period, both of which are influenced by the con-
centration of oxidants (Zhang et al., 2012, Apsokardu and
Johnston, 2018). In this study, a moderate correlation was
observed between Dpgmax and GR (r = 0.58, p < 0.01). The
low r value suggested that the GR alone does not determine
the Dpgmax . When one outlier was removed, r increased to
0.66 (Fig. 7a). In addition, the GR had a positive correlation
with the total oxidant concentration (Ox = NO2 + O3 ) but
with an r as low as 0.38 (p < 0.01) (Fig. S11 in the Sup-
plement). Additionally, the Dpgmax and the duration of NPF
events also showed good correlation (r = 0.67, p < 0.01)
(Fig. 7e). Our results imply that both the real-time concentra-
tions and the continuous supply of condensation vapor play
dominant roles in the growth of new particles to the CCN
size.
Figure 6. Relationship between the FR and NMINP in 106 cases In further analysis, we considered three situations of the
of NPF events at Mt. Tai in this study and in urban and marine
new particle growth. Type A (full marker in Fig. 7) represents
atmospheres in previous studies (Man et al., 2015; Zhu et al., 2017,
that new particles continuously grow to the size of Dpgmax
2019; Ma et al., 2020). The half-solid markers can be fitted linearly
in previous studies. The open markers show poor correlations. until the new particle signal drops to a negligible level. Type
B (empty marker) represents the NPF events in which the
growth of new particles is similar to that in Type A before
paign were available). The difference was reasonably con- Dpgmax is reached. After Dpgmax is reached, the grown new
sistent with the large increase in forest area over the last particles in Type B can still be observed for one more hour,
decade across the whole of China, especially that high BVOC after which either the growth stops for over 1 h or the par-
emissions are expected in summer. Note that a discrep- ticles start shrinking to a smaller size until the new particle
ancy may also exist between chemical analysis results of signal disappears. Type C (half-full marker) represents the
VOCs in different labs. However, a large knowledge gap be- NPF events that are not subject to Type A or B. Multistage
tween the increase in BVOC emissions and the increase in growth of new particles can be observed for Type C particles.
nucleating organics still exists because of a lack of stud- A few examples of the three types are shown in Fig. S12 in
ies. Thus, the unexpected response of NPF events to re- the Supplement. We also separated the observations in 2017
duced SO2 is still unexplained, and more measurements of and 2018 (in red) from those in 2007–2015 (in blue).
H2 SO4 and organics (e.g., HOMs) are needed. Note that For Type A, the average GR and Dpgmax in 2017–2018
the campaign average PM2.5 mass concentration in 2018 were only 1.5 nm h−1 and 23 nm, respectively, significantly
indeed decreased. The decrease was apparently determined lower than the 3.5 nm h−1 and 48 nm values observed in
by the decrease in > 153 nm particles since no significant 2007–2015 (p < 0.01). When the regression equation of the
difference existed in the calculated CS based on < 153 nm GR and Dpgmax is examined, i.e., Dpgmax = 11.0 × GR+8.2
particles between 2007 (0.32 ± 0.19 × 10⁻² s−1 ) and 2018 with a moderately good r, newly formed particles appear to
(0.40 ± 0.15 × 10⁻² s−1 ). grow beyond 50 nm only when the GR exceeds 3.8 nm h−1
in Type A. There was no significant difference between the
4.2 Question 2: did the contribution of NPF events to duration of NPF events in 2017–2018 and that in 2007–2015.
the CCN population decrease considerably with However, based on the regression equations between the du-
decreasing SO2 ? ration and Dpgmax obtained in 2007–2015 and 2017–2018,
newly formed particles could grow beyond 50 nm only when
Based on the observations alone, the Dpgmax and the contri- the NPF duration exceeded 9.9 h in 2007–2015, but the du-
bution of NPF to the CCN population decreased considerably ration in 2017–2018 had to exceed 27.8 h. As reported in
with decreasing SO2 . However, the growth behaviors of new the literature, the lifetime of 50 nm particles in the boundary
particles after the new particle signals disappeared from the layer is approximately 1 d, while that in the free troposphere
observations were unknown. Thus, we further analyzed the is much longer (Williams et al., 2002). It can be argued that
Dpgmax in terms of the correlations with the calculated parti- the new particles in Type A of 2007–2015 may still have been
cle GR, the observation duration of the NPF events on site, able to grow to the CCN size even after the new particle sig-
and the underlying atmospheric processes. nal disappeared from the observation. However, the lifetime
Theoretically, the Dpgmax should be a function of the GR of 20 nm particles in the boundary layer is only several hours
and the NPF duration. The GR is determined by real-time (Williams et al., 2002). If the Type A NPF events in 2017–
concentrations of condensation vapors, whereas the Dpgmax 2018 occurred in the boundary layer, the new particles may
is determined by the availability of condensation vapor over a not have been able to grow to the CCN size before being
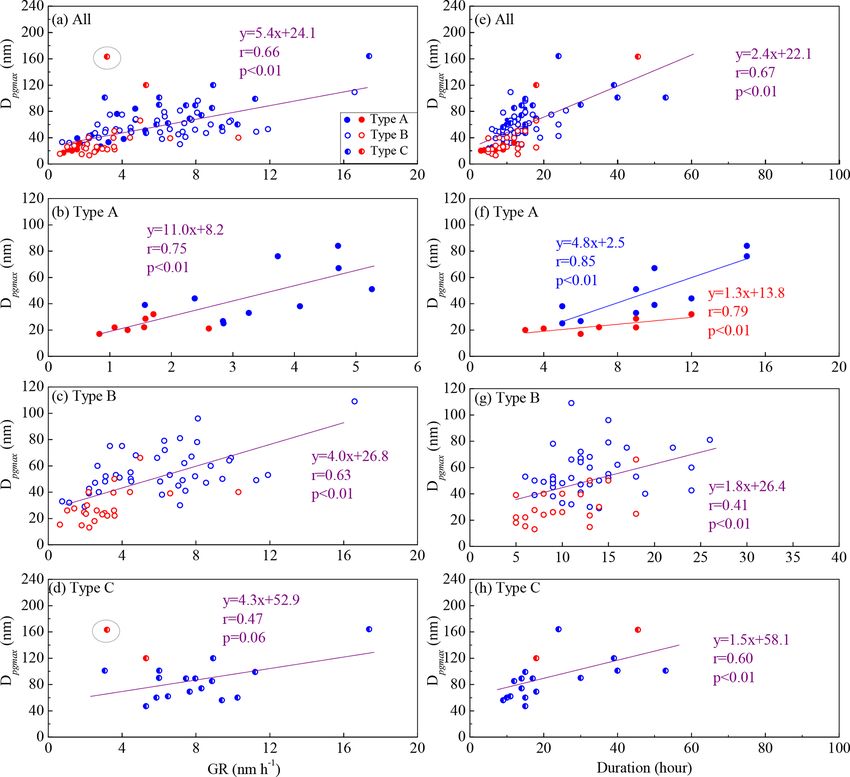
Atmos. Chem. Phys., 21, 1305–1323, 2021 https://doi.org/10.5194/acp-21-1305-2021Y. Zhu et al.: Increased new particle yields with decreased survival probability to CCN size 1317 Figure 7. Relationship between the GR and Dpgmax (a–d) and between the duration of NPF events and Dpgmax (e–h). Solid markers represent Type A, empty markers represent Type B, and half-solid markers represent Type C. Red markers and equations represent 2017 and 2018, and blue markers and equations represent 2007–2015. The purple equation represents fitting of all data, and the circled marker represents an outlier from the equation fit. scavenged from the ambient air. If they occurred in the free In the case of Type B, the GR and Dpgmax in 2017– troposphere, the longer lifetime may have allowed the new 2018 (the mean values of 3.2 nm h−1 and 29 nm, respec- particles in some events to be able to grow to the CCN size. tively) were significantly lower than those in 2007–2015 For example, the NPF event on 21 March 2018 ended with (6.1 nm h−1 and 56 nm, respectively; p < 0.01). Following an increase in the wind speed and a change in the wind direc- the regression equation of Dpgmax against GR, newly formed tion, and the number concentration of new particles remained particles in Type B could grow beyond 50 nm only when the at a high level. The air mass back trajectories passed through GR exceeded 5.8 nm h−1 . The number concentrations or the the NCP at a high altitude (> 1700 m a.g.l) at the beginning sizes of new particles decreased considerably at the end of and end of the NPF event (Fig. S12a, b in the Supplement). Type B NPF events, and the transient time for the decrease In addition, the spikes of PNSDs during this NPF event in- suggested that the events occurred in the boundary layer. For dicated the vertical transport of atmospheric particles (Meng example, the air mass back trajectories at the end of the NPF et al., 2015; Shen et al., 2020). We inferred that this NPF on 7 April 2018 originated from low altitude and the height event seemingly occurred in the free troposphere, and a large varied greatly over time (Fig. S12c, d in the Supplement). decrease in the entrainment from the free troposphere to the Most of the Type B NPF events in 2017–2018 may have boundary layer may have led to the disappearance of the new had less opportunity to contribute to the CCN population if particle signal. Recent aircraft and airship measurements in they indeed occurred in the boundary layer. However, aircraft northern and eastern China suggested that NPF events some- measurements are needed to confirm the altitude at which the times occurred in the free troposphere and then mixed down NPF events occur. In addition, the changed boundary layer to the boundary layer (Quan et al., 2017; Qi et al., 2019). height had no detectable influence on Dpgmax , as shown in https://doi.org/10.5194/acp-21-1305-2021 Atmos. Chem. Phys., 21, 1305–1323, 2021
1318                          Y. Zhu et al.: Increased new particle yields with decreased survival probability to CCN size

Fig. S12 in the Supplement. However, the change in the late        vations were conducted only at one site, alternating between
afternoon may largely decrease the observed number concen-         the boundary layer and the free troposphere, and the gener-
trations of grown new particles.                                   ality of the conclusions on NPF events needs to be examined
   Type C was characterized by the largest GR, dura-               at more sites.
tion, and Dpgmax , with mean values of 7.7 nm h−1 , 22 h,
and 92 nm, respectively. These particles underwent multi-
ple growth processes, complicating the correlation between         5   Conclusions
GR and Dpgmax , and that between duration and Dpgmax .
The air mass back trajectories at the end of the NPF event         With an order of magnitude reduction in SO2 emissions, the
on 30 September 2014 were local and originated at a low            NPF frequency observed at the summit of Mt. Tai remained
altitude (Fig. S12e, f in the Supplement), implying that           relatively constant during the seven campaigns from 2007–
these new particles experienced sufficient growth within the       2018. The calculated campaign-based FR and NMINP were
boundary layer. There were 16 Type C NPF events during             0.8–1.2 cm−3 s−1 and 3.8–5.1 × 103 cm−3 in 2007–2014 and
2007–2015 and only two in 2017. The lack of Type C NPF             then unexpectedly increased by a factor of 2–3 in 2017–2018
events in 2017–2018 implies a significant decrease in the          to 2.0–3.0 cm−3 s−1 and 0.9–1.1 × 104 cm−3 , respectively.
contribution of new particles to the CCN population.               However, the large increase in the NPF intensity was accom-
   The factors influencing the lower Dpgmax and NPF-derived        panied by a smaller probability of the particles growing to the
CCN population in 2017–2018 were further explored. In the          CCN size. The number concentrations of NPF-derived CCN
literature, the growth of newly formed particles is mainly at-     with the three threshold sizes of 50, 80, and 100 nm were esti-
tributed to sulfuric acid, ammonium nitrate, and secondary         mated to be 3.7 × 10³ , 1.6 × 10³ , and 8.6 × 102 cm−3 in the
organic compounds (Wiedensohler et al., 2009; Riipinen et          2007–2015 campaigns, which then decreased to 1.0 × 10³ ,
al., 2011; Zhang et al., 2012; Ehn et al., 2014; Man et al.,       4.6 × 10² , and 1.8 × 102 cm−3 , respectively, in the 2017–
2015; Wang et al., 2015; Burkart et al., 2017; Lee et al., 2019;   2018 campaigns. When the three types of NPF events are
Wang et al., 2020). As listed in Table 2, the contribution of      separately considered, it remains uncertain whether the new
H2 SO4 vapor to particle growth decreased from 36 % in the         particles in Type A can grow to the CCN size after the dis-
spring of 2007 to 11 % in the spring of 2018, indicating an in-    appearance of the new particle signals from observations. No
evitable consequence of decreasing SO2 emission on particle        conclusion can be drawn on this issue based on the current
growth. However, this percentage is likely not high enough         limited chemical observations. However, the new particles in
to explain the 50 % decrease in the GR and Dpgmax of Types         Type B may have less opportunity to grow to the CCN size
A and B. On the other hand, the reduction in SO2 and sulfate       before they are scavenged from the ambient air. The lack of
may reduce the aerosol acidity, subsequently affecting the         Type C NPF events in the campaigns from 2017–2018 in-
acid-enhanced uptake of semivolatile organic species (Ding         dicates a large decrease in the probability of new particles
et al., 2011; Stangl et al., 2019). This hypothesis is supported   growing to the CCN size with the reduction in ambient air
by the lower level of organic carbon (OC) in PM2.5 found in        pollutants. Moreover, the shorter durations of the NPF events
the spring of 2018 (5.5 ± 2.0 µg m−3 ) than that in the spring     in the campaigns from 2017–2018 imply that the events oc-
of 2007 (6.1 ± 3.0 µg m−3 ), although the BVOC emissions           curred over a smaller spatial scale.
over the NCP have reportedly increased in recent years (Ta-           We hypothesize that the NPF intensity increased unex-
ble 2, Z. Wang et al., 2011; Stavrakou et al., 2014; Ma et al.,    pectedly with the reduction in SO2 concentration, as the
2019; Dong et al., 2020). Furthermore, the mass concentra-         net production of NPF seems to be determined mainly by
tion of nitrate in PM2.5 was 7.4 ± 4.8 µg m−3 in 2007 dur-         the availability of organic precursors for participating in nu-
ing the new particle growth period, and it slightly decreased      cleation and initial growth. This is reasonably consistent
to 6.7 ± 5.5 µg m−3 in 2018. The reduced nitrate may also          with the increase in forest areas over the last decade across
be partially responsible for the lack of Type C in 2018. In        China through rapid afforestation. The strong correlation be-
summary, we argued that the reduced H2 SO4 vapor, nitrate,         tween the FR and NMINP strongly supports this hypothesis,
and OC formation (most likely because of reduced anthro-           which needs to be further confirmed by direct observations of
pogenic emissions) may have led to the SP of new particles         molecular organic vapors. The decrease in the percentage of
in the spring campaign of 2018 being lower than that of 2007.      new particles growing to the CCN size with increasing NPF
Unfortunately, chemical data about size-segregated molecu-         intensity in 2017–2018 implies the complexity of the growth
lar constituents are not available to confirm this finding, and    of new particles with reduced emissions of anthropogenic
therefore, more refined observations are urgently needed in        precursors under a large-scale increase in BVOC emissions.
the future.                                                        Overall, this study provides unique observational results re-
   However, uncertainties still exist, e.g., (1) the data were     garding NPF at a regional mountaintop site in the NCP from
obtained in seven independent campaigns, each lasting 18–          reasonably large datasets. Based on the unique results, we
71 d, and the data size did not allow us to extend the conclu-     comprehensively analyzed the possible causes and proposed
sion to all the years from 2007 to 2018; and (2) the obser-        new challenges in determining the underlying mechanisms of

Atmos. Chem. Phys., 21, 1305–1323, 2021                                              https://doi.org/10.5194/acp-21-1305-2021
You can also read