Water and Carbon Footprints of Turkish Energy Development Plans until 2030
←
→
Page content transcription
If your browser does not render page correctly, please read the page content below
Water and Carbon Footprints of Turkish
 Energy Development Plans until 2030

                 A thesis submitted to the
      Graduate School of Natural and Applied Sciences

                             by
         Mohammad Abdullah Shaikh

                in partial fulfillment for the
                degree of Master of Science

                             in
            Industrial and Systems Engineering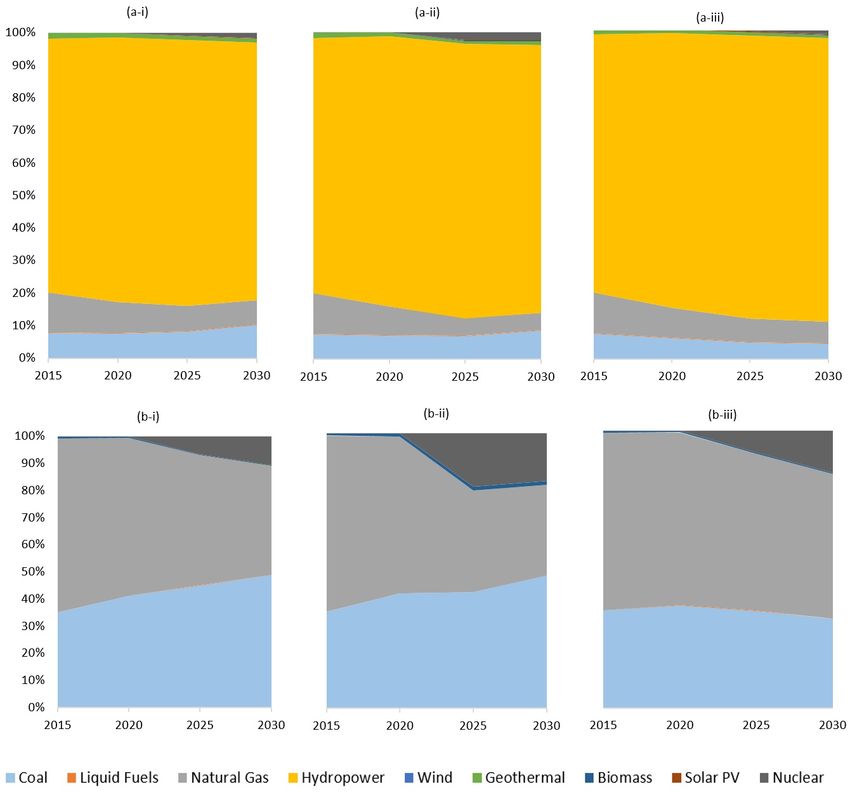
i
ii
“If you can’t measure it, you can’t improve it.”

                                                   -Peter Drucker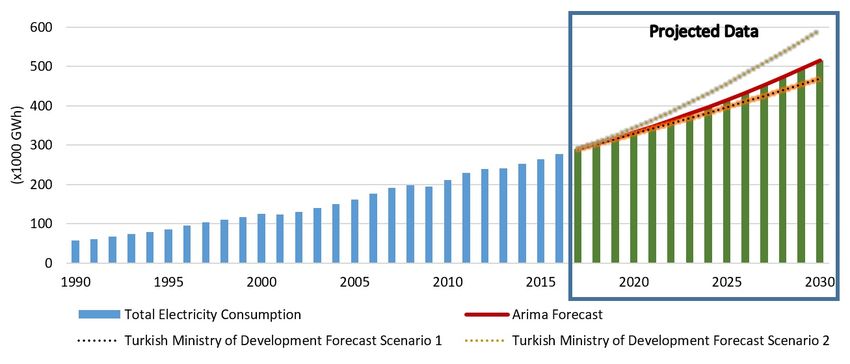
Water and Carbon Footprints of Turkish Energy Development Plans
                                      until 2030

                             Mohammad Abdullah Shaikh

                                    Abstract

Effects of renewable and non-renewable energy on Water resources are mostly overlooked
even though substantial consideration about the impacts of energy sources are given on
carbon footprint reduction and energy security aspects. In this thesis, a framework for
water and carbon footprint analysis is developed as an attempt to estimate the current
and future trends of water consumption and withdrawal along with carbon emissions
by electricity production scenarios, considering the national energy development plans.
Furthermore, this research work also produced a decision support tool to determine wa-
ter consumption, water withdrawal and carbon emissions based on the three different
scenarios, keeping in view the overall energy mix under each scenario. Scenarios devel-
oped are Business-As-Usual (BAU), Official Governmental Plan (OGP), and Renewable
Energy-Focused Development Plan (REFDP) and Turkish electric power industry is se-
lected as a case study in this thesis. Results show that large amount of water is used by
sources of electricity such as hydro-electricity and biomass, which are considered more
environmental friendly as well as renewable forms of energy. By year 2030, average water
consumption under OGP scenario is likely to be around 8.1% and 9.6% less than that of
BAU and REFDP scenario. Meanwhile, average water withdrawal by the energy mix in
year 2030 of REFDP is estimated to be around 46.3% and 16.9% less than that of BAU
and OGP scenario. Likewise, carbon emissions by year 2030 based on the BAU scenario
are anticipated to be 24% higher than OGP and 39% higher than REFDP scenario.
Through a correlation analysis, we found out that carbon emissions and water usage
are strongly correlated in BAU in comparison with OGP and REFDP, therefore we can
conclude that carbon friendly energy sources will result in less water consumptions and
withdrawals â especially under REFDP scenario.

Keywords: Decision support tool; Electricity production; Energy policy; Scenario anal-
ysis; Water and carbon footprint;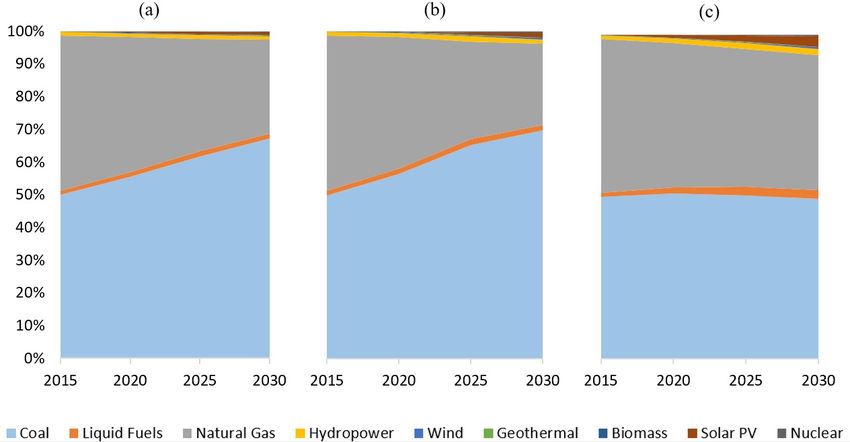
2030 Yılına Kadar Olan Türkiye Enerji Kalkınma Planında Su ve
                                    Karbon Ayak-izi

                              Mohammad Abdullah Shaikh

                                            Öz

Enerji politikalarında yer alan yenilenebilir ve yenilenebilir olmayan kaynakların enerji
güvenliği ve karbon salınımının azaltılması yönleri ön planda tutulurken, su kaynaklarına
olan etkisine yeterli önem atfedilememektedir. Bu tezin amacı, su ve karbon ayak izi
analizlerinin yapılacağı bir sistemin geliştirilmesi ile ulusal enerji kalkınma planlarında yer
alan su tüketimi ve enerji üretimi sektörlerinin gelecek durumlarını tahmin edebilmektir.
Bu motivasyonla, Türkiye elektrik endüstrisi vaka çalışması olarak seçilmiçstir ve su
tüketimini belirlemek için bir karar destek aracı geliştirilmiştir. Bu karar destek aracı
Geleneksel İşletme(Gİ), Resmi İdari Plan (RİP) ve Yenilenebilir Enerji Odaklı Kalkınma
Planı (YEOKP) isimli 3 senaryoyu içermektedir. Elde edilen sonuçlara göre yenilenebilir
enerji kaynaklarının en fazla tükettiği kaynak su olarak belirlemmiştir. RİP’e göre 2030
yılı için tahmin edilen enerji senaryosunda ortalama su tüketimi YEOKP’dan 8,1% ve
Gİâden 9,6% kadar daha düşüktür. Diğer taraftan, sonuçlar YEOKP senaryosundan
kaynaklanan su çekilmelerinin diğer senaryolar olan Gİ’den 46,3% ve RİP’den 16,9% az
olacağını göstermektedir. Gİ’den kaynaklanan karbon salınımları RİP’ten 24% oranında
ve YEOKP’den 39% oranında daha yüksek öngörülmüştür. Diğer senaryolara kıyasla Gİ
senaryosunda karbon salınımları ve su tüketimleri güçlü biçimde doğru orantılıdır ve bu
sebeple karbon dostu enerji kaynakları daha az su tüketilmesine ve suyun yeryüzünden
daha az çekilmesine vesile olacaktır.

Anahtar Sözcükler: Su ve karbon ayak izi, Elektrik üretimi, Senaryo analizi, Enerji
politikası, Karar destek aracı.
Dedicated to my parents and siblings.

                 vi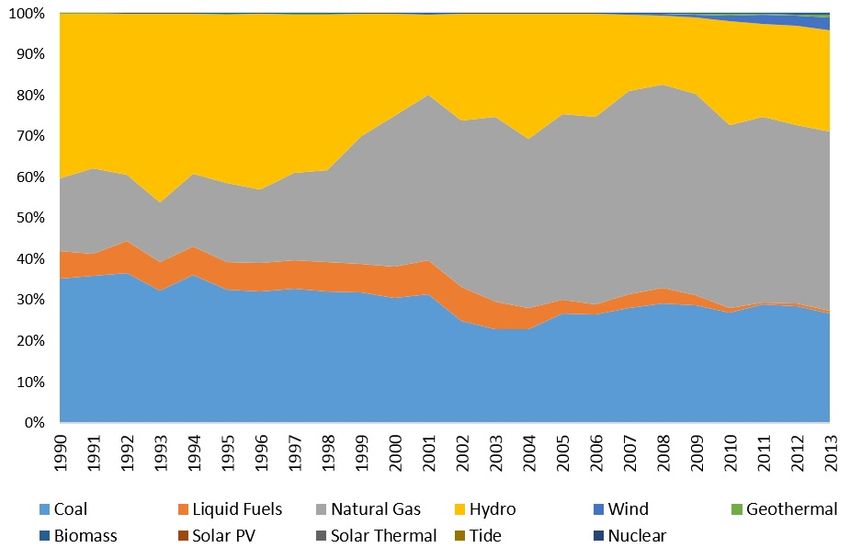
Acknowledgments
I am grateful to Almighty Allah for all His blessings and easing my way through the
successful completion of this research work. He showed me ways out of difficult times
and provided me with courage and ability to dealt difficult times during the course.

My heartiest gratitude to my thesis advisor, Professor Dr. Bahadir Tunaboylu, for his
moral and technical support. He backed me up in hard times and is always a moral
boosting personality. Thank you very much Professor.

I would also like to thank Dr. Hatice Tekiner Mogulkoc for being my academic advisor
during the course of my studies. I also had this opportunity to assist her for several
courses. I have enjoyed working with her and have learned tremendously. Her mentor-
ship has always been helpful and I am honoured to have her as one of my teachers.

Special thanks to my external supervisor, Professor Gokhan Kirkil for collaborating with
us throughout this research. His valuable suggestions and feedbacks were indeed very
helpful.

Thanks to Dr. Murat Kucukvar and Dr. Nuri Onat as well, for motivating me in this
field of study. I am thankful to them for their wholehearted support and incredible
guidance at every step of my research work and their honest critical analysis of my work.
Their efforts are enormous behind all my research and this work would not even have
existed without them.

I would like to acknowledge my friends, who have always stood by my side, particularly in
difficult and stressful times. I specially want to thank Taha and Ali for always being my
first support in Istanbul, Istanbul Sehir University and during the whole course of this
research and my studies. Sajid, Rashad, Ndricim and Yassir: thanks for being amazing
office mates. I am in debt because of your unconditional support and your sincere advises
whenever I required. Nabeel, Toqeer, Arsalan, Sikandar, Rafay; thank you very much
for being such great friends and for easing my way through my research. Presence of my
friends around me was a great assistance.

Most importantly, I want to acknowledge my parents. I cannot thank them enough. Their
encouragement and support have always kept me motivated to pursue my ambitions. I
am extremely blessed to be parented by the best pair in this world. All I am today is
because of them. My brother, Anas, deserves special thanks for covering for me in my
absence back home despite his studies and other endeavors - Thank you very much to
all of you.

                                            vii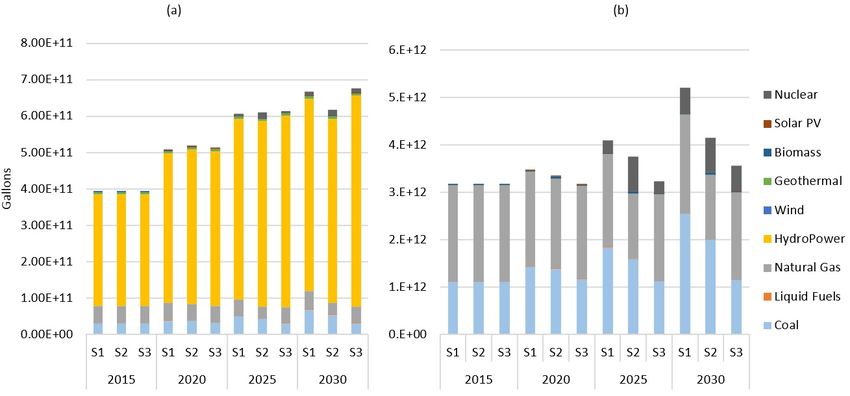
Contents

Abstract                                                                                         iv

Öz                                                                                                v

Acknowledgments                                                                                  vii

List of Figures                                                                                  ix

List of Tables                                                                                    x

Abbreviations                                                                                    xi

1 Introduction                                                                                    1
  1.1 Introduction . . . . . . . . . . . . . . . . . . . . . . . . . . . . . . . . . . .          1

2 Methodology                                                                                     5
  2.1 Method . . . . . . . . . . . . . . . . . . . . . . . . . . . . . . . . . .     .   .   .    5
  2.2 Data Collection . . . . . . . . . . . . . . . . . . . . . . . . . . . . . .    .   .   .    7
      2.2.1 Energy Consumption . . . . . . . . . . . . . . . . . . . . . . .         .   .   .    7
      2.2.2 Water Consumption, Withdrawal and GHG Emission Factors                   .   .   .    9
  2.3 Energy-based Analysis . . . . . . . . . . . . . . . . . . . . . . . . . .      .   .   .   16
  2.4 Scenario Analysis and Scenario Building . . . . . . . . . . . . . . . .        .   .   .   17
      2.4.1 Scenario 1 (BAU) . . . . . . . . . . . . . . . . . . . . . . . . .       .   .   .   20
      2.4.2 Scenario 2 (Official Governmental Plan) . . . . . . . . . . . .          .   .   .   21
      2.4.3 Scenario 3 (Renewable Energy Focused Development Plan) .                 .   .   .   24

3 Results Discussion                                                                             26
  3.1 Results Discussion . . . . . . . . . . . . . . . . . . . . . . . . . . .   .   .   .   .   26
  3.2 Comparison of water footprint scenario results . . . . . . . . . . . .     .   .   .   .   27
  3.3 Comparison of carbon emission scenario results . . . . . . . . . . .       .   .   .   .   30
  3.4 Water versus Carbon Footprints of Electricity Production Scenarios         .   .   .   .   32

4 Conclusions and Future Work                                                                    34

A Supporting Information File                                                                    36

Bibliography                                                                                     42

                                            viii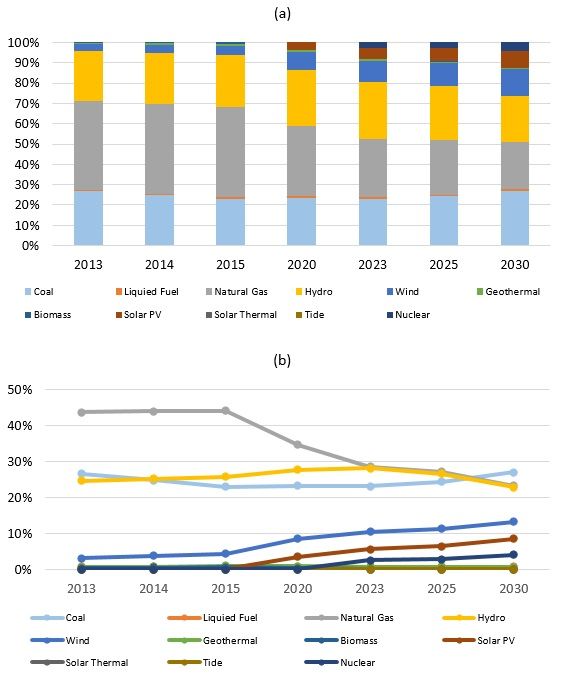
List of Figures

 2.1   Methodology . . . . . . . . . . . . . . . . . . . . . . . . . . . . . . . . .       . 6
 2.2   Electricity consumption trend with respect to previous year. . . . . . .            . 8
 2.3   The average GHG emissions by energy sources. . . . . . . . . . . . . . .            . 14
 2.4   Turkey Electricity generation mix (1990 - 2013). . . . . . . . . . . . . . .        . 17
 2.5   Scenario 1 (Business-As-Usual) Energy Mix Percentages (2013 - 2030)
       (a) cumulative stacked representation; (b) trend of percentage fluctuation
       Energy Mix percentages (2013 - 2030). . . . . . . . . . . . . . . . . . . .         . 22
 2.6   Scenario 2 (Official Government Plan) Energy Mix Percentages (2013 -
       2030) (a) cumulative stacked representation; (b) trend of percentage fluc-
       tuation Energy Mix percentages (2013 - 2030). . . . . . . . . . . . . . .           . 23
 2.7   Scenario 3 (Renewable Energy Focused Development Plan) Energy Mix
       Percentages (2013 - 2030) (a) cumulative stacked representation; (b) trend
       of percentage fluctuation Energy Mix percentages (2013 - 2030). . . . . .           . 25

 3.1   Water Usage Trend. . . . . . . . . . . . . . . . . . . . . . . . . . . . . .        .   27
 3.2   Water usage variation. . . . . . . . . . . . . . . . . . . . . . . . . . . . .      .   29
 3.3   Water Usage comparisons. . . . . . . . . . . . . . . . . . . . . . . . . . .        .   29
 3.4   Water Usage Percentage comparison. . . . . . . . . . . . . . . . . . . . .          .   30
 3.5   Carbon and equivalent gas emissions. . . . . . . . . . . . . . . . . . . . .        .   31
 3.6   Carbon Emission percentage comparison. . . . . . . . . . . . . . . . . . .          .   32
 3.7   Correlation analysis of GHG Emissions Vs Water Consumption and With-
       drawal. . . . . . . . . . . . . . . . . . . . . . . . . . . . . . . . . . . . . .   . 33

 A.1 Turkey sector wise electricity mix ("Electricity and Heat Statistics") . .            . 37
 A.2 Turkey Energy Consumption (1990 - 2013) ("Electricity and Heat Statis-
     tics") . . . . . . . . . . . . . . . . . . . . . . . . . . . . . . . . . . . . . .    .   38
 A.3 Turkey’s energy consumption over time. . . . . . . . . . . . . . . . . . .            .   39
 A.4 Water Consumption Factors (Gal/MWh). . . . . . . . . . . . . . . . . .                .   40
 A.5 Water Withdrawal Factors (Gal/MWh). . . . . . . . . . . . . . . . . . .               .   41

                                            ix
List of Tables
2.1 Sector wise Water Consumption Factors (Gallons/MWh). . . . . . . . . . 10
2.2 Sector wise Water Withdrawal Factors (Gallons/MWh). . . . . . . . . . . 11
3.1 Water consumption and withdrawal comparison. . . . . . . . . . . . . . . 28
xAbbreviations
BAU Busniess As Usual
OGP Official Governmental Plan
REFDP Renewable Energy Focused Development Plan
UNDP United Nations Development Program
GHG Green House Gas
CO2 Carbon Dioxide
IEA International Energy Agency
ARIMA Auto Regressive Integrated Moving Average
kWh kilo Watt hour
PV Photo Volatic
NREL National Renewable Energy Agency
EGS Enhanced Geohtermal Systems
xiChapter 1
Introduction
1.1 Introduction
According to the United Nations Development Program (UNDP) Human Development
Report [1] , every continent is expected to be hit by water scarcity. Around one-fifth of
the world’s population is directly affected by water shortage and 500 million people are
at risk of it [2]. Electric power generation can cause substantial greenhouse gas (GHG)
emissions as well as water consumption and withdrawals. Although GHG emissions due
to electric power generation is extensively studied, its impacts on water resources have
been overlooked. Majority of the power plants use fresh water, which is already a scare
resource [3]. The energy sector is vulnerable to water resource availability as substantial
water is required by both fossil and renewable energy sources [4]. This water requirement
is in the form of water consumption and water withdrawal and must be considered when
studying the environmental impacts of energy generation and in finding a pathway for
controlling, and minimizing the environmental damages of development [5]. Measures to
optimize the usage of global water resources are also in order when framing new policies
and setting goals [6].
Water shortage and Greenhouse Gas (GHG) emissions are global concerns and serious
threats to human security [7, 8]. More than 50% of the world’s population is expected
to live in water scarce areas in the next 50 years [9]. Due to an increase in energy
demand/supply as well as a rise in the adoption of water-intensive energy sources such
as bio-fuels, a rise of 85%, from the current water usage, is expected in water usage
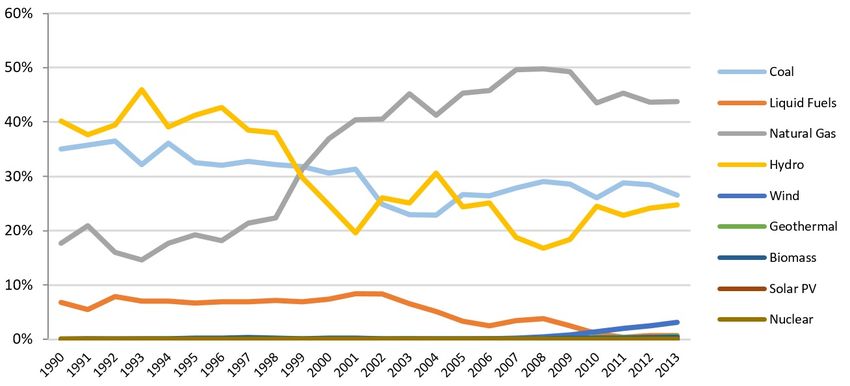
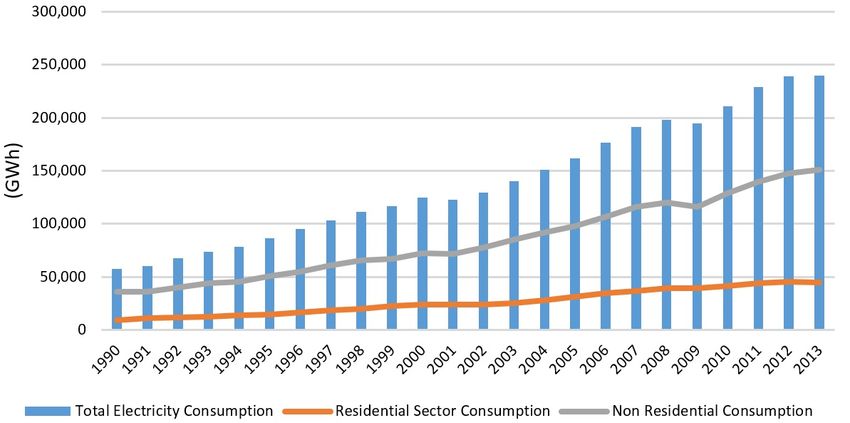
1Chapter 1. Introduction 2 for energy production until 2025 [10]. On the other hand, water is expected to become scarcer in the future because of the increase in the demand for food, energy and water associated with the projected population increase. By 2050, overall increase in water use is expected to be between 62% to 76% [11]. Furthermore, Carbon Dioxide (CO2 ) is the basic constituent of GHGs, accountable for more than 60% of greenhouse effect and resulting in unusual changes in global temperatures [12–15]. GHGs are the biggest contributor in global warming [16]. Power plants alone contribute to over 40% global anthropogenic CO2 emissions [17]. Global mean temperature is on the rise with respect to pre-industrialization and if measured to curb the emission of GHGs are not taken, the average mean temperature of Earth is expected to go up to 5◦ C by the end of this century [18]. Based on our current practices of carbon emissions, average global temperatures are expected to increase to up to 1.3◦ C as compared to the temperatures before industrial revolution [19]. The adverse effects of extensive emissions of GHGs are already evident in terms of rising sea levels, unusual variations in temperatures and rain cycles [20]. Unless concrete steps are taken at regional and global levels to cope with water scarcity and environmental degradation, human development cannot continue at the expected rate [21, 22]. Turkey, which is situated at a strategic location of Asia and Europe, is going through a dynamic transformation resulting in excessive consumption of its water resources. Total energy consumption increased by 117% from 1990 to 2000 and by 92.2% from 2000 to 2013 in conjunction with the rapid growth of the industrial, transportation and service sectors in Turkey [23]. Following the restructuring of country’s electricity sector that initiated in 1980s, both consumption and generation of electricity have experienced a dramatic change [24]. The changes in the electricity mix of Turkey between 1990 and 2013 are presented in Figure A.1 (in Appendix). Fossil sources such as coal and natural gas have the largest share of Turkish electricity supply mix. Natural gas accounts for more than half of all fossil fuel-fired generation. Hydropower production is dominant re- newable energy source. Biomass, geothermal and solar PV were adopted by the Turkey’s electricity sector in 2007 and have grown at a steady pace ever since. The Turkish gov- ernment plans to increase the share of nuclear power, wind and solar energy in its energy supply portfolio in the future [25]. Turkey’s electricity consumption was doubled between 2001 and 2014. Figure A.2 (in supporting information file) shows the annual trend of total energy consumption by the
Chapter 1. Introduction                                                                 3

residential (households) and non-residential (industrial, commercial, service, transporta-
tion, agriculture, fishing, etc.) sectors. Turkey is perceived to be rich in fresh water
resources when compared to the other countries in the region. The country is situated
in a semi-arid region and has only one-fifth of the water available per capita of water
rich regions like North America and Western Europe. Turkey has annual 1,500 cubic
meters water per capita which is well below 10,000 cubic meters water per capita consid-
ered for water rich countries [26]. The per capita energy consumption in Turkey is just
16% of that of the European Union’s average. Nevertheless, Turkey’s energy consump-
tion is increasing steeply because of the fast-paced industrialization and urbanization.
Turkey is not an oil-rich or a massive natural gas producer, like some of its neighbors.
Thus, it has tried to meet its major energy needs through the locally available coal
resources and hydropower as well as imported natural gas. The government plans to
meet its rising energy demand through sources that will require water for electricity pro-
duction [26, 27]. Although, several sustainability assessments have focused on Turkey’s
electrical sector [28–31], a comprehensive study has yet to be performed on the water
impacts of Turkey’s electricity generation. Thus, this study is an initial effort to help
optimize the use of water resources in Turkey’s power generation sectors and to providing
the Turkish policy makers with information on the water use of alternative energy mixes
to meet the future energy demand.

Water and energy generation are strongly related with each other [32]. Therefore, to
effectively control and curtail the water usage in electricity production, it is necessary
to reliably account for water usage in the energy generation process [33]. Madani and
Khatami [34] reviewed various indices that have been used in the literature to evaluate
the impact of energy production on water resources. According to their review, water
consumption refers to the amount of fresh water actually consumed in the process of
producing electricity. This water gets out of the system and becomes unavailable for
the other uses. Water consumption can occur in the form of evaporation of water from
the reserviors, mixing the water with effluents, spilling it in sea, or through any other
process which makes the water unusable at the end of the process [34]. Water withdrawal,
however, is the amount of water withdrawn from water sources (e.g. reservoirs and
rivers), which is mostly used for cooling purposes and is returned to the system at the
end of the energy production process [35].

Power plants, particularly fossil fueled plants, contribute substantially to the carbon
Chapter 1. Introduction                                                                 4

emissions. In China alone, 48% of the total carbon emissions stemmed from electricity
generation through fossil fuel as of 2010 [36]. Coal fired power plants emit the maximum
GHG emissions followed by liquid fuel oil and natural gas power plants, , respectively.
Importantly, renewable energy sources like hydroelectric, biomass, solar and geothermal
also leave carbon footprint as they are utilized for energy generation - hence, they are
not completely green energy sources.

This thesis aims to present a framework assessing water and carbon footprints for na-
tional energy development plans, by presenting a spreadsheet model analyzing the water
consumption and withdrawal as well as carbon emissions from all the energy sources.
The developed model can serve as a decision support tool to aid policy makers take
decisions about electricity generation sources with a good understanding of the implica-
tions of their decisions for a nation’s water resources and environmental policies. As a
case study, a scenario analysis is conducted to estimate the water consumption, with-
drawal, and carbon emissions associated with Turkish Government’s energy plans until
2030. Figure A.3 in supplementary file shows the forecasted rising energy consumption
in Turkey until 2030. Turkey’s electricity needs will almost double, nearly 95% increase,
until 2030 compared to 2015 levels, which will put additional stress on water resources
and can cause significantly more GHG emissions. So we have to find a best energy gen-
eration mix of energy sources to keep the country’s water usage and carbon emissions
under the critical levels.

In the following sections of this thesis, the methodology of this study is defined and the
data collection methods are discussed. This is followed by a scenario analysis of Turkish
energy mix. Finally, the results are incorporated into a decision support tool to provide
a generalized view of water usages and GHG emissions of different energy mixes and help
optimizing the country’s water and carbon footprint. Policy implications are discussed
and then thesis is concluded by presenting the key findings of this study.
Chapter 2
Methodology
2.1 Method
The electricity consumption data is obtained from the International Energy Agency
(IEA) [37] and Turkish Statistical Institute [38]. Using autoregressive integrated moving
average (ARIMA), the electricity consumption data is forecasted fort the analysis pe-
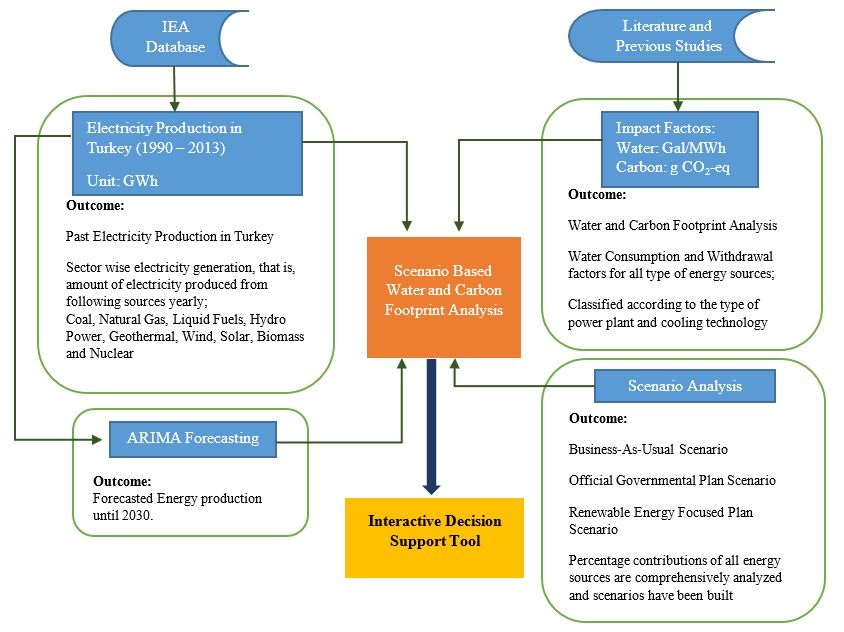
riod. The method employed for doing scenario based energy water analysis involves four
primary segments, as shown in Figure 2.1 [39]. The Electricity production in Turkey
is studies with respect to individual energy sectors available in the country from 1990
to 2013. A large portion of this data is obtained from the database of International
Energy Agency. Over this 23 years’ span, it is revealed that Coal, Natural Gas and
Hydropower are the most dominant sources of electricity in the country. Liquid fuels, on
the other hand, have never been a major source of energy. Wind, solar and geothermal
energy sectors grew after 2003 and are still in their developing stage. The Auto Regres-
sive Integrated Moving Average (ARIMA) forecasting tool is used to forecast the energy
production in Turkey, keeping in view the socio-economic factors, population growth,
regional and climatic changes until 2030.
Water consumption and water withdrawal rates of all the energy sources are extensively
studied in the next phase. For energy sector, water usage is highly dependent on the
type of cooling system used. Therefore, this thesis considers the most commonly used
cooling systems for each energy source and their water usage rates are shown in terms of
the range of minimum, mean and maximum amount of water usage that is expected to
5Chapter 2. Methodology 6
happen over the coming years. Carbon emissions from power plants are quantified based
on the capacity factors, life cycle assessments, productivity and cooling systems. For
each energy source, corresponding equivalent carbon emissions per kilowatt-hour (kWh)
are quantified based on thorough literature review discussed in the section 2.2.
Figure 2.1: Methodology.
In scenario analysis, different policy options for Turkey are comprehensively considered.
Three scenarios are formulated, namely: Business as Usual (BAU), Official Governmental
Plan (OGP) and Renewable Energy Focused Development Plan (REFDP). For each
scenario, relevant conditions are analyzed and the growth of each energy sector is studies
over the time lapse of 5 years until 2030. Percentage contributions of every source
combined with the total electricity forecast and water consumption and water withdrawal
factors are all fused to analyze energy water nexus in Turkey. In order to make our study
more interactive and useful for policy makers, a decision support tool is also developed
with interactive capabilities. Further details on the interactive decision support tool are
given in the following sections and its access link is given in the appendix.
There are three main assumptions in this study:Chapter 2. Methodology 7
1. Electrical consumption is assumed to increase based on the ARIMA forecasting
until 2030. The results of ARIMA have been compared with the available sources
and are found to be comparative.
2. Electrical sectors share in overall energy production are based on past studies
referred in earlier sections. In order to make it realistic, interactive system has
been designed to make this model realistic.
3. Water factors, that is, unit water consumption and withdrawal values per electrical
energy produced are taken in a range of minimum and maximum values because
water consumption and withdrawal depends on several variables such as cooling
system used in power plants, their efficiency, operating conditions and many more.
Therefore, mean values of the ranges are used as a basis of our results.
4. GHG emission coefficients from different power generation sources quantified are
considered to remain same over the period of analysis considered in this study.
2.2 Data Collection
To analyze water usage from energy sector in Turkey, following records were obtained
from the available sources: total energy consumed in annual basis, a share of individual
energy source in total energy consumption, proportions of electricity used by residential
and non-residential sector in Turkey. Year 1990 was set as the base year for this study
and 2014 is the most recent year for this study.
2.2.1 Energy Consumption
Total energy consumed and energy sector wise production on annual basis is summarized
in Appendix table 2.1. Figure A.2 in appendix shows how the energy consumption (in
Gigawatt- Hours) has varied over the years. Figure 2.2(a) shows the trend of percentage
increase in the energy consumption with respect to the previous year. As it is apparent,
there is a mix trend in the increase in energy consumption from year to year. However,
comparing the increment from the base year, i.e. from 1990, energy consumption is
increasing at a very rapid rate. The trend of energy consumption growth from 1990 is
shown in Figure 2.2(b). Demand for electrical energy in Turkey doubled in 1999; withChapter 2. Methodology 8
increasing population and rapid industrialization, energy consumption grew to about
206% in 2006. This sharp increase in trend continues as energy consumption increased
about 338% in 2013 compared to 1990.
Figure 2.2: Electricity consumption trend (1990-2014) with respect to previous year.
To meet a steep rise in the energy requirements presented in Figure 2.2(b), energy sector
has growth at a rapid pace as well - utilizing different energy sources to generate electric-
ity. Coal, liquid fuels, natural gas and hydro power plants are the major contributors in
the Turkish electricity generation. Other sources such as biomass and geothermal have
been in existence since long, but their production volumes are not comparative. Wind
energy and Solar PV have started to take roots in the country and are expected to grow
with increasing environmental concerns.
Coal is a prime contributor in the generation of electricity. Shares of liquid fuels are
relatively less, and declining trend is observed as the factual values move towards 2013.Chapter 2. Methodology 9 Natural Gas fired power plants also dominate despite that the country depends largely on its import of Natural gas from other countries; which is an added burden on its economy as well [29]. Other renewable sources such as wind, solar photovoltaic (PV), geothermal and biomass are growing steadily at a normal pace. It is worth to mention that Turkey is among the few countries where geothermal technology is deployed to produce electricity [40]. Since our objective is to predict the water usage and carbon emissions over time in future, we have used ARIMA forecasting method to forecast energy consumption until 2030. Several other forecasting methods were tested, but ARIMA results were very comparative with the projections of Turkish Ministry of Development. Turkish ministry of Development presented energy demand projections of the coming two decades in their report "Turkish Energy Demand Projection Report" [41]. Their projections were very close to our ARIMA forecasting, hence, we relied on the results of our model to predict our results. Figure A.3 in appendix presents the energy requirements of Turkey until 2030. Variation in our forecasted results and the Ministry of Development predictions can also be noticed. 2.2.2 Water Consumption, Withdrawal and GHG Emission Factors To access the amount of water withdrawn and consumed from different power sources, each source is studied for its own water consumption and withdrawal factors. Water and carbon factors of power plants do not vary substantially from country to country. Despite methodological differences among them, general trends are similar and broad conclusions about their footprints can be drawn. Water usage levels for power plants depends on more than one elements: design of power plant, type of fuel used, cooling system technology [42]. Therefore, data ranges are used to propose the range of water consumed and withdrawn by power sectors where nec- essary. Water utilization in life cycle of almost all the energy sectors happen in their operational phase; except for non-thermal renewable source [43]. Thus, water used in operation of power sectors considers cooling systems, washing purposes and other auxil- iary processes [42]. Regardless, the cooling system is the actual element determining the water utilization of a power sector [44]. Table2.1 shows the water consumption factors, in gallons per megawatt hours, by individual energy sectors based on the type of cooling
Chapter 2. Methodology                                                                             10

            Table 2.1: Sector wise Water Consumption Factors (Gallons/MWh) [42]

     Energy Sector   Cooling System   Technology                           Min    Median   Max
                                      Generic                              480    687      1100
                                      Subcritical                          394    471      664
                                      Supercritical                        458    493      594
                     Tower            IGCC                                 318    372      439
                                      Subcritical with CCS                 942    942      942
                                      Supercritical with CCS               846    846      846
     Coal                             IGCC with CCS                        522    540      558
                                      Generic                              100    250      317
                     Once-through     Subcritical                          71     113      138
                                      Supercritical                        64     103      124
                                      Generic                              300    545      700
                     Pond             Subcritical                          737    779      804
                                      Supercritical                        4      42       64
     Liquid Fuels    N/A              Combined                             300    390      480
                                      Combined Cycle                       130    198      300
                                      Steam                                662    826      1170
                     Tower
                                      Combined Cycle with CSS              378    378      378

     Natural Gas                      Combined Cycle                       20     100      100
                     Once-through
                                      Steam                                95     240      291
                     Pond             Combined Cycle                       240    240      240
                     Dry              Combined Cycle                       0      2        4
                     Inlet            Steam                                80     340      600

     Hydropower      N/A              Aggregated in-stream and reservoir   1425   4491     18000

     Wind            N/A              Wind Turbine                         0      0        1
                                      Dry Steam                            1796   1796     1796
                                      Flash (freshwater)                   5      10       19

                     Tower            Flash (geothermal fluid)             2067   2583     3100

                                      Binary                               1700   3600     3963
     Geothermal                       EGS                                  2885   4784     5147
                                      Flash                                0      0        0
                     Dry              Binary                               0      135      270
                                      EGS                                  300    850      1778
                                      Binary                               74     221      368
                     Hybrid
                                      EGS                                  813    1406     1999
                                      Steam                                480    553      965
                     Tower
                                      Biogas                               235    235      235
     Biomass         Once-through     Steam                                300    300      300
                     Pond             Steam                                300    390      480
                     Dry              Biogas                               35     35       35
     Solar PV        N/A              Utility Scale PV                     0      26       33
                     Tower            Generic                              581    672      845
     Nuclear         Once-through     Generic                              100    269      400
                     Pond             Generic                              560    610      720

system and technology used. Similarly, Table 2.2 shows the water withdrawal factors
from individual energy sources according to the relevant cooling systems and technology.
Graphical representation of water consumption and withdrawals are presented in Figure
A.4 Figure A.5 shown in Appendix.
Chapter 2. Methodology 11
Table 2.2: Sector wise Water Withdrawal Factors (Gallons/MWh) [42]
Energy Sector Cooling System Technology Min Median Max
Generic 500 1005 1200
Subcritical 463 531 678
Supercritical 582 609 669
Tower IGCC 358 390 605
Subcritical with CCS 1224 1277 1329
Supercritical with CCS 1098 1123 1148
Coal IGCC with CCS 479 586 678
Generic 20000 36350 50000
Once-through Subcritical 27046 27088 27113
Supercritical 22551 22590 22611
Generic 300 12225 24000
Pond Subcritical 17859 17914 17927
Supercritical 14996 15046 15057
Liquid Fuels Combined Cycle 300 450 600
Combined Cycle 150 253 283
Tower Steam 950 1203 1460
Combined Cycle with CSS 487 496 506
Combined Cycle 7500 11380 20000
Natural Gas Once-through
Steam 10000 35000 60000
Pond Combined Cycle 5950 5950 5950
Dry Combined Cycle 0 2 4
Inlet Steam 100 425 750
Hydro N/A N/A N/A
Wind - - -
Upstream and downstream 0.5 3 10
Binary: Hybrid cooling 220 460 700
Geothermal Binary: Dry cooling 270 290 630
Flash 11 18 25
EGS: Dry cooling 290 510 720
Tower Steam 500 878 1460
Biomass Once-through Steam 20000 35000 50000
Pond Steam 300 450 600
C-Si (crystalline silicon) 1 94 1600
Other (primary thun film) 0.5 18 1400
Solar PV
Flat panel 1 6 26
Concentrated PV 24 30 78
Tower Generic 800 1101 2600
Nuclear Once-through Generic 25000 44350 60000
Pond Generic 500 7050 13000
Water consumption factors diversely vary from sector to sector [45]. Generic technology
in tower cooled coal fired plants consume most water in Coal sector, followed by sub-
critical and super-critical technologies; having maximum consumption factors of 1100
gallons per megawatt-hour, 942 gallons per megawatt-hour and 846 megawatt-hour, re-
spectively. Water consumption factor in Liquid fuels and hydropower sectors vary fromChapter 2. Methodology 12 300 gallons per megawatt-hour to 480 gallons per megawatt-hour and 1425 gallons per megawatt-hour to 18000 gallons per megawatt-hour, respectively. Natural gas power plants, as well as biomass power plants, which use steam to as a driver for turbine rotation, consume maximum water among other technologies. Enhanced Geothermal Systems (EGS) dominates geothermal technologies. Generic nuclear power plants hav- ing tower cooling system consume most water out of generic plants having once-through cooling system and pond cooling system. Hydropower sector, despite being a non-fossil based- renewable energy, happen to consume maximum volume of water among rest of the sources, largely because of the evaporation from exposed water surfaces of large reservoirs of dams and lakes [46]. Water withdrawal factors, on the other hand, lie on the higher side as compared to water consumption. This is due to the intensive water withdrawals for cooling purposes in coal, liquid fuels, natural gas, biomass and most importantly, nuclear energy sector. As in the case of water consumption, cooling technology has a substantial role to play. Once-through cooled generic coal power plants withdraw most water out of all the cool- ing technologies and technologies of coal energy sector considered in this study. The highest water withdrawals factors for coal power production range from 20,000 gallons per megawatt-hour to 50,000 gallons per megawatt-hour. Natural gas designed on com- bined cycle power plants and steam withdraws most of the water, with steam plants dominating like they dominated in water consumption. Combined cycle plants withdraw minimum of 11,380 gallons per megawatt-hour to the maximum limit of 20,000 gallons per megawatt-hour while gas plants using steam withdraws 10,000 gallons per megawatt- hour to 60,000 gallons per megawatt-hour. Water withdrawal factors in geothermal power sector have minimum ranges between 220 gallons per megawatt-hour to 290 gallons per megawatt-hour and maximum range between 630 gallons per megawatt-hour to 720 gal- lons per megawatt-hour. Biomass and nuclear are thought to be environmental friendly power options, but they also withdraw considerable volumes of water. Biomass plants with steam technology and once-through cooling system withdraws 20,000 gallons per megawatt-hour to 50,000 gallons per megawatt-hour and generic nuclear plants with once-through cooling withdraws 25,000 gallons per megawatt-hour to 60,000 gallons per megawatt-hour. Solar photovoltaic (PV) energy sector withdraws as low as 0 gallons per megawatt-hour to 1600 gallons per megawatt-hour. However, mean water withdrawal in solar PV is also close to 0 gallons per megawatt-hour. Wind energy withdraws no
Chapter 2. Methodology                                                                   13

water; therefore, it is the least water dependent source as far as water withdrawal is
concerned. Hydropower water withdrawal factors of run-of-the river hydropower plants
are not considered in this study due to the fact that these power plants are generally
located in between the natural flow of the river and do not take away water from other
purposes like agriculture, industrial and domestic purposes for a long period of time.

GHG emission factors or carbon coefficient of power generation sources are also consid-
ered to analyze environmental impacts resulting from power sources of various types.
For every power generation source, detailed examination of the factors like capacity
factor, technology type, life cycle assessment, cooling technologies and other related fac-
tors is done along with their corresponding effects on the eventual carbon emissions
from former literature and reports. For example, National Renewable Energy Labora-
tory (NREL) report on the "life cycle assessments of coal-fired power production" and
"Life Cycle Assessment of a Natural Gas Combined-Cycle Power Generation System"
quantified the contributions of GHGs by coal and natural gas combined power plants
respectively [47, 48]. Hiroki Hondo [49] has done a comprehensive study of greenhouse
gas emissions from coal, natural gas, hydroelectric, nuclear, wind, solar and geothermal
power plants in relation to global warming. White and Kulcinski [50], Odeh and Cock-
erill [51], Meier [52] and various other researchers [53–55] have extensively studied the
emissions from different power generation sources and their work is used in this study
to predict the carbon emissions from the respective power sources in Turkey. Figure 2.3
shows the Pareto diagram of the average GHG emissions by all the power sources present
in Turkey. Coal, liquid fuel and natural gas fueled power plants constitute to 90% among
the overall carbon emission factors, in terms of grams per kilowatt-hour. Although solar
energy and geothermal energy are assumed to be renewable having no carbon emissions,
but we have found out that their average greenhouse gas emission factors are about 50
g CO2 -eq/kWh and 34 g CO2 -eq/kWh respectively [56, 57]. Extraction of energy from
waste, as in the case of electricity generation from biomass, contributes to GHG emissions
as well and happen to emit about 32 g CO2 -eq/kWh [58].

On the other hand, values of the water usage factors by energy sources are presented
in terms of volume per unit electrical output (gallons per Megawatt-hours). They are
further categorized as the minimum amount of water used, mean amount of water used
and the maximum amount of water used by each type of cooling technology. The amount
of water used by a power plant will lie between the minimum and maximum value,
Chapter 2. Methodology                                                                 14

                Figure 2.3: The average GHG emissions by energy sources.

depending on the source, cooling method and technology. This thesis considers the
minimum amount of water, the range of mean amount of water that a power plant may
use and the maximum level of water that any source can use while producing the required
electricity. As there are many cooling technologies associated with energy sectors, mean
factors are bifurcated as the lower mean and upper mean, suggesting the minimum and
maximum value among the mean values of all the cooling technologies of a specific energy
sector. The reason for making a range of mean in each energy source is to depict the
average water usage by each sector irrespective of their cooling technology. In case where
there is one cooling system, the range of mean is not applicable.

Above discussed GHG emission factors, water consumption and withdrawal factors will
be used as a tool to calculate the equivalent grams of CO2 emissions together with the
volumes of water consumed and withdrawn in Turkey over the years and also, to predict
the amount of water that will be consumed and withdrawn in the future years.

From carbon emission factors, water consumption and withdrawal factors, sector wise
water utilization is calculated by:

                              W Cxy = W Cfx ∗ ECxy ∗ 1000                            (2.1)

                             W Wxy = W W fx ∗ ECxy ∗ 1000                            (2.2)
Chapter 2. Methodology 15
CExy = Cfx ∗ ECxy ∗ 1000 (2.3)
Where,
W C = Water Consumption;
W Cf = Water Consumption Factor;
W W = Water Withdrawal;
W W f = Water Withdrawal Factor;
CE = Carbon Emissions;
EC = Energy Consumed;
x = Energy sector;
y = Year of study;
W Cxy = Water Consumption of x Energy sector in Year y;
W Cfx = Water Consumption Factor of x Energy sector;
W Wxy = Water Withdrawal of x Energy sector in Year y;
W W fx = Water Withdrawal Factor of x Energy sector;
CExy = Carbon Emission of x Energy sector in Year y;
Cfx = Carbon Emission Factor of x Energy sector;
ECxy = Energy Consumed by x sector in Year y;
Units of water consumption and water withdrawal factors are gallons per megawatt
hours (Gal/MWh) and unit of energy consumed is gigawatt hours (GWh). Hence, to
homogenize the units, both eqn. 2.1 and eqn. 2.2 are multiplied by 1000. Similarly, units
of carbon emission factors are grams of CO2 and equivalent gasses per kilowatt-hour (g
CO2 -eq/kWh) while units of energy consumed is GWh.
Total water consumption and withdrawal volumes for the year are calculated by using:
n
X
W Cy = W Cxy (2.4)
x=0
n
X
W Wy = W Wxy (2.5)
x=0Chapter 2. Methodology 16
n
X
CEy = CExy (2.6)
x=0
2.3 Energy-based Analysis
In this section, a general overview of Turkey’s energy sources used for electricity gener-
ation is discussed. Their proportions in overall electricity production have been studies
and analyzed from 1990 to 2013. Based on this analysis and external factors, their fu-
ture developments have been predicted through scenario analysis discussed in coming
sections.
Demand for electricity in Turkey is going through a rapid change [59] largely due to
the surge in sectoral growth in the country. From 2004 to 2014, electricity demand
has increased by 70% and in expected to grow at the same pace. Turkey’s economy
performance, technological advancements, amount of imports and exports, GDP growth
and lifestyles of the people have considerably burdened the energy sector [60]. In order
to meet these increasing needs, Turkish energy sector is largely dependent on fossil fueled
power plants, particularly coal and natural gas. Therefore, Turkish government has not
only to meet the ever-increasing power demand, but also to reduce its reliance on imports
of energy and energy fuels.
Turkey’s share of natural energy resources in terms of world reserves are very limited,
therefore, more than 52% of Turkey’s energy requirements are met through fuel im-
ports [61], and sharp increase in electricity demands have increased the country’s in-
clination to rely more on importing energy fuels and supplies [30]. Turkey’s primary
energy sources are coal, liquid fuels, hydropower, natural gas, geothermal energy, solar
energy and biomass. The country produced about 44% of its electricity from gas, 24.8%
electricity from coal, 25.2% from hydro, and rest from wind, geothermal, biomass and
solar in 2014. The government is expecting the electricity demand to increase by 100%
from 2014 to 2023.
29% of global energy demand come from coal, which result in 44% of global CO2 emis-
sions [62]. In turkey also, as it can be seen from Figure 2.4, coal and natural gas has been
dominant in Turkish electrical sector. Hydropower also is one of the major contributors.
Turkey imports most of its natural gas; even then, natural gas fired power productionChapter 2. Methodology 17
surged after 1998 and continues to vary in between 42% to 50% in the following years.
Coal energy, on the other hand, slightly declined below 30% in 2001, but it is a major
contributor in overall production. Contribution from liquid fuels is not very considerable
since long and its rate is declining as other renewable technologies are taking their roots.
Wind energy comes on surface in later 2007 and is growing steadily since then. In 2013,
3.1% of total energy requirements were supplied through wind energy.
Figure 2.4: Turkey Electricity generation mix (1990 - 2013).
2.4 Scenario Analysis and Scenario Building
The primary motivation behind a scenario analysis is a target in mind or a goal that
constitutes in the development of scenarios and to predict the results of future, based
on the preset assumptions or goals. Since long, scenarios are used for discovering the
forthcoming progress under a set of assumed conditions; especially in decision support
in energy sectors [63]. This method of analysis gives the alternative options of how our
subject of thesis will unfold.
In order to understand systems well, we need to evaluate their models through playing
with the strings and constraints and then, by observing their behavior and responses, we
tend to determine their likely future states. Unfortunately, this method is useful with
non-sophisticated and certain systems. Real world systems, studying on energy sector
in our case, is a very complex system whose sectors are so independently dependent of
diverse factors that it is impossible to accurately predict their behavior. So judgmental
tools are only used as experimental basis. Therefore, scenarios simplify this gap of ourChapter 2. Methodology 18 understanding about the working, behavior and evolution of complex systems. This is generally done by attaching quantitative narrative strings of the future with quantitative respective elements. This makes scenarios a useful tool for scientific assessments and for learning systems. Also, they enables the policy makers to analyze the system from multi dimensions before coming up to a decision [64]. Hence, they happen to be one of the main methods for solving the complexities and uncertainties associated in long term policy making by establishing the logical boundaries [65]. Scenario analysis for environmental and energy sectors have been done at different scales; ranging from worldwide long-term international scenarios to local mid-term scenarios [66, 67]. In this study, to analyze the water usages under different energy mixes of energy sectors, scenario analysis is therefore deployed as a productive tool to better understand and interpolate the volumes of water that will be used in Turkey in coming years. All the electricity producing sectors of Turkey are studied in detail keeping in view their contributions in the total electricity consumption of the country, their future perspectives in line with the governmental policies, their environmental impacts and socio-economic repercussions and their driving fuel availability. Once the trends of energy mixes of different sectors are established, water consumption and withdrawal factors, presented in earlier sections, are used to calculate the amount of water consumed and withdrawn annually by each energy source in the country as explained in eqn. 2.1 and 2.2. A decision support tool is developed for policy makers to study the water consumption and withdrawals from each energy source, as well as collectively, of all the scenarios deployed. Also, developed tool can help them in observing the changes with any other electricity mix. The tool takes scenario input from user, which is the percentages of the distinct energy sectors in the overall energy sector of the country, and present detailed results of the water consumption and withdrawals made by individual scenarios and individual energy sources. The user can change the energy mixtures to compare the results of different scenarios. Turkey, which corresponded to about 1.24% (around 459,102 Mega tons) of emissions equivalent of CO2 in 2013, became the signatory of The Paris Agreement under United Nations Framework Convention on Climate Change [68]. Therefore, they have pledged to reduce the risks and impacts of climate change by curbing global average temper- atures [69]. The government is working on building renewable energy resources, and
Chapter 2. Methodology                                                                  19

establishing frameworks to improve technologies to prevent carbon emissions while se-
curing the leakages of electricity in distribution system, which is in line with the COP
21 declarations. Furthermore, international economic institutions have predicted that
Turkey’s economic growth rates with remain on the higher side which will result in
exponential increase in energy consumption as well [70].

To reduce the dependence on import of fuel for electricity, especially natural gas, Turkish
government aims to exploit its coal resources for power generation under its plan of
"Dash for Coal" [71]. Alongside this, the country is also aiming on long-term energy
strategies to speed up its renewable energy consumption. Increasing the percentage mix
of renewable energy production will also result in the reduction of shares of coal and
natural gas [72]. Hydroelectric power potential has the capacity of meeting 33% to
46% of Turkey’s electricity demand until 2020 and this share can easily increase to its
maximum potential easily and economically until 2030 and further [73].

With increase in renewable energy projects around the world, costs of setting up re-
newable power energy technologies are decreasing gradually. Turkey, being abundant in
renewable energy resources can clinch on this opportunity to cut down the use of imported
coal and natural gas in power generation. The key renewable sectors for Turkish energy
sector are hydropower, solar photovoltaic, wind, geothermal and nuclear energy [74]. By
2023, around 159,000 GWh of renewable electrical energy is projected to be installed in
Turkey [70].

Keeping in view the governmental policies, worldwide technological trends and related
factors that can influence electrical energy sector, along with the available studies about
the future of Turkish energy sector, thorough analysis of energy sources in Turkey have
been conducted and their potential mix have been simulated in three different scenarios
until 2030. Percentage contribution of each power source is calculated and then, through
scenario analysis, their mixes are predicted for 2020, 2025 and 2030. Three scenarios
have been used: Business-As-Usual (BAU), Official Governmental Plan (OGP) of the
government of Turkey based on the future energy projects and their expected deadlines,
and the Renewable Energy Development plan (REFDP). After, water consumption and
withdrawal are predicted by individual electricity generation source keeping in view their
percentage contribution in the Turkish power sector. This resulted in foreseeing the
volumes of water that will be required to cater Turkish electricity demands over the
Chapter 2. Methodology                                                                   20

years until 2030. According to the Turkish Ministry of Energy and Natural Resources,
36 GW of hydropower electricity, 48 GW of wind energy and 2 GW of geothermal energy
capacity is available in the country. While it is estimated that solar energy potential is
as much as 380,000 GWh per year and biomass energy potential is about 1300 GWh per
year.

2.4.1    Scenario 1 (BAU)

Scenario 1 is the first scenario developed to analyze the trends in growth of different
power sectors and their water consumption and withdrawals until 2030. Scenarios have
been developed in line with the current trends in the development of energy sectors in
Turkey. BAU differs from official governmental plan as it does not consider ambitious
projections. In this regard, present conditions of electricity sector and existing policies
of Turkish government have been studied along with the projects that are in the process
of completion in the coming times.

Figure 2.5 shows the variation of Turkish energy sector mix in BAU scenario from 2015 to
2030. Electricity consumption from coal energy in BAU scenario is expected to increase
from 60,740 GWh in 2015 to 100,340 GWh until 2025, with a steady percentage of
around 23% to 24% in the overall mix. By 2030, this proportion increased to 27%,
taking energy production through coal to around 139,000 GWh. Energy production
from natural gas resources is expected to decrease substantially as it is evident from the
government’s commitment of reducing dependency on import of gas and utilizing local
coal resources. Natural gas accounts for approximately 44% of the overall energy mix
in 2015 are projected to go down to around 23% until 2030 under BAU. This decrease
in the percentage is not compatible with the increase in the overall demand; meaning
that in 2015, about 116,500 GWh of electricity was produced from natural gas and
in 2030, it is projected that 119,711 GWh of electricity will be produced. Amount of
electricity produced in 2030 is still greater than its value in 2015. That is because of the
overall exponential increase in the energy demand. Renewable energy under Business-
as-usual scenario also depicts a very interesting trend. Hydropower energy is estimated
to fluctuate from 25.8% in 2015 to 27.5% in 2020 to 26.6% in 2025 to 22.8%; while
proportions of wind energy are expected to increase steadily, but still at a slow pace
as compared to the rest of the world. It is estimated that wind energy proportions
Chapter 2. Methodology                                                                  21

will increase from only 4.4% having just a share of 11,635 GWh to 13.2% making the
share of about 68,000 GWh in 2030. Geothermal and biomass technologies under BAU
are expected to stay under 1%, making their share very minimum. Solar photovoltaic
(PV) technology in Turkey’s BAU scenario is projected to take a heap until 2020. It
is estimated that Turkey will be producing 3.6% (around 11,800 GWh) of its electrical
energy from solar PV in 2020, 6.4% (26,500 GWh) in 2025 and 8.4% (43,250 GWh) in
2030. Nuclear energy power is expected to come on-line in 2023 and will be contributing
2.5% of the total energy share. The pace of development of nuclear plants in Turkey is
expected to remain steady under BAU. Until 2030, 4.7% of the total energy is expected
to come from nuclear technology.

2.4.2   Scenario 2 (Official Governmental Plan)

Scenario 2 is based on the targets and time-lines of Turkish government’s projects to cater
growing energy demand in the country. Existing policies to cope up the increasing power
demands, capacity planning and current conditions of the electricity market and sector
are all considered while formulating the energy mixes for this scenario. Government
plans and deadlines along with projected time when future energy projects will come
on-line are taken into account in this scenario.

Figure 2.6 shows the variation of Turkish energy sector mix in BAU scenario from 2015
to 2030. Official governmental plan suggests that the dependency on coal for energy
will continue, however, it will not be a major player in the country’s electricity mix as
other renewable sources are expected to grow. Coal energy’s contribution will range from
23% to 20.8% to 21.2% in 2015, 2025 and 2030 respectively. Natural gas, on the other
hand, is expected to have a sharp decline due to the government’s diversion towards
exploiting local coal resources and building up renewable resources. A share of natural
gas is expected to fall from 44% to 15% until 2030.

Wind, solar PV, and nuclear energy development is expected to grow substantially under
this scenario. These targets are set in line with the global targets of reducing carbon
emitting power dependencies and focusing on renewable energy sources. Wind energy
is expected to have 23% share until 2030 in the country’s overall electricity mix. Solar
PV power production is assumed to grow from 1.6% in 2020 to 2.5% in 2023 to 4.5%
in 2025 to 9.7% in 2030. As far as nuclear energy is concerned, the government plans
Chapter 2. Methodology                                                                     22

   Figure 2.5: Scenario 1 (Business-As-Usual) Energy Mix Percentages (2013 - 2030)
   (a) cumulative stacked representation; (b) trend of percentage fluctuation Energy Mix
                                 percentages (2013 - 2030).
Chapter 2. Methodology 23
Figure 2.6: Scenario 2 (Official Government Plan) Energy Mix Percentages (2013 -
2030) (a) cumulative stacked representation; (b) trend of percentage fluctuation Energy
Mix percentages (2013 - 2030).Chapter 2. Methodology 24 to complete two under construction nuclear power plants by 2023, their projected power contribution to the system will be about 7.9% in 2023 and this proportion is expected to remain stable with the induction of Sinop and Lgenada nuclear projects until 2030 [25]. 2.4.3 Scenario 3 (Renewable Energy Focused Development Plan) Scenario 3 is the renewable energy focused development plan where the assumptions of Turkish government policies to prioritize renewable electrical options are taken into consideration for the coming decades. Development of coal and natural gas sector will be given less attention as compared to wind and solar photovoltaic (PV) energy, which have not been very dominant in Turkish electrical mix, despite their rapid growth world- wide [70]. 2.7 shows the variation of Turkish energy sector mix in BAU scenario from 2015 to 2030. Energy production from fossil fuels is expected to fall substantially. Coal energy is expected to decrease from 23% in 2015 to 19.2% in 2020 to 14.8% in 2025 to 12.1% in 2030. Natural gas is also expected to decrease from 44% in 2015 to 20.6% in 2030. Development of renewable energy technologies are prioritized in this scenario, particularly wind energy and solar PV. In REFDP scenario, wind energy is expected to grow at a rate of about 5% to 6% every 5 years; i.e. from 4.4% in 2015, its proportion in overall electricity mix will climb up to 20% in 2030. Development of solar PV will also be also estimated to be on a higher node as compared to the other two scenarios. Solar PV has the potential to cater about 6% of Turkey’s electric needs by 2020. This proportion is estimated to be doubled in 2025, as it will get to 12%. In 2030, solar PV contribution will reach to about 17.4%.
Chapter 2. Methodology                                                                        25

   Figure 2.7: Scenario 3 (Renewable Energy Focused Development Plan) Energy Mix
   Percentages (2013 - 2030) (a) cumulative stacked representation; (b) trend of percentage
                    fluctuation Energy Mix percentages (2013 - 2030).
Chapter 3
Results Discussion
3.1 Results Discussion
The results present water consumption and withdrawal factors, GHG emission factors,
scenario analysis and forecasted electricity production. A time-series analysis results
covering 2015, 2020, 2025 and 2030 are presented in this section and all the scenarios are
showed and discussed alongside each other. Water usage in 2015 is same for all scenarios
as 2015 is set as the base year and percentage contribution of all the energy sources is
same in all the scenarios for this year. Eqn. 2.4, Eqn. 2.5 and Eqn. 2.6 developed
in the methods sections are used to calculate the total water consumption and water
withdrawal, as well as the total amount of CO2 emissions for all the scenarios. Amount
of water consumed and the amount of water withdrawn are compared separately along
side the amount of carbon emissions for each scenario in the following sections.
Firstly, amount of gallons of water consumed and withdrawn as a result of the total elec-
tricity production in the country are presented and are categorized by individual power
sector. The author has driven the percentages from these values and have represented
them in separate figures. Then total water consumption, withdrawal and carbon emis-
sions results are shown collectively to give a different illustration of the scenarios for
every 5 years until 2030. It is important to mention that the results shown in this thesis
are largely summarized. Please refer to our decision support tool (see Appendix for link)
for detailed results and more insights of analysis.
26You can also read


