Drought Effects on Photosynthesis and Implications of Photoassimilate Distribution in 11C-Labeled Leaves in the African Tropical Tree Species ...
←
→
Page content transcription
If your browser does not render page correctly, please read the page content below
Article
Drought Effects on Photosynthesis and Implications
of Photoassimilate Distribution in 11C-Labeled
Leaves in the African Tropical Tree Species
Maesopsis eminii Engl.
Jackie Epila †    ID
                       , Michiel Hubeau †    ID
                                                  and Kathy Steppe *
 Laboratory of Plant Ecology, Department of Plants and Crops, Faculty of Bioscience Engineering,
 Ghent University, Coupure Links 653, 9000 Gent, Belgium; EpilaJackie@yahoo.co.uk (J.E.);
 Michiel.Hubeau@UGent.be (M.H.)
 * Correspondence: Kathy.Steppe@UGent.be; Tel.: +32-9-264-6112
 † These authors contributed equally to this work.

 Received: 13 January 2018; Accepted: 26 February 2018; Published: 28 February 2018

 Abstract: Photoassimilate distribution inside leaves is less studied than photosynthesis, and yet
 the topic is important as it gives insights into the vital roles played by leaves in plant survival.
 We combined greenhouse measurements of light response curves with 11 C-labelling using leaves
 of 3-year-old potted Maesopsis eminii Engl. trees to improve our understanding of its leaf carbon
 physiology. This fast-growing pioneer tree species showed low photosynthetic rates for a common
 tropical pioneer during well-watered reference conditions (5.0 ± 0.7 µmol m−2 s−1 ), which
 further decreased in response to drought. 11 C-autoradiography indicated active phloem loading
 and/or rapid phloem transport rates. Active loading is uncommon in tree species, but might be
 related to deciduousness traits and continuous investment in growth, like in herbaceous active
 loaders. Active loading involves higher carbon allocation to growth, which might explain why
 low photosynthetic rates were observed in this fast-growing species. These findings suggest that
 examining photoassimilate distribution and transport may be critical for understanding the role tree
 physiology plays in terrestrial carbon cycling.

 Keywords: African tropical tree; 11 C autoradiographs; drought; light response curve; Maesopsis eminii
 Engl.; photoassimilate distribution; leaf carbon balances; leaf photosynthesis and respiration

1. Introduction
      Changes in temperature, precipitation, CO2 , and evapotranspiration are already eminent in
African tropical rainforests, affecting their ecological processes [1]. These effects have gained increasing
attention [2–10] as the biome represents 15% of worldwide forests, and dominates inter-annual carbon
cycling with 50% [11,12]. Concerned stakeholders are calling for investigative studies on the impact
of climate change on carbon cycling processes in this terrestrial ecosystem [11–14]. Carbon-related
studies carried out thus far entail measurements of photosynthesis, respiration and plant carbon
budgets [11,13,15–21], and modeling that is often used to simulate and predict carbon budgets on large
spatial scale [13,14]. Research seldom illustrates how photoassimilates are distributed inside the leaf,
and are subsequently transported into the phloem, despite these being important plant functional
characteristics [22]. Furthermore, there is a demand for more data for the African tropics [13,14] to
improve CO2 flux modeling [23,24]. Evidence is increasing that considerable uncertainties exist in
assessing tropical carbon stocks [25–27], feeding the debate on how to implement tropical biomass
models [28]. This points to the relevance of increasing our knowledge on the ecophysiological
mechanisms underlying carbon sequestration.

Forests 2018, 9, 109; doi:10.3390/f9030109                                      www.mdpi.com/journal/forests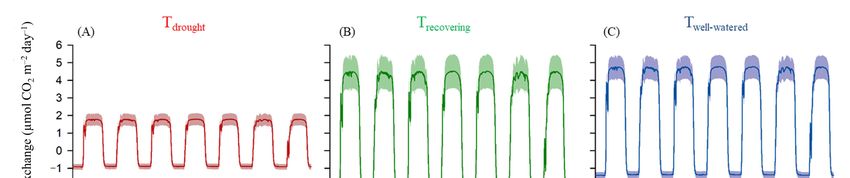
Forests 2018, 9, 109                                                                                    2 of 15

      Photosynthesis, respiration, carbon transport and allocation are closely linked [22,28–31], and important
to understand plant carbon balances [22]. Moreover, the impact of water status on these physiological
processes is manifold [22,32–36], pointing to the importance of an adequate understanding of plant drought
responses for their application and up scaling into large scale models [37–39]. Besides photosynthesis,
distribution of photoassimilate inside the leaf and their transport out of the leaf into the phloem are hence
important aspects to consider when assessing plant carbon fluxes and growth rates [22,40].
      Annually, trees in the tropics are subjected to drought resulting from a dry season. Tropical
trees have different drought coping mechanisms or strategies. Some trees lose their leaves, some
are semi-deciduous and others are evergreen. While an evergreen strategy may lead to more carbon
gain with increasing growing season, deciduous species are expected to benefit during droughts
associated with climate change [41]. To increase knowledge on species-specific carbon cycling,
we have chosen Maesopsis eminii Engl., which is a widespread pioneer drought-deciduous tree species,
mainly occurring in African tropical rainforests, and which has shown species-specific responses to
drought. M. eminii has considerable nocturnal sap flow [42,43], which according to Caird [44] might
enhance photosynthetic activity, and might be related to stem photosynthesis [45]. Furthermore,
Van Camp et al. [43] found that during initial drought, root pressure mitigated drought effects on
stem water storage, and Epila et al. [46] showed a substantial hydraulic capacitance in M. eminii that
contributes to the redistribution of leaf water from more drought affected to healthier leaves in order
to support survival during drought [46]. Because seedlings and saplings have an important ecological
role [47,48], this study investigated leaves of 3-year-old M. eminii plants under well-watered and
drought conditions.
      To quantify M. eminii’s photosynthesis, respiration, photoassimilate distribution and phloem
loading strategy we used a combination of techniques: (i) light response curves to assess M. eminii’s
leaf photosynthetic performance during drought, shortly after re-watering, and after a long recovery
period of 4 months (which represents well-watered reference conditions) [49–51]; (ii) 13 C stable isotope
analysis to determine its metabolic pathway for carbon fixation [52,53]; and (iii) 11 C-autoradiography
to map carbon distribution and phloem loading by exposing leaves to 11 CO2 [35,54–56]. Our specific
working hypothesis were: (i) the pioneer M. eminii will have high photosynthetic rates to accommodate
its fast growth, which will result in a substantially higher amount of fixed to respired carbon;
and (ii) being a tree, passive loading of sugars into the phloem is expected, with 11 C-autoradiographs
depicting a relatively uniform distribution of tracer in the mesophyll and a low accumulation of carbon
tracer in the vascular bundle.

2. Materials and Methods

2.1. Site Description
     The study was conducted between 5 May and 9 September 2015 in a tropical greenhouse (6.4 m
wide, 9.6 m long and 4.75 m high) of Ghent University, Belgium (50◦ 59.580 N, 3◦ 47.040 E). Light within
the greenhouse was supplied by natural solar radiation in combination with nine Philips bulbs of
200 W. A 14-h photoperiod was used, with lights turned on between 07:00 and 21:00. During the
photoperiod, an average photosynthetic active radiation (PAR) of 708 ± 27 µmol m−2 s−1 and an
average daily maximum PAR of 1563 ± 39 µmol m−2 s−1 were recorded (N = 92). The light intensities
were within the range reported (resp. 672 ± 55 µmol m−2 s−1 and 1727 ± 31 µmol m−2 s−1 , N = 115)
for a study conducted on 15-months-old M. eminii trees in Uganda [42]. Air temperature ranged
between 18 ◦ C and 35 ◦ C, and relative humidity of the air was set at 70%. A HortiMaX MT/MTV
sensor unit (HortiMaX, Maasdijk, The Netherlands) measured the interior microclimate.

2.2. Experimental Set-Up
     Fifteen 3-year-old Maesopsis eminii Engl. trees were used in this study, which had a height of
2.3 ± 0.4 m at the start of the experiment and a stem diameter of 21 ± 5 mm, measured at 40 cm above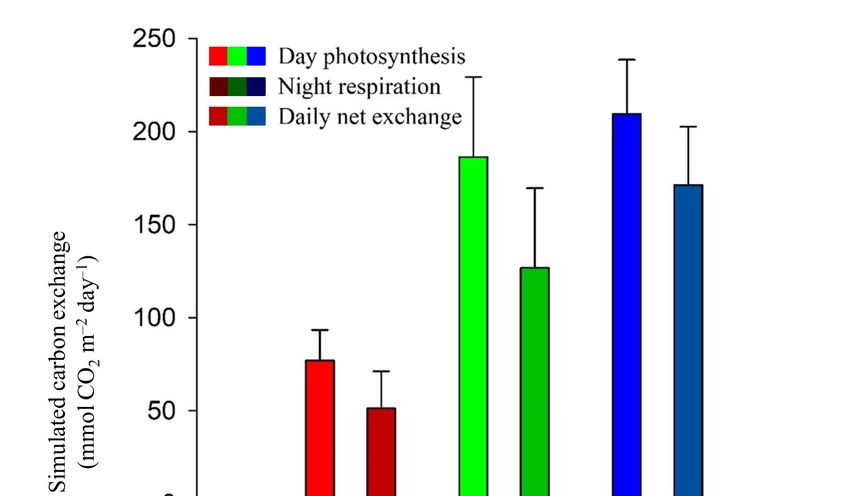
Forests 2018, 9, 109                                                                                     3 of 15

the root collar. The trees were grown in 35-L bottom-perforated pots containing peat soil, and were
germinated from randomly picked seeds of unselected parent plants thriving in Mabira forest, Uganda
(0◦ 23.3570 N, 33◦ 0.3440 E). Trees were randomly distributed on tables raised to a height of 0.75 m and
during drought periods round plastic pot saucers were used to prevent any water uptake from the
tables. During periods with irrigation, trees were irrigated three times a day for four minutes using an
automatic flood-table irrigation system to ensure unstressed reference conditions with ample soil water.
Irrigation water consisted of a mix of rainwater and soluble fertilizer (N:P:K:Mg ratio: 19:8:16:4, boron
(0.02%), copper (0.03%), iron (0.038%), manganese (0.05%), molybdenum (0.02%) and zinc (0.01%))
that resulted in a solution pH of 5.7.
      The experiment started with a two-week drought period, which was the consequence of an
irrigation malfunctioning during this period. Photosynthesis measurements were taken at the final
day of this accidental drought period, after a short time of recovering and after a 4-month recovering
window, which we assumed as fully recovered, because new leaves were then mature, and the trees
had grown as ample water was provided. This experiment was performed in controlled greenhouse
conditions, but could be used as a proxy of tropical trees’ behavior during the dry season and their
recovery in the wet season.

2.3. Photosynthesis Measurements
      Light response curves were measured after two weeks of drought, on 19 May 2015 (Tdrought ),
three weeks after rewatering, on 10 June 2015, to evaluate the state of recovery (Trecovering ), and 16 weeks
after rewatering, on 9 September 2015, when new leaves had emerged and were full-grown for
several weeks, to assess well-watered reference conditions (Twell-watered ). Net photosynthesis (Pn ) was
measured for all fifteen trees on fully matured leaves exposed to the sun, and comparable in size, with
a leaf chamber fluorometer (2 cm2 leaf area) of a portable photosynthesis system (LI-6400; LI-COR
Biosciences, Lincoln, NE, USA). Irradiance was gradually increased from 0 to 2000 µmol m−2 s−1 in
five steps (0, 50, 100, 1250 and 2000 µmol m−2 s−1 ), each at least lasting 3 min, and leaf gas exchange
was determined, while keeping the atmospheric CO2 concentration at 400 µmol CO2 m−2 s−1 and block
temperature at 24 ◦ C. All light response curves were measured between 10 h and 16 h. At 0 µmol PAR
m−2 s−1 the dark respiration rate was measured, and at 2000 µmol PAR m−2 s−1 maximum photosynthetic
rate was assessed. For all dark respiration measurements, leaves were enclosed in the cuvette for at
least 5 min before the actual measurement. Stomatal conductance data were excluded for analysis as the
duration of measurements was optimized for light response curves [57].

2.4. Light Response Curves
      Light response curves were fitted based on the non-rectangular hyperbola model ([58]; Equation (1)):
                                                    q
                                      αI + Pmax −       (αI + Pmax )2 − 4IαθPmax
                         Pn ( I ) =                                              − Rd                       (1)
                                                            2θ

with Pn (I) (µmol CO2 m−2 s−1 ) the net photosynthetic rate, I the light intensity (µmol PAR m−2 s−1 ),
α the initial quantum efficiency (µmol CO2 (µmol PAR)−1 ), Pmax the maximum gross photosynthetic
rate (µmol CO2 m−2 s−1 ), Rd the dark respiration rate (µmol CO2 m−2 s−1 ), and θ the dimensionless
or sharpness parameter fixed to a value of 0.5 (e.g., [51,59]). Maximum net photosynthetic rate (Pn,max )
was calculated by subtracting Rd from Pmax .
      In addition, the light compensation point (Ic ) (Equation (2); Fang et al. [58]) and the light saturation
point (Ls ) at 70% Pn,max (δ = Pn /Pn,max = 0.7) (Equation (3); Wang et al. [49]) were calculated for each
measurement day:
                                             R ( Pn,max + Rd (1 − θ ))
                                      Ic = d                                                                 (2)
                                                       αPn,max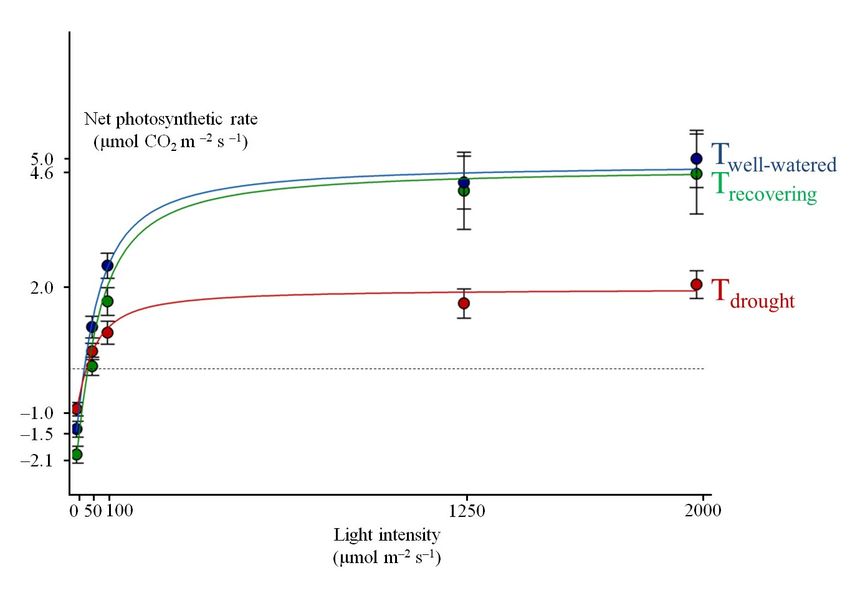
Forests 2018, 9, 109                                                                              4 of 15

                                                            δ−θ

                                              δPn,max
                                       Ls =                     + θ (1 + δ )       + Ic              (3)
                                                α           1−δ

2.5.   11 CO       Leaf Labeling and Positron Autoradiography
               2

      Three reference M. eminii trees were taken to INFINITY (INnovative Flemish IN vivo Imaging
TechnologY), the pre-clinical imaging lab of Ghent University, Belgium, to carry out 11 C-labeling and
autoradiography. To avoid disturbance effects caused by transport [55], trees were transported one
day before the measurements. A preliminary experiment was performed to assess if tracer transport
from leaves to branches still occurred after branch excision. The amount of tracer observed in the
branch was similar when comparing cut and uncut branches, and also tracer distribution displayed
similar patterns. Two labeling experiments were performed on uncut branches and one on a cut
branch. For the latter experiment, a primary branch (~50 cm in length, with 3–5 side-branches) was cut
under water to avoid cavitation, shortly before labeling, and was kept in a sealed container with water.
In all experiments, the distal end of one of the side-branches (~40 cm in length) was inserted into an
air-tight custom-made transparent cylindrical cuvette (20 cm length and 15 cm diameter). A series
of red and blue light emitting diodes (LEDs) were positioned inside the cuvette to supply 250 µmol
PAR m−2 s−1 to stimulate photosynthesis. Leaves of the primary branch that remained outside the
cuvette were irradiated with a similar PAR intensity. The cuvette was tubed (inner diameter 4.0 mm
and outer diameter 5.6 mm) to a LI-6400 (LiCor Biosciences, Lincoln, NE, USA), which provided an
inflow (±0.8 L min−1 ) with constant humidity and 400 ppm CO2 concentration, and the outflow was
directed to a container with KOH base to trap all 11 CO2 exiting the cuvette. The set-up was checked
for leakages by ensuring an equal in- and outflow rate. Additionally, the cuvette had a thin inlet tube
(inner diameter 0.9 mm and outer diameter 1.5 mm) for administering radioactive 11 CO2 isotope tracer
gas, with a half-life of 20.4 min. About 370 MBq initial label activity was transferred into the leaf
cuvette. During injection, no air flow was present and the leaves were exposed to the tracer for 10 min.
Thereafter, air flow was switched on again to remove all 11 CO2 from the air surrounding the leaves.
The leaves were left in the cuvette for an additional hour before excision and autoradiograph imaging.
      11 C is an unstable carbon isotope that will emit positrons upon decay. These positrons travel a

small distance (on average 1.1 mm, with a maximum of 4 mm, in aqueous medium and much more in
air) before colliding with an electron and annihilating into two antiparallel high-energy gamma-rays.
Distribution of labeled carbon was imaged by exposing the distal branch part to a multi-sensitive
imaging phosphor plate (Perkin Elmer, Waltham, MA, USA), which in case of 11 C is mainly sensitive
to the emitted positrons. The phosphor plate was positioned on top of the adaxial side of the leaves.
Because of the short half-life time of the carbon isotope, fresh samples were used, which implies
that we needed to take into account additional factors. Tissue thickness through which positrons
must travel can strongly influence their probability of annihilation, which may prevent them of being
detected by the autoradiographic plate [60,61]. For autoradiographs, the positron needs to “escape”
the leaf in order to be measured by the phosphor screen. The plate was digitally scanned after 10 min
exposure using a Cyclone Plus Phosphor imager (Perkin Elmer, Waltham, MA, USA) and OptiQuant
software (Perkin Elmer, Waltham, MA, USA). These images were further processed with Fiji, an image
processing software [62].

2.6. Stable δ 13 C Isotope Analysis
     To determine M. eminii’s metabolic pathway for carbon fixation, natural abundance of the stable
carbon isotope 13 C was measured on a sample of thirty randomly selected old and young Twell-watered
leaves. These were pre-weighed and oven-dried at 80 ◦ C for five days until constant dry mass was
achieved as in [63]. Thereafter, they were ground to fine powder using a ball mill (ZM200, Retsch,
Haan, Germany). δ 13 C was determined using an Elemental Analyzer (ANCA-SL, SerCon, Crewe,
UK) coupled to an Isotope Ratio Mass Spectrometer (20–20, SerCon, Crewe, UK) (EA-IRMS). Baking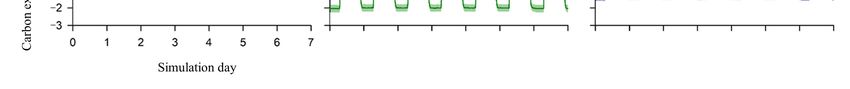
Forests 2018, 9, 109                                                                                     5 of 15

flour with a δ 13 C value of −27.01h (certified by IsoAnalytical, Crewe, UK) was used as a laboratory
reference, and all δ 13 C are expressed relative to Vienna Pee Dee Belemnite (VPDB).

2.7. Vein Anatomy
     Because annihilation probabilities of positrons originating from 11 C can be strongly influenced
by the amount of overlying tissues, anatomical cross-sections of major veins of the phenologically
oldest autoradiographically imaged leaf were analysed. Stored leaf segments, excised in such a way
that sections perpendicular to the veins of the first, secondary and tertiary order could be made, were
therefore rehydrated overnight in 1% (v/v) Aerosol OT (Cytec) and 25% (v/v) methanol. After rinsing
in demineralised water, samples were embedded in 7% (w/v) agarose (Sigma Aldrich, St. Louis,
MO, USA). Blocks of agarose containing leaf segments were glued onto the vibratome stage using
superglue (Roticoll, Carl Roth). 40 µm thick sections, prepared with a vibrating microtome (HM 650 V,
ThermoScientific, Waldorf, Germany), were stained with 0.5% w/v astra blue, 0.5% w/v chrysoidine
and 0.5% w/v acridine red and mounted in Euparal after dehydration in isopropyl alcohol. Slides
were observed with a Nikon Ni-U microscope (Nikon, Tokyo, Japan) and images were recorded using
a Nikon DS-Fi1c camera (Nikon, Tokyo, Japan). Length measurements were performed with Fiji [62]
on the cross-section.

2.8. Data Analysis and Statistics
      For each set of measurement points a light response curve was fitted according to the non-rectangular
hyperbola model. The R2 was determined to assess the correspondence between measured and modeled
data points, and modeled curves with a R2 < 0.9 were not retained for further analysis. This resulted in at
least ten light response curves per measurement day used in the analysis. Parameter values were estimated
for each individual light response curve and averaged per measurement day. After testing homogeneity
of variances (Levene’s test, p > 0.05), a one-way ANOVA (analysis of variance) was performed, followed
by the Tukey’s HSD (honest significant difference) post-hoc multiple comparison test, used to analyze
significance levels for differences between the three measurement days. For all statistical tests performed,
the significance level (P) was set at 5%. Results in text are noted as average ± standard error.

3. Results

3.1. M. eminii’s Photosynthetic Performance
      Under drought, measured P2000 was 2.0 ± 0.3 µmol m−2 s−1 (N = 10), which more than doubled to
5.0 ± 0.7 µmol m−2 s−1 (N = 10) under reference conditions (Twell-watered ) (Figure 1; Table 1). Measured
averaged P2000 and Rd were both lowest during drought (Tdrought ) (Table 1). In general, relatively
large variation was observed between individuals, which reduced the likelihood of measurement
differences. Drought Pn,max significantly differed from Pn,max after re-watering, and Pn,max obtained
under reference conditions (Tdrought < Trecovering ≈ Twell-watered ; Tdrought − Trecovering (p < 0.05), Tdrought
− Twell-watered (p < 0.05), Trecovering − Twell-watered (p > 0.05)). Rd values only significantly differed
between drought and three weeks after rewatering (Tdrought − Trecovering (p < 0.001), Tdrought −
Twell-watered (p > 0.05), Trecovering − Twell-watered (p > 0.05)). Initial quantum efficiency (α) reduced under
drought (Tdrought − Trecovering (p < 0.05), Tdrought − Twell-watered (p < 0.05), Trecovering − Twell-watered
(p > 0.05)). Other photosynthetic parameters were not significantly affected by drought. Overall,
measured light response curves retained for analysis showed close agreement with their corresponding
individually fitted non-rectangular hyperbola model (average value of R2 per fitted curve: Tdrought ;
R2 = 0.964, Trecovering ; R2 = 0.990, Twell-watered ; R2 = 0.992). Measured leaves of Tdrought and Trecovering
initially survived the drought treatment, while part of the total leaf mass was shed as immediate
response to drought. All leaves that initially survived drought were ultimately shed by the time
Twell-watered measurements were carried out. These Twell-watered measurements were performed on
newly sprouted leaves, fully mature at the time of measurement.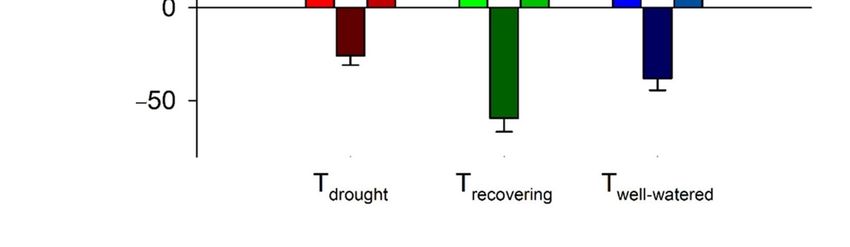
Forests 2018,
Forests 2018,9,9,x109
FOR PEER REVIEW 66 of
of 15
15
Figure 1. Measured leaf light response curves per potted Maesopsis eminii Engl. were individually
Figure 1. Measured leaf light response curves per potted Maesopsis eminii Engl. were individually run
run in the non-rectangular hyperbola model [58] to obtain average model parameters from which
in the non-rectangular hyperbola model [58] to obtain average model parameters from which an
an average light response curve per measurement day was developed. Net photosynthesis
average light response curve per measurement day was developed. Net photosynthesis (Pn, µmol CO2
(Pn , µmol CO2 m−2 s−1 ) increases with increasing light intensity (I, µmol m−2 s−1 ). Tdrought (after
m−2 s−1) increases with increasing light intensity (I, µmol m−2 s−1). Tdrought (after 2 weeks of drought),
2 weeks of drought), Trecovering and Twell-watered (respectively, 3 and 16 weeks after rewatering) are
Trecovering and Twell-watered (respectively, 3 and 16 weeks after rewatering) are depicted in red, green and
depicted in red, green and blue, respectively. Points were obtained by averaging all measurement
blue, respectively. Points were obtained by averaging all measurement points of the same
points of the same measurement day exposed to the same amount of light. Error bars are standard
measurement day exposed
error of the average to theNsame
values (with = 10,amount
12, andof
10light. Error bars
for Tdrought are standard
, Trecovering error of
, Twell-watered the average
, respectively).
values (with N = 10, 12, and 10 for Tdrought, Trecovering, Twell-watered, respectively).
Table 1. Averages of measured and modeled light response curve values per measurement day with
Table 1. Averages
standard of measured
errors based on N lightand modeled
response light
curves responsemeasured
depicting curve values per measurement
net photosynthetic rate day
P2000with
at a
standard errors based on N light
− 2 response
− 1 curves depicting measured net photosynthetic
light intensity of 2000 µmol m s and dark respiration rate Rd values, in addition to non-rectangular rate P2000 at
ahyperbolic
light intensity
modelof 2000 µmol
predicted valuesm−2of sP2000
−1 and dark respiration rate Rd values, in addition to non-
, Rd , maximum net photosynthetic rates Pn , photosynthetic
rectangular
efficiency orhyperbolic model
slope (α), light predicted
saturation values
point of Pcompensation
Ls , light 2000, Rd, maximum net photosynthetic rates Pn,
point Ic , and R2 values describing
photosynthetic efficiency or slope (α), light saturation point L s, light compensation point Ic, and R2
the correlation coefficient between measured points and their individually fitted light response curves.
values
Lettersdescribing the denote
in superscript correlation coefficient
significantly between
differing measured
values based points and their
on a p-value individually fitted
of 0.05.
light response curves. Letters in superscript denote significantly differing values based on a p-value
of 0.05. Measured Values Non-Rectangular Hyperbola Model Predicted Values
Measurement Ls at 70%
N P2000 Values Rd
Measured P2000 Rd
Non-Rectangular PHyperbola
n,max Modelα Predicted Values Ic R2
Day Pn,max
Measurement µmolαCO2 Ls at 70% − 2 − 1
N Pµmol
2000 CO2 m−R
2 ds− 1 P2000 µmol CORd2 m− 2 s− 1 Pn,max µmol PAR m s Ic R2
Day (µmol PAR)− 1 Pn,max
Tdrought 10 1.9 ± 0.4 a −2 s±
a 1.8 ± 0.3 a a
1.0 ± 0.2−2 −1 1.9 ± 0.3 a µmol CO
0.042 ± 0.008 a 80 ± 20 ±−113
µmol CO2 m1.0 −1 0.1 µmol PAR m50 0.964
2
µmol CO2 m s −2 s
b b (µmol PAR)−1
Trecovering 12 4.0 ± 0.9 2.0 ± 0.2 4.5 ± 1.0 b 2.1 ± 0.2 b 4.8 ± 1.0 b 0.069 ± 0.005 b 71 ± 14 33 ± 6 0.990
Tdrought 10 1.9 ± 0.4 a b 1.0 ± 0.1 a a,b 1.8 ± 0.3 a b 1.0 ± 0.2 a a,b 1.9 ± 0.3 a b 0.042 ± 0.008 a 80 ± 20 50 ± 13 0.964
Twell-watered 10 4.9 ± 0.6 1.4 ± 0.2 4.8 ± 0.7 1.5 ± 0.2 4.9 ± 0.7 0.074 ± 0.009 b 27 ± 7 27 ± 7 0.992
Trecovering 12 4.0 ± 0.9 b 2.0 ± 0.2 b 4.5 ± 1.0 b 2.1 ± 0.2 b 4.8 ± 1.0 b 0.069 ± 0.005 b 71 ± 14 33 ± 6 0.990
Twell-watered 10 4.9 ± 0.6 b 1.4 ± 0.2 a,b 4.8 ± 0.7 b 1.5 ± 0.2 a,b 4.9 ± 0.7 b 0.074 ± 0.009 b 27 ± 7 27 ± 7 0.992
3.2. Estimated Diel Carbon Fluxes and Leaf Carbon Balances
3.2. Estimated Diel Carbon Fluxes and Leaf Carbon Balances
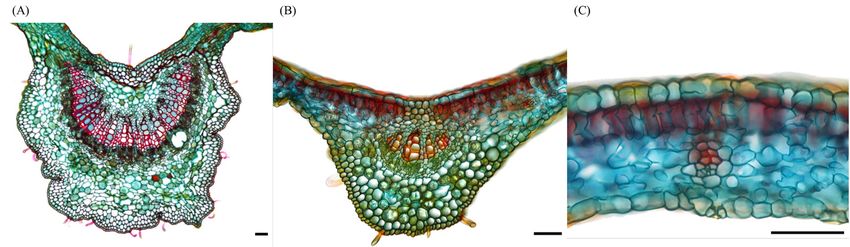
Differences in diel carbon fluxes between drought, recovery and well-watered conditions were
assessed by simulating
Differences the corresponding
in diel carbon fluxes betweenphotosynthetic rates for
drought, recovery anda well-watered
7-day reference period (using
conditions were
PAR-values
assessed of a sunny the
by simulating week from 7 till 13photosynthetic
corresponding June 2015 as input
rates in
forthe corresponding
a 7-day reference light response
period (using
curves fitted of
PAR-values with the non-rectangular
a sunny week from 7 hyperbolic
till 13 Junemodel)
2015 as(Figure
input 2). Simulated
in the courses were
corresponding lightintegrated
response
to obtain
curves day-with
fitted and nighttime as well as total
the non-rectangular carbon exchange
hyperbolic rates (Figure
model) (Figure 3). Albeit
2). Simulated a simplified
courses were
approach because
integrated to obtainfluxes
day- are
andprojected
nighttimefrom specific
as well lightcarbon
as total response curvesrates
exchange instead of continuously
(Figure 3). Albeit a
simplified approach because fluxes are projected from specific light response curves instead ofForests 2018,
Forests 2018,9,9,x109
FOR PEER REVIEW 77 of
of 15
15
Forests 2018, 9, x FOR PEER REVIEW 7 of 15
continuously measured, it can give a rough estimation of how drought and recovery affect the
continuously
measured, it can measured, it can estimation
give a rough give a rough estimation
of how droughtofand how drought
recovery and the
affect recovery
potential affect the
carbon
potential carbon assimilation of leaves. For each water status (i.e., drought, recovery, well-watered),
potential carbonleaves.
assimilation assimilation of leaves.
water For each water status recovery,
(i.e., drought, recovery, well-watered),
positive dailyofcarbon For each
exchange values status (i.e.,
were calculated drought, well-watered),
(Figure 3). Significant positive daily
differences existed
positive daily
carbon exchange carbon
values exchange values
were calculated were calculated
(Figureand3). when
Significant(Figure 3). Significant between dailyexisted
differences
between daily carbon exchange after drought fully differences
recovered (T existed carbon
drought − Twell-watered, p < 0.05).
between
exchange daily
after carbon
drought exchange
and when after drought
fully recoveredand(T when fully − Trecovered (T , pdrought − Twell-watered, p < 0.05).
< 0.05). Daily assimilation
Daily assimilation differed between Tdrought − Trecovering drought
(p < 0.05),well-watered
and Tdrought − Twell-watered (p < 0.05) and
Daily assimilation
differed between differed−
T between
T Tdrought
(pForests 2018, 9, 109 8 of 15
Forests 2018, 9, x FOR PEER REVIEW 8 of 15
3.3. 11 Autoradiographs and 13
13 Stable Isotope
3.3. 11CC Autoradiographs and CCStable Isotope
Autoradiographs displayed a high correspondence with venation (Figure 4). In younger leaves,
the signal is nearly
nearly equally
equally distributed
distributed across the leaf blade, whereas in the older
older leaves
leaves the
the signal
signal
accumulated more around the primary and secondary veins. Tracer detection in the veins was was lower,
lower,
which
which may
may be be attributed
attributed to
to aa higher
higher amount
amount of
of annihilations
annihilations taking place in the thicker
thicker layer of
of
overlying tissues present in the major veins.
tissues present in the major veins.
Figure 4.
Figure 4. Positron
Positron autoradiographs
autoradiographs of of Maesopsis
Maesopsis eminii
eminii leaves
leaves from
from the
the distal end of
distal end of aa secondary
secondary
branch arranged
branch arranged from
fromyounger
youngertotoolder
older(left toto
(left right)
right)leaves, showing
leaves, showing thethe
distribution of 11of
distribution C, 11
1h C,after
1h
11CO211was administered to an excised branch. The adaxial side of the leaves was exposed to the
after CO2 was administered to an excised branch. The adaxial side of the leaves was exposed to
phosphor
the plate.
phosphor Brighter
plate. regions
Brighter regions reflect
reflect higher11C
higher accumulation.
11 C accumulation.Younger
Youngerleaves
leaves have
have aa uniform
uniform
blade, while
carbon distribution across the leaf blade, while older
older leaves
leaves show aa higher
higher accumulation
accumulation around the the
primary and
primary andsecondary
secondaryveins.
veins.Some
Someleaves
leavesshow
showlarger
largerareas
areasthat
that are
are less
less bright,
bright, which
which is attributed
is attributed to
to shading
shading of these
of these areas
areas by by other
other leaves.
leaves.
M. eminii’s stable carbon isotope signature (δ 13C) was −27.8 ± 0.2 ‰ (N = 20), pointing to C3-
M. eminii’s stable carbon isotope signature (δ 13 C) was −27.8 ± 0.2h (N = 20), pointing to
metabolism [64].
C3 -metabolism [64].
3.4. Anatomy
3.4. Anatomy of
of the
the Main,
Main, Secondary
Secondary and
and Tertiary
Tertiary Veins
Veins
Vascularbundles
Vascular bundlesofof the
the main
main andand secondary
secondary veinsveins
werewere located
located aboveabove
halfway halfway
the leafthe leaf cross-
cross-section,
section, whereas in tertiary veins these were found below halfway the
whereas in tertiary veins these were found below halfway the section (Figure 5). Secondary veins section (Figure 5). Secondary
veins showed
showed a layer of a parenchymatic
layer of parenchymatic
cells beneath cellsthebeneath
vascularthe vascular
bundle, bundle,
whereas whereas
an entire an entire
parenchymatic
parenchymatic bundle sheath was observed around tertiary veins. These
bundle sheath was observed around tertiary veins. These parenchyma cells did not contain chloroplasts. parenchyma cells did not
contain
Leaf chloroplasts.
thickness Leaf thickness
was measured to assesswas measured
the effect to assess
of increased the effectofofannihilation
probability increased probability
when moving of
annihilation when moving from smaller to larger veins. Distances were
from smaller to larger veins. Distances were measured between points in the vascular bundle and the measured between points in
the vascular bundle and the adaxial side of the leaf (i.e., the side that was exposed
adaxial side of the leaf (i.e., the side that was exposed to the phosphor plate) to derive average distances to the phosphor
plate)
that to derive
positrons hadaverage distances
to travel that positrons
before reaching had to travel
the phosphor plate.before
These reaching
distancesthe phosphor
were 206 ± 23plate.
µm,
These distances were 206 ± 23 µm, 88.0 ± 5.4 µm, and 67.41 ± 0.92 µm (N
88.0 ± 5.4 µm, and 67.41 ± 0.92 µm (N = 8 each) for the main, secondary and tertiary vein, respectively. = 8 each) for the main,
secondary
Leaf and was
thickness tertiary vein, respectively.
on average 123 ± 14 µm Leaf (Nthickness
= 12). Forwas theon average 123
mesophyll it is±uncertain
14 µm (N where= 12). For the
in the
mesophyll
leaf 11 C wouldit is be
uncertain where in
mainly found. the leaf most
Probably,
11 C would be mainly
is found found. Probably, most
in the photosynthetically activeispalisade
found incells
the
photosynthetically active palisade cells close to the adaxial side. Average
close to the adaxial side. Average distance between palisade cells and the adaxial edge of the leaf was distance between palisade
cells±and
28.0 2.4 the
µm adaxial
(N = 8). edge
Whenofassuming
the leaf was 28.0 ±to2.4
11 C tracer beµm (N = 8).in
positioned When assuming
the palisade
11C tracer to be
tissue when in the
mesophyll, and in the vascular bundle when in the veins, the reduction in positron escape andinthus
positioned in the palisade tissue when in the mesophyll, and in the vascular bundle when the
veins, the reduction in positron escape and thus detected signal can be calculated,
detected signal can be calculated, according to [36]. Following this approach, a reduction in detected according to [36].
Following
signal of 3%,this4%approach,
and 12% awas reduction
calculatedin detected
for tertiary,signal of 3%, 4%
secondary andand 12% was
primary calculated
veins, for tertiary,
respectively. These
secondary and primary veins, respectively. These corrections should be used
corrections should be used indicatively, but when applied, resulted in similar intensities in the major indicatively, but when
applied, resulted in similar intensities
veins and in the adjacent tissue (Figure 4). in the major veins and in the adjacent tissue (Figure 4).Forests 2018, 9, 109 9 of 15
Forests 2018, 9, x FOR PEER REVIEW 9 of 15
Figure 5. Anatomical cross-section of (A) the major vein; (B) a secondary vein and (C) a tertiary vein
Figure 5. Anatomical cross-section of (A) the major vein; (B) a secondary vein and (C) a tertiary vein
from the oldest autoradiographically imaged leaf in Figure 4. A parenchymatic layer is visible under
from the oldest autoradiographically imaged leaf in Figure 4. A parenchymatic layer is visible under
the vascular bundle of the secondary vein and a parenchymatic sheath around the tertiary vein.
the vascular bundle of the secondary vein and a parenchymatic sheath around the tertiary vein. Images
Images were used to determine the distance between the phloem in the vascular bundle and the
were used to determine the distance between the phloem in the vascular bundle and the adaxial side of
adaxial side of the leaf (top of the image), which was exposed to the phosphor screen for
the leaf (top of the image), which was exposed to the phosphor screen for autoradiography. Scale bar is
autoradiography. Scale bar is 50 µm.
50 µm.
4. Discussion
4. Discussion
As expected, drought lowered M. eminii’s average reference Pn,max (by 60%, Figure 1; Table 1).
As expected, drought lowered M. eminii’s average reference Pn,max (by 60%, Figure 1; Table 1).
Koller et al. [65] reported a similar reduction in photosynthesis of about 60% after three weeks of
Koller et al. [65] reported a similar reduction in photosynthesis of about 60% after three weeks
withholding water in three evergreen Quercus spp. comparable in height with our study trees. Varone
of withholding water in three evergreen Quercus spp. comparable in height with our study trees.
et al. [66] investigated several Mediterranean species and observed a photosynthetic reduction of 50%
Varone et al. [66] investigated several Mediterranean species and observed a photosynthetic reduction
in less than a week after imposing drought. This reduction in photosynthesis is usually linked with
of 50% in less than a week after imposing drought. This reduction in photosynthesis is usually linked
stomatal closure in response to a depleting soil water status (e.g., [29,30,65,67–70]).
with stomatal closure in response to a depleting soil water status (e.g., [29,30,65,67–70]).
Three weeks into re-watering (Trecovering) M. eminii reached Pn,max values similar to those of the
Three weeks into re-watering (Trecovering ) M. eminii reached Pn,max values similar to those of the
well-watered reference period (Twell-watered ), but Rd was considerably higher, indicating a metabolic
well-watered reference period (T ), but Rd was considerably higher, indicating a metabolic
cost for recovery (Figure 1, Table well-watered
1). The high Rd values measured after three weeks of recovery can
cost for recovery (Figure 1, Table 1). The high Rd values measured after three weeks of recovery
be attributed to a biphasic response, which occurs in some species [30]. During drought, Pn,max
can be attributed to a biphasic response, which occurs in some species [30]. During drought, Pn,max
decreased, accompanied by a decrease in Rd, as is observed in many species. After rewatering, leaves
decreased, accompanied by a decrease in Rd , as is observed in many species. After rewatering, leaves
needed to recover from the negative drought-induced effects. This increased the energy demand for
needed to recover from the negative drought-induced effects. This increased the energy demand for
maintenance and repair, resulting in higher respiration rates [29,30]. Higher respirational rates can
maintenance and repair, resulting in higher respiration rates [29,30]. Higher respirational rates can also
also indicate higher vulnerability to drought as was observed by Peguero-Pina et al. [71] in
indicate higher vulnerability to drought as was observed by Peguero-Pina et al. [71] in Mediterranean
Mediterranean oaks. In their study, Quercus suber L. showed higher respirational rates than Q.
oaks. In their study, Quercus suber L. showed higher respirational rates than Q. coccifera L. and Q. ilex
coccifera L. and Q. ilex ssp. ballota (Desf.) Samp under intense drought, with data suggesting that Q.
ssp. ballota (Desf.) Samp under intense drought, with data suggesting that Q. suber was less able to
suber was less able to withstand highly xeric conditions. M. eminii leaves showed higher respirational
withstand highly xeric conditions. M. eminii leaves showed higher respirational rates during drought
rates during drought recovery, but in the long run all leaves that had experienced drought were shed,
recovery, but in the long run all leaves that had experienced drought were shed, indicating that these
indicating that these leaves were susceptible to drought. Resprouting of new leaf material occurred
leaves were susceptible to drought. Resprouting of new leaf material occurred shortly after rewatering,
shortly after rewatering, which might be a more efficient strategy: trading drought-stressed leaves
which might be a more efficient strategy: trading drought-stressed leaves with high respirational
with high respirational demands (Rd in Trecovering) through leaf shedding, for new leaves with lower
demands (R in Trecovering ) through leaf shedding, for new leaves with lower respirational demands
respirationalddemands (Rd in Twell-watered). The ecological significance of drought-deciduousness or
(Rd in Twell-watered ). The ecological significance of drought-deciduousness or evergreenness strongly
evergreenness strongly depends on the prevailing climate, with climate change being expected to
depends on the prevailing climate, with climate change being expected to induce a shift towards
induce a shift towards drought-deciduous communities [41].
drought-deciduous communities [41].
Measurements of photosynthetic rates in pioneers typically yield high Pn,max values under well-
Measurements of photosynthetic rates in pioneers typically yield high P values under
watered conditions. Despite its pioneering trait, M. eminii showed relatively lown,max Pn,max values (5.0 ±
well-watered conditions. Despite its pioneering trait, M. eminii showed relatively low Pn,max values
0.7 µmol m−2 s−1: Figure− 2 1,
− 1Table 1). Earlier greenhouse studies on tropical pioneer species reported
(5.0 ± 0.7 µmol m s : Figure 1, Table 1). Earlier greenhouse studies on tropical pioneer
typical Pn,max values of 10 µmol m−2 s−1 and higher, which is substantially higher than M. eminii’s Pn,max
species reported typical Pn,max values of 10 µmol m−2 s−1 and higher, which is substantially higher
(e.g., [72–74]). Also field measurements of Pn,max in tropical pioneers are typically higher than M.
than M. eminii’s Pn,max (e.g., [72–74]). Also field measurements of Pn,max in tropical pioneers are
eminii’s values. In their photosynthetic study on several tree species in the Cameroonian rainforest,
typically higher than M. eminii’s values. In their photosynthetic study on several tree species in
Meir et al. [75] found pioneers to have Pn,max values within the range 6–13 µmol CO2 m−2 s−1. An older
the Cameroonian rainforest, Meir et al. [75] found pioneers to have Pn,max values within−2the−1range
study in a Nigerian rainforest reported photosynthetic rates of about 5–7 µmol CO2 m s , and
6–13 µmol CO2 m−2 s−1 . An older study in a Nigerian rainforest reported photosynthetic rates of
although measured at lower PAR-levels (around 800 µmol m−2 s−1), this study indicates that other
tropical pioneer species also may show low Pn values [76]. In Panama, Ellis et al. [77] conducted aForests 2018, 9, 109 10 of 15
about 5–7 µmol CO2 m−2 s−1 , and although measured at lower PAR-levels (around 800 µmol m−2 s−1 ),
this study indicates that other tropical pioneer species also may show low Pn values [76]. In Panama,
Ellis et al. [77] conducted a study on a variety of tropical trees to conclude that pioneer species had
significantly higher Pn,max values compared to non-pioneer species with an average Pn,max of 16
µmol CO2 m−2 s−1 . Another study conducted by Domingues et al. [78] in an African savanna and
semi-deciduous dry forest reported values higher than 7 µmol CO2 m−2 s−1 . Despite its relatively
low Pn and high Rd rates, M. eminii was simulated to be a carbon sink during all conditions (Figures 2
and 3).
Current vegetation models typically use photosynthesis as a determinant for plant growth [22]. Our
results suggest a potential mismatch between leaf photosynthetic rates and the pioneering, fast-growing
behavior of M. eminii. Fatichi et al. [22] discussed possible elements causing the decoupling between
photosynthesis and growth rates, including the effects of nutrient availability, meristematic processes,
the role of carbon reserves (accumulation and depletion of non-structural carbon pools) or the multiple
impacts of water on many physiological processes [38]. Not only source activity determines plant
growth, but entire source-sink relationships need to be considered [22]. M. eminii’s behavior during
dry conditions in terms of substantial stem water storage and buffered water potentials might explain
its ability to sustain high growth rate despite the measured low photosynthetic rates [42].
As a woody tree species, M. eminii was found to be C3 (−27.8 ± 0.2h) in nature, with C3 plants
having a δ 13 C range of −21 to −35h, and C4 from −9 to −20h [64]. Pulse-labeling experiments with
both 11 CO2 and 14 CO2 on leaves have been performed in the past, but mainly focused on quantification
of the continuous export of label out of the leaf. In this study, we focused on imaging tracer distribution
inside the leaf, relatively shortly after labeling (one hour) [79–81]. 11 CO2 pulse-labeling performed by
Jahnke et al. [80] on young Fraxinus excelsior L. and Sorbus aucuparia L. trees showed a continuous and
constant export of carbon tracer out of the leaves for at least two hours. Based on these observations,
it was assumed that M. eminii exports carbon at a constant rate between the time of pulse-labeling
and imaging. Under such steady-state conditions, autoradiographic carbon patterns display carbon
distribution inside the leaf. Commonly, trees use a passive loading strategy, characterized by a higher
concentration of sugars in the mesophyll and a lower concentration in the veins (e.g., [32,40,82,83]).
Previous 14 C labeling experiments have evaluated loading strategies of species and reported that active
loaders showed higher tracer accumulation in the veins and passive loaders in the mesophyll [32,82,83].
In older leaves of M. eminii, tracer intensity was elevated near the main and secondary veins, whereas
in active loaders a higher presence of tracer is expected inside the veins. With our approach of using
fresh leaf material and 11 C, quantification of tracer activity is complicated by the difference in thickness
between main and secondary veins in comparison to mesophyll, and potential differences in water
content. The layers overlying the major veins reduce the amount of detected tracer signal (Figure 5),
explaining why major veins are less bright on the autoradiographs. After tissue thickness correction,
the same tracer accumulation was observed as in the brighter adjacent tissue (Figure 4). A distinct
difference in tracer amount was found in the mesophyll with an accumulation pattern directed towards
the major veins. According to studies by Rennie and Turgeon [82] and Fu et al. [83] this indicates an
active loading strategy. Alternatively, this distribution pattern could be due to rapid export of tracer
out of the mesophyll, with most of the tracer already within the major veins after pulse-labeling, which
still indicates active loading. 14 CO2 autoradiographs of Nicotiana tabacum L., an active loader with high
export rates, also showed elevated tracer amounts in the major veins, with a lower evenly distributed
amount of tracer in the mesophyll, measured one hour after labeling [84]. The active phloem loading
strategy has been linked to (i) an increased carbon export from leaves to sinks (e.g., shoots and
roots) [32,40,85]; (ii) an improved efficiency of sugar transport [58]; and (iii) an increased growth
potential [40]. Active transport is less common in woody tree species, but not unique [83]. Turgeon [40]
investigated why active loading is commonly found in herbaceous species, and passive loading in tree
species. He concluded that continuous investment in growth by herbaceous species favored active
loading while passive loading is more favorable for trees that require investment in storage inventoriesForests 2018, 9, 109 11 of 15
used during leafless periods (e.g., in winter) and growth flushes. M. eminii, like many tropical species,
is only deciduous in response to drought [86], which is also a common trait for herbaceous species.
According to Turgeon [40], the lower leaf carbon inventory of active loaders has a significant effect on
the plant’s growth potential, which might explain M. eminii’s low photosynthetic rate but rapid growth.
As in the tropics most trees are drought-deciduous or evergreen, more research on how tropical tree
species load carbohydrates into the phloem is warranted. Large studies investigating phloem loading
strategies show that available data on tropical species is limited [79,80,83]. Younger leaves in our
study showed a relatively uniform tracer distribution throughout the mesophyll (Figure 4). Since
thickness effect on positron annihilation probability can be ignored in thin objects, such as young
leaves with thin veins, their distribution pattern might indicate passive sugar loading into the phloem,
or import of tracer from the older leaves, because young leaves are often net carbon importers, rather
than exporters [70].
5. Conclusions
M. eminii is a pioneer with fast growth, expected to show a high photosynthetic rate, but this was
not confirmed by our measurements. The mismatch between photosynthesis and growth indicated
that M. eminii might use other features to obtain fast growth. 11 C-autoradiographic tracer patterns
in mature leaves suggested an active phloem loading strategy, which can be related to fast growth.
This study hence illustrated that, besides photosynthesis, photoassimilate distribution and phloem
loading may be important in the assessment of leaf and tree carbon balances. This has been previously
acknowledged by Fatichi et al. [22], and highlights the need for more measurements, which will pave
the way for a better understanding of the ecophysiology of tropical trees. This is necessary if we aspire
to predict how tropical trees and forests will cope with climatic changes and how this will feedback to
global carbon and water cycling (e.g., [38,82,83,87,88]).
Acknowledgments: We would like to thank Olivier Leroux, for his skillful work on the anatomical cross-sections.
Sincere gratitude also goes to Christian Vanhove, Benedicte Descamps, Jan Courtyn, Boudewijn Brans and
Jens Mincke for assisting with the 11 C labeling and autoradiographs, and to Stefan Vidts, Geert Favyts, Ingvar
Bauweraerts, Jonas Coussement and Thomas Van De Putte for their help during the greenhouse measurements.
A special thanks goes to Michael Thorpe for providing useful insights into 11 C autoradiography, which helped in
putting the results into a good perspective. Comments from three reviewers further improved the quality of the
manuscript. Funding: Flemish Interuniversity Council/VLIR-OUS (ICP Ph.D. 2012-001 granted to J.E.), Research
Foundation—Flanders (FWO) (G.0319.13N granted to K.S.) and Flanders Innovation & Entrepreneurship (141660
granted to M.H.).
Author Contributions: K.S. conceptualized the experimental setups, and assisted in data interpretation and
writing of the manuscript. J.E. and M.H. carried out the experiments, analyzed, interpreted the data, and wrote
the manuscript. All authors critically revised the manuscript and approve the final version to be published.
Conflicts of Interest: The authors declare no conflict of interest.
References
1. IPCC. Summary for Policymakers. In Climate Change 2013: The Physical Science Basis. Contribution of
Working Group I to the Fifth Assessment Report of the Intergovernmental Panel on Climate Change; Stocker, T.F.,
Qin, D., Plattner, G.-K., Tignor, M., Allen, S.K., Boschung, J., Nauels, A., Xia, Y., Bex, V., Midgley, P.M., Eds.;
Cambridge University Press: Cambridge, UK; New York, NY, USA, 2013; pp. 3–29.
2. Fauset, S.; Baker, T.R.; Lewis, S.L.; Feldpausch, T.R.; Affum-Baffoe, K.; Foli, E.G.; Hamer, K.C.; Swaine, M.D.
Drought-induced shifts in the floristic and functional composition of tropical forests in Ghana. Ecol. Lett.
2012, 15, 1120–1129. [CrossRef] [PubMed]
3. Asefi-Najafabady, S.; Saatchi, S. Response of African humid tropical forests to recent rainfall anomalies.
Philos. Trans. R. Soc. B 2013, 368, 20120306. [CrossRef] [PubMed]
4. James, R.; Washington, R.; Rowell, D.P. Implications of global warming for the climate of african rainforests.
Philos. Trans. R. Soc. B 2013, 368, 20120298. [CrossRef] [PubMed]
5. Malhi, Y.; Adu-Bredu, S.; Asare, R.A.; Lewis, S.L.; Mayaux, P. African rainforests: Past, present and future.
Philos. Trans. R. Soc. B 2013, 368, 20120312. [CrossRef] [PubMed]Forests 2018, 9, 109 12 of 15
6. Oslisly, R.; White, L.; Bentaleb, I.; Favier, C.; Fontugne, M.; Gillet, J.-F.; Sebag, D. Climatic and cultural
changes in the west congo basin forests over the past 5000 years. Philos. Trans. R. Soc. B 2013, 368, 20120304.
[CrossRef] [PubMed]
7. Otto, F.E.; Jones, R.G.; Halladay, K.; Allen, M.R. Attribution of changes in precipitation patterns in African
rainforests. Philos. Trans. R. Soc. B 2013, 368, 20120299. [CrossRef] [PubMed]
8. Ouédraogo, D.Y.; Mortier, F.; Gourlet-Fleury, S.; Freycon, V.; Picard, N. Slow-growing species cope best with
drought: Evidence from long-term measurements in a tropical semi-deciduous moist forest of Central Africa.
J. Ecol. 2013, 101, 1459–1470. [CrossRef]
9. Willis, K.; Bennett, K.D.; Burrough, S.; Macias-Fauria, M.; Tovar, C. Determining the response of African
biota to climate change: Using the past to model the future. Philos. Trans. R. Soc. B 2013, 368, 20120491.
[CrossRef] [PubMed]
10. Zhou, L.; Tian, Y.; Myneni, R.B.; Ciais, P.; Saatchi, S.; Liu, Y.Y.; Piao, S.; Chen, H.; Vermote, E.F.; Song, C.
Widespread decline of congo rainforest greenness in the past decade. Nature 2014, 509, 86–90. [CrossRef]
[PubMed]
11. Williams, C.A.; Hanan, N.P.; Neff, J.C.; Scholes, R.J.; Berry, J.A.; Denning, A.S.; Baker, D.F. Africa and the
global carbon cycle. Carbon Balance Manag. 2007, 2, 3. [CrossRef] [PubMed]
12. Fisher, J.B.; Sikka, M.; Sitch, S.; Ciais, P.; Poulter, B.; Galbraith, D.; Lee, J.E.; Huntingford, C.; Viovy, N.;
Zeng, N. African tropical rainforest net carbon dioxide fluxes in the twentieth century. Philos. Trans. R. Soc. B
2013, 368, 20120376. [CrossRef] [PubMed]
13. Cao, M.; Zhang, Q.; Shugart, H.H. Dynamic responses of African ecosystem carbon cycling to climate change.
Clim. Res. 2001, 17, 183–193. [CrossRef]
14. McGuire, A.; Sitch, S.; Clein, J.; Dargaville, R.; Esser, G.; Foley, J.; Heimann, M.; Joos, F.; Kaplan, J.;
Kicklighter, D.W.; et al. Carbon balance of the terrestrial biosphere in the twentieth century: Analyses
of CO2 , climate and land use effects with four process-based ecosystem models. Glob. Biogeochem. Cycles
2001, 15, 183–206. [CrossRef]
15. Ciais, P.; Piao, S.-L.; Cadule, P.; Friedlingstein, P.; Chédin, A. Variability and recent trends in the African
terrestrial carbon balance. Biogeosciences 2009, 6, 1935–1948. [CrossRef]
16. Hiernaux, P.; Mougin, E.; Diarra, L.; Soumaguel, N.; Lavenu, F.; Tracol, Y.; Diawara, M. Sahelian rangeland
response to changes in rainfall over two decades in the gourma region, Mali. J. Hydrol. 2009, 375, 114–127.
[CrossRef]
17. Lewis, S.L.; Lopez-Gonzalez, G.; Sonké, B.; Affum-Baffoe, K.; Baker, T.R.; Ojo, L.O.; Phillips, O.L.;
Reitsma, J.M.; White, L.; Comiskey, J.A. Increasing carbon storage in intact African tropical forests. Nature
2009, 457, 1003–1006. [CrossRef] [PubMed]
18. Ciais, P.; Bombelli, A.; Williams, M.; Piao, S.; Chave, J.; Ryan, C.; Henry, M.; Brender, P.; Valentini, R. The
carbon balance of Africa: Synthesis of recent research studies. Philos. Trans. R. Soc. B 2011, 369, 2038–2057.
[CrossRef] [PubMed]
19. Washington, R.; James, R.; Pearce, H.; Pokam, W.M.; Moufouma-Okia, W. Congo basin rainfall climatology:
Can we believe the climate models? Philos. Trans. R. Soc. B 2013, 368, 20120296. [CrossRef] [PubMed]
20. DosAnjos, L.; Oliva, M.A.; Kuki, K.N.; Mielke, M.S.; Ventrella, M.C.; Galvão, M.F.; Pinto, L.R. Key leaf traits
indicative of photosynthetic plasticity in tropical tree species. Trees 2015, 29, 247–258. [CrossRef]
21. Atkin, O.K.; Bloomfield, K.J.; Reich, P.B.; Tjoelker, M.G.; Asner, G.P.; Bonal, D.; Bönisch, G.; Bradford, M.G.;
Cernusak, L.A.; Cosio, E.G. Global variability in leaf respiration in relation to climate, plant functional types
and leaf traits. New Phytol. 2015, 206, 614–636. [CrossRef] [PubMed]
22. Fatichi, S.; Leuzinger, S.; Körner, C. Moving beyond photosynthesis: From carbon source to sink-driven
vegetation modeling. New Phytol. 2014, 201, 1086–1095. [CrossRef] [PubMed]
23. Doughty, C.E.; Metcalfe, D.; Girardin, C.; Amézquita, F.F.; Cabrera, D.G.; Huasco, W.H.; Silva-Espejo, J.;
Araujo-Murakami, A.; da Costa, M.; Rocha, W. Drought impact on forest carbon dynamics and fluxes in
Amazonia. Nature 2015, 519, 78–82. [CrossRef] [PubMed]
24. Malhi, Y.; Doughty, C.E.; Goldsmith, G.R.; Metcalfe, D.B.; Girardin, C.A.; Marthews, T.R.; Aguila-Pasquel, J.;
Aragão, L.E.; Araujo-Murakami, A.; Brando, P. The linkages between photosynthesis, productivity, growth
and biomass in lowland Amazonian forests. Glob. Chang. Biol. 2015, 21, 2283–2295. [CrossRef] [PubMed]Forests 2018, 9, 109 13 of 15
25. Kearsley, E.; de Haulleville, T.; Hufkens, K.; Kidimbu, A.; Toirambe, B.; Baert, G.; Huygens, D.; Kebede, Y.;
Defourny, P.; Bogaert, J. Conventional tree height-diameter relationships significantly overestimate
aboveground carbon stocks in the central congo basin. Nat. Commun. 2013, 4. [CrossRef] [PubMed]
26. Chave, J.; Réjou-Méchain, M.; Búrquez, A.; Chidumayo, E.; Colgan, M.S.; Delitti, W.B.; Duque, A.; Eid, T.;
Fearnside, P.M.; Goodman, R.C. Improved allometric models to estimate the aboveground biomass of
tropical trees. Glob. Chang. Biol. 2014, 20, 3177–3190. [CrossRef] [PubMed]
27. Picard, N.; Henry, M.; Fonton, N.H.; Kondaoulé, J.; Fayolle, A.; Birigazzi, L.; Sola, G.; Poultouchidou, A.;
Trotta, C.; Maïdou, H. Error in the estimation of emission factors for forest degradation in central Africa.
J. For. Res. 2016, 21, 23–30. [CrossRef]
28. Saatchi, S.; Mascaro, J.; Xu, L.; Keller, M.; Yang, Y.; Duffy, P.; Espírito-Santo, F.; Baccini, A.; Chambers, J.;
Schimel, D. Seeing the forest beyond the trees. Glob. Ecol. Biogeogr. 2015, 24, 606–610. [CrossRef]
29. Flexas, J.; Bota, J.; Galmes, J.; Medrano, H.; Ribas-Carbó, M. Keeping a positive carbon balance under adverse
conditions: Responses of photosynthesis and respiration to water stress. Physiol. Plant. 2006, 127, 343–352.
[CrossRef]
30. Flexas, J.; Galmes, J.; Ribas-Carbo, M.; Medrano, H. The effects of water stress on plant respiration. In Plant
Respiration; Lambers, H., Ribas-Carbo, M., Eds.; Springer: Dordrecht, The Netherlands, 2005; pp. 85–94.
31. Varone, L.; Gratani, L. Leaf respiration responsiveness to induced water stress in Mediterranean species.
Environ. Exp. Bot. 2015, 109, 141–150. [CrossRef]
32. De Schepper, V.; Bühler, J.; Thorpe, M.; Roeb, G.; Huber, G.; van Dusschoten, D.; Jahnke, S.; Steppe, K. 11 C-pet
imaging reveals transport dynamics and sectorial plasticity of oak phloem after girdling. Front. Plant Sci.
2013, 4, 200. [CrossRef] [PubMed]
33. Mencuccini, M. Temporal scales for the coordination of tree carbon and water economies during droughts.
Tree Physiol. 2014, 34, 439–442. [CrossRef] [PubMed]
34. Sevanto, S. Phloem transport and drought. J. Exp. Bot. 2014, 65, 1751–1759. [CrossRef] [PubMed]
35. Hubeau, M.; Steppe, K. Plant-PET scans: In vivo mapping of xylem and phloem functioning. Trends Plant Sci.
2015, 20, 676–685. [CrossRef] [PubMed]
36. Steppe, K.; Sterck, F.; Deslauriers, A. Diel growth dynamics in tree stems: Linking anatomy and
ecophysiology. Trends Plant Sci. 2015, 20, 335–343. [CrossRef] [PubMed]
37. Ryan, M.G.; Hubbard, R.M.; Pongracic, S.; Raison, R.; McMurtrie, R.E. Foliage, fine-root, woody-tissue and
stand respiration in Pinus radiata in relation to nitrogen status. Tree Physiol. 1996, 16, 333–343. [CrossRef]
[PubMed]
38. Van der Molen, M.K.; Dolman, A.J.; Ciais, P.; Eglin, T.; Gobron, N.; Law, B.E.; Meir, P.; Peters, W.; Phillips, O.L.;
Reichstein, M.; et al. Drought and ecosystem carbon cycling. Agric. For. Meteorol. 2011, 151, 765–773.
[CrossRef]
39. Gustafson, E.J.; De Bruijn, A.M.; Pangle, R.E.; Limousin, J.M.; McDowell, N.G.; Pockman, W.T.;
Sturtevant, B.R.; Muss, J.D.; Kubiske, M.E. Integrating ecophysiology and forest landscape models to
improve projections of drought effects under climate change. Glob. Chang. Biol. 2015, 21, 843–856. [CrossRef]
[PubMed]
40. Turgeon, R. The role of phloem loading reconsidered. Plant Physiol. 2010, 152, 1817–1823. [CrossRef]
[PubMed]
41. Vico, G.; Dralle, D.; Feng, X.; Thompson, S.; Manzoni, S. How competitive is drought deciduousness in
tropical forests? A combined eco-hydrological and eco-evolutionary approach. Environ. Res. Lett. 2017, 12,
065006. [CrossRef]
42. Epila, J.; Maes, W.H.; Verbeeck, H.; Van Camp, J.; Okullo, J.B.L.; Steppe, K. Plant measurements on African
tropical Maesopsis eminii seedlings contradict pioneering water use behaviour. Environ. Exp. Bot. 2017, 135,
27–37. [CrossRef]
43. Van Camp, J.; Hubeau, M.; Van den Bulcke, J.; Van Acker, J.; Steppe, K. Cambial pinning relates wood
anatomy to ecophysiology in the African tropical tree Maesopsis eminii. Tree Physiol. 2018, 38, 232–242.
[CrossRef] [PubMed]
44. Caird, M.A.; Richards, J.H.; Donovan, L.A. Nighttime stomatal conductance and transpiration in C3 and C4
plants. Plant Physiol. 2007, 143, 4–10. [CrossRef] [PubMed]
45. Chen, X.; Gao, J.; Zhao, P.; McCarthy, H.R.; Zhu, L.; Ni, G.; Ouyang, L. Tree species with photosynthetic
stems have greater nighttime sap flux. Front. Plant Sci. 2018, 9, 30. [CrossRef] [PubMed]You can also read