Diurnal variation of aerosol optical depth and PM2.5 in South Korea: a synthesis from AERONET, satellite (GOCI), KORUS-AQ observation, and the ...
←
→
Page content transcription
If your browser does not render page correctly, please read the page content below
Atmos. Chem. Phys., 18, 15125–15144, 2018
https://doi.org/10.5194/acp-18-15125-2018
© Author(s) 2018. This work is distributed under
the Creative Commons Attribution 4.0 License.

Diurnal variation of aerosol optical depth and PM2.5 in South
Korea: a synthesis from AERONET, satellite (GOCI), KORUS-AQ
observation, and the WRF-Chem model
Elizabeth M. Lennartson1 , Jun Wang1 , Juping Gu2 , Lorena Castro Garcia1 , Cui Ge1 , Meng Gao1,3 , Myungje Choi4 ,
Pablo E. Saide5 , Gregory R. Carmichael1 , Jhoon Kim4 , and Scott J. Janz6
1 Department  of Chemical and Biochemical Engineering, Center for Global and Regional
Environmental Research, University of Iowa, Iowa City, Iowa, USA
2 Department of Electrical Engineering, Nantong University, Nantong, China
3 School of Engineering and Applied Sciences, Harvard University, Cambridge, Massachusetts, USA
4 Department of Atmospheric Science, Yonsei University, Seoul, Republic of Korea
5 Department of Atmospheric and Oceanic Sciences, Institute of the Environment and Sustainability,

University of California, Los Angeles, California, USA
6 Lab for Atmospheric Chemistry and Dynamics, Code 614, NASA Goddard Space Flight Center, Greenbelt, Maryland, USA

Correspondence: Jun Wang (jun-wang-1@uiowa.edu) and Elizabeth M. Lennartson (elizabeth-lennartson@uiowa.edu)

Received: 15 April 2018 – Discussion started: 28 May 2018
Revised: 6 September 2018 – Accepted: 10 September 2018 – Published: 22 October 2018

Abstract. Spatial distribution of diurnal variations of aerosol   the Ångström exponent from morning to evening, reflecting
properties in South Korea, both long term and short term,         an overall decrease in particle size in daytime. To statistically
is studied by using 9 AERONET (AErosol RObotic NET-               obtain the climatology of diurnal variation of AOD, a mini-
work) sites from 1999 to 2017 and an additional 10 sites          mum requirement of ∼ 2 years of observation is needed in
during the KORUS-AQ (Korea–United States Air Quality)             coastal rural sites, twice as long as that required for the ur-
field campaign in May and June of 2016. The extent to which       ban sites, which suggests that the diurnal variation of AOD
the WRF-Chem (Weather Research and Forecasting coupled            in an urban setting is more distinct and persistent. While Ko-
with Chemistry) model and the GOCI (Geostationary Ocean           rean GOCI satellite retrievals are able to consistently capture
Color Imager) satellite retrieval can describe these variations   the diurnal variation of AOD (although it has a systematically
is also analyzed. On a daily average, aerosol optical depth       low bias of 0.04 on average and up to 0.09 in later afternoon
(AOD) at 550 nm is 0.386 and shows a diurnal variation of         hours), WRF-Chem clearly has a deficiency in describing the
20 to − 30 % in inland sites, which is larger than the AOD        relative change of peaks and variations between the morning
of 0.308 and diurnal variation of ±20 % seen in coastal sites.    and afternoon, suggesting further studies for the diurnal pro-
For all the inland and coastal sites, AERONET, GOCI, and          file of emissions. Furthermore, the ratio between PM2.5 and
WRF-Chem, and observed PM2.5 (particulate matter with             AOD in WRF-Chem is persistently larger than the observed
aerodynamic diameter less than 2.5 µm) data generally show        counterparts by 30 %–50 % in different sites, but spatially
dual peaks for both AOD and PM2.5 , one in the morning (of-       no consistent diurnal variation pattern of this ratio can be
ten at ∼ 08:00–10:00 KST, Korea Standard Time, especially         found. Overall, the relatively small diurnal variation of PM2.5
for PM2.5 ) and another in the early afternoon (∼ 14:00 KST,      is in high contrast with large AOD diurnal variation, which
albeit for PM2.5 this peak is smaller and sometimes insignif-     suggests the large diurnal variation of AOD–PM2.5 relation-
icant). In contrast, Ångström exponent values in all sites are    ships (with the PM2.5 / AOD ratio being largest in the early
between 1.2 and 1.4 with the exception of the inland rural        morning, decreasing around noon, and increasing in late af-
sites having smaller values near 1.0 during the early morning     ternoon) and, therefore, the need to use AOD from geosta-
hours. All inland sites experience a pronounced increase in

Published by Copernicus Publications on behalf of the European Geosciences Union.
15126                                                      E. M. Lennartson et al.: Diurnal variation of aerosol optical depth

tionary satellites to constrain either modeling or estimate of      concentrations. Other efforts have combined the use of satel-
surface PM2.5 for air quality application.                          lite AOD with local scaling factors from global chemistry
                                                                    transport models; columnar NO2 ; and factors such as the
                                                                    planetary boundary height, the temperature inversion layer,
                                                                    relative humidity, season, and site location (Liu et al., 2004,
1   Introduction                                                    2005; Ma et al., 2016; van Donkelaar et al., 2010; Zang et
                                                                    al., 2017; Zheng et al., 2016; Qu et al., 2016). A review by
Aerosols, both natural and anthropogenic, play an important         Hoff and Christopher (2009) summarizes that “the satellite
role in air quality and the climate. They are involved in pollu-    precision in measuring AOD is ±20 % and the prediction of
tion events, and they have a direct and indirect role in modi-      PM2.5 concentrations from these values is ±30 % in the most
fying the Earth’s radiation budget and properties of cloud and      careful studies.”
precipitation, respectively (Kaufman et al., 2002). Aerosols           Since air quality is often assessed with daily (24 h) or
also lead to acute and chronic health effects due to their small    annual averages of surface PM2.5 , while the polar-orbiting
size and ability to be inhaled through the respiratory tract        satellite only provides AOD retrieval once per day for a given
to the lungs’ alveoli (Pope et al., 2002). As the world con-        location (Wang et al., 2016), recent research has integrated
tinues to industrialize and increase in population (especially      AOD from geostationary satellites into the surface PM2.5
in developing countries), it is imperative to understand and        analysis because a geostationary satellite can provide mul-
mitigate the effects of pollutants on air quality, climate, and     tiple measurements of AOD per day for a given a location
human health, in various spatial and temporal scales.               (Wang et al., 2003a; b), thereby better constraining the diur-
   The United States’ air quality index (AQI) is monitored on       nal variation of PM2.5 for estimating 24-hour average PM2.5
a daily basis to inform the population on how clean or pol-         (Xu et al., 2015).
luted the air in their local area is. The particulate matter (PM)      Here, we study the diurnal variation of PM2.5 and AOD
AQI is calculated from “the ratio between 24 h average of the       and evaluate such variations for air quality applications by
measured dry particulate mass and the National Ambient Air          focusing on a 6-week-long (April–June) air quality campaign
Quality Standard (NAAQS)” (Wang and Christopher, 2003).             in KORUS-AQ (Korea–United States Air Quality) and the
For clean conditions, the 24-hour average NAAQS for fine            long-term AERONET (AErosol RObotic NETwork) sites in
particulate matter (PM2.5 , or particulate matter with aerody-      South Korea. The campaign is the first of its kind in east
namic diameter less than 2.5 µm) must be below 35 µg m−3 ,          Asia, involving international collaborations, integrated air-
which is 10 µg m−3 higher than the World Health Organi-             craft, surface and satellite data, and air quality models to as-
zation’s (WHO) recommendation of 25 µg m−3 (EPA, 2016;              sess urban, rural, and coastal air quality and its controlling
WHO, 2006). Due its health implications and crucial role in         factors. In this study, we first investigate the long-term AOD
determining daily air quality levels, it is of utmost impor-        diurnal variation for various South Korean ground sites and
tance to effectively monitor and predict 24 h average PM2.5         then focus our analysis to the KORUS-AQ AOD diurnal vari-
concentrations.                                                     ation as described by chemistry transport model and satellite
   PM2.5 concentrations are typically measured from surface         and surface observations. By centering AOD diurnal varia-
monitors. In the United States, there are roughly 600 con-          tion in our analysis, this study seeks to address the following
tinuous (hourly) monitors spread throughout the country and         questions:
managed by federal, state, local, and tribal agencies (EPA,
2008). These monitors provide invaluable information re-              1. What is the climatology of AOD and its wavelength-
garding PM2.5 levels 24 times per day and are not affected               dependent (Ångström exponent) diurnal variation in
by weather conditions; particle-bound water included in the              South Korea, both spatially and spectrally? How long
sampled air is removed by heating at a constant temperature              should the ground measurement record be to derive the
(usually at 50 ◦ C) inside the monitoring instrument (Wang et            climatology of AOD diurnal variation?
al., 2006). However, disadvantages include the fact that they
                                                                      2. To what degree can AOD diurnal variation be captured
do not represent pollution over large spatial areas. Further-
                                                                         by GOCI (Geostationary Ocean Color Imager) and a
more, many populated locations in the world do not have
                                                                         chemistry transport model WRF-Chem (Weather Re-
a single monitor in their vicinity (Christopher and Gupta,
                                                                         search and Forecasting coupled with Chemistry)?
2010).
   To gap fill between monitoring sites and provide estimates         3. What is the diurnal variation of surface PM2.5 ? How
at locations around the world, recent research has focused               well is the diurnal variation of the PM2.5 –AOD relation-
on using satellite aerosol optical depth (AOD) to predict                ship captured by WRF-Chem?
ground PM2.5 concentrations. An early study by Wang and
Christopher (2003) relied on a linear relationship to inves-        The rest of the paper is organized as follows: Section 2 gives
tigate the Moderate Resolution Imaging Spectroradiometer            a brief overview of previous studies and the motivation for
(MODIS) AOD and 24 h average and monthly average PM2.5              this research. Section 3 details the datasets used in this study,

Atmos. Chem. Phys., 18, 15125–15144, 2018                                           www.atmos-chem-phys.net/18/15125/2018/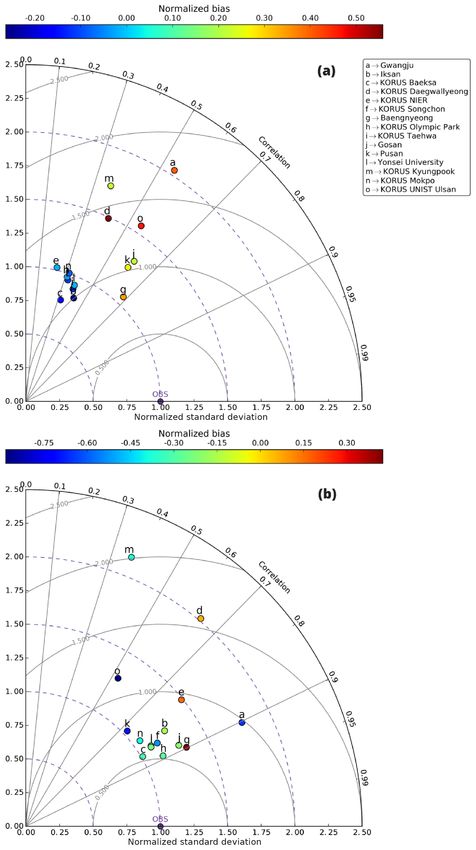
E. M. Lennartson et al.: Diurnal variation of aerosol optical depth                                                          15127

and Sect. 4 contains the methods and analysis of the study.         et al. (2018) showed that AOD diurnal variation can be up
Section 5 closes the paper with a summary and the main con-         to 30 % with a peak around noon in northwest China and a
clusions.                                                           steady increase of 40 % from early morning to late afternoon
                                                                    in the northern China plains.
                                                                       While AOD diurnal variation has been analyzed by sev-
2     Background and motivation                                     eral past studies, few studies examined the diurnal variation
                                                                    of the Ångström exponent. Wang et al. (2004) showed that
2.1    Diurnal variation AOD and Ångström exponent                  the Ångström exponent on average has a diurnal variation of
                                                                    30 % (with minima in the mid-afternoon) in the dust source
The study of AOD diurnal variation dates back to the late           region of the Gobi Desert. Globally, Kaufman et al. (2000)
1960s but did not gain momentum until near the turn of the          showed the ratio of the Ångström exponent at Terra satel-
century (Barteneva et al., 1967; Panchenko et al., 1999; Pe-        lite overpass time with respect to the daily mean is close
terson et al., 1981; Pinker et al., 1994). Peterson et al. (1981)   1 in 60 % of days for the AERONET sites from 1993 to
found the AOD at Raleigh, North Carolina, to have an early          1999, and they clearly showed that the diurnal variation of
afternoon maxima at 13:00–14:00 LT (local time) during the          the Ångström exponent is much larger than the counterpart
1969–1975 study period. Pinker et al. (1994) showed that            of AOD. Recently, Song et al. (2018) also showed that the di-
AOD in sub-Saharan Africa increased throughout the day in           urnal variation of the Ångström exponent is ∼ 15 % in south-
December 1987 while the January 1989 data showed maxima             west China, with minima in the mid-afternoon, and less than
at 13:00 LT and minima at 10:00 and 16:00 LT. As recent as          10 % in northern China plains.
the early 2000s, the science community agreed that the “di-            Overall, research based on limited ground-based observa-
urnal effects are largely unknown and little studied due to the     tions has shown that, on a global and annual scale, the AOD
paucity of data” (Smirnov et al., 2002).                            diurnal variation exists, albeit relatively small. On a daily
   Most diurnal variation of AOD research stemmed from              and local scale, AOD and Ångström exponent diurnal vari-
the analysis of aerosol radiative forcing, which requires the       ations are significant, which calls upon the need of geosta-
knowledge of the diurnal distribution of key aerosol prop-          tionary satellite measurements for both air quality and cli-
erties such as AOD, the single scattering albedo, and the           mate studies. Much less studied is the diurnal variation of
asymmetry factor (Kassianov et al., 2013; Kuang et al.,             the Ångström exponent. Newer geostationary satellites may
2015; Wang et al., 2003b). Two early studies developed an           play an important role for the future generation of AOD di-
algorithm to retrieve AOD diurnal variation from geosta-            urnal variation studies.
tionary satellites over water and showed strong AOD di-
urnal variation during long-range aerosol transport events;         2.2   PM2.5 diurnal variation
Wang et al. (2003b) used April 2001 hourly data over wa-
ter from the GMS (Geostationary Meteorological Satellite)           In addition to AOD diurnal variation, studies have also inves-
imager and Wang et al. (2003a) used half-hourly data in July        tigated the diurnal variation of PM2.5 . Epidemiological stud-
2000 from the GOES-8 (Geostationary Operational Environ-            ies focused on the mass, size, spatial and temporal variability,
mental Satellite) satellite during the ACE-Asia and PRIDE           and chemical composition of PM to investigate the complex
(Puerto Rico Dust Experiment) campaigns. Consistent with            sources and evolution of aerosols in the atmosphere (Fine et
AERONET observations, the GOES-8 retrieval over Puerto              al., 2004; Sun et al., 2013; Wittig et al., 2004). In many of
Rico showed the dust AOD diurnal variation’s noontime min-          these studies, tracer species of primary aerosols and possi-
imum and early morning or late afternoon maximum. Sub-              ble components of secondary organic aerosols were the main
sequent work by Wang et al. (2004) investigated the Tak-            focus (Edgerton et al., 2006; Querol et al., 2001; Sun et al.,
limakan and Gobi dust regions in China using 1999–2000              2013; Wittig et al., 2004).
AOD data from a nearby airport’s Sun photometer. They                  Regarding diurnal variation of PM2.5 mass, studies have
found a seasonally invariant diurnal change of more than            found different results for various locations around the world.
±10 % for dust AOD. Their results aligned with similar past         Querol et al. (2001) used data from June 1999 to June 2000
studies which found the diurnal variation of dust aerosols to       and found Barcelona’s (Spain) diurnal variation of PM2.5 in
be ± < 5 %–15 % depending on the AERONET site’s loca-               all four seasons to be characterized by an increase from the
tion and distance from a dust source region (Kaufman et al.,        late afternoon to midnight. This trend was more pronounced
2000; Levin et al., 1980; Wang et al., 2003a). However, on          in winter and autumn since the concentrations were higher
a daily basis, the day-to-day variation of AOD can be dis-          from late afternoon to midnight in fall/winter relative to the
tinct, up to 150 %, and both daily diurnal variation changes        spring/summer values.
and relative departures of AOD from the daily mean are of              In the United States, early studies have focused on the Los
up to 20 % (Kassianov et al., 2013; Kuang et al., 2015).            Angeles, Pittsburgh, and general southeast US areas. Fine et
Furthermore, using long-term Sun-photometer data from the           al. (2004) chose two sites, an urban one located at the Univer-
China Aerosol Remote Sensing Network (CARSNET), Song                sity of Southern California (USC) and a rural one in River-

www.atmos-chem-phys.net/18/15125/2018/                                            Atmos. Chem. Phys., 18, 15125–15144, 2018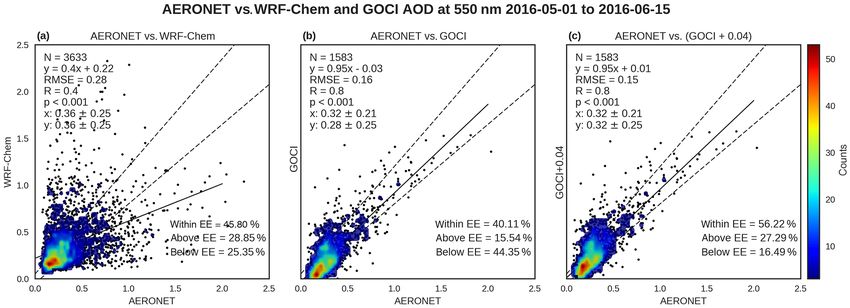
15128                                                     E. M. Lennartson et al.: Diurnal variation of aerosol optical depth

side, and studied the diurnal variation for 1 week in the sum-     turing AQI variability) in cloud-free conditions (Wang and
mertime and 1 week in the wintertime. The USC site had a           Christopher, 2003).
summer peak in the morning and midday with a winter peak              Other efforts have used satellite AOD in combination with
in the morning. The Riverside site experienced a summer            additional factors to improve the prediction of ground-level
peak in the morning and a winter peak in the overnight hours.      PM2.5 , such as the planetary boundary layer height, rela-
The winter results were attributed to the boundary layer tem-      tive humidity, season, and the geographical characteristics
perature inversion that forms throughout the day over the          of the monitoring sites (Liu et al., 2005; Qu et al., 2016).
area. A few years later in Pittsburgh, Wittig et al. (2004)        Similarly, Gupta et al. (2006) found a strong dependence
found no clear PM2.5 diurnal variability due to the combined       on aerosol concentration, relative humidity, fractional cloud
effect of particulate matter species being transported to the      cover, and the mixing layer height when analyzing the re-
area versus generated locally. Additionally, they concluded        lationship between MODIS AOD and ground-level PM2.5 .
that the daily changes in PM2.5 concentrations could be “at-       They concluded the importance of local wind patterns for
tributed to the major components of the [particulate] mass,        identifying the pollutant sources and, overall, high correla-
namely the sulfate”. Data from the 1998–1999 Southeastern          tions can occur for the following four conditions: cloud-free,
Aerosol and Characterization Study (SEARCH) was used by            low boundary layer heights, AOD larger than 0.1, and low
Edgerton et al. (2006) at four pairs of urban–rural sites. They    relative humidity.
established the following three main PM2.5 temporal varia-            Xu et al. (2015) used GOCI AOD in cloud-free days and a
tion patterns: large values of > 40–50 µg m−3 that occurred        global chemistry transport model (GEOS-Chem or Goddard
on timescales of a few hours, buildup occurring over several       Earth Observing System with Chemistry) to find significant
days and then returning to normal levels, and enhancements         agreement between the derived PM2.5 and the ground mea-
during the summer of similar magnitude as the monthly or           sured PM2.5 for both the annual and monthly averages over
quarterly averages. Their four sites had similar diurnal varia-    eastern China. Incorporating AOD data from GOCI, a geo-
tions characterized by maxima at 06:00–08:00 LT and again          stationary satellite, provided improvement for GEOS-Chem,
from 18:00 to 21:00 LT, similar to those results found by          a global chemistry transport model, to estimate ground-level
Wang and Christopher (2003) at seven sites in Alabama. In          PM2.5 for a highly populated and polluted region of the world
South Korea, Ghim et al. (2015) showed that PM2.5 aver-            on a fine spatial resolution. When comparing their results to
age concentration in Seoul in 2002–2008 peaks at 09:00 KST         MODIS-AOD-derived PM2.5 , they found better agreement
(Korea Standard Time) and again around midnight, but such          using their model with an R 2 value of 0.66. However, in
typical diurnal variation can sometimes be affected by long-       their study, only daytime-averaged AOD from both GEOS-
range transport of dust. Similar diurnal variation for PM10        Chem and GOCI AOD is used as their study is concerned
was also found by Yoo et al. (2015) over the southern Korean       with monthly and annual timescales.
Peninsula, although its peak at daytime lagged behind that of         Hence, one common theme throughout most of the past
PM2.5 by 1 h, which is found in Ghim et al. (2015). Further-       research, with the exception of Xu et al. (2015), is the use of
more, both Ghim et al. (2015) and Yoo et al. (2015) showed         AOD data from low-Earth-orbiting (LEO) satellites to estab-
that PM concentrations can significantly vary with space and       lish the AOD–PM2.5 relationship. However, all the studies
time. Hence, in order to understand the potency and effects        have relied on the model-simulated diurnal variation of the
of the individual chemical species and PM2.5 as a whole, it is     AOD–PM2.5 relationship to convert satellite-based AOD (of-
urgently necessary to increase the amount of long-term mea-        ten once per day) to surface PM2.5 . An integrated analysis of
surements available and investigate other methods such as          diurnal variation of AOD, PM2.5 , and their relationship, with
satellite remote sensing that can be used to assist with char-     unprecedented observations from field campaigns, is over-
acterizing PM2.5 concentrations and diurnal variation.             due.

2.3   Diurnal variation of the AOD–PM2.5 relationship
                                                                   3   Study area and data

Recently, studies have focused on using satellite measure-         Over the last 40 years, South Korea has experienced an ex-
ments of AOD in order to predict ground-level PM2.5 con-           tensive list of air quality improvements for constituents such
centrations in addition to investigating the diurnal variations    as lead, sulfur dioxide, and PM10 (Ministry of Environment,
of both components. An early study examined how well               2016). In 2015, they introduced a standard on PM2.5 , and,
MODIS AOD correlated with 24 h average and monthly av-             due to its recent implementation, the historical trends of
erage PM2.5 using a linear relationship and found linear cor-      PM2.5 are not well established. Han et al. (2011) suggests
relation coefficients of 0.7 and 0.9, respectively. Addition-      that, prior to 2005, PM2.5 annual averages either increased or
ally, when the linear relationship used the 24 h average PM2.5     remained constant in rural Chuncheon, South Korea. How-
concentrations, MODIS AOD quantitatively estimated PM2.5           ever, there has been a gradual decrease in the annual aver-
AQI categories with typical errors of ±10 % (in terms of cap-      ages in Seoul since 2005, although the decreases have not

Atmos. Chem. Phys., 18, 15125–15144, 2018                                          www.atmos-chem-phys.net/18/15125/2018/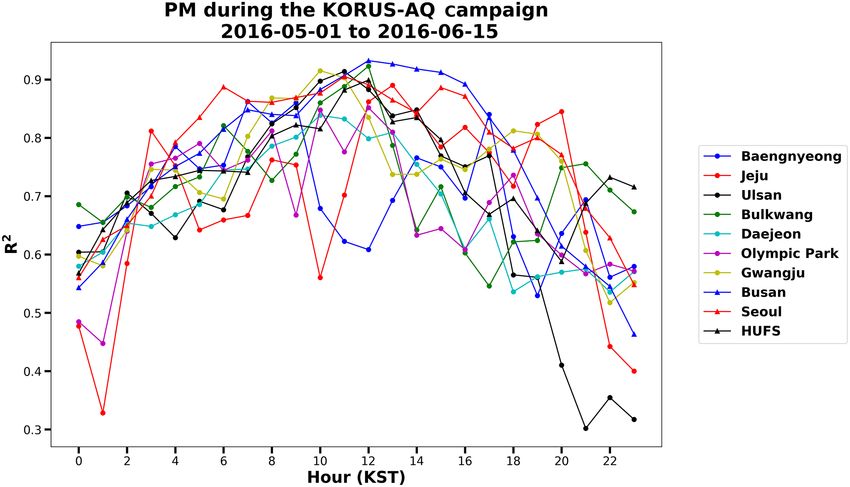
E. M. Lennartson et al.: Diurnal variation of aerosol optical depth                                                          15129

been continuous (Ahmed et al., 2015; Ghim et al., 2015;
Lee, 2014). Annual averages have ranged from 33.5 µg m−3
in 2004 to 21.9 µg m−3 in 2012, but the most recent patterns
have been difficult to interpret (Ahmed et al., 2015). Also,
since the PM2.5 concentrations discussed above were from
research studies based only in the Seoul region, the afore-
mentioned findings may not be fully applicable to South Ko-
rea as a whole. For this study, we will use all the AERONET
data collected over South Korea since the early 1990s, as well
as rich datasets collected during KORUS-AQ including an
additional 10 AERONET sites, GOCI data, and WRF-Chem
modeling data.

3.1   AERONET

The AERONET sites provide “long-term, continuous, and
readily accessible” (NASA, 2018) aerosol data, with AOD
and the Ångström exponent being two of the available pa-
rameters from the direct Sun measurements. Sequences are
made in eight spectral bands between 340 and 1020 nm while
the diffuse Sun measurements are made at 440, 670, 870,
and 1020 nm (Holben et al., 1998). The version 2, level 2
quality level data are used for this study, which implies that
the data are cloud-screened and quality-assured following the
procedures detailed in Smirnov et al. (2000). To compare the
AERONET AOD values to those commonly used by other
data platforms such as satellites and models, the AOD at
550 nm is calculated by using the corresponding Ångström
exponent derived from AOD at 440 and 870 nm .
   At the time of last access to the AERONET database in
July 2017, the stations listed in Table 1 had version 2, level    Figure 1. (a) Map of AERONET sites used in this study. The site
2 data available. These stations were further grouped into the    marker corresponds to its land classification and its color corre-
following four land classifications: coastal urban, coastal ru-   sponds to Fig. 2. Sites with white markers are not used in Fig. 2
ral, inland urban, and inland rural. Each site’s classification   due to their limited data availability. Overlaid is AOD at 550 nm
membership is represented in Fig. 1a and b by its marker. The     from MODIS Aqua’s dark target product. The daily mean data are
same marker color schemes are also used in other figures to       used. (b) Zoom-in of the Seoul region.
correspondingly denote AOD diurnal variation at each indi-
vidual site.
                                                                  added to expedite computations, and a simplified secondary
3.2   WRF-Chem                                                    organic aerosol formation scheme is added to the sophisti-
                                                                  cated MOSAIC aerosol module. In the vertical, there are 53
The WRF-Chem V3.6.1 model developed by the Univer-                layers distributed between the surface and 50 hPa. The bot-
sity of Iowa and NCAR is used. WRF-Chem is a regional             tom layer closest to the surface has a thickness of ∼ 50 m.
meteorology–chemistry model capable of simulating both               To support the KORUS-AQ field campaigns, a Com-
the chemical and meteorological phenomena within the at-          prehensive Regional Emissions inventory for Atmospheric
mosphere at flexible resolutions to assist with air qual-         Transport Experiments (CREATE) was developed based on
ity forecasts. It is a fully coupled online model in which        GAINS-Asia emissions with updated national data (Gold-
both the air quality and meteorological components use the        berg et al., 2018). It has 54 fuel classes, 201 sub-sectors,
same transport scheme, timestep, grid, and physics schemes        and 13 pollutants, including sulfur dioxide (SO2 ), nitrogen
for subgrid-scale transport. Additionally, aerosol–radiation–     oxides (NOx ), carbon monoxide (CO), non-methane volatile
cloud interactions are considered (Grell et al., 2005).           organic compounds (NMVOCs), ammonia (NH3 ), organic
   The University of Iowa’s WRF-Chem forecast for                 carbon (OC), black carbon (BC), PM10 , PM2.5 , carbon diox-
KORUS-AQ provides simulations of meteorology and atmo-            ide (CO2 ), methane (CH4 ), nitrous oxide (N2 O), and mer-
spheric composition at 20 and 4 km resolution, respectively.      cury (Hg). The emissions of NMVOCs from vegetation
A reduced hydrocarbon chemistry mechanism (REDHC) is              are calculated online using the MEGAN (Model of Emis-

www.atmos-chem-phys.net/18/15125/2018/                                           Atmos. Chem. Phys., 18, 15125–15144, 2018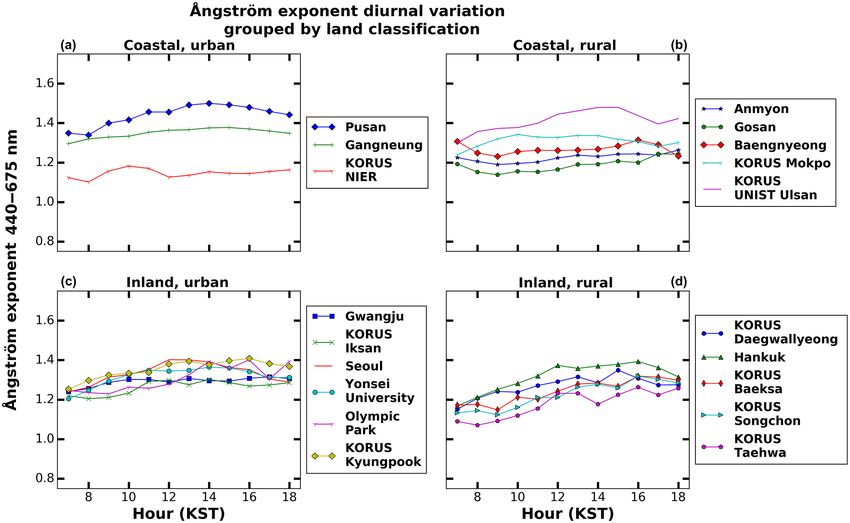
15130                                                     E. M. Lennartson et al.: Diurnal variation of aerosol optical depth

Table 1. Details for all 22 AERONET sites. NFull and NKORUS denote the number of observations. NDays denotes the number of days with
observations in the full record of data. The hour(s) of AOD minimum and maximum correspond(s) with Fig. 2.

     Land classification/site   Full record          NFull    NDAYS        KORUS-AQ           NKORUS   Hour(s) of    Hour(s) of
                                                                           record                          AOD           AOD
                                                                                                       minimum       maximum
                                                                                                          (KST)         (KST)
     Coastal, rural
     Anmyon                     10/17/99–12/09/15   26 147       1351      –                       –            9            18
     Baengnyeong                07/25/10–08/31/16   21 113        844      05/01/16–6/13/16     1949           16         7, 18
     Gosan                      04/04/01–09/12/16   24 208        982      05/01/16–6/14/16     1506           10            16
     KORUS Mokpo                03/02/16–01/08/17    7602         196      05/01/16–6/14/16     1728           14         7, 17
     KORUS UNIST Ulsan          03/03/16–02/01/17   11 441        231      05/01/16–6/11/16     1989           12         7, 18
     Coastal, urban
     Chinhae                    04/21/99–09/15/99      796         54                                            –            –
     Gangneung                  06/03/12–12/16/15   13 272        569      –                       –            11        7, 18
     KORUS NIER                 02/29/16–06/10/16    1857          80      05/01/16–6/10/16      940         9, 18        8, 13
     Pusan                      06/16/12–02/11/17   16 253        536      05/01/16–6/11/16     2331         9, 14        7, 18
     Inland, rural
     Hankuk                     06/01/12–12/21/16   17 341        603      –                       –           14         7, 18
     KORUS Baeksa               04/24/16–06/14/16    2536          46      05/01/16–6/14/16     2190           12         7, 17
     KORUS Daegwallyeong        03/10/16–06/14/16    3152          75      05/01/16–6/14/16     2416           13        10, 16
     KORUS Songchon             04/22/16–06/13/16    2576          47      05/01/16–6/13/16     2208           15         9, 18
     Kyungil University         11/12/12–12/12/12      617         28                              –            –             –
     KORUS Taehwa               04/11/16–06/13/16    1939          50      05/01/16–6/13/16     1712       12, 14         8, 17
     Inland, urban
     Gwangju                    01/04/07–05/20/16   25 531       1,368     05/03/16–5/20/16     3980           14         7, 18
     Korea University           06/01/12–07/26/12    1407           34                             –            –             –
     KORUS Iksan                03/03/16–06/10/16    2725           83     05/01/16–6/10/16     1714           12         7, 17
     KORUS Kyungpook            03/02/16–02/14/17   10 443         238     05/01/16–6/14/16     2399           13         7, 18
     KORUS Olympic Park         05/01/16–06/14/16    2192           39     05/01/16–6/14/16     2192       14, 18         7, 17
     Seoul                      02/15/12–07/30/15    8175          382                             –           14         7, 18
     Yonsei University          03/04/11–01/16/17   65 277        1542     05/01/16–6/13/16     2271           10         7, 18

sions of Gasses and Aerosols from Nature) model, which               2016 11:00 UTC and from 02 May 2016 00:00 UTC to 15
are influenced by land use, temperature, etc. (Guenther et           June 2016 23:00 UTC.
al., 2006). Biomass burning emissions are taken from the
Global Fire Emissions Database (GFED) dataset, which is              3.3     GOCI
coupled to a plume-rise model (Grell et al., 2011). Sea salt
and dust are calculated using Gong et al. (1997) and God-            The Geostationary Ocean Color Imager (GOCI) onboard
dard Chemistry Aerosol Radiation and Transport (GOCART;              the Communication, Ocean, and Metrological Satellites
Zhao et al., 2010) schemes, respectively. Chemical initial and       (COMS) is the world’s first geostationary ocean color obser-
boundary conditions are obtained from the Monitoring At-             vation satellite. Launched in 2010, it provides spatial cov-
mospheric Composition and Climate (MACC) global tropo-               erage of 2500 km × 2500 km in northeast Asia at a 500 m
spheric chemical composition reanalysis.                             spatial resolution. The domain is comprised of 16 image
   WRF-Chem data are retrieved according to the latitude             segments (with resolution of 4 km × 4 km) and the Korean
and longitude of each of the 15 AERONET sites that were              Peninsula sits in the center of it. GOCI has six visible and
active during the KORUS-AQ timeframe (Table 1). Similar              two near-infrared (NIR) bands at 412, 443, 490, 555, 560,
to AERONET, the AOD at 550 nm is calculated. The AOD                 and 680 nm and 745 and 865 nm, respectively (Choi et al.,
derived in WRF-Chem is for multiple different observational          2012). Observations are taken eight times per day from 00:30
wavelengths and is based on Ångström exponent relations              to 07:30 UTC (09:30 to 16:30 KST) (Choi et al., 2017).
(Gao et al., 2016; Schuster et al., 2006). The WRF-Chem                 To retrieve hourly aerosol data the GOCI Yonsei Aerosol
data are available from 01 May 2016 00:00 UTC to 01 May              Retrieval (YAER) algorithm was prototyped in 2010 by Lee

Atmos. Chem. Phys., 18, 15125–15144, 2018                                             www.atmos-chem-phys.net/18/15125/2018/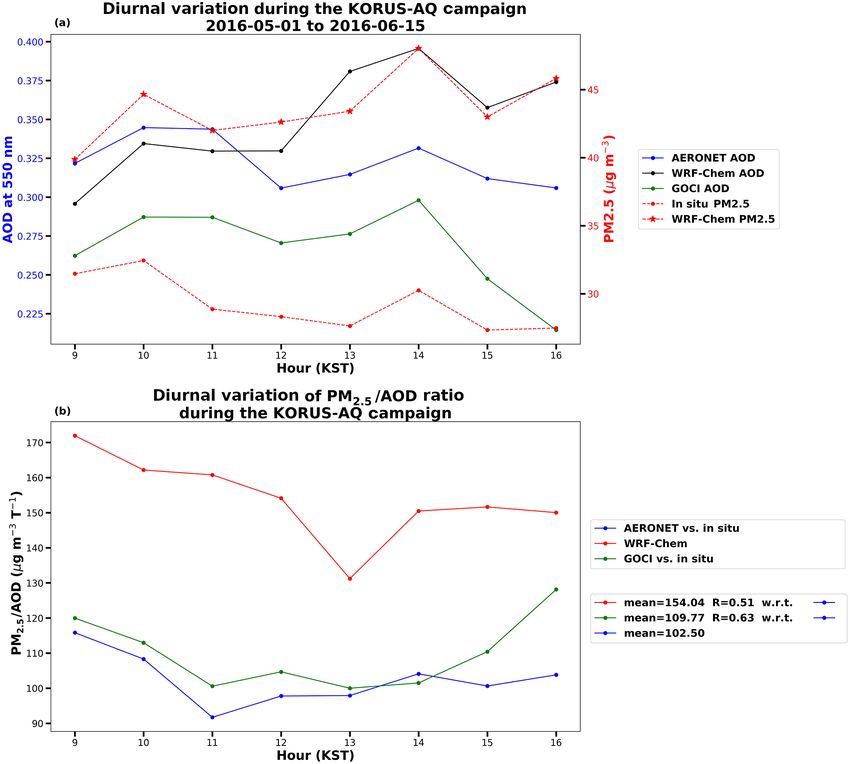
E. M. Lennartson et al.: Diurnal variation of aerosol optical depth                                                       15131

et al. (2010) and further developed into its version 1 (V1)       4     Methods and analysis
form in 2016 by Choi et al. (2016). The aerosol properties
from the retrieval include AOD at 550 nm, fine-mode frac-         4.1    Analysis of AOD diurnal variation
tion at 550 nm, single-scattering albedo at 440 nm, Ångström
exponent between 440 and 860 nm, and aerosol type.                The AOD at each hour is computed by using instantaneous
   Recently, the V1 algorithm has been enhanced to the            AERONET AOD measurements within ±30 min centered
version 2 (V2) algorithm and now includes near-real-time          over that hour. The hourly AOD for the same hour in differ-
(NRT) processing and improved accuracy in cloud mask-             ent days is then averaged to compute the climatological AOD
ing, determination of surface reflectance, and selection          for that hour; the baseline AOD for each hour is then used to
of surface-dependent retrieval schemes. The V2 algorithm          compute baseline daily-mean AOD, from which the diurnal
(Choi et al., 2018) uses the climatology of land surface re-      variation of AOD values for each hour can be subsequently
flectance that is obtained from the minimum reflectivity tech-    calculated. This is completed for the hours of 00:00–10:00
nique; in this technique, the minimum value of multiyear top-     and 21:00–23:00 UTC due to the conversion to Korea Stan-
of-the-atmosphere reflectances measured by GOCI (for each         dard Time. KST is 9 h ahead of UTC, so the diurnal variation
pixel, each month, and each hour) after Rayleigh correction       period extends from 07:00 to 18:00 KST, as the first and last
is considered as the surface reflectance (for that pixel, that    hour are excluded for a lack of observations.
month, and that hour). The V2 algorithm has shown sim-               Furthermore, to calculate the statistics for hourly varia-
ilar AOD values at 550 nm to MODIS and the Visible In-            tions, the percent difference from the (baseline) daily mean
frared Imaging Radiometer Suite (VIIRS). When validating          is computed. This is referred to as the percent departure from
with AERONET AOD from 2011 to 2016, the V2 reduced                average. Our methods here are similar to the methods from
median bias compared to V1, and 62 % and 71 % of the              Wang et al. (2004) and Smirnov et al. (2002). Hence, ex-
GOCI–AERONET AOD difference is within the expected er-            pressing the departure as a percent allows for comparison to
ror (EE) of MODIS dark target (DT) over land and ocean,           other AOD studies.
respectively. For this research, the GOCI YAER V2 AOD at             The original 22 AERONET sites are split into four land
550 nm data are downloaded for the KORUS-AQ campaign              classifications to further analyze and define trends amongst
from 1 May 2016 to 12 June 2016.                                  their AOD diurnal variations at 550 nm. The sites of Chin-
                                                                  hae, Korea University, and Kyungil University are excluded
3.4   PM2.5                                                       from the analysis due to the short data records, leaving 19
                                                                  AERONET sites. Each site’s full record of data is used in the
PM2.5 data are downloaded from the KORUS-AQ data repos-           calculation (Table 1). Figure 1 shows a summary of this clas-
itory for the entirety of the field campaign. The 10 sites        sification. Of the 19 sites, 3 are coastal urban, 5 are coastal
with a corresponding AERONET site nearby are used for             rural, 6 are inland urban, and 5 are inland rural.
this research (Table 2). The three sites of Busan, Gwangju,          Shown in Fig. 2 is the AOD diurnal variation and percent
and Seoul have multiple sensors within the city limits; thus,     departure from daily mean using the full record of data at all
their total number of observations during the KORUS-AQ            19 AERONET sites, split into land classification. The coastal
timeframe is much larger than the other seven sites. Addi-        rural sites show the most similarity amongst each other and
tionally, the Hankuk University of Foreign Studies (HUFS)         are characterized by AOD levels remaining virtually con-
site records data every minute while the others take hourly       stant throughout the day as their departure from the daily
measurements. All four land classifications are represented       mean is generally ±10 %. This feature agrees with Smirnov
within the group, although there is only one inland rural site.   et al. (2002), who also found that the Anmyon site, on the
All data during the KORUS-AQ timeframe are downloaded             western coast of the Korean Peninsula, has little to no diurnal
and the number of days with data ranges from 35 to 41. Over-      variation of AOD at 500 nm when investigating a multiyear
all, there are 51 monitors from Air Korea, 6 from the Na-         data record.
tional Institute of Environmental Research (NIER), 1 from            The AOD diurnal variation of the coastal urban sites is
the Seoul Research Institute on Public Health and Environ-        more pronounced with a departure from the daily average
ment (SIHE), and 1 from the HUFS. It should be noted that         at ±20 % and has fewer intra-class similarities as compared
51 of the 59 data files had quality control techniques applied    to the costal rural class. The KORUS NIER site has notice-
to them at the date of last access in August 2017.                ably higher values of AOD than the Gangneung or Pusan
                                                                  sites for the majority of the day until 18:00 KST. These sites
                                                                  are urban in nature and therefore have their own emissions
                                                                  characteristics, adding an additional layer of complexity to
                                                                  their distinctive diurnal variations. This could explain why
                                                                  the coastal urban sites experience more variation than the
                                                                  coastal rural sites. When focusing on the different diurnal
                                                                  variations amongst the coastal urban sites, we believe that

www.atmos-chem-phys.net/18/15125/2018/                                          Atmos. Chem. Phys., 18, 15125–15144, 2018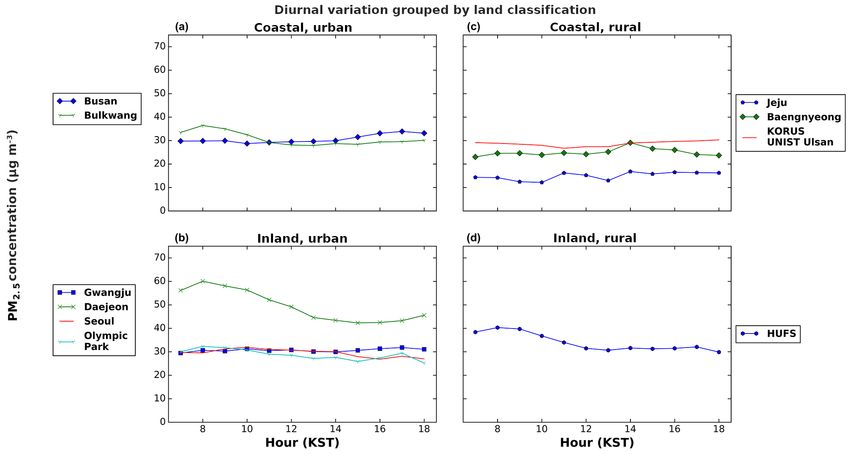
15132                                                                       E. M. Lennartson et al.: Diurnal variation of aerosol optical depth

Table 2. The 10 KORUS-AQ ground sites with PM2.5 data and their corresponding AERONET station.

          Land classification/         Full record                      NFull       AERONET site                     NDAYS         Hour(s) of        Hour(s) of
          PM2.5 site                                                                                                                  PM2.5             PM2.5
                                                                                                                                   minimum           maximum
                                                                                                                                      (KST)             (KST)
          Coastal, rural
          Baengnyeong                  05/08/16–06/12/16                   825      Baengnyeong                             36            7, 18                14
          Jeju                         05/08/16–06/12/16                   632      Gosan                                   35           10, 13            11, 14
          Ulsan                        05/09/16–06/12/16                   840      KORUS UNIST Ulsan                       35               11                18
          Coastal, urban
          Bulkwang                     05/08/16–06/12/16                 839        KORUS NIER                              36                13                8
          Busan (19)                   04/29/16–06/10/16a             19 192        Pusan                                   41                10               17
          Inland, rural HUFS           05/08/16–06/12/16             48 183b        KORUS Songchon                          36                18                8
          Inland, urban
          Daejeon                      05/08/16–06/12/16                  841       KORUS Iksan                             36               15                 8
          Gwangju (7)                  04/29/16–06/10/16a               6794        Gwangju                                 41                7                17
          Olympic Park                 05/09/16–06/17/16c                 917       KORUS Olympic Park                      38           15, 18             8, 17
          Seoul (26)                   04/29/16–06/10/16a              26 095       Yonsei University                       41               16                10
        a means that only data from 5/1/16–6/10/16 are used. b means that the data are for every minute versus the other data that are hourly, hence the large number
        of observations. c similarly means that only data from 5/9/16–6/15/16 are used since the KORUS-AQ timeframe is defined in this study as 5/1/16–6/15/16.
        Sites with a number in parenthesis denote how many individual stations were within that city, contributing to the higher number of observations.

the differences could stem from the site location. For exam-                              0.2–0.3 throughout the entire day. The other four locations
ple, the sites on the western Korean Peninsula (i.e., KORUS                               of Hankuk, KORUS Baeksa, KORUS Songchon, and KO-
NIER) are closer to Chinese emissions and may be impacted                                 RUS Taehwa have higher AOD values near 0.4–0.6 in the
more by long-range transport than the coastal urban sites on                              morning before decreasing throughout the day and eventually
the eastern Korean Peninsula (i.e., Pusan and Gangneung).                                 rising again in the early evening at 15:00–16:00 KST. The
When combined with local emissions, the external factors                                  only two exceptions to this trend are Hankuk and KORUS
could lead to a different diurnal variation than their counter-                           Songchon, located east-southeast of Seoul, which experience
parts on the eastern side of the country.                                                 slight noontime increases. After the late afternoon buildup,
   All six of the inland urban sites show remarkably sim-                                 most of the sites’ AOD decreases at 17:00–18:00 KST, again
ilar diurnal variations. Their AODs slightly decrease and                                 with the exception of Hankuk and KORUS Songchon. The
remain constant until the early afternoon at approximately                                inland rural sites have the most variation for their percent
14:00 KST when the AOD then gradually builds until                                        departure from average with some sites such as KORUS
18:00 KST. One outlier to this late afternoon building char-                              Baeksa and KORUS Songchon approaching −30 % at 12:00
acteristic is KORUS Olympic Park, whose AOD values drop                                   and 15:00 KST, respectively, and KORUS Daegwallyeong
between 17:00 and 18:00 KST. As a whole, their average de-                                staying between ±10 % with the exception of 16:00 and
parture from the daily mean is ±20 %, with the most negative                              17:00 KST.
values occurring in the midday (i.e, the inland urban sites ex-                              Overall, we see similar trends for the coastal sites and for
perience minima in AOD values during this time). The early                                the inland sites. The coastal urban and coastal rural sites have
morning and late evening increases could be attributed to an                              a lower average AOD value of 0.308 compared to the in-
increase in traffic and transportation demands. It is interest-                           land urban and inland rural sites whose average AOD value
ing to note that this common diurnal variation trend is seen                              is 0.386. Additionally, regardless of land classification, most
at sites that have as little as 4 months of data (i.e., KORUS                             sites see early morning and late afternoon AOD maxima and
Iksan) to more than 5 years of data (i.e., Gwangju and Yonsei                             noontime AOD minima. Factors influencing the diurnal vari-
University). Below in Sect. 4.3, we investigate this further to                           ation include length of the data record, number of available
quantify how long of a record is needed at each site to match                             measurements for calculating the hourly averages, and site
the diurnal variation produced by the full record.                                        location compared to those sharing its land classification.
   The five inland rural sites naturally divide into two groups.
KORUS Daegwallyeong, located on the eastern part of the
peninsula, shows a much lower magnitude of AOD around

Atmos. Chem. Phys., 18, 15125–15144, 2018                                                                       www.atmos-chem-phys.net/18/15125/2018/
E. M. Lennartson et al.: Diurnal variation of aerosol optical depth 15133
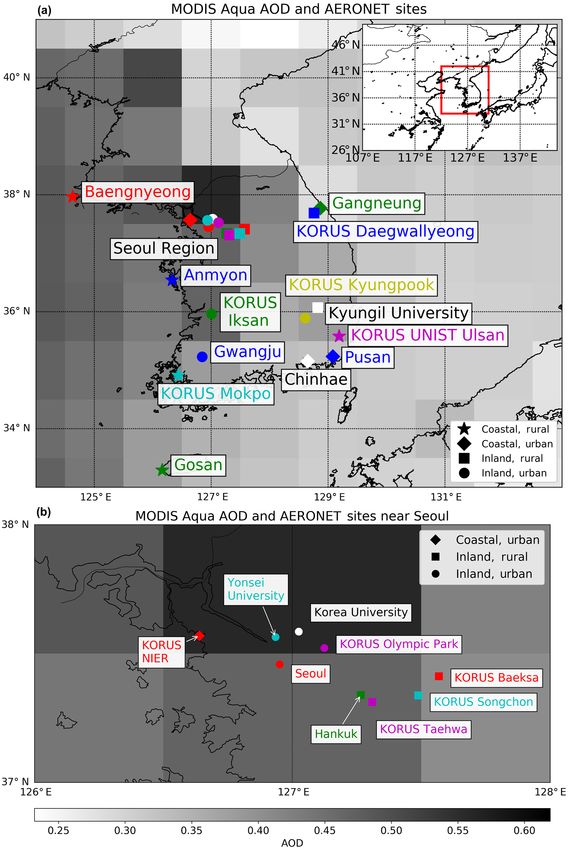
Figure 2. The AOD diurnal variation and percent departure from daily mean using the full record of AERONET AOD at 550 nm data for the
19 sites of interest.
4.2 Analysis of the Ångström exponent diurnal since the latter are typically smaller than their natural coun-
variation terparts (of dust and sea salt particles); this is especially true
for the KORUS-AQ because biomass burning sources in east
Asia in the growing season (e.g., the study period here) are
Similar to the AOD diurnal variation, each site’s full record minimal (Polivka et al., 2015).
of data is used to compute the diurnal variation of the All four land classifications show similar Ångström ex-
Ångström exponent. The same analysis procedure is used, ponent values in the range of 1.2–1.6 with the exception of
but, instead of calculating AOD at 550 nm, the only vari- lower values near 1.0 at the inland rural sites (Fig. 3). All six
able of interest is the Ångström exponent between 440 and of the inland urban sites experience a gradual increase in the
675 nm. The Ångström exponent is of importance since it Ångström exponent from 1.2 to 1.4 throughout the day. The
helps determine the aerosol’s source. It is inversely related to coastal urban sites are similar, as Pusan and Gangneung also
the average size of aerosol particles, so the smaller the par- see an increase in the Ångström exponent, but the KORUS
ticles, the larger the value. Generally speaking, an Ångström NIER site has a noticeable Ångström exponent maximum
exponent approaching 0 signifies coarse-mode or larger par- near 1.2 at 10:00 KST. Also, its values are lower than the
ticles such as dust, and an Ångström exponent greater than or other coastal urban or inland urban sites, with a range of 1.1
approaching 2 signifies fine-mode or smaller particles such to 1.2. However, the general trend of the coastal urban sites
as smoke from biomass burning and anthropogenic aerosols is that they too gradually increase in Ångström exponent as
(Wang et al., 2004). The size of the particle assists with the day progresses.
attributing the aerosol to natural or anthropogenic sources
www.atmos-chem-phys.net/18/15125/2018/ Atmos. Chem. Phys., 18, 15125–15144, 201815134 E. M. Lennartson et al.: Diurnal variation of aerosol optical depth
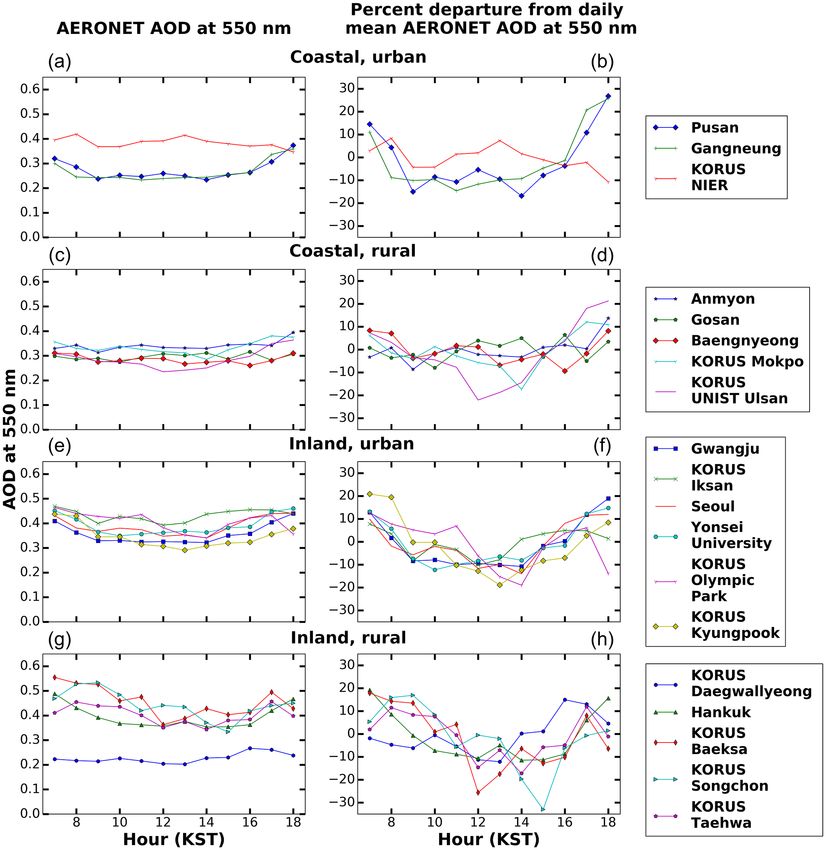
Figure 3. The Ångström exponent 440–675 nm diurnal variation using the full record of AERONET data for the 19 sites of interest.
Turning to the rural sites, all five of the inland rural sites there are underlying processes inherent with respect to a spe-
experience the same gradual rise throughout the day to 1.4 cific location to produce diurnal variation of AOD. For exam-
as the inland urban sites, but their values start a bit lower ple, in the agricultural burning seasons over Central America,
near 1.0 versus 1.2. The coastal rural sites hover ∼ 1.3 for AOD values often peak around late afternoon and are mini-
the majority of the day, with KORUS UNIST Ulsan experi- mal in the night before the Sun rises; this is because such
encing values as high as 1.5 from 12:00 to 16:00 KST before burnings often start in the late morning and diminish at night
dropping back down to 1.4 by 17:00 KST. The Ångström ex- (Wang et al., 2006). Hence, an intriguing question is how
ponent diurnal variation of the coastal rural sites is not as long our data record should be to obtain the climatological
pronounced as that in the other three land classifications that diurnal variation of AOD or aerosol properties. We address
all experience morning Ångström exponent minimums and this question by data collected at the five AERONET sites
gradually build throughout the day before plateauing. which have more than 5 years of data in their full record:
With the typical range of 1.2–1.6 experienced at most sites, Anmyon, Baengnyeong, Gosan, Gwangju, and Yonsei Uni-
it is concluded that the majority of aerosols over the Korean versity.
Peninsula are fine-mode particles with some coarser-mode To statistically compare how long of a data record is
particles seen overnight and in the early morning. As the day needed to match the climatological diurnal variation, we first
progresses, the particle size decreases due to secondary or- compute the statistics starting from the first month of the
ganic aerosol formation which leads to an increase in the data record to a certain number of months, n; hereafter, the
Ångström exponent. subset of the data is denoted as [1, n], with the first num-
ber being the starting month and the second number the last
4.3 Observation time for climatologically month in the subset. We then repeat the calculation by mov-
representative AOD diurnal variation ing the starting month (and ending month) with an increment
of 1 month each time, e.g., for the data subset [2, n + 1], [3,
In this section, we define the term “climatological diurnal n + 2], . . . , [N − n + 1, N ], where N is the total number of
variation”. This is the diurnal variation pattern produced at months of the whole data record. The average of diurnal vari-
each AERONET site in long-term averages such that it is ation statistics from each n-month data subset is then com-
relatively persistent and statistically robust. The concept is pared with statistics of diurnal variation from the whole data
similar to the concept of climatology of diurnal variation of record. The comparison reveals the degree to which the n-
2 m air temperature which, while varying with location, nor- month data record may describe the climatological diurnal
mally shows a peak in the afternoon and minimum before the variation derived from the full data record for a specific site
sunrise (Wang and Christopher, 2006; Aegerter et a., 2017). of interest. We then repeat the same process by increasing the
The concept of climatological diurnal variation of AOD or number of months for the subset (n) by 1 month, 2 months,
aerosol properties, therefore, builds upon the hypothesis that 3 months, etc., until the subset eventually grows to the full
Atmos. Chem. Phys., 18, 15125–15144, 2018 www.atmos-chem-phys.net/18/15125/2018/E. M. Lennartson et al.: Diurnal variation of aerosol optical depth 15135 record. It is expected that as n increases, the climatological data are needed to obtain statistically significant results for diurnal variation will be better characterized. characterizing the diurnal variation of AOD. The actual implementation of the method above requires One surprising finding, which is interesting to note, is that the removal of the gaps of missing data, e.g., months that coastal rural sites would require a record twice as long as that don not have observation. Hence, Anmyon, Baengnyeong, of the inland urban sites to match the climatological diurnal Gosan, Gwangju, and Yonsei University are left with full variation with R = 0.8 and p < 0.05. We thought that, due to records of 89, 53, 80, 82, and 71 months, respectively, for the complexity of the urban sites having both their own emis- the analysis. sions and those via background and transport, they would re- Figure 4 shows that as n, the number of months of observa- quire more data for a common trend to emerge. However, it is tion, increases, the diurnal variation being described by these in fact just the opposite, suggesting that the diurnal variation subset observations is in more agreement with the counter- of AOD in an urban setting is distinct and persistent. part from the full record, in terms of the linear correlation coefficient R, root mean square error (RMSE), and statistical 4.4 Analysis of WRF-Chem and GOCI AOD significance. The inland urban sites of Gwangju and Yonsei University have very similar results (Fig. 4d and e). Gwangju The WRF-Chem model provided hourly chemical weather requires 13 months of data to become significant (p < 0.05), forecasts from 1 May to 15 June 2016. Thus, this is de- or roughly 15.9 % of the full (82 months) record of data. fined as the KORUS-AQ timeframe, and spatial and tem- Yonsei requires 11 months of data, which is slightly lower porally matched data pairs between GOCI–AERONET and at 15.5 % of the record (of 71 months). Additionally, they WRF-Chem–AERONET are analyzed. GOCI AOD data are both have an R value around 0.8 at the occurrence of the rarely captured eight times per day due to clouds, and the first significance, and their results become significant shortly AERONET data undergo their own quality control algo- after the RMSE and R-value graphs intersect. We conclude rithms to ensure cloud-free conditions. In contrast, the WRF- that the inland urban sites require 10–12 months of data to Chem data are available for every hour during the timeframe match the climatological diurnal variation with an R value of of interest. Due to these factors, the intercomparison dataset 0.8 and p < 0.05. Additionally, they require 45–47 months of is the smallest between AERONET vs. GOCI (1583 data data for an RMSE
15136                                                       E. M. Lennartson et al.: Diurnal variation of aerosol optical depth

Figure 4. Establishing how long of a record of data is needed to match the climatological AOD at 550 nm diurnal variation. Anmyon,
Baengnyeong, and Gosan are all coastal, rural sites. Gwangju and Yonsei University are inland, urban sites. The R value 5 is in blue, the
RMSE value is in red, and the p value corresponds to the marker characteristic. A filled-in marker represents p < 0.05 and an open marker
represents p > 0.05.

Figure 5. AERONET vs. WRF-Chem (a) and AERONET vs. GOCI AOD (b) at 550 nm for the KORUS-AQ Campaign from 1 May to
15 June 2016. Only the temporally and spatially matched data are used. The point color corresponds to the number of observations within
that area. Also shown is the AERONET vs. GOCI AOD after the latter is added by 0.04 (c).

Atmos. Chem. Phys., 18, 15125–15144, 2018                                              www.atmos-chem-phys.net/18/15125/2018/
E. M. Lennartson et al.: Diurnal variation of aerosol optical depth                                                        15137

   Figure 6a shows that WRF-Chem both over- and underpre-
dicted AOD values during the campaign, and there is no clear
indication that the WRF-Chem performed consistently better
for certain land classification (within the 15 sites we ana-
lyzed). For example, looking at the inland urban sites, WRF-
Chem underpredicted two sites (KORUS Olympic Park and
KORUS Iksan), overpredicted two sites (Gwangju and KO-
RUS Kyungpook), and had no bias at one site (Yonsei Uni-
versity). The R values range from 0.15 to 0.7 with the ma-
jority of points between 0.15 and 0.4. Lastly, there is an even
distribution of sites where the WRF-Chem standard deviation
is higher than or less than the AERONET standard deviation.
   Figure 6b shows the relationship between AERONET and
GOCI at the same 15 sites during the KORUS-AQ campaign.
Here, we see that only three sites (Baengnyeong, KORUS
NIER, and KORUS Daegwallyeong) had a positive bias and
thus were overestimated by GOCI. Noticeably different from
Fig. 6a is the shifted R-value range, now extending from 0.35
to 0.9 but concentrated within 0.7 to 0.9. Another interesting
difference is that the GOCI standard deviation was greater
than the AERONET standard deviation at all 15 sites, sug-
gesting GOCI AOD tends to amplify the temporal variation
of AOD and could be attributed to larger random errors than
AERONET AOD.

4.5   PM2.5 diurnal variation

Table 2 lists information for all PM2.5 sites, including their
full record of data, the number of recorded observations
within that full record, the nearby AERONET station, the
number of days having data recorded, and the hours of min-
ima and maxima for PM2.5 . A total of 9 of the 10 sites re-
ported data in hourly averages. For the HUFS site whose
data were reported every minute, the hourly averages are cre-
ated by computing the mean of the data in that hour, as is
done by most analyses of hourly PM2.5 . Again, only 07:00–
18:00 KST is analyzed for PM2.5 .
   As seen in Fig. 7, the PM2.5 diurnal variations are sur-       Figure 6. Taylor diagrams of (a) AERONET AOD vs. WRF-Chem
prisingly invariant given the short timeframe of interest         AOD and (b) AERONET AOD vs. GOCI AOD.
(the 6-week KORUS-AQ field campaign). One would ex-
pect that, as the data timeframe decreases, the fluctuations
would increase. However, this is not the case for PM2.5 .         are varied in concentration and each with its own unique pat-
The coastal urban sites of Busan and Bulkwang remain near         tern. The KORUS UNIST Ulsan site has the highest con-
30–35 µg m−3 throughout the day (Fig. 7a). Bulkwang does          centrations near 30 µg m−3 but exhibits little to no fluctua-
slightly increase at 08:00 KST but then returns to the con-       tions throughout the day. The Baengnyeong site has the sec-
stant value of 30 µg m−3 by 11:00 KST. The inland urban           ond highest concentrations near 25 µg m−3 with a 14:00 KST
sites (Fig. 7b) closely resemble the coastal urban sites in       maximum. Jeju has the lowest concentrations near 15 µg m−3
diurnal pattern and value except for Olympic Park. Its val-       on average, with maxima at 11:00 and 14:00 KST and with
ues were double the other inland and coastal urban sites at       minima at 10:00 and 13:00 KST; the difference between
60 µg m−3 at its 08:00 KST maximum. Concentrations then           maxima and minima is within 4 µg m−3 (or ∼ 10–12 % from
drop to near 45 µg m−3 for 13:00–18:00 KST. Olympic Park          the mean), suggesting an insignificant pattern for diurnal
shows the most fluctuations throughout the day in its PM2.5       variation. HUFS, the inland rural site (Fig. 7d), fluctuates be-
concentrations.                                                   tween its 08:00 KST maxima near 40 µg m−3 and drops to
   The coastal rural sites (Fig. 7c) of Jeju, Baengnyeong, and    a concentration near 30 µg m−3 by 12:00 KST and remains
KORUS UNIST Ulsan split into three diurnal variations that        there for the rest of the day.

www.atmos-chem-phys.net/18/15125/2018/                                          Atmos. Chem. Phys., 18, 15125–15144, 2018
15138                                                          E. M. Lennartson et al.: Diurnal variation of aerosol optical depth

Figure 7. The PM2.5 diurnal variation using the 10 KORUS-AQ ground sites that have a corresponding AERONET station nearby. The 24 h
PM2.5 air quality standard in South Korea is 50 mg m−3 and the WHO recommendation is 25 mg m−3 .

Figure 8. The diurnal variation of R 2 for PM2.5 for the sites in Table 2.

   Overall, Fig. 7 shows PM2.5 values generally have dual                    lation between hourly PM2.5 variation and daily-mean PM2.5
peaks, with the strongest peak in the morning hours (08:00–                  variation (Fig. 8) has the highest R 2 value above 0.8 at noon-
10:00 KST) and a weak peak in the early afternoon hours                      time, decreases toward early morning and late afternoon,
(around 14:00 KST). However, such a pattern does vary by                     and reaches the minimum at midnight, which suggests that
station and can be insignificant in most sites. A total of 7                 daytime variation of emission and boundary layer processes
of the 10 sites have stagnant PM2.5 values near 30 µg m−3                    are the dominant factors affecting day-to-day variability of
throughout the entire day. The other three sites, Bulkwang,                  PM2.5 .
Daejeon, and HUFS, all have morning PM2.5 maxima at
08:00 KST before dropping to stagnant values by 13:00 KST.
Daejeon experiences abnormally high PM2.5 concentrations
with values peaking near 60 µg m−3 . For all sites, the corre-

Atmos. Chem. Phys., 18, 15125–15144, 2018                                                    www.atmos-chem-phys.net/18/15125/2018/
E. M. Lennartson et al.: Diurnal variation of aerosol optical depth                                                      15139

4.6   The AOD–PM2.5 diurnal variation relationship                counterparts show the opposite. Hence, the comparison and
                                                                  contrast analyses of both AOD and PM2.5 suggest further
Here we study which data source (from GOCI or WRF-                studies for the diurnal variation of emissions in WRF-Chem.
Chem) either predicted or retrieved the AERONET AOD val-             In general, the diurnal variation of AERONET AOD (av-
ues better. We also compare the AOD diurnal variation to the      eraged over all sites) fluctuates the least throughout the day
PM2.5 diurnal variation. In Fig. 9, the diurnal variations are    with a percent departure from the daily mean of ±6 %. WRF-
shown for AERONET, WRF-Chem, GOCI, observed PM2.5 ,               Chem fluctuates ±8 % while GOCI shows the most variation
and WRF-Chem-predicted PM2.5 for the sites that have all          at +9 % to −30 % due to an outlying low value at 16:00 KST.
five dataset available (i.e., the sites listed in Table 2). All   Similar to AERONET and WRF-Chem, the PM2.5 percent
data are temporally and spatially matched. Due to its re-         departure from daily mean ranges from ±8 %.
trieval times, GOCI’s AOD diurnal variation only extends             Figure 9b displays the diurnal variation of the
from 09:00 to 16:00 KST, thus only 09:00–16:00 KST is used        PM2.5 / AOD ratio derived from WRF-Chem and col-
for AERONET and WRF-Chem as well.                                 located AERONET AOD vs. in situ PM2.5 ratio and
   The GOCI AOD values better matched the observed                GOCI AOD vs. in situ PM2.5 ratio measurement through-
AERONET AOD diurnal variation. As seen in Fig. 9a, al-            out the KORUS-AQ campaign. The comparison of the
though hourly GOCI AOD has a systematic low bias of               PM2.5 / AOD ratio is valuable because satellite AOD often
0.04–0.09 with respect to the AERONET counterparts, the           is used to multiply this ratio to derive surface PM2.5 .
GOCI AOD diurnal variation (green line) mirrors that of           Overall, the WRF-Chem PM2.5 / AOD ratio (with a mean
AERONET (blue line) for the entire day, showing low val-          of 154 µg m−3 τ −1 ) is 30 %–50 % larger than and shows
ues around noon and dual peaks (one in 10:00–11:00 KST)           temporal disparity with the observed counterparts (with a
in the morning and (another 14:00 KST) in the afternoon, re-      mean of 110 and 103 µg m−3 τ −1 , respectively); it shows a
spectively; both GOCI and AERONET show that the min-              steady decrease from morning to the late afternoon, while
imum AOD is in the late afternoon at 16:00 KST, although          the observation-based ratios (based on GOCI or AERONET
GOCI shows a relatively larger decrease in AOD from 14:00         AOD vs. in situ PM2.5 ) are consistent with each other in
to 16:00 KST. In contrast, while WRF-Chem AOD values are          terms of mean (with correlation of 0.63, Fig. 9b) – they
consistent with GOCI and AERONET to describe the dual             first decrease in the morning, reach the minimum in the late
peaks and low AOD values around noon, a much stronger             morning (11:00 KST), and then increase steadily toward
peak at 16:00 KST (than that at 10:00 KST) in WRF-Chem            the late afternoon. However, there is no apparent trend
differs from GOCI and AERONET (both of which show                 between the PM2.5 / AOD ratio and time of day at individual
comparable dual peaks). Furthermore, WRF-Chem shows               sites (Fig. 10). Additionally, the correlation between the
a relative increase in (minimum) AOD at 09:00–15:00 and           WRF-Chem ratio and the observed ratio (Fig. 10) can vary
16:00 KST, while GOCI and AERONET both show the de-               from 0.28 to 0.78, depending on the specific location of
crease with minimum AOD at 16:00 KST. Hence, it is hy-            each site (Fig. 10). Except Daejeon for some hours and one
pothesized that the diurnal emission in WRF-Chem may have         outlier at a particular hour in the Gwangju site (Fig. 10),
an overly strong tendency toward afternoon emission; indeed       all other sites show that WRF-Chem’s PM2.5 / AOD ratio
WRF-Chem AOD is comparable to AERONET AOD values                  is larger than observation-based counterparts, with the
in the morning, but shows a large positive bias up to 0.08 in     majority of the ratios ranging from 60 to 140 µg m−3 τ −1
the late afternoon. This hypothesis needs to be further stud-     with outliers as low as 40 and as high as 160 µg m−3 τ −1
ied.                                                              (Fig. 10). The three coastal rural sites of Baengnyeong, Jeju,
   Also plotted in Fig. 9a is the average observed and            and Ulsan have ratio maximums both in the morning (07:00,
WRF-Chem-predicted PM2.5 diurnal variation of the 10              08:00, and 10:00 KST) and early evening (17:00 KST). Their
PM2.5 sites. The observed concentrations peak at 10:00 KST        minimums range from morning (09:00 KST) to noontime
with a value approaching 33 µg m−3 , but drop to less than        and late afternoon (16:00 KST). The two coastal urban sites
28 µg m−3 by 13:00 KST, and then peak again to 30 µg m−3          of Bulkwang and Busan show more similarities with peaks
at 14:00 KST. The WRF-Chem-predicted PM2.5 is system-             in the early morning (08:00 and 09:00 KST) but still have
atically higher than observed PM2.5 by 10–15 µg m−3 , but         a minimum range from noontime to afternoon (12:00 and
it has similar dual peaks at 10 and 14:00 KST. Similar to         15:00 KST). The inland urban sites have morning (09:00
AOD, WRF Chem showed that the peak at 14:00 KST is ∼              and 10:00 KST), afternoon (13:00 KST), and early evening
3 µg m−3 higher than the peak at 10:00 KST, while observed        (17:00 and 18:00 KST) maximums but cohesively have
PM2.5 data show that the peak at 14:00 KST is ∼ 5 µg m−3          a 15:00 KST minimum, aside from Gwangju whose ratio
lower than the peak at 10:00 KST. Furthermore, WRF-Chem           steadily increases after 10:00 KST. Being the only inland ru-
shows an increase in PM2.5 from 11:00 to 13:00 KST while          ral site, the PM2.5 / AOD at HUFS has maxima at 08:00 KST
the observed PM2.5 showed the opposite. Overall, the ob-          and steadily decreases afterward for the remainder of the
served PM2.5 concentrations decrease from morning (09:00–         day. Consequently, given the large spatial and temporal
10:00 KST) to evening (15:00–16:00 KST), but WRF-Chem             variations of the PM2.5 / AOD ratio, diurnal variation of

www.atmos-chem-phys.net/18/15125/2018/                                          Atmos. Chem. Phys., 18, 15125–15144, 2018
You can also read