MEASURING THE IMPACT OF EFL CLUBS IN THE COMMUNITY - Argyle ...
←
→
Page content transcription
If your browser does not render page correctly, please read the page content below
1

MEASURING THE
IMPACT OF EFL CLUBS
IN THE COMMUNITY

Knight, Kavanagh and Page (January 2020)
Contents

MEASURING THE
IMPACT OF EFL
CLUBS IN THE
COMMUNITY

2
Measuring The Impact Of EFL Clubs In The Community

                                  CONTENTS

                                  Executive summary                 5

                                  1.       Background              8

                                  2.       Demographic Context     14

                                  3        Resource Allocation     20

                                  4        Clubs & Players         26

                                  5        Outputs/Outcomes        32

                                  6        Strategic Alignment     50

                                  7.       Summary & Conclusions   56

Knight, Kavanagh and Page (January 2020)                            3
Glossary And Data Notes

GLOSSARY:
The majority of terms used throughout the report        PFA data: is based on all EFL Clubs and the value
are explained the first time that they occur as         placed on player time has been agreed with the PFA
are the data sources. However a few of the more         as a reasonable reflection covering all EFL divisions
frequent terms, and those around which it is best to    and across the range of senior, junior, male and
clarify distinctions in order to avoid confusion, are   female players involved in community engagement.
outlined below.
                                                        Financial data: The following guideline was issued
Engagement hours – the programmes/activities            to each CCO: ‘All the financial and project data that
delivered by CCOs usually involve a number of           you provide must relate to the same (and most
sessions in which people take part. The length (time)   recent) 12-month period for which you have it.
and number of sessions varies from programme to         Although, ideally this will be 2018, it is recognised
programme. This aspect of programme delivery is         that the start/end points for the 12-month cycles to
seen as engagement and usually takes place with         which CCOs work can vary. What is most important is
groups of people. Engagement only ever sums to a        for the data you provide to be internally consistent
total of 100%.                                          and that the timeframe to which it applies is clear.
                                                        Provided that it is accurate and, again, reflects the
Participants – individuals take part in programmes/     relevant 12 month timeframe, financial data need
activities, however, as people can take part in more    not be drawn from published/audited accounts,
than one activity and a programme can be delivered      particularly if this enables the fullest, current available
in more than one environment, this means that           project and participation data to be provided’.
they can be counted more than once – ‘totals’ can
legitimately, therefore, exceed 100%.                   The English Indices of Deprivation – 2019: (Ministry
                                                        of Housing, Communities and Local Government), is
Participation (hours) – this is a measure of the time   the sixth iteration since 2000. It provides a unique
associated with people taking part in activities.       measure of relative deprivation for 32,844 small
As programmes often involve large numbers of            areas across England by using 39 measures to build
people, the multiplication of engagement hours          seven different domains; these cover:
by the number of participants can result in large       •   Income
numbers of participation hours.                         •   Employment
                                                        •   Education, skills & training
A worked example of the maths involved is shown
in ’Understanding the numbers’ (page 12). This is       •   Health & disability
particularly important given the sheer scale of the     •   Crime
numbers and multipliers involved in the data.           •   Barriers to housing & services
                                                        •   Living Environment
Person week – defined as 37.5 hours a week (based
on 7.5 hours per day).                                  The Index of Multiple Deprivation (as used in this
                                                        report along with health deprivation) combines the
DATA NOTES:                                             seven domains and ranks every small area from 1
                                                        (most deprived) to 32,844 (least deprived). If, for
                                                        example,40% of the population in a catchment
Sample size: In 2018/19 there were 72 Clubs in the
                                                        zone around a CCO live in areas that are in the two
EFL Championship, League One and League Two.
                                                        lowest cohorts (ranges of 10%) this indicates an
The research achieved a very high response rate and
                                                        overall deprivation rate of double the national
the majority of findings that follow are based upon
                                                        average.
the returns from 45 Clubs (63%) and 67 CCOs (93%)
that replied to the surveys.
                                                        Rounding of data: on a small number of occasions in
                                                        the report there are minor variations in data/totals
Factoring up for non-response: Several headline
                                                        (+/-1); these are due to rounding up or down.
indicators have been provided based on data that
has been factored up to cover those Clubs/CCOs that
did not reply.

4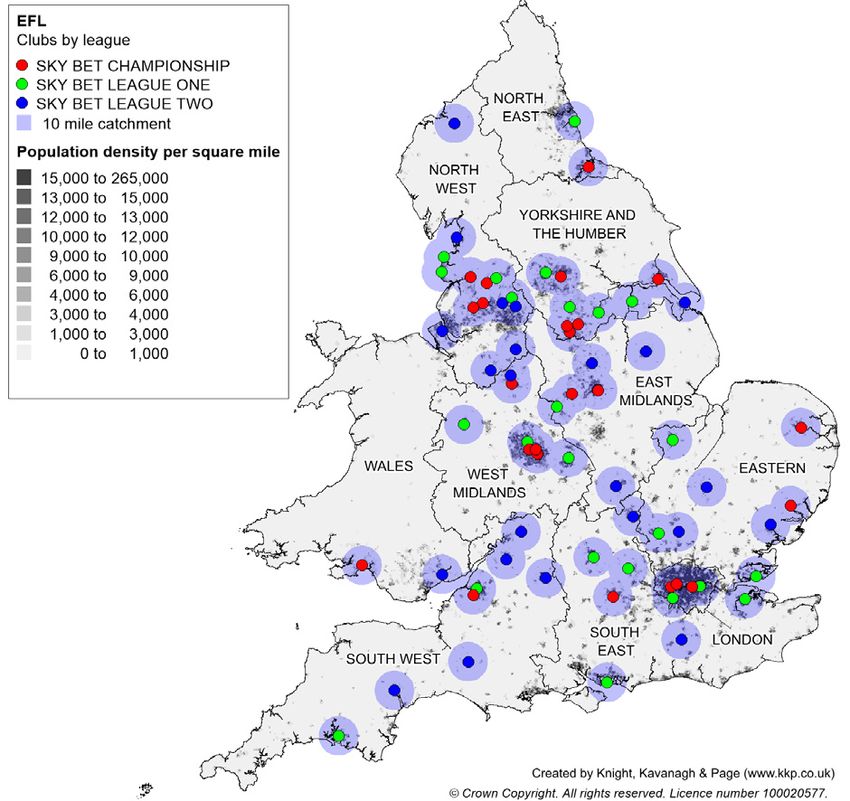
Measuring The Impact Of EFL Clubs In The Community

EXECUTIVE SUMMARY
CONTEXT                                                       INPUTS (sample size = 45 Clubs and 67 CCOs)
This study into the social and community impact of            Finance, balances and funding (Source: CCO accounts data)
projects and initiatives delivered by EFL Clubs and           •       CCO income (based on financial accounts data) is
their Club Community Organisations (CCOs) was                         £71,412,684 p.a.
commissioned by the EFL and conducted by specialist           •       EFL Trust funding of CCOs totals £16,301,470 p.a.
sport and leisure management consultancy Knight,
                                                              •       Expenditure totalled £69,771,686 p.a.
Kavanagh and Page, in conjunction with the EFL
Tust, in 2019.                                                •       £59,544,636 (85.3%) of this expenditure is directly
                                                                      linked to community engagement2.
Initial pilot work (with eight Clubs and CCOs) was            •       £10,277,049 (14.7%) is spent on support costs;
followed by a data collection exercise involving              •       £1,640,998 (2.4%) of the original income remains as
all EFL member Clubs and CCOs in season 2018/19.                      a positive net-balance.
This comprised individual surveys, data collection
from the PFA and demographic profiling of the                 Funding is derived from a wide range of sources,
catchment zones of individual EFL Clubs/CCOs and              including the EFL Trust core and project specific
the network as a whole.                                       funds, Premier League Charitable Fund (PLCF),
                                                              colleges and schools, government departments,
The results will help Clubs, CCOs, the EFL and EFL            sponsors, fundraising events, donations and
Trust to increase their:                                      participants themselves.

Profile: when/by presenting projects and                      Staff and facilities
their impacts;                                                •       3,562 people work either directly or indirectly on CCO
                                                                      delivered projects.
Influence: strengthening individual and                       •       2,827 of these are employed by CCOs.
collective case making, bids for resources, lobbying,
                                                              •       4,891,365 hours (equivalent to 130,436 person weeks)
seeking sponsorship etc.                                              of community related work are delivered by this

Sustainability: by illustrating sound business                        workforce per annum.

principles and value for money.                               Clubs and players
Football Clubs and their CCOs are ideally positioned to       In addition to affiliation with the Club’s name and
address a wide range of community and social needs.           heritage, CCO’s can benefit from ‘in-kind’ support
The initiatives they deliver impact upon all parts of local   (such as pitches, training spaces and meeting
communities, irrespective of age, gender, ethnicity,          rooms) and player time.
personal health and issues associated with deprivation.       •       Players were involved in community initiatives
They successfully engage with groups that many other                  (health, education, social inclusion, anti-racism,
programmes fail to reach. Key indicators include:                     promotion of women, girls and disability football
                                                                      etc.) on c.30,000 occasions.
      18.4 million attendances at EFL home games
                                                              •       The estimated value3 of this commitment by players
      (2018/19).
                                                                      is £5.96m.
      36.6 million (61.9%) people living within
      ten miles of an EFL ground.

Clubs and CCOs are therefore ideally placed to work
in/with people living in areas where:
•   Four in 10 residents fall into the most-deprived
    population groups1;
•   Earnings are frequently below average;                    1
                                                                  Based on the three most deprived population cohorts according to the
                                                                  English Indices of Deprivation (2019)- Ministry of Housing, Communities
•   70% of claimants for Universal Credit live;                   and Local Government.
                                                                  This figure differs by c.£1m from the funding linked to projects covered by
•   People are more likely to have lower physical activity
                                                              2

                                                                  this study, this is an average of 1.4% per CCO and reflects smaller initiatives
    rates and to be overweight or obese.                          and those projects that did not fit withing the timeframe of the study.
                                                              3
                                                                  Approach to measurement of value agreed with PFA.

Knight, Kavanagh and Page (January 2020)                                                                                                       5
Executive Summary

OUTPUTS AND OUTCOMES (sample size = 67 CCOs)
PEOPLE:
825,013 people took part in a wide range of activities; many participating in more than one
setting and/or type of activity:
                              429,973                   took part in sport and physical activity;

                              152,796                   in health and wellbeing initiatives;

                              240,976                   in education and employability projects; and

                              197,255                   in community engagement.

ENGAGEMENT – GROUP ACTIVITY:
523,107 hours of group activity were delivered, comprising:
                                181,011                 hours of sport and physical activity projects;

                                49,830                  hours directed at health and wellbeing;

                               207,373                  hours on education and employability schemes; and

                                84,893                  hours of community engagement.

OVERALL PARTICIPATION – INDIVIDUAL HOURS:
Taking into account the overall number of sessions delivered, session duration and the number
attending, Clubs/CCOs delivered                        38,625,539 person hours of participation                                      4
                                                                                                                                         comprising of:

                      18,050,788                        on sport and physical activity;

                       2,407,979                        on health and wellbeing;

                       9,654,379                        on education and employability; and

                       8,512,393                        on community engagement

PROJECT FUNDING:
In all,    £58,480,594 was spent directly on projects, comprising;
                 £16,560,445                            on sport and physical activity;

                   £4,442,101                           for health and wellbeing;

                  £18,077,378                           on education and employability; and

                 £19,400,669                            for community engagement.

4
    The relationship of projects is, however, too complex to simply multiply the numbers shown above – a detailed explanation is provided in the full report’s
    methodology section.

6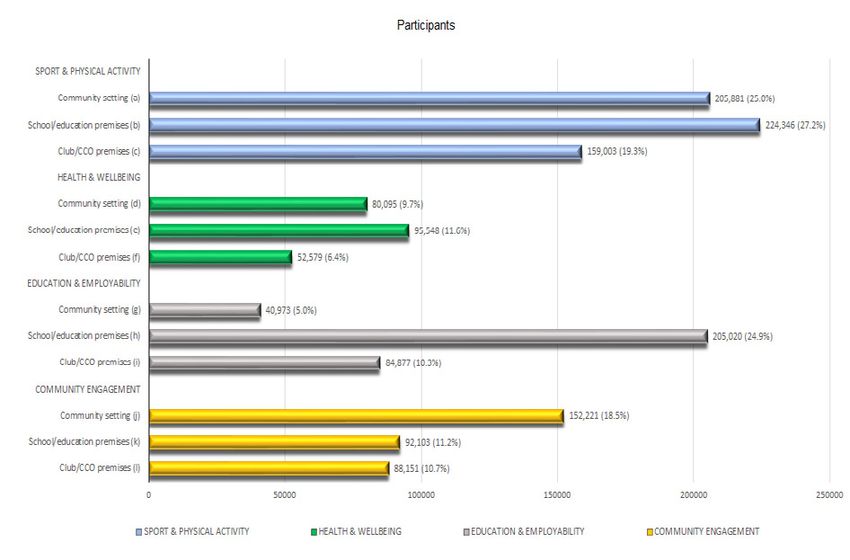
Measuring The Impact Of EFL Clubs In The Community

FACILITIES:
Access to Club/CCO facilities often removes (or alleviates) a cost burden that might otherwise prevent
activity from taking place. The study recorded 396 facilities (pitches, sports halls, meeting rooms etc.)
that are used by CCO’s for community related activities;. Key findings as below:

                         118,502                       occasions on which facilities were let/used;

                          62,509                       times where the ‘let’ was subsidised or free;

                      2,006,438                        attendances5 (making use of facilities);

                       1,003,567                       of which involved free or subsidised access;

                     £4,688,160                        is generated as income for Clubs and/or CCOs; and

                     £2,391,234                        is the equivalent value of the subsidised/free access provided to the
                                                       CCO and or local communities.

ONGOING INVESTMENT:
£18,727,750            continuing investment in the form of capital funding grants to Clubs & CCOS for
facilities that can also be used for the benefit of local communities & schools was identified in 2018/19.

ALIGNMENT WITH EFL TRUST STRATEGIC OBJECTIVES
Many programmes and initiatives delivered by Clubs and CCOs support the EFL Trust’s strategic
objectives (Sept. 2019), as shown by the following examples:

                                    Target:            To raise aspirations and help realise potential
                                    Target:            To build stronger and more cohesive communities
                                    Target:            To improve health and wellbeing
                                    Target:            To support and ensure the viability of the network

CONCLUSIONS:
When factored up to cover                 all EFL Clubs/CCOs6 key figures show:
                     886,581                           people taking part in activities;

                      562,145                          hours of group activity being delivered;

                  41,508,044                           hours of participation by individuals; and

                 £62,844,816                           spent directly on community and social projects covered by this study.

The EFL Trust and its constituent CCOs represent an existing network that already successfully engages with a
diverse mix of people who live within many of the country’s most deprived areas; they sit close by two thirds of
the nation’s population and, based on the data, appear to be achieving this success very cost effectively and,
more importantly, are supporting and changing people’s lives for the better.

5
    Based on the estimated number of users for each facility, see main report for detailed assumptions.
6
    The following Clubs did not respond to the survey – Aston Villa, Gillingham, Ipswich Town, Sheffield United, Yeovil Town. Ipswich Town did not have a
    CCO in place at the time of the survey.

Knight, Kavanagh and Page (January 2020)                                                                                                                    7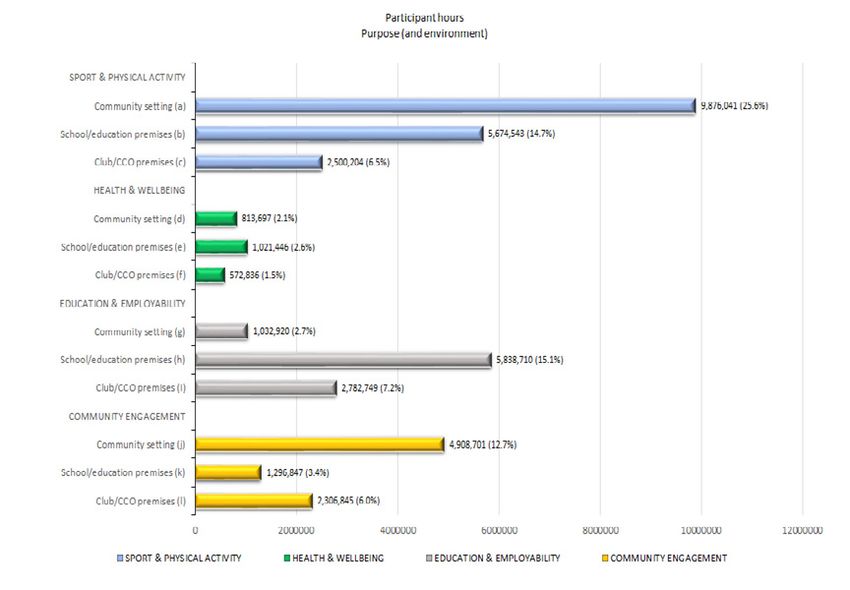
Section One: Background

1. BACKGROUND
Overview

This section looks at why better data is needed and how it might
be used. It outlines how the impact research programme was
developed and implemented, followed by an overview of the
type of data collected and how it has been structured.

This Section Covers:

•     The reach of EFL Clubs into communities throughout
      the country.

•     The main reasons for doing the research.

•     How appropriate measures were chosen.

•     The project methodology and research framework.

•     Key considerations in gathering the data.

•     Data structures and outputs.

8
Measuring The Impact Of EFL Clubs In The Community

1. BACKGROUND
Around 18.4 million people attended EFL          confirms its key strengths and their ability
games in 2018/19 and 36.6 million (61.9%)        to promote community engagement,
people live within 10 miles of an EFL ground.    improve health and wellbeing, enable
                                                 education, increase employability and
These two figures alone illustrate just how      encourage sport and physical activity.
well situated EFL Clubs and their associated
CCOs are geographically throughout               This process has been designed to measure,
England and Wales. The direct link               consistently across CCOs, the number of
between EFL Clubs and CCOs also enables          participants involved in activities, the
them to use their locally unique profile and     duration of time for which they take part
influence to engage with people that other       and, alongside this, the value of subsidised
organisations may find it difficult to reach.    and free access to facilities.

Clubs and CCOs generally evaluate their          For the first time this study is able to
work in some form and have a perspective         present a full national picture of the work
on the scale and reach of their services and     being undertaken by EFL Clubs and CCOs.
programmes but they are not always in a
position to fully quantify this.

The EFL understands the importance
of Club/CCO delivered community
programmes and is keen to improve the
consistency with which this is measured and
assessed. A sound, reliable basis for analysis
of impact is essential to future processes to
determine and calculate value.

Specialist sport and leisure management
consultancy Knight, Kavanagh & Page
was commissioned to deliver the first
comprehensive assessment of Club/
CCO projects and their impact on local
communities.

The outcome is a large body of evidence of,
and a consistent set of metrics via which
to measure, EFL Club/CCO community
intervention outputs. This allows us to start
to gauge the overall level and value of work
delivered in the community. The evidence

Knight, Kavanagh and Page (January 2020)                                                        9
Section One: Background
METHODOLOGY
The process commenced with an initial analysis of work undertaken by KKP on individual Clubs/CCOs, and of
the types of activities being delivered during the 2018/19 season.
PILOT PROJECT
Site visits were then made to eight Clubs/CCOs to enable an in situ assessment of the work being done, at
a broadly representative cross-section of EFL Clubs with differing levels of EFL tenure, in varying locations
across England and across the three divisions7.
The eight Clubs and CCOs were:
• Macclesfield Town;
• Middlesbrough;
• Nottingham Forest;
• Plymouth Argyle;
• Portsmouth;
• Stevenage;
• Tranmere Rovers
• Yeovil Town
Meetings with Club chairmen and CEOs, heads of CCOs and key staff ensured that a wide range of views and
perspectives were considered and taken account of.
DATA COLLECTION TEMPLATES AND SYSTEM
Brief questionnaires and a spreadsheet were drawn up by KKP working closely with the EFL and EFL Trust.
These, along with a framework for project and initiative categorisation, were tested with the pilot Clubs
which confirmed that the right data was being sought and the approach was appropriate.
Having agreed on the data to be collected and a report structure, suitable methods for data collection,
processing, data structure and analysis were developed.
7
Yeovil Town was, at the time of the pilot exercise, in EFL League 2; it has since been relegated to the National League.
10Measuring The Impact Of EFL Clubs In The Community
RESEARCH FRAMEWORK
The key sources and approaches to gather the necessary data agreed as follows:
Club survey – community related investment (actual and in-kind), staff time spent on community
initiatives, Family Excellence Scheme (FES), community/charity related income.
CCO survey – staff resources, facilities (Club and CCO) used for community engagement, capital
funding initiatives for future community and school use.
CCO spreadsheet – projects classified by their:
• Main purpose;
• The environment in which they are delivered;
• Type and scale of engagement (number of participants/participant hours, activity duration, personal
qualifications gained etc.);
• Cost/value of provision;
• Financial support, the funding underpinning specific projects;
• Key performance indicators for each project; and
• Annual accounts – for the same timeframe as the above data.
PFA player engagement data – covering social inclusion, anti-racism, health, education, girls/
women’s and disability football, soccer schools and matchday activities.
Population profile - for each CCO catchment zone (self-defined) covering census, health, deprivation,
crime, benefits dependency and physical activity/inactivity data.
The roll
2019 out to all EFL Clubs and
INSIGHT CCOs
AND started
IMPACT REPORT at the end of April APPENDICES
2019. 2019
STRUCTURING DATAof the data
APPENDIX 1: Structure Struc
Structuring data
The process
The processlooks
looks toto examine
examine community
community engagementengagement in terms
in terms of who, what, of who,
why, where, what,
when and how?why, where, when and how?
Main research considerations Main research considerations
INFORMATION &
DATA COLLECTION
DELIVERY SCALE OF
ENVIRONMENT INITIATIVES
DELIVERED
Club/CCO Number of Sessions
Schools/Education Time/Activity Duration
Community Number of Participants
Health & Wellbeing Project Funding
Avo
Parti
parti
Care
Education & Employability Additional Funding Indiv
rathe
Community Engagement Sources prefe
Sport &
Participation
The s
STRATEGIC FUNDING parti
PURPOSE INVESTED
While
in the
Data provided by clubs and CCOs was structured and cross tabulated to enable analysis in a variety of contexts.
Knight, Kavanagh and Page (January 2020) 11 Outp
The r
In adSection One: Background
Data provided by Clubs and CCOs was structured and cross tabulated to enable analysis in a variety of contexts.
Although
2019 the following diagram shows
INSIGHT AND national
IMPACT REPORT programmes as examples,
APPENDICES data for local initiatives were
also structured in the same fashion.
Structured data to enable analysis – diagram shows examples
Structured data to enable analysis
ENVIRONMENT/ PURPOSE/ PROJECTS/
SETTING KEY DRIVERS INITIATIVES
ic n
rv ize
r
e
ab &
m ity
Se it
y
ye
tty
t
n
cne l C
oy n
en
ili
ge un
ts la
io
pl atio
lb &
zei a
ng
ar e &
rt t &
un y P
at
triv on
el th
ga m
ei
ip
Em uc
Pa or
En om
W eal
Co e r
Le ov
CSei ati
ic
n
Ed
Sp
v
M
N
H
C
E
Education/
School Premises
Club/ CCOPremises
Club/CCO Premises
Local Community
Avoiding errors/ensuring accuracy
UNDERSTANDING
Participant and session numbersTHE NUMBERS
for some initiatives were so substantial that the key issue was to avoid ‘data inflation’, particularly for
participation. This was critical to credibility.
It is essential to understand
Care and accuracy whatwhen
were encouraged theCCOs
numbers
completedcited
data in
andthis studywarnings
automated mean;were they are large,
developed the multipliers
to highlight significant
potential concerns.
and the research
Individual process
discussion hasCCO
with each generated
focused on themore than
average one
numbers of million cells
sessions each childof
or data. It part
adult took is important, therefore, to
in for each programme
rather than the total number of sessions delivered. Although this may have led to underestimating certain figures this was deemed
appreciate how
preferable the
to the maths
risk and multipliers
of exaggerating participation. work, as illustrated by the following (theoretical) example.
ForThe
example:
scale of club/CCO engagement and the multipliers involved in transitioning from a single session to the aggregate total across all
participants is almost exponential.
While the numbers are significant and impressive, it is important not simply to absorb them at face value, it is essential to interpret them
For example:
in the context of the degree of difficulty associated with the issue being addressed/group being engaged with and impact being delivered.
1 CCO programme runs for;1 hour per session (60 minutes)
Engagement
(what is delivered)
Outputs
If
The result is the first comprehensive overview of club and CCO involvement in and impact on communities and the country as a whole1.
And 2 sessions
In addition to a national report and dataset, outputs include evidence for individual clubs and CCOs. A complementary series of individual
club/CCO reports have been prepared; each containing:
are run on each week of the school year (39 weeks)
» An executive summary. This adds up to 78 sessions in total (2 x 39)
if 78 hours
» Catchment profile – age structure, total population, projected population, deprivation measures and maps, ethnic composition,
Therefore
income, benefits dependency, crime rates, health areactivity
indicators and delivered
rates. in each of 10 schools
» Survey findings related to participation, engagement, purpose, environment and funding.
This adds up to 780 hours of engagement (78 x 10)
If this programme at each of the 10 schools is attended by 30 participants
300 participants (10 schools x 30 children)
this adds up to a total of
Participation
(what people do)
This then adds up to 2,340 hours of individual participation per
school (30 pupils x 78 hours of engagement) and;
23,400 hours of individual participation (10 schools x 30 pupils x 78 hours
of engagement)
If repeated in the same form across all CCOs this would add up to to
Data has been drawn from a number of Club and CCO sources, consequently there are minor variations at times, checks have been included within data
1
processing to ensure that wherever possible these fall within +/-1% margins. 51
1,684,800 individual participant hours 8
8
It should be noted that data was not multiplied up from one CCO to create a total for all CCOs - the example shown above simply illustrates how rapidly
the numbers can grow.
12Measuring The Impact Of EFL Clubs In The Community
AVOIDING ERRORS / ENSURING ACCURACY
Participant and session numbers for some initiatives were so
substantial that the key issue was to avoid ‘data inflation’, particularly
for participation. This was critical to credibility.
Care and accuracy were encouraged when CCOs completed data and
automated warnings were developed to highlight potential concerns.
Individual discussion with each CCO focused on the average numbers
of sessions each child or adult took part in for each programme rather
than the total number of sessions delivered. Although this may have
led to underestimating certain figures this was deemed preferable to
the risk of exaggerating participation.
The scale of Club/CCO engagement and the multipliers involved in
transitioning from a single session to the aggregate total across all
participants is almost exponential.
While the numbers are significant and impressive, it is important not
simply to absorb them at face value, it is essential to interpret them in
the context of the degree of difficulty associated with the issue being
addressed/group being engaged with and impact being delivered.
OUTPUTS
The result is the first comprehensive overview of Club and CCO
involvement in, and impact on, communities and the country as a whole9.
In addition to a national report and dataset, outputs include evidence
for individual Clubs and CCOs. A complementary series of individual
Club/CCO reports have been prepared; each containing:
An executive summary.
Catchment profile – age structure, total population,
projected population, deprivation measures and maps, ethnic
composition, income, benefits dependency, crime rates, health
indicators and activity rates.
Survey findings related to participation, engagement, purpose,
environment and funding.
All Clubs and CCOs who completed surveys have received their
own individual reports.
In addition a public-facing national report, including case
studies, will be published.
9
Data has been drawn from a number of Club and CCO sources, consequently there are minor variations at times, checks have been included within data
processing to ensure that wherever possible these fall within +/-1% margins.
Knight, Kavanagh and Page (January 2020) 13Section Two: Demographic Context
2. DEMOGRAPHIC CONTEXT
Overview
This section examines the reach of EFL Clubs plus the age
structure and incidence of deprivation alongside a range of
other social and economic indicators with their catchments.
It concludes with a series of key health indicators and an
overview of the costs, to individuals and the NHS as a whole,
associated with, what the British Heart Foundation regards as,
avoidable ill health.
This Section Covers:
• Population levels and characteristics within EFL Club/CCO
catchment areas:
• Health, physical activity and weight statistics for a
slightly wider area around each Club/CCO.
14Measuring The Impact Of EFL Clubs In The Community
2. DEMOGRAPHIC CONTEXT
POPULATION (Source: 2018 Mid-Year Estimate, ONS)
Football Clubs are one of the main focal points for many urban communities throughout the country.
36.6 million people (six in 10 of the population of England and Wales) reside within 10 miles of an EFL
ground; at 15 miles this figure rises to 46.7 million (eight in 10). Clubs/CCOs are, thus, ideally placed to en-
gage with a large proportion of the population.
Population density Mid-Year Estimate (MYE) 2018 and 10 mile radial catchments around EFL Clubs/CCOs
Each CCO defined its own catchment zone, as the area in which the majority of people taking part in its
programmes live. Although this varies in size by Club/CCO, it is generally accepted that a 10 miles catchment
is a reasonable area for such purposes. Consequently, data has been aggregated for each of these catchment
zones across the country and an overall dataset produced to act as a national CCO catchment area.
Knight, Kavanagh and Page (January 2020) 15APPENDIX 2: Demographic Context - More Detail
The map on page … shows the population density and 10-mile radial catchments around EFL clubs.
This Appendix goes deeper into the demographics and focuses on:
» Age structure;
Section Two: Demographic Context
» Deprivation;
» Income and benefits dependency;
» Ethnicity;
» Crime; and
» Health, physical inactivity and obesity
Age structure
EFL club catchment areas contain a higher proportion of the nation’s children, young people and those aged 30-44. As the age profile
AGE STRUCTURE POPULATION (AGE BANDS):
rises, the proportion of people in the EFL clubs’ catchment reduces relative to that in the rest of the country.
MID-YEAR
Population - 2018 MYE (England and Wales) ESTIMATE (MYE) 2018
CCO catchment areas containSource:
a Office for National Statistics – MYE 2018
higher proportion of the nation’s 20.0%
children, young people and those
20.5%
20.4%
aged 30-44. As the age profile
19.7%
19.6%
18.9%
18.8%
18.6%
rises, the proportion of people in
15.0%
17.1%
the catchment reduces relative to
16.1%
14.1%
that in the rest of the country. 10.0%
8.7%
7.5%
5.0%
S 2019 0.0% INSIGHT AND IMPACT REPORT APPENDICES
0 - 15 16 - 29 30 - 44 45 - 59 60 - 74 75+
Within 10 miles Beyond 10 miles
Deprivation
ubs. More than one in three (36.9%) people living within ten miles of an EFL ground fall within the three most deprived cohorts nationally.
DEPRIVATION10 MULTIPLE DEPRIVATION:
Outside this catchment the figure drops to half this rate (19.0%).
Multiple Deprivation - IMD 2019 (England)
INDEX OF MULTIPLE DEPRIVATION (IMD) 2019
Source: English Indices of Deprivation 2019 (Ministry of Housing, Communities and Local Government)
More than one in three
(36.3%) people living within 13.0%
the catchment area fall within
12.6%
12.2%
12.1%
the three most deprived
11.8%
11.8%
11.1%
11.6%
11.5%
11.4%
11.3%
cohorts nationally. Outside
10.4%
those aged 30-44. As the age profile
the country. this catchment the figure
10.1%
9.3%
9.3%
drops to half this rate (19.5%).
9.0%
9.0%
8.9%
8.8%
8.5%
8.1%
7.4%
The catchment area tends to
6.3%
have higher rates of11:
5.6%
5.1%
3.7%
Multiple-deprivation rates52
of 24.7% compare to 11.4%
16.1%
1.9%
outside the catchment
0.0%
Health deprivation rates of
0 -10 90.1 - 100
10.1 - 20 20.1 - 30 30.1 - 40 40.1 - 50 50.1 - 60 60.1 - 70 70.1 - 80 80.1 - 90
most deprived least deprived
23.7% compare to 12.2%
8.7%
Within 10 miles Beyond 10 miles Beyond 10 miles
7.5%
outside the catchment
Areas within the 10-mile catchment of EFL grounds tend to have higher rates of2:
» Multiple-deprivation 25.3% compared to 11.0% outside the catchment
74 75+ » Health deprivation 24.3% compared to 11.7% outside the catchment.
INCOME AND BENEFITS
Income andDEPENDENCY
benefits dependency
Full-time earnings3 in the EFL clubs’ catchment are frequently below the norm for Great Britain (£29,697) and are often significantly lower.
Full-time earnings are frequently
674,145 below the
people living norm/median
within figure for Great Britain (£29,697) and are often
12 of EFL clubs claimed Universal Credit (April 2019). This is 70% of all claimants
a 10 miles catchment 4
although
the same area is only home to 57% of the population as a whole.
significantly lower.
674,145 people living within this catchment claimed Universal Credit (April 2019). This is 70% of all claimants13
although the same area is only home to 57% of the population as a whole.
10
See glossary and data notes for further information on the Index of Deprivation
11
Based on 10 mile catchments, the English Indices of Deprivation 2019 (Ministry of Housing, Communities and Local Government) and the most
deprived 20% of such areas nationally. The majority of deprived areas often also exhibit high population density, although this is not always the case.
Consequently, care should be taken when using such data to help determine areas in which resources might be most valuably targeted in terms of SROI
12
Based on a median figure from NOMIS data (2018) - the median reflects the mid-point in a range of data, it differs from an average in as much as it avoids
distortion by very high or very low data outliers.
13
Universal Credit data relates to England, Scotland and Wales. 2
Based on 10 mile catchments, the ONS 2015 indices2019 English Indices of multiple deprivationDeprivation (Ministry of Housing, Communities and Local
Government) and the most deprived 20% of such areas nationally. – the Welsh equivalent has been used where appropriate. The majority of deprived areas
often also exhibit high population density, although this is not always the case. Consequently, care should be taken when using such data to help determine
16
areas in which resources might be most valuably targeted in terms of SROI.
3
Based on a median (mid-point) figure from NOMIS data (2018).
4
Universal Credit data relates to England, Scotland and Wales. 532019 INSIGHT AND IMPACT REPORT APPENDICES
Measuring The Impact Of EFL Clubs In The Community
Ethnicity
86% of people in England and Wales classify themselves as ’White’, while 14.0% considered themselves to belong to ‘Non-white’ groups5.
Overall, within 10 miles of an EFL ground the proportion that is ‘White’ falls to 81.3% and the ‘Non-white’ rises to 18.7%.
58% of the White population as a whole live within 10 miles of a ground.
ETHNICITY This rises to 75% for people with mixed ethnicity, 82% for Asians and 88% for people classifying themselves as Black.
ETHNICITY - 2011 CENSUS
Ethnicity (2011 Census)
86% of people in England and
Wales classify themselves as Other 82.9% 17.1%
’White’, while 14.0% considered
themselves to belong to other
ethnicities14. Black 87.8% 12.2%
The proportion of the population,
within the catchment area, that Asian 81.8% 18.2%
is ‘White’ falls to 81.3% and other
ethnicities rises to 18.7%.
Mixed 75.4% 24.6%
58% of the 'White' population as
a whole live within the defined White 58.4% 41.6%
catchment area.
0.0% 20.0% 40.0% 60.0% 80.0% 100.0%
This rises to 75% for people with Within 10 miles Beyond 10 miles
mixed ethnicity, 82% for Asians
and 88% for people classifyingCrime6
themselves as Black. There were 6.4 million recorded crimes in the UK in the year ending March 2019.
Just over two thirds (67.5%) of the 6.4million recorded crimes took place within 10 miles of an EFL ground; this is markedly higher than
the proportion of the UK population (55.1%) which lives in this area.
2019 INSIGHT AND IMPACT REPORT APPENDICES
The crime rate in the EFL clubs’ 10-mile catchment stands at 119.7 per ‘000 compared to a rate of 70.6 per ‘000 outside this area; an extra
49.1 crimes per 1,000 people.
Crime (Year End March 2019 - UK Police)
CRIME15
ves to belong to ‘Non-white’ groups5. CRIME - YEAR END MARCH 2019 (UK POLICE)
Share of UK population (55.1%) live within ten miles
te’ rises to 18.7%.
There were 6.4 million Theft from the Person 84.7% 15.3%
recorded crimes in the Robbery 83.2% 16.8%
UK in the year ending
mselves as Black.
Vehicle Crime 73.5% 26.5%
March 2019. Burglary 70.4% 29.6%
Just over two thirds
Bicycle Theft 69.8% 30.2%
(67.5%) of the 6.4million
17.1% Drugs 69.6% 30.4%
5
Source: 2011 Census of population: Ethnicity was self-classified to reflect the group people felt they belonged to.
recorded crimes took
6
Source: 2019 Recorded Crime, Home Office and 2017 MYE population denominator (ONS) – data relates to the UK as a whole, all population comparators have
Other Theft been adjusted accordingly. 69.5% 30.5%
Source: Sport England’s Active Lives survey (mid-Nov 2017 – mid-Nov 2018).
place within the defined
7
8
British Heart Foundation ‘Physical Inactivity and Sedentary Behaviour Report 2017’.
Possession of Weapons 67.1% 32.9%
12.2%
54 (BHF) UK analysis of the Global Burden of Diseases, Injuries and Risk Factors Study.
catchment areas; this
9
Public Order
is higher than the
67.1% 32.9%
proportion of the UK
Other Crime 66.1% 33.9%
18.2%
population (55.1%) Anti-Social Behaviour 66.0% 34.0%
which lives in this area. Shoplifting 65.6% 34.4%
24.6%
Violence and Sexual Offences 65.5% 34.5%
Criminal Damage and Arson 64.3% 35.7%
Total 67.5% 32.5%
0.0% 20.0% 40.0% 60.0% 80.0% 100.0%
% 100.0%
Within 10 miles Beyond 10 miles
Health, physical inactivity and obesity
Across many of the urban areas around EFL clubs and CCOs, there is an increased incidence of avoidable ill health - typified by:
» Higher likelihood of being overweight or obese - and of this increasing by age;
» Lower levels of physical activity; and
ound; this is markedly higher than
» Reduced life expectancy among men and women.
14
Source: 2011 Census of population:National
Ethnicity was
rates forself-classified to reflect or
people being overweight the group
obese risepeople feltwhen
from 22% theychildren
belonged to.reception
enter Note: The(at'other ethnicities'
age 4/5 figures
years), to 34% at Year 6
per ‘000 outsiderelate to the
this area; 'non-white' category (10/11
an extra that was often
years used
old) and in analysis
64% of the
among adults 2011
(16+ Census
years). Theat that
rates intime.
many of the country’s more deprived urban areas are higher. On average7:
15
Source: 2019 Recorded Crime, Home Office and 2017 MYE population denominator (ONS) – data relates to the UK as a whole, all population comparators
have been adjusted accordingly. » 62.6% of adults take part in 150+ minutes of moderate to vigorous activity each week;
» 12.3% are moderately active; and
» 25.1% are inactive and take part in fewer than 30 minutes activity per week.
Knight, Kavanagh and Page (January
The cost of physical2020) 17
inactivity to the NHS and implications for individuals. The British Heart Foundation (BHF) estimate that the direct
financial cost to the NHS of physical inactivity8 in Britain is c.£1.2 billion a year. It reports that:
» 39% of UK adults (c.20m) fail to meet Government guidelines for physical activity.Section Two: Demographic Context
Health, Physical Inactivity And Obesity
Across many of the urban areas around EFL Clubs and CCOs, there is an increased incidence of avoidable
ill health - typified by:
Higher Lower Reduced
likelihood of being overweight levels of physical activity life expectancy among men
or obese - and of this and women
increasing by age
National rates for people being overweight or obese
rise from 22% when children enter reception (at age
The cost of physical inactivity
4/5 years), to 34% at Year 6 (10/11 years old) and to the NHS and implications
64% among adults (16+ years). The rates in many of
the country’s more deprived urban areas are higher. for individuals
On average16:
The British Heart Foundation (BHF) estimate that
the direct financial cost to the NHS of physical
inactivity17 in Britain is c.£1.2 billion a year. It
62.6% of adults take reports that:
part in 150+ minutes of
62.6%
150+ Mins
moderate to vigorous 39% of UK adults (c.20m) fail to meet
activity each week Government guidelines for physical activity.
c.11.8m women are insufficiently active,
compared to around 8.3m men.
Women are 36% more likely to be classified
12.3% 12.3% are moderately active physically inactive then men.
Active
Around 60% of adults are unaware of the
Government’s physical activity guidelines.
Physical inactivity contributes to an
estimated18 one in ten premature deaths
25.1% are inactive and from coronary heart disease and one in six
25.1% take part in fewer than 30 deaths from any cause.
30 Mins minutes activity per week
16
Source: Sport England’s Active Lives survey (mid-Nov 2017 – mid-Nov 2018).
17
British Heart Foundation ‘Physical Inactivity and Sedentary Behaviour Report 2017’.
18
(BHF) UK analysis of the Global Burden of Diseases, Injuries and Risk Factors Study.
18Measuring The Impact Of EFL Clubs In The Community
It has also
stated that... Regular
physical
activity can
35%
reduce the risk
of coronary heart
disease and stroke by
as much as...
Keeping
physically
active can also
reduce the risk of
early death by as
much as...
30%
Knight, Kavanagh and Page (January 2020) 19Section Three: Resource Allocation 3. RESOURCE ALLOCATION Overview This section briefly examines CCOs as businesses by looking at income (levels and sources), expenditure and the allocation of resources. It then proceeds to review non-financial resources. This Section Covers: • Income, expenditure and balances associated with CCOs. • Programme funding – types and sources. • Non-financial resources – people and facilities. • Capital funding of projects. 20
INSIGHT AND IMPACT REPORT HOW CLUBS AND CCOs WORK 2019
W
Measuring The Impact Of EFL Clubs In The Community
C
lub CCOs are formed as charitable organisations. And as a walk down virtually Where
every high street in England will tell you, the charity sector now operates
As state
firmly within the business community. CCOs are no different. They are run
UBS
points fo
3. RESOURCE ALLOCATION
on sound business principles. They prepare business plans, set targets, review
of Engla
performance and work closely with their associated clubs.size = 45 Clubs and 67 CCOs19)
(sample (eight in
As a collective network, EFL CCOs have the unique support of an umbrella body,
The map
the EFL Trust. The Trust acts solely on their behalf to provide information,
D
BUSINESS PRINCIPLES
advice, guidance and support to ensure the network aspires to best practice in
governance and delivery quality. The EFL Trust also represents the network to
SKY
key national stakeholders, providing a unique voice as a national organisation
CCOs prepare business
that plans, set
can offer targets,
local review
delivery performance and work closely with their associated Clubs.
solutions. SKY
The financial data returned by CCOs20, shows a healthy picture in overall terms:
EIR
This study brings everything together – covering topics such as the current SKY
Total incomenational
of CCOs financial state
(during the of the
year) wasCCO network, how
£71,412,684 21
; (aincome
rise ofis17.3%
generated,
relative tohow
and the previous year).
much time is devoted to community-facing activities, and by whom. 10 m
Expenditure totalled £69,771,686 p.a.
It also shows the range and usage of facilities and the continued investment in
Os
£59,544,636them.
(85.3%)For of
actual
thisexamples of the
was directly national
linked programmesengagement
to community delivered locally
22 by CCOs,
.
please see the ‘Strategic Alignment’ section, starting on page ..
£10,277,049 (14.7%) was spent on support costs;
The national financial picture
The picture
£1,640,998 (2.4%) is aoriginal
of the healthy income
one: remains as a positive net-balance.
ORK
» £71,412,684 income was generated in the study period, a 17.3% year-on-year
8
rise;
Funds carried forward (including previous balances) were £22,005,031.
» £69,771,686 expenditure was incurred;
» £1,640,998 was therefore the net balance;
» £22,005,031
Summary ofworth
overallofincome
funds were carried forward,
and expenditure including
– including previous
existing balances.
balances
A graphic representation makes this healthy state visually clear:
CCO INCOME AND EXPENDITURE
focal points
munities.
Funds Bought
£22,005,031
Forward
eir doors
s numerous
son for Expenditure £69,771,686
offer non-
tivities for
munity groups. Income £71,412,684
atter activities
by club CCOs £0 £25,000 £50,000 £75,000
range of Charitable activities/
grammes in
Donations/legacies etc. Other income
grants etc
ns.
Community related
Support costs Other
initiatives
Previous year Current year
On its im
strategi
matchda
and so t
19
See Executive summary for details.
This was provided for the same 12 months period as the project data. From 32
20
21
KKP is not an accountancy firm and as such the comments raised and based upon the tables reflect an informed but non-expert understanding of the
data contained in annual accounts and/or equivalent data for the timeframe of this study and has been provided by individual CCOs. season a
22
This figure differs by c.£1m (+1.4%) from the funding linked to specific projects covered by this study. Award’ w
KKP is not an accountancy firm and as such the comments raised and based upon the tables reflect an informed but
8
non-expert understanding of the data contained in annual accounts and/or equivalent data for the timeframe of this
study and has been provided by individual CCOs. 9Based on the estimated number of users for each facility. The FES
Knight, Kavanagh and Page (January 2020) 21Section Three: Resource Allocation
PROGRAMME FUNDING, INCOME, DONATIONS ETC.
While some funds at the disposal of CCOs are unrestricted and can be spent on initiatives that accord with
individual CCO policies, others are restricted and must be spent in line with criteria set by the funding
organisation (this usually applies to national programmes). Of the £71,412,684 total income, noted above:
£39,821,981 (55.8%) was unrestricted and £31,590,703 (44.2%) was restricted.
£52,987,827 (74.2%) was associated with charitable activities.
£12,954,697 (18.1%) came from donations and legacies.
£58,480,593 (81.9%) was related to / allocated for specific projects covered by this study.
CCO funding comes from a wide range of sources including, for example, central government
programmes, charitable institutions and programmes such as local government, educational
institutions, private partners/sponsors, the Premier League Charitable Fund, the general public and
people attending holiday courses etc. The largest individual funder, at £16,301,470 however, is the
EFL Trust (see below).
FINANCIAL SUPPORT - MAIN FUNDERS
EFL TRUST
£16,301,470 - 23%
OTHER
£28,774,323 - 40%
PREMIER LEAGUE CHARTIBLE FUND
£12,679,152 - 18%
GENERAL PUBLIC VIA
HOLIDAY COURSES
TOURS ETC.
£9,470,651 - 13%
PRIVATE PARTNERS/SPONSORS
£4,097,088 - 6%
22Measuring The Impact Of EFL Clubs In The Community
PEOPLE: STAFF, PLAYERS, COACHES AND VOLUNTEERS AS A RESOURCE
Club/CCO community/charitable work is delivered by a combination of paid (CCO and Club)
staff, players and coaches. Further supplemented by unpaid volunteers, supporters and other
members of the local community.
In 2018/19, the number of people working on CCO related community projects was:
3,562 in total (including all paid and voluntary inputs)
2,827 working for the CCOs (1,602 full-time and 1,225 part-time).
Time spent in total (per annum) on community facing and charitable work by Clubs/CCOs was:
4,891,365 hours
652,182 days
130,436 person weeks
Of this:
203,628 hours were worked by Club staff
407,843 hours were donated by fans, supporters and volunteers.
296,087 hours were contributed by staff from partner organisations.
Staff, players, coaches and volunteers helping to deliver community related projects23
Employed / donated People working on community initiatives…
Hours per annum*
by… Full time Part time FTE
CCO staff 1,602 1,225 2,215 3,948,881
Club staff 40 82 81 203,628
Players 29,687
Club coaches 5,241
Fans of the Club 0 54 87,843
35
Supporters Trust 0 16 27,777
Volunteers 1 208 292,223
279
Partner organisations 14 320 296,087
Total 1,657 1,905 2,610 4,891,365
* (includes part time, occasional and as part of wider job – see below)
Subsidised Value of subsidised
Facilities Lets (p.a.) Income
lets access
Full size 3G pitch 46 30,147 8,652 £2,379,679 £618,061
Half size 3G pitch 25 2,540 1,499 £154,081 £64,496
23 5/7 aassumptions:
Based on the following side 3G pitch 107 25,458 12,356 £687,071 £275,812
Full size
Full Time work involves 37.5 grass
hours pitch 33 per day) and
per week (7.5 hours 73247 weeks per 152 £59,990
annum (five weeks holiday) £47,700
Part time has been taken as 50% of a full time position
Grass pitch (other) 26 501 239 £13,808
Occasional work by volunteers, supporters, partners etc. taken to be around three hours per week. £13,490
All of these figuresIndoor sports
have been hallto ensure the
chosen 17estimates 12,231 5,236 £590,558 £106,687
Meeting room 85 12,177 7,484 £377,574 £161,893
Other 57 34,716 26,891 £425,399 £1,103,096
Knight, Kavanagh and Page (January 2020) 23
Total 396 118,502 62,509 £4,688,160 £2,391,234Section Three: Resource Allocation
FACILITIES AS ADDITIONAL RESOURCES
The picture with regard to Club/CCO facilities is relatively complex:
• A number of CCOs have their own grass/football turf pitches, others have access to Club facilities (some pay for
access while it is gifted to others) and some hire external venues.
• Facilities provided by Clubs/CCOs for community use free of charge, or at a subsidised rate, have a financial value/
community benefit.
• Facilities hired out commercially can accrue monies used to maintain the facility itself, cross-subsidise other
activities or support the Club/CCO.
Access to facilities can remove (or reduce) a cost burden that might otherwise limit activities from taking place.
They can also, by virtue of the association with the professional Club, add kudos to an activity or event.
Club facilities of which CCOs make use typically include:
• Training spaces and meeting rooms – often boxes within the stadium;
• Presentation and conference facilities – larger Club suites, even the boardroom; and
• Pitches – often training facilities but also the Club pitch and stand(s) for community finals and charity events.
Employed / donated People working on community initiatives…
The study recorded: Hours per annum*
by… Full time Part time FTE
CCO staff 1,602 1,225 2,215 3,948,881
• 396 facilities used by CCOs;
Club staff 40 82 81 203,628
• 118,502 occasions on which facilities were let/used;
Players 29,687
• 62,509 (52.7%) times where the ‘let’ was subsidised or free;
Club coaches 5,241
• 2,006,438 attendances – by people making
Fans of the Club 0
use of facilities
54
24
. 87,843
35
• 1,003,567 (50.0%) of Trust
Supporters these attendances 0involved free or16subsidised access. 27,777
• £4,688,160Volunteers
generated in income to Clubs1 and/or CCOs; 208
and 292,223
279
• £2,391,234 Partner
value of the subsidised/free 14
organisations access provided320
to the CCO and/or the local community.
296,087
Total 1,657 1,905 2,610 4,891,365
Subsidised access to facilities and fees charged
Subsidised Value of subsidised
Facilities Lets (p.a.) Income
lets access
Full size 3G pitch 46 30,147 8,652 £2,379,679 £618,061
Half size 3G pitch 25 2,540 1,499 £154,081 £64,496
5/7 a side 3G pitch 107 25,458 12,356 £687,071 £275,812
Full size grass pitch 33 732 152 £59,990 £47,700
Grass pitch (other) 26 501 239 £13,808 £13,490
Indoor sports hall 17 12,231 5,236 £590,558 £106,687
Meeting room 85 12,177 7,484 £377,574 £161,893
Other 57 34,716 26,891 £425,399 £1,103,096
Total 396 118,502 62,509 £4,688,160 £2,391,234
Player time/visits Value/monetisation
11,676 (39.3%) Matchday & training ground activities £1,459,400 (24.5%)
Based on the estimated5,446
24
number of users for each
(18.3%) facility,
Soccer for example;
schools, in many cases
girls, women’s this willfootball
& disability be the same people using a pitch
£1,361,500 or meeting room each
(22.8%)
week, the assumptions are as follows:
Numbers 3,744per session Numbers
(12.6%) Education & health initiatives per session Numbers £936,000 (15.7%) per session
Full size 3G pitch 28 Full size grass pitch 28 Half size 3G pitch 15
Grass pitch (other) 2,627 20 (8.8%) Social inclusion & anti-racism
5/7 a side 3G pitch 15 £656,750 (11.0%)
Indoor sports hall 12
Meeting room 10
6,194 (20.9%) Presentations, charitable activities & hospital visits £1,548,500 (26.0%)
24107 25,458 12,356 £687,071 £275,812 » Rem
33 732 152 £59,990 £47,700 woul
» Help
26 501 239 £13,808 £13,490 indiv
Measuring The 12,231
17 Impact Of EFL Clubs In The Community
5,236 £590,558 £106,687 » Prom
anti-
85 12,177 7,484 £377,574 £161,893
57 34,716 26,891 £425,399 £1,103,096 2. Ext
Crucial
396 118,502 62,509 £4,688,160 £2,391,234 commu
FACILITIES USED BY CCOs its prog
ge use of each facility type: exist),
3.Com
Club fa
subsid
FULL SIZE 3G PITCH
(46) HALF-SIZE 3G PITCH
OTHER (25) On a wi
(57)
progra
And of
club fa
Resour
After it
MEETING ROOM
thems
(85) and me
Such e
5/7 A SIDE 3G PITCH
(107)
commu
» 29,68
» £5,96
This ch
INDOOR
SPORTS HALL
(17)
LESS THAN FULL SIZE
GRASS PITCH
(26) FULL SIZE GRASS PITCH
(33)
s: Ongoing facility investment also benefits local communities. Clubs/CCOs currently receive capital-funding
,750. These grants improve, maintain and provide new facilities for community and/or school use. For example:
CAPITAL FUNDED PROJECTS
Facility type
There Capital-funding
is continuing investment in facilities that benefit grant:Clubs/CCOs are currently in
local communities.
receipt
floodlit, full-size of capital
football turf pitch £500,000
funding grants totalling £18,727,750 to improve, maintain and provide new facilities for
community
Indoor 7-a-side pitch and/or school use; individual examples are shown below:
£130,000
3G pitch and hub site £1,200,000
• Outdoor 3G, floodlit, full size football turf pitch (£500,000).
ommunity sports centre £1,200,000
• Indoor 7-a-side pitch (£130,000).
Sports
• hall
3G pitch and hub site (£1,200,000). £1,900,000
• Community sports centre (£1,200,000).
• Sports hall (£1,900,000).
Knight, Kavanagh and Page (January 2020) 25Section Four: Clubs & Players
4. CLUBS & PLAYERS
Overview
This section examines the ability of EFL Clubs to open doors
that other organisations may be unable to. This can help their
CCOs to engage with a wide range of, often more difficult
to reach, groups. It describes the initiatives in which Clubs
and their players become involved and proceeds to review
the role of Clubs in creating family friendly environments
and concludes with a look at the crossover from community
engagement to commercial operation.
Player engagement examines the various activities in which
players are involved and subsequently reviews the monetisation
of such activity along with the associated challenges.
This Section Covers:
Clubs and their:
• Ability to engage with a wide range of people.
• Roles as facilitators.
• Creation of the right environment for supporters
and participants.
• The boundary between commercial and
community engagement.
Players and:
• Their engagement with local communities.
• The value of their time.
• The different types of community activities they are
involved in.
26Measuring The Impact Of EFL Clubs In The Community
4. CLUBS & PLAYERS
CLUBS
Although most direct community engagement Some programmes are relatively consistent across
comes through CCOs, Clubs also play direct and all Clubs while others relate to specific local and
indirect roles in the generation and delivery of regional environments, sponsorship arrangements
positive impacts within their communities. and opportunities as they arise. Examples of
individual Club initiatives which either generate
Opening doors income for CCO work in the community, raise funds
for charity or simply underpin engagement with
Probably the most significant contribution; one local people include:
with substantial value but which incurs no direct
cost, is the association of CCOs with Clubs and their Partner, charity, community appearances;
brand. This immediately differentiates how the
CCO is viewed by local people. Relative to other Mental health campaigns e.g. interviews and
organisations, it can, for example: videos articles throughout the year;
Generate higher interest levels from groups Providing children with the opportunity to be
such as young people via the association with mascot for the day;
professional sports Clubs and their people;
Matchday charity takeovers;
Remove barriers for people who might
otherwise view the CCO to be promoting a Bucket collections prior to home games;
mainstream/government offer they might not
have previously considered; Prostate cancer testing, available periodically
in mobile NHS facilities at the ground;
Help the CCO to engage those from difficult
to reach groups. This might include Care home, hospital activities and hospice visits;
encouraging supporters, such as older men
to adopt healthier lifestyles and/or making School visits / roadshows involving hundreds
them more likely to engage with other of pupils per time;
people, thereby improving physical health
and mental well-being by helping to tackle Soccer camps, often at half term or over the
isolation or loneliness; summer holidays, including player visits; and
Attract people who might otherwise perceive Charity raffles and events utilising tickets and
they have no common ground; and hospitality to raise funds.
Promote discussion of difficult topics such as the
Prevent agenda, issues related to disaffected
youth, anti-social behaviour, integration,
academic attainment/ambition etc.
Knight, Kavanagh and Page (January 2020) 27You can also read