Engineering Database of Liquid Salt Thermophysical and Thermochemical Properties
←
→
Page content transcription
If your browser does not render page correctly, please read the page content below
INL/EXT-10-18297

Engineering Database of
Liquid Salt
Thermophysical and
Thermochemical
Properties

Manohar S. Sohal
Matthias A. Ebner
Piyush Sabharwall
Phil Sharpe

March 2010

The INL is a U.S. Department of Energy National Laboratory
operated by Battelle Energy Alliance
INL/EXT-10-18297

Engineering Database of Liquid Salt Thermophysical
          and Thermochemical Properties

                     Manohar S. Sohal
                     Matthias A. Ebner
                     Piyush Sabarwall
                        Phil Sharpe

                        March 2010

               Idaho National Laboratory
                 Idaho Falls, Idaho 83415

                    http://www.inl.gov

                      Prepared for the
                 U.S. Department of Energy
                  Office of Nuclear Energy
              Under DOE Idaho Operations Office
                Contract DE-AC07-05ID14517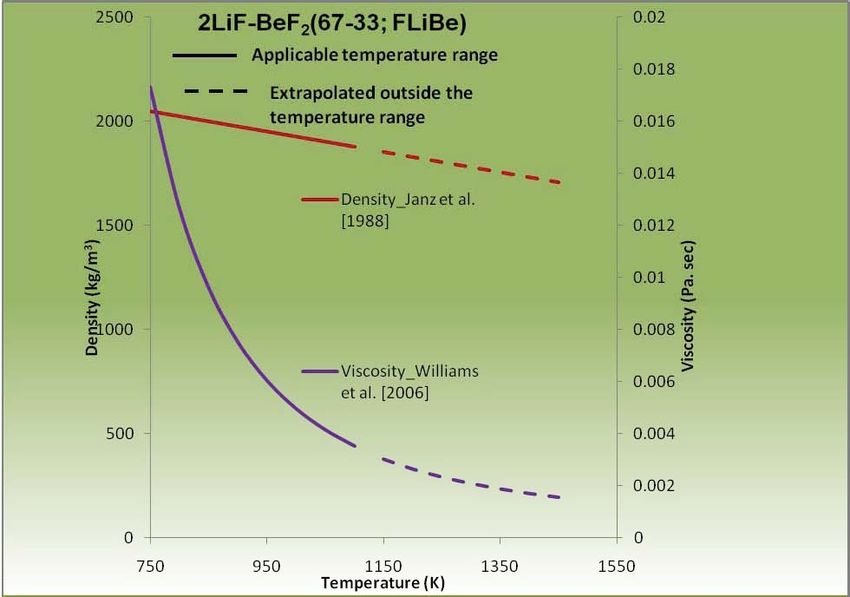
DISCLAIMER
     This information was prepared as an account of work sponsored by an
agency of the U.S. Government. Neither the U.S. Government nor any
agency thereof, nor any of their employees, makes any warranty, expressed
or implied, or assumes any legal liability or responsibility for the accuracy,
completeness, or usefulness, of any information, apparatus, product, or
process disclosed, or represents that its use would not infringe privately
owned rights. References herein to any specific commercial product,
process, or service by trade name, trade mark, manufacturer, or otherwise,
does not necessarily constitute or imply its endorsement, recommendation,
or favoring by the U.S. Government or any agency thereof. The views and
opinions of authors expressed herein do not necessarily state or reflect
those of the U.S. Government or any agency thereof.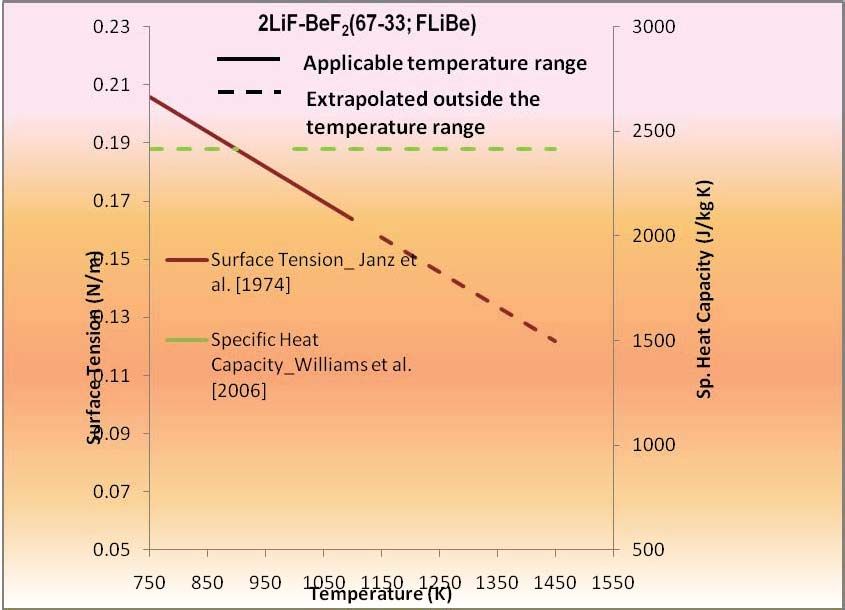
ABSTRACT
     The purpose of this report is to provide a review of thermophysical properties
and thermochemical characteristics of candidate molten salt coolants, which may
be used as a primary coolant within a nuclear reactor or heat transport medium
from the Very High Temperature Reactor (VHTR) to a processing plant; for
example, a hydrogen-production plant. Thermodynamic properties of four types
of molten salts, including LiF-BeF 2 (67 and 33 mol%, respectively; also known
as FLiBe), LiF-NaF-KF (46.5, 11.5, and 52 mol%, also known as FLiNaK), and
KCl-MgCl 2 (67 and 33 mol%), and sodium nitrate-sodium nitrite-potassium
nitrate (NaNO 3 –NaNO 2 –KNO 3 , 7-49-44 mol%, also known as Hitec® salt) have
been investigated. Limitations of existing correlations to predict density,
viscosity, specific heat capacity, surface tension, and thermal conductivity were
identified. The impact of thermodynamic properties on the heat transfer,
especially the Nusselt number, was also discussed.
    Stability of the molten salts with structural alloys and their compatibility with
the structural alloys was studied. Nickel and high temperature alloys with dense
Ni coatings are effectively inert to corrosion in fluorides, but not so in chlorides.
Of the chromium containing alloys, Hastelloy N appears to have the best
corrosion resistance in fluorides, while Haynes 230 was the most resistant in
chloride. In general, alloys with increasing carbon and chromium content are
increasingly subject to corrosion by the fluoride salts FLiBe and FLiNaK due to
attack and dissolution of the intergranular chromium carbide. Future research to
obtain needed information was identified.

                                         iii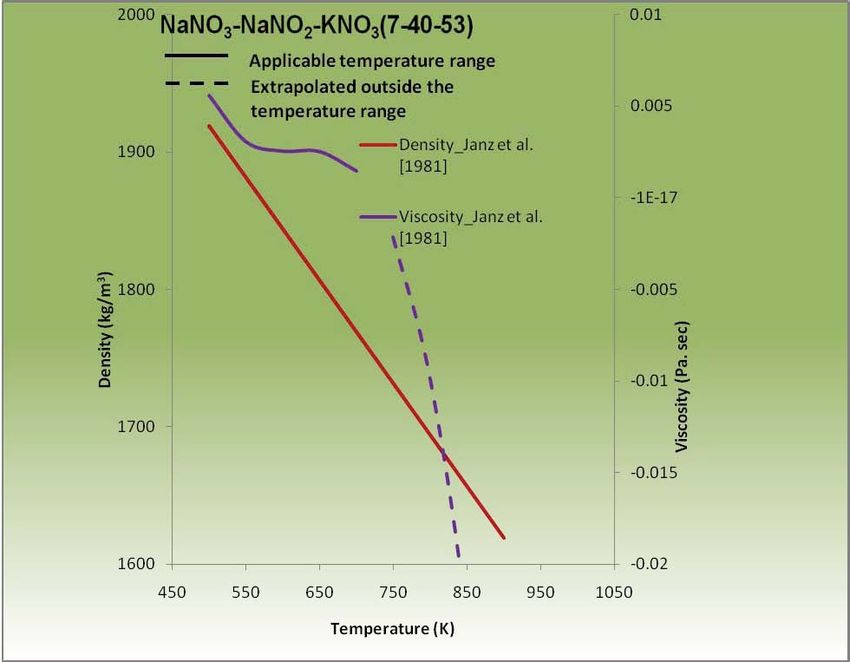
iv
CONTENTS
ABSTRACT.................................................................................................................................................iii

NOMENCLATURE ..................................................................................................................................viii

ACRONYMS ............................................................................................................................................... ix

1.       INTRODUCTION .............................................................................................................................. 1

2.       THERMOPHYSICAL PROPERTIES ............................................................................................... 3
         2.1 Overview of Thermophysical Properties and Respective Correlations.................................... 3
             2.1.1 Lithium Fluoride - Sodium Fluoride - Potassium Fluoride (LiF- NaF- KF) ............... 3
             2.1.2 Lithium Fluoride - Beryllium Fluoride (LiF – BeF 2 ) ................................................. 6
             2.1.3 Potassium Chloride-Magnesium Chloride (KCl – MgCl 2 )....................................... 10
             2.1.4 Sodium Nitrate-Sodium Nitrite-Potassium Nitrate (NaNO 3 –NaNO 2 –KNO 3 ) ......... 13
         2.2 Effect of Uncertainty in Thermophysical Properties on the Nusselt Number........................ 16
         2.3 Summary of Thermophysical Properties Characteristics ....................................................... 17

3.       HEAT TRANSFER CHARACTERISTICS ..................................................................................... 18

4.       MOLTEN SALT THERMOCHEMICAL STABILITY AND ALLOY CORROSION IN
         MOLTEN SALT SYSTEMS ........................................................................................................... 24
         4.1 Radiolytic and Thermal Stability of Molten Salts.................................................................. 24
         4.2 Corrosion Mechanisms .......................................................................................................... 26
             4.2.1 Fluoride and Chloride Salts....................................................................................... 27
             4.2.2 Nitrate-Nitrite Salts ................................................................................................... 32
         4.3 Molten Salt Purification Methods .......................................................................................... 33
         4.4 Review of Molten Salt Corrosion Data .................................................................................. 35
             4.4.1 FLiNaK ..................................................................................................................... 35
             4.4.2 FLiBe ........................................................................................................................ 39
             4.4.3 KCl-MgCl 2 ................................................................................................................ 42
             4.4.4 NaNO 3 -NaNO 2 -KNO 3 ............................................................................................. 45
         4.5 Summary of Thermochemical Characteristics ....................................................................... 48

5.       CONCLUSIONS AND RECOMMENDATIONS FOR FUTURE RESEARCH ............................ 51
         5.1 Molten Salt Thermophysical Properties ................................................................................. 51
         5.2 Molten Salt Themochemical Behavior................................................................................... 52

6.       REFERENCES ................................................................................................................................. 53

7.       APPENDIX A— SUMMARY OF ALLOY NOMINAL COMPOSITIONS .................................. 58

                                                                             v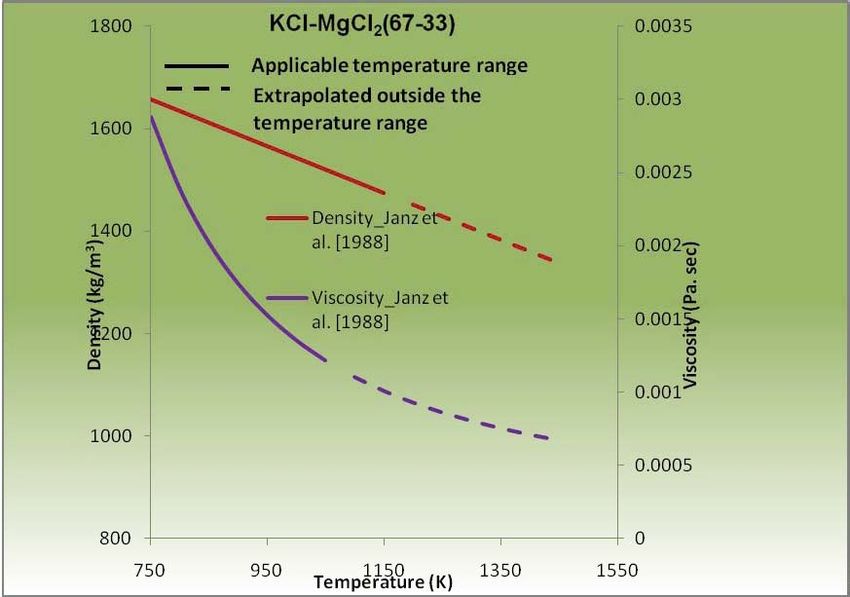
FIGURES
Figure 2.1. Plots of density and viscosity correlations for FLiNaK molten salt.Error! Bookmark not defined.
Figure 2.2. Plots of surface tension and specific heat capacity correlations for FLiNaK salt. .................... 5
Figure 2.3. Plots of thermal conductivity correlation and Nusselt number calculations for
FLiNaK salt. ............................................................................ Error! Bookmark not defined.
Figure 2.4. Plots of density and viscosity correlations for FLiBe molten salt. ............................................ 8
Figure 2.5. Surface tension and specific heat capacity plots for FLiBe salt.Error! Bookmark not defined.
Figure 2.6. Plots of thermal conductivity correlation and Nusselt number calculation for FLiBe. ........... 10
Figure 2.7. Plots of density and viscosity correlations for chloride salt. ................................................... 11
Figure 2.8. Plots of surface tension correlation and specific heat capacity values for chloride salt. ......... 12
Figure 2.9. Plots of thermal conductivity correlation and Nusselt number calculations for
chloride salt. ............................................................................................................................ 13
Figure 2.10. Plots of density and viscosity correlations for nitrate salts. .... Error! Bookmark not defined.
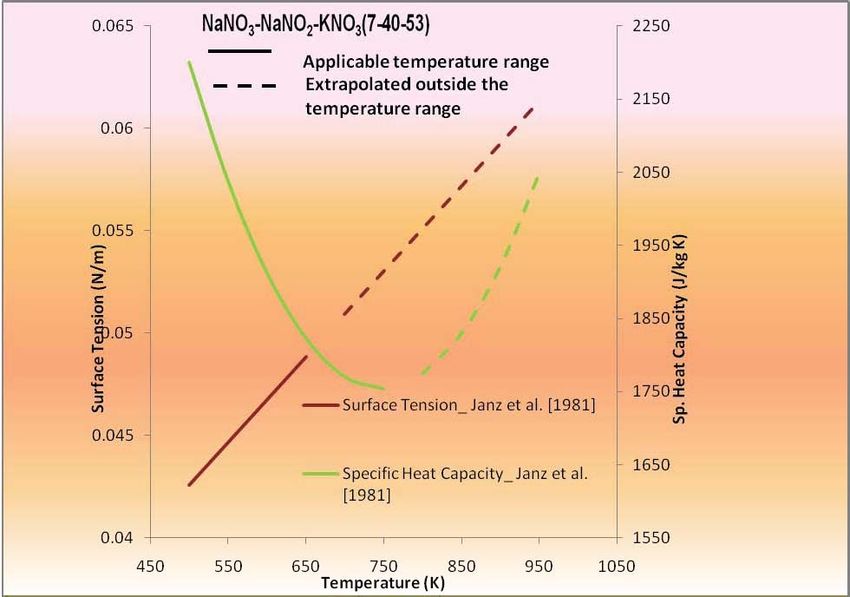
Figure 2.11. Plots of specific heat capacity and surface tension correlations for nitrate salts. .................... 15
Figure 3.1. Comparison of FLiNaK convective heat transfer experimental data of Vriesema [1979]
with Dittus-Boelter correlation; Ambrosek et al. [2009]. ........................................................ 18
Figure 3.2. Comparison of FLiNaK convective heat transfer experimental data of Grele and
Gdeon [1954] and Hoffman and Lones [1955] with Dittus-Boelter correlation,
Ambrosek et al. [2009]. ........................................................................................................... 19
Figure 3.3. FLiNaK experimental data of Hoffman and Lones [1955], Grele and Gedeon [1954],
and Vriesema [1979] in Inconel-based tubes were reanalyzed using the thermal
conductivity measured by Smirnov et al. [1987]..................................................................... 19
Figure 3.4. Comparison of Liu et al. [2009] molten salt data (a) their correlation, Equation (3.5),
and (b) with Sieder-Tate correlation, Equation (3.2)............................................................... 21
Figure 3.5. Correlation of Lu et al. [2009] molten salt data with Equation (3.6), Wu et al. [2009]. ......... 22
Figure 3.6. Correlation of Lu et al. [2009] molten salt data with Gnielinski Equation (3.4),
Wu et al. [2009]. ...................................................................................................................... 22
Figure 3.7. Correlation of Lu et al. [2009] molten salt data with Hausen, Equation (3.3),
Wu et al. [2009]. ...................................................................................................................... 23
vi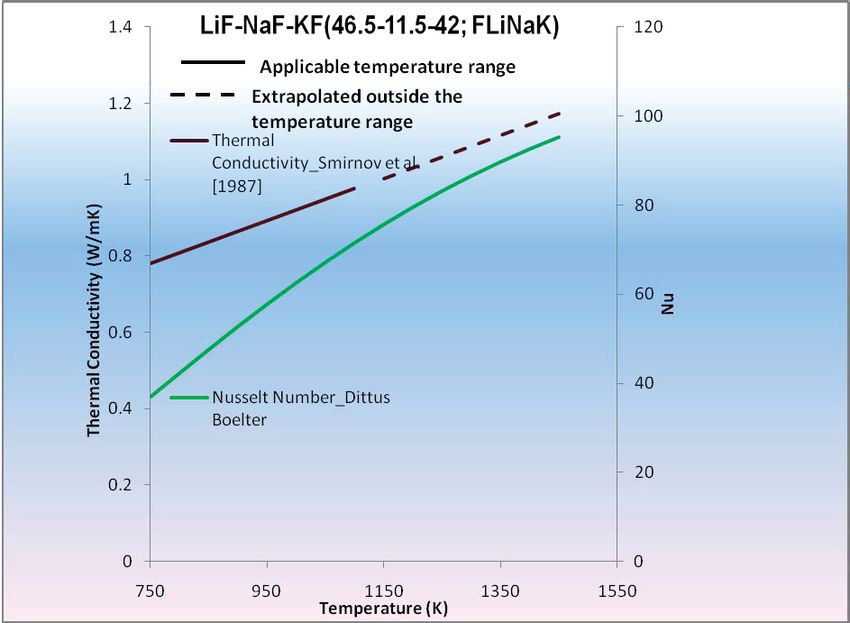
TABLES
Table 1.1. Some thermophysical properties of molten salts of interest and a few others for
            reference. ................................................................................................................................... 2
Table 2.1. Uncertainty in the Nusselt number. ......................................................................................... 16
Table 2.2. Worst case scenario for uncertainty in the Nusselt number. ................................................... 17
Table 4.1. Free energy of formation at 1000 K of some alkali fluorides and transition metal
           fluorides. .................................................................................................................................. 28
Table 4.2. Comparison of the free energies of some chloride and fluoride components of molten
           salts and the transition metal analogs [Williams et al. 2006]. ................................................. 29
Table 4.3. Solubility of chromium fluoride in FLiBe and FLiNaK fuel salts [Williams et al. 2006]. ..... 31
Table 4.4. Corrosion rates of ferritic steel JLF-1 in purified FLiNaK at 600°C for 1000 hours, in
           a JLF-1, Ni, and Nb crucible [Kondo et al. 2009a]. ................................................................ 36
Table 4.5. Corrosion rates of various alloys in purified molten LiF-NaF-KF at 850°C [Olson
           2009, Olson et al. 2000, Sridharan et al. 2008, Sridharan 2009]............................................. 36
Table 4.6. Correlation of corrosion rates and dissolved chromium content in FLiNaK with
           carbon and chromium content of alloys [Olson 2009, Sridharan et al. 2008]. ........................ 38
Table 4.7. Summary of ORNL loop corrosion tests in pure FLiNaK with an imposed solubility
           gradient corrosion mechanism [Williams et al. 2006, Williams and Toth 2005,
           Sridharan et al. 2008]. ............................................................................................................. 38
Table 4.8. Corrosion rates of various alloys in purified FLiBe at 600°C, and the corresponding
           increase in dissolved Cr and Fe content of the salt [Kondo et al. 2009a, Kondo et al.
           2009b, Kondo et al. 2009c]. .................................................................................................... 40
Table 4.9. Summary of ORNL loop corrosion tests involving the binary LiF-BeF2 and some
           ternary salts that did not contain UF4 [Williams et al. 2006, DeVan 1984]. .......................... 41
Table 4.10. Corrosion of several alloys in KCl-MgCl 2 at 850°C for 100 hours in quartz crucibles.
            [Ambrosek 2010, Olson 2009, Sridharan 2009, Anderson and Sridharan 2010]. ................... 42
Table 4.11. Comparison of corrosion rates of various alloys at 850°C in FLiNaK and in KCl-
            MgCl 2 [Ambrosek 2010, Olson 2009, Sridharan 2009, Anderson and Sridharan 2010]. ....... 43
Table 4.12. Corrosion rates of several high chromium steels in chloride salts in ORNL loop tests
            [Williams 2006]....................................................................................................................... 44
Table 4.13. Corrosion rates of various alloys in various chloride baths..................................................... 45
Table 4.14. Corrosion rates of various alloys in Hitec salt......................................................................... 47
Table 4.15. Corrosion rates of several alloy types in KNO 3 -Mg(NO 3 ) 2 at 250°C [Niiger et al.
            1982]........................................................................................................................................ 48

                                                                            vii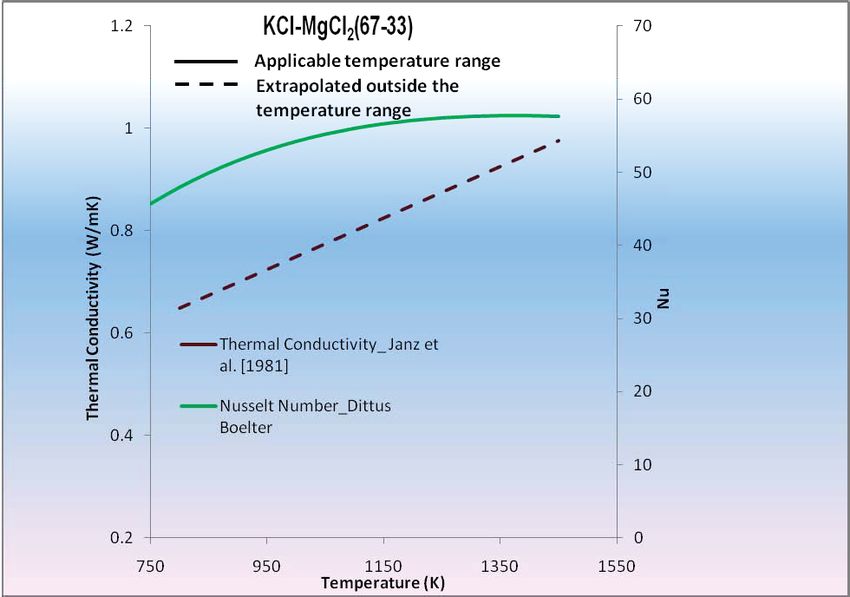
NOMENCLATURE
C1     constant
Cp     specific heat capacity, J/kg·K
d      diameter of a tube, m
k      thermal conductivity, W/m·K
l      conduit length, m
M      sodium, potassium, or lithium
Nu     Nusselt number
Pr     Prandtl number, C p ·µ/k
Re     5H\QROGVQXPEHUȡ·d·v/µ
T      temperature, K
v      velocity, m/s

ȡ      density, kg/m3
µ      dynamic viscosity, Pa·s
Ȗ      surface tension, N/m

Subscripts

b      bulk fluid
w      wall

                                             viii
ACRONYMS
ARE Aircraft Reactor Experiment
FLiNaK lithium fluoride-sodium fluoride-potassium fluoride
FLiBe lithium fluoride - beryllium fluoride
INL Idaho National Laboratory
MSBR Molten Salt Breeder Reactor
MSRE Molten Salt Reactor Experiment
NGNP Next Generation Nuclear Plant
ORNL Oak Ridge National Laboratory
VHTR Very High Temperature Reactor
ixEngineering Database of Liquid Salt Thermophysical
and Thermochemical Properties
1. INTRODUCTION
The purpose of this report is to provide a review of thermophysical properties and thermochemical
characteristics of candidate molten salt coolants, which may be used as a primary coolant within a nuclear
reactor or heat transport medium from the Very High Temperature Reactor (VHTR) to a processing plant;
for example, a hydrogen-production plant. Several fluids are under consideration for heat transfer fluids
between the Very High Temperature Reactor (VHTR), such as the Next Generation Nuclear Plant
(NGNP), and the downstream processes. Prominent among the candidate fluids are helium gas and molten
salts. Applicability of molten salts as heat transferring coolants has been assessed by Oak Ridge National
Laboratory (ORNL) researchers: Williams [2006] and Williams et al. [2006]. Williams [2006] contended
that the coolants must have the following characteristics:
x Chemical stability at high temperatures (500–800°C).
x Radiolytic stability in a high radiation environment (for primary coolant only).
x Freezing (melting) temperature as low as possible, preferably lower than 525°C.
x Large specific heat and thermal conductivity.
x Low vapor pressures that are substantially less than one atmosphere at operating temperatures and
are thus not volatile.
x Compatible with high-temperature materials, alloys, graphite, and ceramics.
Molten salts appear to be excellent candidates that meet most of these requirements. However, no single-
component salt meets the requirement of low melting temperature; multi-component eutectic mixtures are
needed to meet the melting temperature requirement. Some multi-component eutectic salt mixtures have
melting temperatures less than 500°C. The use of eutectic mixtures ensures compositional and phase
stability, and therefore, uniform thermophysical properties in the operating temperature range
[Grimes 1967, Grimes et al. 1972, Ingersoll et al. 2006].
Molten salt technology has been used for many decades in industrial process heat transfer, thermal
storage, heat treatment, high-temperature electrochemical plating, and other materials processing
applications. The potential utility of molten salts as heat transfer agents was also demonstrated for nuclear
reactors, as the liquid fuel in the Aircraft Reactor Experiment (ARE) and the Molten Salt Reactor
Experiment (MSRE) programs. The behavior and material compatibility of various molten salts was
studied extensively by ORNL from the 1950s through the 1970s in support of the MSRE and the Molten
Salt Breeder Reactor (MSBR) programs. Several types of molten salt, including LiF-NaF-KF (46.5, 11.5,
and 52 mol%, respectively; also known as FLiNaK), LiF-BeF 2 (67 and 33 mol%, respectively; also
known as FLiBe), and KCl-MgCl 2 (67 and 33 mol%, respectively), have been investigated recently by
several Japanese and U. S. groups (FLiBe and FLiNaK), as well as the University of Wisconsin (KCl-
MgCl 2 and FLiNaK) in support of fusion reactor and VHTR concepts, respectively.
In the liquid state, molten salts have the viscosity and appearance similar to water. A mixture of sodium
and potassium nitrate, with a melting temperature of ~222°C, is commonly used in solar applications. A
primary advantage of molten salt technology is that the molten salt can be heated to ~560°C, which
allows high energy steam to be generated at utility-standard temperatures (11.4 MPa, 550°C), achieving
high thermodynamic cycle efficiencies of approximately 40 percent in modern steam turbine systems.
Table 1.1 provides a list of the thermophysical properties of several types of molten salts.
1Table 1.1. Some thermophysical properties of molten salts of interest and a few others for reference.
Molten salt coolant Mol % Formula Freezing/Me Boiling Thermophysical Properties
(Wt. %) weight lting Point Point Density Specific Viscosity Thermal Prandtl No.
(g/mol) (K) (K) (kg/m3) Heat (Pa·s) conductivit
Capacity y
(J/kg K) (W/m K)
LiF-NaF-KF (FLiNaK) 46.5-11.5-42 41.3 727 1843 2020 1882.8 0.0029 0.92 5.938
(29-12-59)
LiF-BeF 2 67-33 33.0 733 1940 2414.17 0.0056 1.0 13.525
(53-47)
KCl-MgCl 2 68-32 81.44 708 1664 1158.97 0.0014 0.40 4.0
(62-38)
NaNO 3 -NaNO 2 -KNO 3 @ 400°C 7- 49 - 44 1.77-1.98 415 1790 1560 0.0013- 0.51-
(7- 40 -53) 0.0016 0.605
NaNO 3 - KNO 3 @ 400°C 48-52 93.37 495 1840 2660.19 0.0017 0.55 8.222
LiF-NaF-BeF 2 38.9 588 2000 2045.98 0.005 0.97 10.551
LiF-NaF-RbF 67.7 708 2690 987.42 0.0026 0.62 4.14
NaF-BeF 2 44.1 613 2010 2175.68 0.007 0.87 17.513
H 2 O @ 20°C 18 273 1000 4184 0.001 0.6 7
He (P = 7.5 MPa) 4 3.8 5505.31 0.000042 0.29 0.8
Na @ 550°C 23 370.8 820 0.00023 62 0.004
22. THERMOPHYSICAL PROPERTIES
Because the interest in molten salt arises from its application for transporting heat from a nuclear reactor,
as well as the transport of process heat from a reactor to a heat sink, four salts (FLiNaK, FLiBe, KCl-
MgCl 2 , and NaNO 3 -NaNO 2 -KNO 3 ) have been identified for such an application and studied in this
report. Their exact composition can vary depending on several factors: commercially available
compounds, desired characteristics, and the manufacturing process. However, some common
compositions are given in Table 1.1.
2.1 Overview of Thermophysical Properties
and Respective Correlations
In this section, commonly accepted correlations, values, and corresponding sources for molten salt
thermophysical properties are summarized. As a general rule, the molten salt properties will be needed in
the temperature range of the nuclear reactor operation and process plant application. Based on this
thought, most of the properties may be needed in the temperature range of 700–1450 K. A simple
examination of the completeness of these data will be done by checking their applicable temperature
range. Their applicability and reasonableness to calculate heat transfer related parameters (such as the
Nusselt number, pressure drop, etc.) will also be presented. Overall, only four salts (FLiNaK, FLiBe,
KCl-MgCl 2 , and NaNO 3 -NaNO 2 -KNO 3 ) were considered. Therefore, the subsections below are
organized under these four salt types. For convenience, symbols and units of these properties are listed
below (besides being listed in the Nomenclature section).
Temperature, T, is in K,
density, ȡLVLQNJP3,
specific heat capacity, C p , is in J/kg·K,
viscosity, ȝLVLQ Pa·s,
surface tension, Ȗ, is in N/m, and
thermal conductivity, k, is in W/m·K.
2.1.1 Lithium Fluoride - Sodium Fluoride - Potassium Fluoride (LiF- NaF- KF)
One of the salts considered is lithium fluoride-sodium fluoride-potassium fluoride, also called FLiNaK,
with a molar composition of 46.5-11.5-42%. Some thermophysical properties of this salt are listed below.
Density, ȡ: Three correlations for density from literature are given below:
ȡ = 2555 – 0.6 •T, Grele and Gedeon [1954], and Hoffman and Lones [1955], (2.1)
ȡ = 2729.3 – 0.73 •T‚ Vriesema [1979], Ingersoll et al. [2007], and Williams et al. [2006], (2.2)
ȡ = 2579.3 – 0.624 T, Janz and Tomkins [1981], (2.3)
which has an uncertainty of ±2% and is valid only in the temperature range of 940–1170 K.
Viscosity, ˩: Several researchers have given correlations for the viscosity as listed below:
˩= 4.0x10⁻⁵ exp(4170/T), Ambrosek et al. [2009], (2.4)
˩= 1.1x10⁻⁴ exp(3379/T), Vriesema [1979], (2.5)
˩= 2.5.0x10-5 exp(4790/T), Grele and Gedeon [1954], and Hoffman and Lones [1955], (2.6)
˩= 2.487x10⁻⁵ exp(4478.62/T), Janz and Tomkins [1981], and Janz [1988]. (2.7)
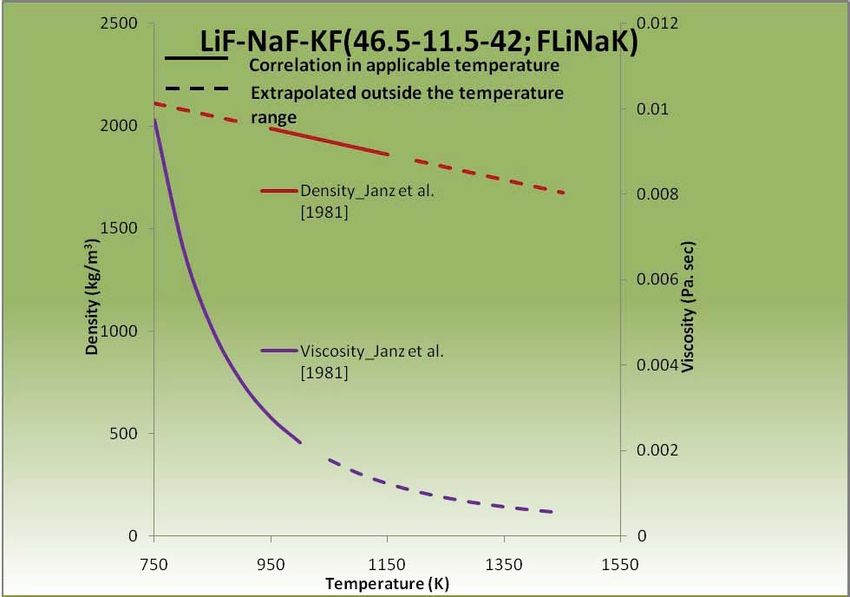
3Correlations (2.6) and (2.7) are nearly the same. Correlation (2.7) is applicable in the temperature range of
770–970 K and has an uncertainty of ±2%. From the correlations for density and viscosity, two
representative correlations are plotted in Figure 2.1. It should be noted that a solid line shows the property
in the applicable temperature range, whereas a dashed line shows the property extrapolated outside the
applicable temperature range. These plots show the need for experimental data in the extrapolated
temperature range.
Figure 2.1. Plots of density and viscosity correlations for FLiNaK molten salt.
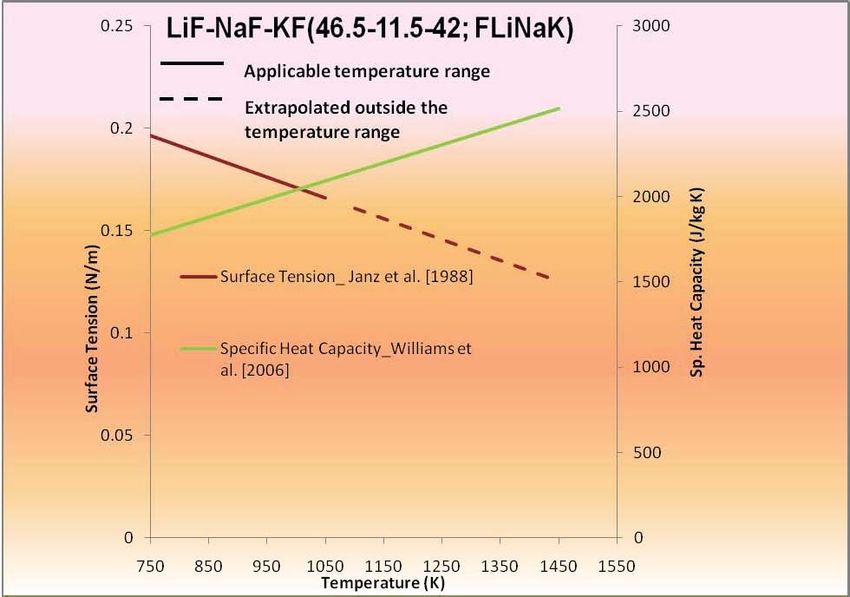
Surface Tension, Ȗ
Janz [1988] has given the following correlation for surface tension, which is valid
for the temperature range of 770–1040 K and has an uncertainty of ±2%:
Ȗ 0.2726 – 1.014x10⁻⁴ T. (2.8)
Specific Heat Capacity, C p : A correlation for heat capacity is given below:
C p = 976.78 + 1.0634•T, Williams et al. [2006]. (2.9)
Allen [2010] has given a constant specific heat capacity value of 1905.57 J/ kg·K at all the temperatures.
Williams et al. [2006] measured a value of 1884.06 J/kg·K at 973 K, which has an accuracy of ±10%.
Equation (2.9) gives a specific heat capacity value of 2011.47 J/kg·K at 973 K, which is ~6.7% off from
the measured value of Williams et al. [2006]. Grele and Gedeon [1954] gave a value of 2090 J/ kg·K.
Figure 2.2 shows the plots of surface tension and specific heat capacity values as calculated by chosen
4correlations. Here the questions remain about the accuracy of the predictions and whether specific heat
capacity is constant with respect to the temperature.
Thermal Conductivity, k:
k = 0.36 + 5.6x10⁻⁴ T, Smirnov et al. [1987]. (2.10)
This correlation is applicable in the temperature range of 790–1080 K. Smirnov et al. [1987] have
suggested a correction of ±0.012 for the thermal conductivity values, which may give an uncertainty of
1-5%, depending on the absolute value of thermal conductivity:
k = 24.288–6.042x10⁻² T + 4.222x10⁻⁵ T2, Janz and Tomkins [1981]. (2.11)
This correlation is applicable in the temperature range of 800–920 K and has an uncertainty of ±25%.
Allen [2010] suggested a more widely accepted correlation for thermal conductivity:
k = 0.43482 + 5.0x10⁻⁴ T. (2.12)
It should be noted that there is one typographical error in the correlation given by Allen [2010]. Hence the
term – (32/41.3) (as given on their web page) should be + (32/41.3). This correlation is applicable in the
temperature range of 900–1050 K and is similar to that given by Smirnov et al. [1987] in Equation (2.10).
Vriesema [1979] gave a value of 1.3 W/m·K, whereas Grele and Gedeon [1954], and Hoffman and Lones
[1955] gave a value of 4.5 W/m·K. Williams et al. [2006] indicated that the thermal conductivity at 973 K
will be in the range 0.6–1.0 W/m·K.
Figure 2.2. Plots of surface tension and specific heat capacity correlations for FLiNaK salt.
5Figure 2.3. Plots of thermal conductivity correlation and Nusselt number calculations for FLiNaK salt.
Figure 2.3 shows the plot of correlation for thermal conductivity from Smirnov et al. [1987] given in
Equation (2.10). In order to have a qualitative examination of the Nusselt number, the following
assumptions were made:
Dittus-Boelter correlation: Nu = 0.023 Re0.8 Pr0.4
Flow velocity = 0.1 m/s
Flow conduit diameter = 0.1 m.
These values were chosen arbitrarily and are assumed to be the same for all of the salts and may be far
from correct practical values. The objective is to make a performance comparison of various salts. Based
on the thermophysical properties, Figure 2.3 shows the variation of Nusselt number with respect to
temperature.
2.1.2 Lithium Fluoride - Beryllium Fluoride (LiF – BeF 2 )
Lithium fluoride - beryllium fluoride (LiF-BeF 2 , or 2LiF-BeF 2 ) with 67-33 mol% composition,
commonly known as FLiBe, is another molten salt that was considered for heat transport applications.
Density, ȡ: Several correlations for density from literature are given below:
ȡ = 2413–0.488•T, Janz et al. [1974], Janz [1988]. (2.13)
This correlation is applicable in the temperature range of 800–1080 K.
6Zaghloul et al. [2003] fitted the Janz et al. [1974] data with some values at critical conditons to obtain the
correlation for densty, which is applicable for the entire temperature range (melting point to critical point
of 732.2–4498.8 K):
ȡ 5.6 - 0.49072•T. (2.14)
Ignat’ev et al. [2006] noted non-linear behavior of density in the 943–1003 K range, which may be
because of gas bubbles formation. To correct this problem, Ignat’ev et al. [2006] developed the following
two correlations for density:
ȡ – A(T- 874.4), where (2.15)
A = (0.406±0.029), for T973 K.
Neglecting the uncertainties in the density measurements (± values of A), the density correlation of
Equation (2.15) can be simplified as follows:
ȡ – 0.406 T, for T973 K. (2.17)
Viscosity, ˩: Williams et al. [2006] have given the following correlation for viscosity, which is
applicable in the temperature range of 873–1073 K:
˩= 0.000116 exp(3755/T). (2.18)
Figure 2.4 shows plots of density and viscosity of correlations for FLiBe. The plots show the temperature
range where these correlations are not applicable, because no data are available to verify the correlations
in that temperature range.
7Figure 2.4. Plots of density and viscosity correlations for FLiBe molten salt.
Surface Tension, Ȗ
Yajima et al. [1982] correlated their own data and those by Janz et al. [1974], and
Cantor et al. [1969] to develop the following correlation for surface tension with an uncertainty of ±3%,
and applicable in the temperature range of 773.15–1073.15 K:
Ȗ= 0.295778 – 0.12x10⁻³ T, (2.19)
Zaghloul et al. [2003] extended the above correlation for surface tension by curve fitting to increase its
applicability from near melting to critical temperature (732.2–4498.8 K). This correlation is given below:
Ȗ= 0.26921 {1 – (T/4498.8)1.64} (2.20)
Specific Heat Capacity, C p : There are no simple correlations for heat capacity of FLiBe salt. The only
published analytical expression is given by Williams et al. [2006], which is based on Dulong and Petit’s
estimation equation [Grimes, 1966]. This method is accurate within only ±20%. This gives an analytical
value of 2397.73 J/kg·K at 973 K, whereas corresponding measured value is 2415.78 J/kg·K. Several
other publications have given the corresponding value in the 2350–2380 J/kg·K range. An unpublished
report [Gierszewski et al. 1980] has given a plot showing the value of specific heat capacity being
constant for temperature range of 600–1200 K.
Figure 2.5 shows plots for surface tension and specific heat capacity correlations for FLiBe. Surface
tension is assumed to be constant with respect to temperature. However, specific heat capacity values
need to be verified at higher temperatures.
Thermal conductivity, k: Ignat’ev et al. [2006], Williams et al. [2006], and Allen [2010] have given the
following relation for thermal conductivity applicable for the temperature range of 500–650 K.
8k = 32/(molecular mass in g/mole) – 0.34 + 0.0005•T,
k = 0.629697 + 0.0005•T. (2.21)
Only measured value of thermal conductivity is by Williams et al. [2001] at 873 K, which is 1.0 W/m·K
and the corresponding value from Equation (2.21) is 1.066 W/m·K.
Figure 2.6 shows plots for thermal conductivity correlation and calculated values of Nusselt numbers. It
should be noted that even though thermal conductivity correlation has limited temperature range for its
applicability, it is being taken as constant for the entire temperature range Its temperature dependency
correlation has not been determined. In Figure 2.5, specific heat capacity is also shown to be constant.
Therefore, the Nusselt number will vary proportional to (ȡ2/µ)0.4. Because viscosity decreases with
temperature, the Nusselt number increases with temperature.
Figure 2.5. Surface tension and specific heat capacity plots for FLiBe salt.
9Figure 2.6. Plots of thermal conductivity correlation and Nusselt number calculation for FLiBe.
2.1.3 Potassium Chloride-Magnesium Chloride (KCl – MgCl 2 )
Potassium chloride-magnesium chloride (KCl – MgCl 2 ) salt has a composition of 67-33mol%.
Density, ȡ: From several published papers, following two main correlations for density of KCl – MgCl 2
can be obtained:
ȡ = 2363.84í•T, (2.22)
ȡ = 2000.7 – 0.45709 •T, Janz et al. [1975], Janz et al. [1981], and Janz [1988]. (2.23)
Equation (2.23) is applicable in the temperature range of 1030–1140 K and has an uncertainty of ±1.5%.
Viscosity, ˩: Following correlation for viscosity is applicable for a temperature range of 873-1073 K.
(Note: The constant multiplier 1.46x10⁻⁴ is written erroneously as 1.46x10⁻⁵ in some publications.):
˩= 1.46x10⁻⁴ exp(2230/T) (2.24)
For a mixture with 32.4 mol% MgCl 2 , Janz et al. [1975] and Janz et al. [1981] gave the following
correlation for the viscosity of chloride salt:
˩ = 9.3463x10⁻³ -2.2533 x10⁻⁵ T + 2.5006 x 10⁻⁸ T2 -10.4550 x10⁻¹² T3. (2.25)
10For a mixture with 34.3 mol% MgCl 2 , Janz et al. [1975] and Janz et al. [1981], gave the following
correlation:
˩ = 12.0513x10⁻³ -2.018 x10⁻⁵ T + 1.0689 x 10⁻⁸ T2 -1.3348 x10⁻¹² T3. (2.26)
These correlations have an uncertainty of ±15%.
Janz et al. [1988] gave the following correlation for viscosity applicable in the temperature range of
900-1030 K:
˩= 1.408 x10⁻⁴exp(2262.979/T). (2.27)
Figure 2.7 shows the plots of density and viscosity correlations for chloride salt mixtures.
Figure 2.7. Plots of density and viscosity correlations for chloride salt.
Surface Tension, Ȗ
Janz et al. [1975] gave the following correlation for surface tension applicable for
the temperature range of 1120–1170 K. This correlation is valid for 70 mol% KCl – 30 mol% MgCl 2 :
Ȗ = 0.133 – 0.48x10⁻⁴ T. (2.28)
Janz [1988] gave the following correlation for surface tension applicable for the temperature range of
1020-1135 K:
11Ȗ = 0.12813 – 0.4548x10⁻⁴ T. (2.29)
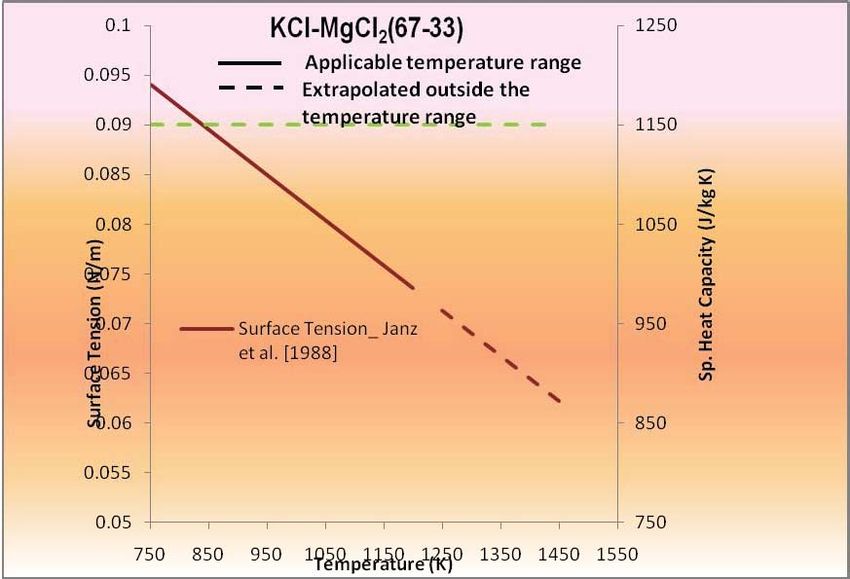
Figures 2.8 and 2.9 show plots for correlations for density and viscosity of chloride molten salt in
applicable and extrapolated temperature range.
Specific Heat Capacity, C p : There are no correlations for heat capacity of Potassium Chloride-
Magnesium Chloride salt. There is only one constant value of 1150 J/kg K given by Ambrosek [2010].
Thermal Conductivity, k: Janz et al. [1981] gave following correlation for thermal conductivity
applicable for the temperature range of 730–760 K with an uncertainty of ±20%:
k = 0.2469 + 5.025 x 10⁻⁴ T. (2.30)
Williams et al. [2006] reported a measured value of 0.4 W/m·K at 894 K.
Figure 2.8. Plots of surface tension correlation and specific heat capacity values for chloride salt.
12Figure 2.9. Plots of thermal conductivity correlation and Nusselt number calculations for chloride salt.
2.1.4 Sodium Nitrate-Sodium Nitrite-Potassium Nitrate (NaNO 3 –NaNO 2 –KNO 3 )
Sodium nitrate-sodium nitrite-potassium nitrate (NaNO 3 –NaNO 2 –KNO 3 ) mixture may have composition
in the range of (7-49-44 mol%, 7-40-53 wt.%). Following correlations are for the composition 7-49-44
mole% unless specified otherwise.
Density ȡ: Janz et al. [1981] gave the following correlation for density in the temperature range of 470-
870 K with an uncertainty of ±2%:
ȡ = 2293.6 – 0.7497 T. (2.31)
Viscosity˩: Janz et al. [1981] gave the following correlation for viscosity in the temperature range of
420-710 K with an uncertainty of ±16%:
˩= 0.4737 – 2.297 x 10⁻³ + 3.731 x 10⁻⁶ T2 – 2.019 x 10⁻⁹ T3. (2.32)
In Janz et al. [1981], the correlation for viscosity (Equation 148.3) has erroneously left out a term ( + d
T3), where d = – 2.019 x 10⁻⁶.
Figure 2.10 shows the plot of density and viscosity correlations in the applicable temperature range. From
the figure, it is obvious that above 700 K, the correlation given in Equation (2.32) is no longer valid and
the viscosity values become negative.
13Surface Tension Ȗ
Janz et al. [1981] gave the following correlation for surface tension in the
temperature range of 570–670 K with an uncertainty of ±10%:
Ȗ = 0.14928 - 0.556 x10⁻⁴T. (2.33)
Specific Heat Capacity, C p : Janz et al. [1981] gave the following correlation for specific heat capacity
in the temperature range of 426–776 K with an uncertainty of ±5%.
C p = 5806 – 10.833 T + 7.2413 x 10⁻³T2. (2.34)
Thermal Conductivity, k: There are no correlations for thermal conductivity of sodium nitrate-sodium
nitrite-potassium nitrate mixture.
Equations (2.31-2.34) and Figures 2.10 and 2.11 show the missing properties data for molten nitrate salt
above a temperature of 700 K.
Figure 2.10. Plots of density and viscosity correlations for nitrate salts.
14Figure 2.11. Plots of specific heat capacity and surface tension correlations for nitrate salts.
152.2 Effect of Uncertainty in Thermophysical
Properties on the Nusselt Number
The accuracy in the thermodynamic and thermophysical properties is needed to perform design
calculations for heat transport, heat exchanger design, and other component calculations. In order to
determine the effect of the individual properties (such as density, heat capacity, thermal conductivity, and
viscosity) on the Nusselt number, the respective property is varied by the amount of the uncertainty given
in the property correlation. The resulting maximum deviation (uncertainty) in the Nusselt number is given
in Table 2.1. All of the properties and uncertainties were calculated at an arbitrarily chosen temperature of
1000K. However, for the nitrate salt mixture, the chosen temperature was 700 K.
Table 2.1. Uncertainty in the Nusselt number.
Molten Salt Coolant Molar Composition Uncertainty in the Nusselt number
LiF-NaF-KF (FLiNaK)
at 1000 K 46.5-11.5-42 ±2.5%
2LiF-BeF 2 (FLiBe)
at 1000 K 67-33 íWR
KCl-MgCl 2
at 1000 K 67-33 íWR
NaNO 3 -NaNO 2 -KNO 3
at 700 K 7-49-44 íWR
Another worst case scenario was employed to estimate the uncertainty in the Nusselt number as a result of
uncertainties in thermophysical properties. In this situation, all of the properties were assumed to vary
simultaneously by an amount equal to their respective maximum uncertainties. Then, the Nusselt number
uncertainty was calculated based on a simple Dittus-Boelter correlation.
Dittus-Boelter: Nu = 0.023 Re0.8 Pr0.4
Thus, Nu = C 1 (Re)0.8 (Pr)0.4 , where C 1 is a constant. This leads to the following relation:
NXSURSRUWLRQDOWR> ȡ2 C p ) / ȝN @0.4 (assuming constant velocity and constant pipe dimension),
0.4
ª( U 2 C p ) º
« ( P k )»
Nu ¬ ¼ , (2.35)
Nu c ª ' 2 c º
0.4
(U C p )
« ( P c k c)»
«¬ »¼
0.4
ª 2 §
C ·º
« §¨ U ·¸ ¨ p ¸ »
«¨ U c ¸ ¨ c ¸ »
Nu « © ¹ ¨© C p ¸¹ »
, (2.36)
Nu c « § P · § k · »
« ¨¨ ¸¸ ¨ ¸ »
« © Pc ¹© kc ¹ »
¬« ¼»
where prime represents the property values with maximum variation because of uncertainty.
16Using this proportionality, any variation in thermophysical properties can give a corresponding variation
in the Nusselt number. All of the properties were allowed to deviate so as to create maximum deviation in
the Nusselt number. For example, when the density and specific heat capacity were allowed to increase
(by the amount of uncertainty), the viscosity and thermal conductivity were allowed to decrease (by the
amount of uncertainty). Based on this logic, the uncertainty values for various salts were determined and
are shown in Table 2.2.
Table 2.2. Worst case scenario for uncertainty in the Nusselt number.
Molten Salt Coolant Uncertainty in the Nusselt number
LiF-NaF-KF (FLiNaK) ±8%
2LiF-BeF 2 (FLiBe) ±9%
KCl-MgCl 2 ±18%
NaNO 3 -NaNO 2 -KNO 3 ±11%
2.3 Summary of Thermophysical Properties Characteristics
In general, it is assumed that the thermodynamic and thermophysical properties should be valid in the
temperature range of freezing temperature to highest working temperature in the nuclear reactor. This
gives a working temperature range of ~750–1500 K. Equations (2.1) – (2.34) give all of the correlations
that are available in the literature for the four molten salts being considered. Figures 2.1 – 2.11 show plots
for thermophysical properties in the applicable temperature range and calculated values of the Nusselt
number. In order to design any heat exchanger and piping system, an accurate estimate of the Nusselt
number and pressure drop is needed. These in turn depend on the thermophysical properties. Tables 2.1
and 2.2 showed that in the worst case scenario, the impact on the Nusselt number is within an error of
±10-20%, which is within engineering design estimate. From the data and plots shown in Section 2.2, a
few issues related to thermophysical properties become quite clear, which are listed below:
1. Lack of Data in Extended Temperature Range: Data provided in Section 2.2 show that the
lack of completeness of molten salt data is the biggest drawback. Figures 2.1 – 2.11 show that the
properties were extrapolated in temperature range, where the property correlation was not
considered to be applicable.
2. Properties as a function of Temperature: Some thermophysical properties were assumed to be
constant and a thorough investigation was not conducted to test dependency of properties on
temperature, especially at higher temperatures.
3. Lack of Properties Correlations: There are no data and corresponding correlations for some
properties; for example, thermal conductivity of nitrate salts and specific heat capacity for
chloride salts.
4. Accuracy of Properties Values: Janz and his colleagues performed the last extensive evaluation
of properties data ~30 years ago for many molten salt mixtures. Since then, properties measuring
instrumentation has significantly improved. However, no effort has been made to verify the old
properties values.
5. Effect of Salt mixture Composition Variation on Properties: During the past ~50 years, the
salt composition for each component of FLiNaK, FLiBe, chlorides, and nitrates has varied by
5-10%. No data could be obtained to scientifically quantify variation in thermophysical properties
as a function of component percentage. Therefore, many properties correlations originally
developed for one set of composition are being applied to a salt mixture with a different
composition.
173. HEAT TRANSFER CHARACTERISTICS
Heat transfer characteristics of molten salts depend on thermophysical properties. Therefore, in this
section, simple convective heat transfer data and corresponding correlations applicable for molten salts
are briefly reviewed. The objective is to establish if there are any of the thermophysical properties that
significantly impact the Nusselt number calculations. One such review was performed by Ambrosek et al.
[2009].
Ambrosek et al. [2009] compiled convective heat transfer data for FLiNaK salt from Vriesema [1979], as
shown in Figure 3.1, and from Grele and Gedeon [1954] and Hoffman and Lones [1955], as shown in
Figure 3.2. It can be seen from Figure 3.1 that the Dittus-Boelter correlation (Equation 3.1) predicts ~15%
higher heat transfer than that shown by the experimental data.
Figure 3.1. Comparison of FLiNaK convective heat transfer experimental data of Vriesema [1979] with
Dittus-Boelter correlation; Ambrosek et al. [2009].
Figure 3.2 shows the comparison of experimental convective heat transfer data from Grele and Gedeon
[1954] and Hoffman and Lones [1955] versus the Dittus-Boelter correlation for comparison of
experimental data. The data taken in type 316 stainless steel and the nickel pipes show a reasonable
comparison. However, the data obtained in the Inconel alloys pipe showed a deviation of ~60% from the
correlation predictions. One possible reason of this discrepancy could be inaccurate thermophysical
properties of the FLiNaK salt. Of the properties that were used in the experimental analysis, only the
thermal conductivity values were considered to significantly influence the heat transfer (Nusselt and
Prandtl numbers) values. Previous researchers, Grele and Gedeon [1954], Hoffman and Lones [1955], and
Vriesema [1979], had used thermal conductivity values of 4.5, 4.5, and 1.3 W/m·K, respectively. In order
to test this possibility, Ambrosek et al. [2009] reanalyzed each of these experiments with consistent and
the most widely accepted values for the FLiNaK salt thermophysical properties. Three values used for the
thermal conductivity of FLiNaK were 0.6 W/m·K, 1.0 W/m·K, and (0.36 + 0.00056 T) W/m·K. The
18correlation of (0.36 + 0.00056 T) W/m·K was given by Smirnov et al. [1987]. The value of the thermal
conductivity found experimentally by Smirnov et al. [1987] gave actual values of 0.81 to 0.93 W/m·K
over the temperature range of ~808–1024 K. The analysis of the experimental data using either Smirnov
et al.’s [1987] correlation for thermal conductivity, or the value of 1.0 W/m·K that shows that the
experimental convective heat transfer data overpredict the Dittus-Boelter correlation by ~15% for the
Reynolds numbers range of ~10,000 to 100,000. This comparison is shown in Figure 3.3.
Figure 3.2. Comparison of FLiNaK convective heat transfer experimental data of Grele and Gdeon
[1954] and Hoffman and Lones [1955] with Dittus-Boelter correlation, Ambrosek et al. [2009].
Figure 3.3. FLiNaK experimental data of Hoffman and Lones [1955], Grele and Gedeon [1954], and
Vriesema [1979] in Inconel-based tubes were reanalyzed using the thermal conductivity measured by
Smirnov et al. [1987].
Liu et al. [2009] performed experiments with molten salt (LiNO 3 ) in the Reynolds number range of
19,800 to 46,000. The Prandtl number of LiNO 3 is in the range 12.7 – 14.7. They used the well known
19convective heat transfer correlations by Dittus-Boelter, Sieder-Tate, Hausen, and Gnielinski. These
correlations are shown in Equations (3.1) – (3.4):
Dittus-Boelter: Nu = 0.023 Re0.8 Prn, where 0.3Figure 3.4. Comparison of Liu et al. [2009] molten salt data (a) their correlation, Equation (3.5), and
(b) with Sieder-Tate correlation, Equation (3.2).
21Figure 3.5. Correlation of Lu et al. [2009] molten salt data with Equation (3.6), Wu et al. [2009].
Figure 3.6. Correlation of Lu et al. [2009] molten salt data with Gnielinski Equation (3.4), Wu et al.
[2009].
22Figure 3.7. Correlation of Lu et al. [2009] molten salt data with Hausen, Equation (3.3), Wu et al. [2009].
Figure 3.8. Thermophysical properties dependency in terms of Prandtl number exponential derived from
convective heat transfer data for molten salts and some other fluids, Wu et al. [2009].
234. MOLTEN SALT THERMOCHEMICAL STABILITY AND ALLOY
CORROSION IN MOLTEN SALT SYSTEMS
Four eutectic salt systems are being considered for nuclear applications: FLiBe for a primary coolant
loop; FLiNaK or KCl-MgCl 2 for the secondary process loop; and the ternary salt NaNO 3 -NaNO 2 -KNO 3
(7-49-44 mol%, respectively; also known as Hitec® salt) for a low-temperature process loop. Potassium
has a large neutron capture cross-section. Therefore, salt mixtures containing potassium are not suitable as
primary coolants [Ingersoll et al. 2006]. These salt systems are characterized by low melting points, low
vapor pressures at operating temperatures, and good thermal conductivity. The remaining issues are their
stability and compatibility with the structural alloys. The characteristics are reviewed in the following
sections.
4.1 Radiolytic and Thermal Stability of Molten Salts
Fluoride and chloride salts are radiolytically and thermally stable in a reactor environment and
temperatures to 1000°C or more. Fluorides were successfully used as the molten fuel salt in the Aircraft
Reactor Experiment and in the Molten Salt Breeder Reactor with no detectable degradation of the salts by
radiolysis or thermolysis [Williams et al. 2003, Williams et al. 2006, Grimes 1967, Grimes et al. 1972].
The fluoride salts have withstood the effects of reactor radiation, uranium fissions in the fuel salt, and the
accumulation of fission products in the salt. Many irradiation tests were conducted in the 1950s at ORNL
to evaluate the radiolytic stability of fluoride salts at temperatures greater than 800°C and fission power
densities ranging from 80–1000 W/cm3 fuel, with no degradation of the molten fluoride salt. While
radiation and fission fragment recoil will dissociate the fluorides, the recombination reactions are very
rapid in the molten state; in irradiation testing, no elemental species such as F 2 survived long enough to
be released from the molten salt. This mechanism is supported by observations that irradiated fluoride
salts, when allowed to freeze, did release F 2 because of the slowness of recombination reactions in the
solid state. The release was not caused by reactor radiation, but by the radiation from embedded fission
products, for the F 2 release rate decreased with time, consistent with fission product decay
[Grimes et al. 1972].
The ORNL irradiation tests were performed on fluoride fuel salts. However, the coolant salts should be
just as robust. In addition, the coolant salts will experience a much lower radiation field in the absence of
fission recoil, alpha radiation or beta radiation from the entrained uranium and fission products.
Therefore, the experience with fuel salts, both in testing and in the ARE and MSRE reactors, can be
safely extrapolated to the coolant salts. FLiBe was used successfully as a matrix salt for the MSRE fuel
salt, and in pure state as the MSRE coolant salt, and performed excellently in those functions for the life
of the experiments [Grimes et al. 1972].
Chlorides have not been used as fuel salts or primary coolants because of their thermal neutron cross-
sections (chlorides could be used for primary coolants only if the salt is purified isotopically to 37Cl to
avoid nuclear transmutation issues). However, because of the similarity of molecular structure and free
energy of formation, similar radiolytic and thermal stability is expected for the chlorides
[Grimes et al. 1972].
If the fluoride salts (FLiBe or FLiNaK) are used as the primary coolant, transmutation of Li and F by
neutron radiation could generate H and O by the reactions:
6
/L QĮ 3H
7
/L QQ¶Į 3H
19
F (n, np) 18O
19
F (n,2H) 18O
2419
F (n, 3H) 17O
19
F (n, n3H) 16O
9
%H QQĮ Į
9
Be ( n, 2n) 8Be ĺ 2Į
These transmutations could gradually produce O 2 , H 2 O, and HF from the salt, thereby increasing the
fluoride potential (i.e., oxidation potential) of the salt [Terai et al. 2001, Yamanishi et al. 1998, Calderoni
et al. 2009].
The radiolytic stability of nitrate-nitrite salts, such as the Hitec mixture, is not as well defined. Nitrates
may be radiolytically stable enough in a reactor environment, but have not been tested because of the
thermal instability of the salts at primary coolant temperatures [Grimes et al. 1972]. Breon et al. [1980]
irradiated Hitec salt with Co-60 gamma radiation to a total dose of 8x10⁸ R with no detectable
deterioration of the salt. NaNO 3 -KNO 3 mixture (Draw Temp 430ºC, 50 wt%-50%, respectively)
performed similarly [Breon et al. 1980].
The radiation stability may be a moot issue for Hitec salt because of the inherent thermal instability of the
mixture at primary coolant temperatures. Hitec heat transfer salt is thermally stable up to 454°C; the
maximum recommended operating temperature is only 538°C, although the salt has been used for short
times at temperatures above 550°C. The nitrate components of the Hitec mixture are thermally unstable,
decomposing to the nitrite and oxygen by the reaction [Carling and Bradshaw 1986, DeVan and Tortorelli
1980]:
MNO 3 ļ012 2 + ½ O 2 (4.1)
where M is Na, K, or Li. The characteristic decomposition temperatures are about 600°C in air [Carling
and Bradshaw 1986]. However, above 454°C under inert gas, the nitrite in the Hitec salt begins to
decompose to the nitrate and oxide by several routes, depending on specific conditions of temperature and
impurities [Coastal 2009, Singh et al. 1985, Carling and Bradshaw 1986, Keiser et al.1979]:
5MNO 2 ļ012 3 + M 2 O + N 2 , (4.2)
2MNO 2 ļ0 2 O + NO 2 + NO, (4.3)
2MNO 2 ļ0 2 O + 3/2 O 2 + N 2 . (4.4)
Above 800°C, the reaction is so rapid that the molten salt appears to boil due to the evolution of N 2 and
NO x (Coastal 2009). The ultimate products of the decomposition process are the peroxides and super-
oxides, both potent oxidizers, which are formed by the reaction of nitrate and oxides produced by nitrite
decomposition [Singh 2002, Singh et al. 1985, Brashaw and Siegel 2008, Heine et al. 1982]:
M 2 O + MNO 3 ļ0 2 O 2 + MNO 2 . (4.5)
M 2 O 2 + 2MNO 3 ļ02 2 + 2MNO 2 . (4.6)
The effect of these decomposition reactions is important, for metal per- and super-oxides tend to be quite
corrosive at high temperatures.
When molten Hitec salt is exposed to air, the nitrite is slowly oxidized to nitrate by oxygen [Coastal 2009,
Bradshaw and Siegel 2008]:
2NaNO 2 + O 2 ļ1D12 3 . (4.7)
25The equilibrium nitrite salt concentration in the above reaction is less than 1 wt% for temperatures less
than 600°C. Therefore, Hitec salt must be protected from air exposure to prevent the oxidation of the
nitrite to nitrate, the reverse of the nitrate decomposition reaction [Bradshaw and Siegel 2008].
Finally, Hitec salt is chemically unstable if exposed to ambient air for prolonged periods. Hitec salt can
absorb carbon dioxide from ambient air forming the corresponding carbonates which precipitate from the
salt. Furthermore, Hitec also absorbs moisture from air, which can slowly hydrolyze the salt and form
alkali hydroxides [Carling and Bradshaw 1986, Bradshaw and Siegel 2008]. As with the thermal
decomposition reactions, the reactions with CO 2 and H 2 O will gradually change the salt composition to
the oxides and carbonates, increase the melting temperature, increase the corrosion potential, and change
the thermal characteristics of the salt mixture.
4.2 Corrosion Mechanisms
Corrosion of metals is an electrochemical reaction that involves oxidation of the less noble anodic
material and reduction of the more noble cathodic material in an oxidation-reduction (redox) couple. For
metals exposed to air, water, or acids, the process generally results in the formation of oxides or salts.
Corrosion of some metals or alloys in air or water can form adherent oxide layers that progressively retard
the diffusion of oxidant to the reaction interface at the alloy surface, and thereby protect or ‘passivate’ the
alloy surface. Such alloys generally contain significant levels of chromium, aluminum, or several other
elements that form adherent oxides (such as Cr 2 O 3 or Al 2 O 3 ).
Compatibility of molten salts with structural metals centers on the potential for oxidation of the structural
metal to the corresponding fluorides or chlorides. Pre-existing protective oxide layers might not protect
the alloy from further molten salt corrosion. Unlike corrosion in air or water, corrosion in fluoride molten
salts results in the destruction of passivating oxide layers on metals, and the dissolution of the salts
formed by the process. In contrast, protective oxide layers tend to be stable in chloride and in
nitrate/nitirite molten salts.
Molten salts are ionic and form electrically conducting fluids in the molten state. They are good solvents
for metal salts, and can support corrosion, an electrochemical process. In general, the laws of
electrochemistry and mechanisms of corrosion are comparable for aqueous solutions and molten salts.
Consequently, the corrosion mechanisms that are commonly seen in aqueous environments, including
uniform surface corrosion, pitting corrosion, crevice corrosion, and intergranular corrosion, are also
pertinent to molten salts [Lovering and Gale 1983, Heine et al. 1982, Kane 2003]. The molten salt
literature has identified several corrosion mechanisms, including:
x Intrinsic Corrosion: The intrinsic corrosion mechanism is driven by the difference in free
energy of formation between the salt constituents and the most susceptible transition metal
corrosion product (the more negative the free energy of reaction, the more likely is the reaction).
As discussed in the following sections, this mechanism pertains to nitrate/nitrite molten salts,
which are oxidizing media, and form oxides on most transition metal alloys. For fluorides and
chlorides, the salt constituents have much lower free energy of formation and are intrinsically
more stable than the corresponding transition metal salts, so that reaction is unlikely.
x Corrosion by Oxidizing Contaminants: Some oxidizing contaminants in the molten salts, such
as HF, HCl, H 2 O, residual oxides of metals, or easily reducible ions, especially some polyvalent
metal ions can also cause corrosion. In this case, corrosion of alloy components is possible
because the free energy of formation of contaminants such as HF, HCl, and H 2 O is comparable to
or more positive than those of the transition metal corrosion products. However, with purified
salts in a closed system, this mechanism may be short-lived, limited, and insignificant compared
to persistent, continuous corrosion mechanisms. The corrosion kinetics for low-level
26contaminants is expected to be very slow, and once the low-level contaminants are consumed by
the reaction, corrosion ceases.
x Differential Solubility: Differential solubility due to thermal gradients in the molten salt system,
with formation of a metal ion concentration cell can also drive corrosion. Because the saturation
solubility of transition metal halides in the molten salts is a strong function of temperature, a
temperature gradient in the molten salt can form a concentration gradient of dissolved metals, and
consequently an electromotive potential difference between the hot leg and cold leg in the molten
salt. This means that the electrochemical potential at the hot leg of the gradient will oxidize and
dissolve alloy components, and redeposit them at the more cathodic cold leg.
x Galvanic Corrosion: The metals or materials with differing electromotive potentials are
maintained in electrical contact by the molten salt, driving the oxidation of the anodic material.
The mechanism is sensitive to physical factors, such as anode to cathode area ratio. If the anodic
material has small surface area relative to the cathode, corrosion at the anode will be much more
aggressive than for the converse configuration.
These mechanisms are discussed further by salt type in the following sections.
4.2.1 Fluoride and Chloride Salts
In most corrosion and oxidation processes, alloys derive their resistance to corrosion from thin but dense,
adherent protective oxide layers that passivate the surface. These generally are chromium, aluminum or
silicon oxide, which limit the diffusion of oxidants to the reactive surface. Molten fluorides are excellent
fluxes and will convert the metal oxide to the corresponding fluorides, which often are soluble in the
molten salt [Kane 2003, Lovering and Gale 1983]. The process removes the passivating film, and exposes
the surface to corrosion that is driven by the thermodynamic dissolution of chemically active components
of the alloy. Once the protective oxide is destroyed, further corrosion generally proceeds by attack of the
least noble metal constituent in structural alloys, which generally is Cr, forming the corresponding
fluoride [Keiser 1977, Williams et al. 2006, Olson 2009, Olson et al. 2009]. In molten halides, corrosion
can be minimized if thermodynamic equilibrium can be established between the alloy and the molten salt,
such that the free energy of formation of the halides of the exposed alloy constituents is comparable or
less than the free energy of formation of the molten salt, or that the solubility of the product halide in the
salt is low [Ingersoll et al. 2006, Grimes et al. 1972, Williams et al. 2006, Cramer and Covino 2003,
Nishimura et al. 2001].
Corrosion by the Molten Salt: The relative stability of fluoride compounds correlates approximately
with the free energy of formation per mole fluoride, with thermodynamic stability increasing with
decreasing (more negative) free energy. The free energies of formation of the fluoride constituents of the
molten salt are more negative than -100 kcal/mol F while those of the common transition metals range
between -50 to -100 kcal/mol F as shown in Table 4.1. Because of their negative free energy, alkali and
alkaline earth fluorides are some of the weakest oxidizers of metals [Ozeryanaya 1985]. The components
of the molten salts FLiBe and FLiNaK are much more thermodynamically stable than the fluorides of the
transition metals that comprise containment alloys; of the transition metal components, only chromium
would be susceptible to reaction. There is no appreciable thermodynamic driver for corrosion of the alloys
by molten fluorides to any significant extent. Therefore, pure molten fluoride salts will not react with the
components of containment alloys [Grimes 1967, Sridharan et al. 2008, Olson 2009, Haubenreich and
Engel 1970, Kondo et al. 2009a, Kondo et al. 2009b, Petti et al. 2006, Baes 1974].
27You can also read