GABRIOLA HEALTH REPORT 2020 - Sustainable Gabriola

 
CONTINUE READING
GABRIOLA HEALTH REPORT 2020 - Sustainable Gabriola
2020 GABRIOLA HEALTH REPORT
— taking the pulse of our island

                                   Photo: Nola Johnston
GABRIOLA HEALTH REPORT 2020 - Sustainable Gabriola
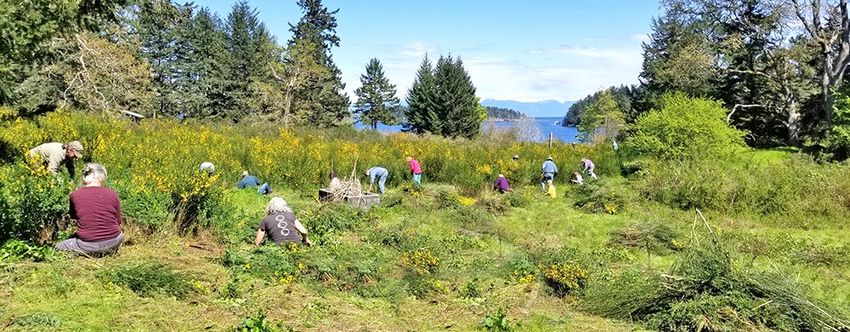
GHWC respectfully acknowledges and recognizes the Coast Salish
Nations whose territory we live and work on. In particular, we
acknowledge and recognize Gabriola Island as the unceded territory
of Snuneymuxw First Nation (SFN). We respect the longstanding
relationships that Coast Salish and Hul'qumi'num speaking Nations
have to this land, as they are the original caretakers. We acknowledge
that the Snuneymuxw Treaty of 1854 (Douglas Treaties) was signed
with the British Crown and colonial governments and asserts SFN
treaty rights and title. We acknowledge and recognize that SFN rights
and title is affirmed by section 35 of the Constitution Act, 1982.
GABRIOLA HEALTH REPORT 2020 - Sustainable Gabriola
Table of Contents
Acknowledgement                                                School Enrolment                              9
A. Introduction and Background                      1          Licensed Child Care Spaces                    9
                                                           Library Usage                                     10
B. Gabriola and Its People                          2
                                                               Cardholders                                   10
    Size and Location                               2
                                                               Items Borrowed Per Capita                     10
    Climate                                         2
                                                               Program Participation                         10
    Population                                      2
    Births and Deaths                               2   C. Economic Health                                   11
    Median Age                                      2       Economy                                          11
    Age Distribution                                3           Industrial Mix                               11
    Gender                                          3           Local Business                               11
    Indigenous Identity                             3           Local Investment                             12
    Ethno-Cultural Composition                      3       Employment                                       12
    LGBTQ2S                                         3           Labour Force Status                          12
    Households                                      3               Participation Rate                       12
        Total Households                            3               Unemployment Rate by Gender              12
        Average Household Size                      3               Employment Rate                          12
        Households by Size                          4           Work Activity                                13
        Household Type                              4           Class of Worker                              13
    Families                                        5           Occupations                                  13
        Total Families                              5       Income                                           14
        Average Family Size                         5           Source of Income                             14
        Family Composition                          5               Source of Income by Gender               14
        Families by Size                            5           Individual Income                            15
        Couples With and Without Children           6           Singles Income                               15
        Couple Families – Number of Children        6           Family Income                                16
        Lone Parent Families – Number of Children   6               Median Family Income                     16
        Lone Parent Families by Sex of Parent       6           Employment Income                            16
    Housing                                         7               Median Employment Income                 16
        Private Dwellings and Occupancy             7           Low Income                                   17
        Housing Tenure                              7               People in Low Income                     17
        Housing Condition                           7               People in Low Income by Age              17
        Average Value of Dwellings                  8               People in Low Income by Age and Gender   17
        Median Monthly Shelter Costs                8   D. Community Wellbeing                               18
        Core Housing Need                           8       Health Care                                      18
        Homelessness                                8          Primary Health Care Services                  18
        Mobility                                    8               General Information                      18
    Education and Learning                          9               Physician Attachment                     18
        Education Levels                            9               Alternative Care                         18
        Educational Attainment                      9          Acute Care Services                           18
        Educational Attainment by Gender            9               Urgent Care Services                     18
Table of Contents
          Cases by Age and Sex                                    19                 Policing Statistics                 29
          Cases by Diagnosis                                      19                      Police Situation Resolutions   29
          Cases by Method of Arrival                              19                      Mental Health Callouts         29
     Cases by Attachment                                          19                 Emergency Preparedness              29
          Cases by Urgency                                        19
                                                                       E. Sustainability                                 30
          Cases by Type and Outcome                               20
                                                                           Environment                                   30
          Ambulance Trips                                         20
                                                                               Conservation and Protection               30
          Emergency Department Utilization                        20
                                                                                   Protected Land, Parks and Trails      30
          Hospitalizations                                        20
                                                                                   Protected and Unprotected Land        30
     Health Status: Disease                                       21
                                                                                   Meeting the Protected Land Target     30
          Chronic Diseases by Prevalence                          21
                                                                                   Managing Invasive Plants              31
          Chronic Diseases by Incidence                           21
                                                                                   Sustainability Issues                 31
          Cancer                                                  21
                                                                                          Greenhouse Gas Emissions       31
          Suicide                                                 21
                                                                                          Heat Pumps                     31
 Social Inclusion                                                 22
                                                                                          Recycling / Reuse              31
     Affordable Housing                                            22
                                                                                     Food Security                       32
     Grocery and Meal Programs                                    22
                                                                                          Agricultural Land              32
          Grocery Program Participants by Primary Income Source   22
                                                                                          Working Farms                  32
          Grocery Program Participants by Age                     22
                                                                                          Community Gardens              32
          Grocery Program Participants by Family Type             22
                                                                                          Farmers Markets                32
          Grocery Program Participants by Primary Reason for
                                                                                          Food Recovery                  32
               Accessing Food Bank                                22
                                                                                     Public Transportation               33
          Grocery Program Participants by Housing Situation       22
                                                                                          Bus Service and Ridership      33
          Meals Program                                           22
                                                                                          Ferry Service and Ridership    33
     Subsidized GERTIE Rides                                      23
                                                                       F. Endnotes                                       34
     Taxi Saver                                                   24
     Discount Ferry Experience Cards                              24
 Civic Engagement                                                 25
     Community Involvement                                        25
          Community Participation                                 25
          Arts and Culture                                        25
          Recreation                                              26
     Governance                                                   27
          Local Government Elections Voter Turnout                27
          Provincial Election Voter Turnout                       27
          Federal Election Voter Turnout                          27
     Safety                                                       28
          Emergency Services                                      28
             Ambulance Service Callouts                           28
             Fire Services Callouts                               28
             Police Services Callouts                             28
A. Introduction and Background
The Gabriola Health and Wellness Collaborative (GHWC) has produced the              include more local data to create an even more robust picture of Gabriola’s
Gabriola Health Report to provide all Gabriolans access to data that reflects the    health and wellbeing.
health of our island community. Taking a broad approach to the definition of
health, this report provides a comprehensive picture of many aspects of             To understand how Gabriola fits within the region and the province, we have
community health. It casts light on the health status of our population and         included data comparisons with other communities. We chose to compare
provides information that can help us set priorities for improving the health       with Bowen Island, because it is a ferry-dependent Trust island with a similar
and wellbeing of our community. It is our hope that this report will prove useful   population and proximity to a large urban centre; Nanaimo, because it is our
not only to community organizations in their activity and program planning but      major service centre encompassing urban and more rural areas; and, BC to
to all Gabriolans wanting to know more about their community.                       show how all three communities fit in the larger picture.

                                                                                    Note that the data in this report was largely captured and describes
Data Sources and Methodology                                                        conditions before the COVID-19 pandemic.

This report takes a “social determinants of health” approach. As such, we have
not only included data on issues like disease prevalence and health care
availability, but also data that reflects on the broader social and economic
conditions that can and do have real impacts on people’s health – including             Acknowledgements
income levels, housing affordability and quality, attachment to the workforce,
education levels, environmental quality, food security, social inclusion, and           The Gabriola Health and Wellness Collaborative
engagement in civic and community life.                                                 (GHWC) is a voluntary network of over 40
                                                                                        organizations and individuals working to improve
The data in this report comes from two sources: the 2016 Canadian Census of             health outcomes for Gabriolans throughout their
Population, produced by Statistics Canada, and data shared by local Gabriola            lives. GHWC takes a systems approach to health
organizations as well as from their websites.                                           that looks at the environment, the people, and the
                                                                                        ways they interact. Each year it sets priorities
Most of the demographic and economic data in this report comes from the
                                                                                        which it achieves through mutual support,
2016 Gabriola Island Trust Area Census Profile.1 While most Census data
                                                                                        shared advocacy and coordinated use of resources.
reflects the situation of respondents as of the May 10, 2016 census date,
income data reflects full-year 2015 incomes. We recognize that Census data               This project was managed by Collaborative member Dyan
has some limitations, including that people in some demographic groups – such           Dunsmoor-Farley. Data quality assurance oversight was provided by
as those who may be economically disadvantaged or socially excluded – have a            Dr. Don Sutherland. Researcher Jennefer Laidley went above and
higher rate of non-response to the Census than others. For example, since the           beyond in collecting, analyzing and organizing the data, which was
Census is largely delivered through the mail, the experiences of people who are         translated into graphics by Kevan Heughan of Gabriola Graphics.
homeless are not taken into account. The next Canadian census will take place
in May 2021.                                                                            The project would not have been possible without the generous
                                                                                        support of the Gabriola Health Care Foundation and the Gabriola
Data provided by local organizations provides a more in-depth look at                   Auxiliary for Island Health Care Society and the participation of
particular aspects of Gabriola life, such as issues reflecting community                 many individuals and organizations that contribute to Gabriola's
wellbeing, sustainability, social inclusion and civic engagement. We thank those        community life.
organizations that contributed their data to the report and have highlighted
their contributions in the text. We hope that future editions of this report will

                                                                                                                                                                     1
A
B. Gabriola and Its People                                                                                                                        2006          2016
                                                                                                                                                                             RATE OF
                                                                                                                                                                             GROWTH
Size and Location
                                                                                               Population 4                BOWEN                  3,362         3,680         +9.5%
Gabriola, Mudge and DeCourcy are among more than 200 islands
located in the Salish Sea between the British Columbia mainland        Gabriola’s population has
and Vancouver Island and are dependent on regular BC Ferry             been stable over the past                           NANAIMO                92,361       104,936        +13.6%
service for access.                                                      ten years 5 but increases
                                                                               significantly in the
                                                                          summer months, as we                             BC                 4,113,487        4,648,055      +13.0%
                                                                         can see from changes in
                                                                      ferry ridership on page 33.                          GABRIOLA               4,050         4,033         -0.4%

                                       GABRIOLA

          Gabriola Island, at slightly
                                                                                               Births and Deaths 6
         under 58 square kilometres 2 , is
             about the size of Manhattan.                                                             GABRIOLA
                                                                                               2014/15 - 2018/19          60
                 Mudge is about 3.2 square kilometres
                     and DeCourcy is about 1.8 square kilometres. 3                                                       50
                                                                                                                                                                                       50
                                                                                                             2014/15      40                                                 41
                                                                                                                                                                                            46
                                                                                                             2015/16                                                    39
                                                                                                             2016/17
                                                                                                                          30
                                                                                                             2017/18      20                                                      21
                                                                                                                                      18     19
                                                                                                             2019/20      10    11
                                                                                                                                                    16
                                                                                                                                                           9
                                                                                           Years for birth and death       0
                          MUDGE                                                             data run June 1 – July 30.                     BIRTHS                             DEATHS

                                                           DECOURCY
                                                                                               Median Age 8
            Climate 7                                                                     70                                         “Median age” means that half of the
            Gabriola is classified as having a                                             60                                          population is under the median and the
                                                                                                  61.3
                                                                                                                                      other half is over.
            “Mediterranean” climate, with wet winters                                     50
            and dry summers. Gabriola has an average of 145 rainy                                         48.7
                                                                                          40                             43.0
                                                                       2016 CENSUS DATA

            days per year and six days with snowfall greater than                                                45.9
                                                                                          30                                               GABRIOLA
            0.2 centimetres (0.08 in).
                                                                                                                                           BOWEN
                                                                                          20
            Daily average temperatures are 3.9C in winter                                                                                  NANAIMO
                                                                                          10                                               BRITISH COLUMBIA
            (Dec-Feb) and 16.2C in summer (June-Aug), with
            extreme temperatures as high as 32C and as low as                              0
            -16C recorded between 1981-2010.                                                             MEDIAN AGE

                                                                                                                                                                                                 2
B
Age Distribution
                                                                                                                                                                 TOTAL
                       AGES 0-14                          AGES 15-64                                                               AGES 65 YEARS & OVER          POPULATION

       GABRIOLA         7.4%                                         55.0%                                                                  37.6%                4,035

          BOWEN         17.4%                                                     61.8%                                                     20.8%                3,680

       NANAIMO          14.4%                                                    63.7%                                                      21.9%                104,940
         BRITISH
       COLUMBIA
                        14.9%                                                     66.9%                                                     18.2%                4,648,055

Gender - Gabriola                     Indigenous Identity                                 Ethno-Cultural Composition                           LGBTQ2S - Gabriola
                                      Gabriola is part of the unceded                     - Gabriola                                           Some surveys
                                      territories of the Snuneymuwx First                                                                      have indicated
                    48%
                                                                                          Ethno-cultural Identity      % of Pop.
                                      Nation. Historically, more than 5,000                                                                    that almost 5% of
                                                                                                             White
                    MALE              Snuneymuwx lived on Gabriola.9                      (“Not a visible minority”)    97.6%       97.6%      the population on
                                                                                                                                               Gabriola self-identifies as
                                                                                                              Black      0.5%
                                      PROPORTION OF RESIDENTS WHO                                                                              lesbian, gay, bisexual, trans,
                                      IDENTIFY AS INDIGENOUS                                               Korean        0.4%
                                                                                                                                               queer, or two-spirited.10
                    52%               8%
                                                                                                         Japanese
                                                                                                          Chinese
                                                                                                                         0.4%
                                                                                                                         0.2%       2.1%
                                                                                                                                               However, the Census does not
                    FEMALE                                 8.1%                                                                                capture this data and a full
                                                                                                           Filipino      0.2%
                                      7%                                                                                                       survey of the population has
                                                                                                   Latin American        0.2%
                                      6%                                                          Southeast Asian        0.2%
                                                                                                                                               not been done. A number of
                                                                  5.9%                                                                         factors make gathering this
Currently Statistics                  5%
                                                                                                                                               data challenging.11
Canada does not collect               4%                                                  The Census defines “Visible Minority” as
                                            4.0%                             GABRIOLA     "persons, other than Aboriginal peoples,
data on those who                     3%
identify as non-binary.                                                      BOWEN        who are non-Caucasian in race or
                                      2%                                     NANAIMO      non-white in colour". The total does
                                                   1.9%
                                      1%                                     BRITISH      not equal 100% due to rounding.
                                                                             COLUMBIA

Households
                                                          Total Households                  Average Household Size
A household is a person or a group of people
who live in the same dwelling. This may be one                           Gabriola has
or more families sharing the dwelling, a group
of unrelated people, or someone living alone.12                          2,145                 1.9                2.5                2.3            2.4
                                                                         households.
2016 CENSUS DATA EXCEPT WHERE INDICATED                                                     GABRIOLA             BOWEN             NANAIMO    BRITISH COLUMBIA

                                                                                                                                                                                3
B
Households (Continued)

  Households by Size                                                                                                                                             TOTAL
                                                                                                                                                                 HOUSEHOLDS
                                                                                                                                                   1.9%

      GABRIOLA                             36.4%                                                  49.0%                                     8.4%   4.7%          2,145

        BOWEN                    22.7%                                   40.8%                               14.0%                     16.4%        6.4%         1,495

      NANAIMO                        29.6%                                         39.4%                                 14.3%             11.0%     5.8%        44,965
        BRITISH
      COLUMBIA
                                     28.8%                                   35.3%                               14.8%                 12.9%       8.3%          1,881,970
                     0%                       20%                      40%                        60%                            80%                      100%

                          1 PERSON       2 PERSONS      3 PERSONS      4 PERSONS       5 OR MORE PERSONS

  Household          A one-family household is made up of a married or common-law couple or lone parent, and any children living with them. A
  Type               multiple-family household contains more than one family. A non-family household is one where either one person lives alone
                     or two or more people live together but are not related (e.g., roommates).
                                                                                                                                                                 TOTAL
                                                                                                                                                                 HOUSEHOLDS

      GABRIOLA                                       59.9%                                 0.9%                              39.2%                               2,145

        BOWEN                                                  73.2%                                      1.7%                            25.1%                  1,495

      NANAIMO                                          63.5%                                  1.6%                                34.9%                          44,965
        BRITISH
      COLUMBIA                                        63.5%                                   3.0%                                 33.5%                         1,881,970
                     0%                       20%                      40%                        60%                            80%                      100%

                          ONE-FAMILY HOUSEHOLD        MULTIPLE-FAMILY HOUSEHOLDS           NON-FAMILY HOUSEHOLDS

  2016 CENSUS DATA

                                                                                                                                                                              4
B B
Families
A family is a married or common-law couple, with or without                   Total Families
children, or a lone parent and their children.13 It does not
                                                                              Gabriola has
include people living alone. Of Gabriola’s 1,320 families, 340
are families with children.                                                   1,320
                                                                              families.

Average Family Size                                                           Family Composition - Gabriola

       2.3              2.8              2.7                 2.8                                   8.0%
                                                                                                                    LONE PARENT FAMILIES

 GABRIOLA          BOWEN            NANAIMO       BRITISH COLUMBIA               74.2%                              COUPLE FAMILIES WITH CHILDREN
                                                                                                    17.8%
                                                                                                                    COUPLE FAMILIES WITHOUT CHILDREN

Families by Size
                                                                                                                                           2.3%          TOTAL FAMILIES

     GABRIOLA                                                        79.9%                                                      11.7%      6.1%          1,320

        BOWEN                                         55.7%                                        18.4%                       20.6%          5.3%       1,140

    NANAIMO                                              60.5%                                              19.3%                 14.9%       5.2%       30,040
      BRITISH
    COLUMBIA
                                                     53.7%                                         21.0%                       18.6%         6.7%        1,311,340
                   0%                       20%                       40%                    60%                         80%                      100%

                        2 PERSONS      3 PERSONS       4 PERSONS       5 OR MORE PERSONS

2016 CENSUS DATA

                                                                                                                                                                          5
B
COUPLES WITH AND WITHOUT CHILDREN                                       COUPLE FAMILIES - NUMBER OF CHILDREN
                                                                                           235 FAMILIES            470 FAMILIES                   9,980 FAMILIES           535,610 FAMILIES
    100%                                                                        60%
     90 %
              81.0%          54.6%         60.0%          51.9%
                                                                                50%      53.2%
     80 %
             WITHOUT         WITHOUT      WITHOUT        WITHOUT                                                         48.9%
     70 %      KIDS            KIDS         KIDS           KIDS
                                                                                40 %                                                          43.6%
                                                                                                                                                       41.6%               41.3% 43.1%
     60 %
                                                                                                                 38.3%
                                                                                30 %             34.0%
     50 %
     40 %
                                                                                20 %
     30 %                                                 48.1%
                             45.4%         40.0%
     20 %                     WITH         WITH
                                                           WITH
                                                                                10 %                                                                           14.7%                     15.7%
              19.4%           KIDS                         KIDS                                          10.6%                    13.8%
                                           KIDS
     10 %      WITH
                                                                                                            +                        +                               +                      +
               KIDS
      0%                                                                         0%
             GABRIOLA        BOWEN       NANAIMO BRITISH COLUMBIA                            GABRIOLA                    BOWEN                       NANAIMO               BRITISH COLUMBIA

              LONE PARENT FAMILIES - NUMBER OF CHILDREN                                                                    LONE PARENT FAMILIES BY SEX OF PARENT

                                                                                                                                    105                 110                5,105           197,940
                                                                                                                                  FAMILIES            FAMILIES           FAMILIES         FAMILIES
GABRIOLA                                 68.2%                                 31.8%     0.0%                       90 %
                                                                                                                    80 %
                                                                                                                                                                                         78.6%
    BOWEN                              59.1%                                 31.8%          9.1%                    70 %
                                                                                                                                                     71.4%
                                                                                                                                                                         77.2%

                                                                                                                    60 %         66.7%

NANAIMO                                63.0%                                 28.6%          8.4%                    50 %
  BRITISH                                                                                                           40 %
                                        63.6%                                 27.7%         8.7%
COLUMBIA                                                                                                            30 %                  33.3%
                                                                                                                                                             28.6%
                                                                                                                    20 %                                                         22.8%
            0%                20%                 40%              60%           80%             100%                                                                                            21.4%
                                                                                                                    10 %
                   1 CHILD        2 CHILDREN            3 OR MORE CHILDREN                                           0%
                                                                                                                                 GABRIOLA              BOWEN             NANAIMO           BRITISH
                                                                                                                                                                                          COLUMBIA
                                                                                                                                   FEMALE PARENT                 MALE PARENT

2016 CENSUS DATA

                                                                                                                                                                                                         6
B
Housing

Private Dwellings and Occupancy                                PRIVATE DWELLINGS - OCCUPANCY                                                       TOTAL DWELLINGS
A private dwelling is a place where
people live that has its own private               GABRIOLA                              71.7%                                    28.3%            2,987
entrance.14 A usual resident is someone
who usually lives in the dwelling.15
                                                     BOWEN                                 78.1%                                    21.9%          1,915
The difference between the number of
dwellings occupied by usual residents
and those not occupied by usual                    NANAIMO                                         95.8%                           4.2%            46,928
residents may reflect dwellings that
                                                     BRITISH
seasonal rentals, or are unoccupied.
                                                   COLUMBIA
                                                                                                 91.2%                                      8.8%   2,063,417
                                                               0%           20%              40%              60%           80%               100%
                                                                    OCCUPIED BY USUAL RESIDENTS            NOT OCCUPIED BY USUAL RESIDENTS

Housing Tenure                                                 HOUSING TENURE                                                                      TOTAL HOUSEHOLDS

                                                   GABRIOLA                                 83.0%                                    17.0%         2,145

                                                     BOWEN                                  82.3%                                    17.7%         1,495
         Band Housing makes up 0.2% of
                                                   NANAIMO                            69.8%                               30.0%      0.2%          44,965
     housing tenure in both Nanaimo and
       British Columbia; there is no Band            BRITISH
    Housing on either Gabriola or Bowen.           COLUMBIA
                                                                                     68.0%                                31.8%      0.2%          1,881,970
                                                               0%           20%              40%              60%           80%               100%
                                                                    OWNER       RENTER        BAND HOUSING

Housing Condition
Gabriola residents may also face other housing                 HOUSING IN NEED OF REPAIRS
suitability issues not explored in Census data,
                                                               LOCATION            MAJOR REPAIRS NEEDED
including lack of potable water, poorly
functioning septic fields, insufficient insulation,               GABRIOLA                     9%
lack of kitchens and bathrooms, etc.
                                                               BOWEN                        8%
                                                               NANAIMO                      6%
2016 CENSUS DATA
                                                               BRITISH COLUMBIA             6%

                                                                                                                                                                      7
B
Average Value of Dwellings                                                                        Core Housing Need
                                                                                                  Households that spend 30% or more of their income on shelter costs are said
$1,000,000                                                                                        to be in “core housing need”, which is a measure of housing affordability.
                                                                        $942,977          41.5%
    $900,000
                                                                                                        60%
    $800,000
                                                                                                        50%
                                                                        $720,689          72.1%                        52.1%
    $700,000
                   $666,351                                                                             40%                            45.3%           47.4%
                                                                                                                                                                         43.3%
    $600,000
                                                                                                        30%
    $500,000                                                                              19.0%                 4%                             4%                 4%
                                                                        $454,667                        20%                    24.3%
                   $418,703                                             $409,483          27.4%                20.3%                                             20.7%
    $400,000
                   $382,044                                                                             10%                                    16.7%

    $300,000       $321,385
                                                                                                         0%
    $200,000                                                                                                    GABRIOLA         BOWEN         NANAIMO         BRITISH COLUMBIA
          ...
                           2006                                      2016                                         OWNERS SPENDING 30% OF INCOME OR MORE ON HOUSING
                                                                                                                  TENANTS SPENDING 30% OF INCOME OR MORE ON HOUSING
                GABRIOLA        BOWEN               NANAIMO          BRITISH COLUMBIA

                                                                                                  Homelessness
Median Monthly Shelter Costs
                                                                                                  In 2019, 62 Gabriolans were identified as being homeless.16 One of every
      $1,400                                                                                      65 Gabriola residents is homeless, compared with the Nanaimo rate of
                                                                                                  1:270 and the provincial rate of 1:653.17
      $1,200                      $1,304
                                           $1,246
                                                                        $1,149                          GABRIOLA                 NANAIMO                 BRITISH COLUMBIA
      $1,000
                                                                                 $1,036
                                                       $984

                                                                                                        1 in 65                 1 in 270                       1 in 653
        $800                                                  $919

                         $768
        $600                                                                                            homeless                 homeless                      homeless
                  4%               4%                  4%                   4%
        $400      $508

        $200                                                                                      Mobility 18 - Gabriola
                                                                                                                                                    Mobility 2011-2016
            0                                                                                     Of the 1,250 Gabriolans who
                   GABRIOLA         BOWEN              NANAIMO       BRITISH COLUMBIA             moved between 2011 and 2016,
                                                                                                  68% moved to Gabriola from
                     OWNED DWELLINGS                 RENTED DWELLINGS                             another community and 32%                              31.8%
                                                                                                  moved to a different residence
2016 CENSUS DATA EXCEPT WHERE INDICATED                                                           on the island.

                                                                                                                                                                                  8
B
Education and Learning
Education             This data represents the highest certificate,                  School Enrolment
Levels                diploma or degree earned by the population
                      aged 15 or over. 19                                           There were 340 children and youth aged 5 to 19 on Gabriola in 2016. 170 attend Gabriola
                                                                                    Elementary School 20, about 80-100 go to Nanaimo for high school 21, and 70-90 are either
                 EDUCATIONAL ATTAINMENT                                             home-schooled, schooled off island or not in school.

    100%
     90 %
     80 %                                  42.9%          46.3%
     70 %         57.1%                                                                    ELEMENTARY                HOME SCHOOL                    HIGH SCHOOL

                                                                                          170                           ??                    80-100
                              65.2%
     60 %
     50 %                                  11.1%           8.8%
     40 %          9.0%
                              6.4%
     30 %                                  30.8%          29.4%
     20 %         24.2%
                              20.8%
                                                                                    Licensed Child Care Spaces
     10 %                                  15.3%          15.5%                     There were 75 children under age five and 90              PRESCHOOL   2 ½ to 5 years
                   9.8%

                                                                                                                                              15
                               7.7%
      0%                                                                            between five and nine on Gabriola in 2016.
                 GABRIOLA    BOWEN        NANAIMO         BRITISH                   Gabriola parents can access childcare and early
                                                         COLUMBIA                   childhood education services through the
       Postsecondary college / university certificate diploma or degree              Parent Participation Preschool at the                       spaces
                                                                                    Community Hall and at the HOPE Centre as
       Apprenticeship or trades certificate or diploma
                                                                                    well as through private providers. The                   LICENSED GROUP    1½ to 5 years

                                                                                                                                              20
       Secondary (high) school diploma or equivalency certificate                    Preschool currently has 15 licensed spaces 22
       No certificate; diploma or degree                                             while the HOPE Centre has 20 licensed daycare
                                                                                    spaces and 58 licensed after school spaces. 23
            EDUCATIONAL ATTAINMENT BY GENDER - GABRIOLA                                                                                         spaces

    MALE                          51.1%                             14.4%   22.3%           12.1%                                            AFTERSCHOOL CARE     5+ years

                                                                                                                                              58
FEMALE                                61.8%                   4.4%           25.9%            7.9%

            0%                20%                  40%                60%      80%                100%
                                                                                                                                                spaces
       Postsecondary college / university certificate diploma or degree

       Apprenticeship or trades certificate or diploma

       Secondary (high) school diploma or equivalency certificate

       No certificate; diploma or degree

2016 CENSUS DATA

                                                                                                                                                                                9
B
Library Usage
Gabriola is served by a dedicated branch of the Vancouver Island Regional Library
that provides access to not only books, DVDs, and audiobooks, but also numerous
programs as well as public access computers, word processing, photocopying and
printing, and free public wifi.

CARDHOLDERS 24                                  ITEMS BORROWED PER CAPITA 25        PROGRAM PARTICIPATION 26

               GABRIOLA                           GABRIOLA        NANAIMO           Gabriola Library (2019) ran 307 programs for 4,903 attendees.

    3,053
               BRANCH

                      75%                         26 8                                                                                               19
                                                                                         307                               16
                                                                                                                                                    Children

                                                                                                                                                      9
    Cards             of Population

                    NANAIMO
                                                                                          total events                   people/event                Teens

                    BR ANCH
                                                                                                                                                      6
            37,345 36%
            Cards
                            of Population
                                                                                                                                                    Adults

                                                                                                                                                               10
B
C. Economic Health
As we have seen from the COVID-19 situation, a healthy economy                                Local Business 27
depends on a healthy population. Good health requires an adequate

                                                                                                                                 57%
income, safe working conditions, and reasonable hours of work. When
these things are in balance, healthy workers can sustain the economy
through difficult times. The following section describes types of work,                                                                                GABRIOLA
labour force participation, and levels of income experienced by people in
the Gabriola Trust Area and in our comparator communities.                                       There are
                                                                                                                                     of small and
                                                                                                                           medium-sized business
                                                                                                                                                        AGE 50+   57%
                                                                                             businesses on                 owners on Gabriola are

Economy                                                                2016 CENSUS DATA
                                                                                              Gabriola, or...                over 50 years of age       AGE 50+   59%
                                                                                                                             compared to 59% of
                                                                                                     1 BUSINESS                 business owners      NATIONAL
Industrial Mix                                                                                 FOR EVERY 7 GABRIOLANS                   nationally

                                  TOP FIVE INDUSTRIES

    Gabriola

    1. Retail trade
                                            Total Labour Force 1,705     % of labour force
                                                                                  12.0%
                                                                                               YEAR-ROUND CLUB
                                                                                             Over
                                                                                                                                 61%                 GABRIOLA

                                                                                                                                                       WOMEN      61%

                                                                                             90%
    2. Professional; scientific and technical services                             10.6%
                                                                                                                                of businesses are
    3. Construction                                                               10.0%                                      owned and operated
    4. Administrative & support; waste management & remediation services            9.1%                                               by women        WOMEN      16%
    5. Health care and social assistance                                           7.0%                                            compared with
                                                                                                                                                     NATIONAL
                                                                                             of businesses                          16% nationally
    Bowen                                   Total Labour Force 2,100     % of labour force   operate year round
    1. Professional; scientific and technical services                             16.2%

                                                                                                                                       2%
    2. Health care and social assistance                                          11.9%

                                                                                             87%
    3. Educational services                                                       10.5%
    4. Construction                                                                9.3%
    5. Retail trade                                                                 7.1%                           $                   of Gabriola business owners
                                                                                             of businesses are                         identify as LBGTQ2S
    Nanaimo                                Total Labour Force 52,265     % of labour force
                                                                                             home-based
    1. Health care and social assistance                                          14.4%
    2. Retail trade                                                               14.1%
    3. Construction                                                                8.9%                                         Gabriola businesses by years in operation

                                                                                             30%
    4. Accommodation and food services                                             8.3%
    5. Educational services                                                        6.6%
                                                                                                                  $O$          30%
                                                                                                                                         8%
                                                                                                                                                            LESS THAN 1 YEAR
    British Columbia                   Total Labour Force 2,471,665      % of labour force                                                                  1 TO 5 YEARS
                                                                                             of business owners required
    1. Retail trade                                                               11.5%                                                       40%
                                                                                             other sources of income to                                     6 TO 10 YEARS
    2. Health care and social assistance                                          11.0%      supplement business income
    3. Accommodation and food services                                             8.4%                                          22%                        11 YEARS OR MORE
    4. Construction                                                                 8.1%
    5. Professional; scientific and technical services                              8.0%

                                                                                                                                                                     2014 DATA

                                                                                                                                                                            11
C
Local Investment

The Gabriola Island Community Investment Co-operative finances projects
to create positive social and environmental impacts in the community
while providing a modest financial return to members. The GICIC raises
capital through the sale of membership shares, which is then invested in
local projects, land and organizations to help Gabriola grow a sustainable
island economy and healthy community. As of 2020, GICIC has 40
members (single and joint) who have so far invested $59,672. 28                                                       $59,672
2020 DATA

Employment
Labour Force Status
The “Participation Rate” is the proportion of             The “Unemployment Rate” is the proportion of people who are in the                       The “Employment Rate” is the proportion of
working-age people who are in the labour market –         labour market but who can’t find a job. 30                                                working-age people who are employed at a paid
this means they either have a job or are actively                                                                                                  job. 31
looking for work. 29

      PARTICIPATION RATE                                  UNEMPLOYMENT RATE BY GENDER                                                                    EMPLOYMENT RATE
70%                                                 12%                                                                                            70%
                   69.2%                                                                                                                                              67.4%
60%                                       63.9%
                                                    10%             11.9%                                                                          60%
                               60.2%                                                                                                                                                        59.6%
                                                             9.6%
50%                                                                                                                                                50%                           55.5%
                                                    8%                                                         8.8%

40%     46.0%                                                                                           7.7%
                                                                                                                                     7.1%
                                                                                                                                                   40%
                                                                            6.9%                                      6.7%   6.7%                          41.5%
                                                    6%
                                                                                                                                            6.3%
30%                                                                                                                                                30%
                                                    4%
20%                                                                                       3.7%
                                                                                                                                                   20%

10%                                                 2%                             2.6%                                                            10%
                                                                                                 1.5%
 0%                                                 0%                                                                                              0%
                                                             TOTAL MALE FEMALE     TOTAL MALE FEMALE    TOTAL MALE FEMALE      TOTAL MALE FEMALE
      GABRIOLA BOWEN         NANAIMO BRITISH                                                                                                             GABRIOLA BOWEN        NANAIMO BRITISH
                                    COLUMBIA                   GABRIOLA                BOWEN              NANAIMO                 BRITISH                                             COLUMBIA
                                                                                                                                 COLUMBIA
2016 CENSUS DATA

                                                                                                                                                                                                   12
C
Work Activity                                                                          Occupations - Gabriola

GABRIOLA             27.9%                           71.8%

    BOWEN               37.9%                              62.1%
                                                                                                                       SALES AND SERVICE   22.3%
NANAIMO                      45.1%                          54.9%

  BRITISH
                             45.9%                           54.1%
COLUMBIA
             0%           20%            40%         60%             80%        100%
                                                                                             TRADES, TRANSPORT AND EQUIPMENT OPERATORS
                   WORKED FULL-YEAR FULL-TIME                                                                              AND RELATED     13.6%
                   WORKED PART YEAR AND/OR PART TIME

Class of Worker
                                                                                                                           MANAGEMENT      12.2%

GABRIOLA                         60.6%                             39.4%

    BOWEN                            66.9%                            33.1%                   EDUCATION; LAW AND SOCIAL; COMMUNITY AND
                                                                                                                   GOVERNMENT SERVICES     11.3%
NANAIMO                                  86.0%                             14.0%

  BRITISH                                85.9%                                14.1%
COLUMBIA                                                                                             ARTS; CULTURE; RECREATION AND SPORT   11.0%
             0%           20%            40%         60%             80%        100%

                   EMPLOYEE          SELF-EMPLOYED
                                                                                                   BUSINESS; FINANCE AND ADMINISTRATION    9.8%

                                                                                               NATURAL AND APPLIED SCIENCES AND RELATED    7.4%

                                                                                             NATURAL RESOURCES; AGRICULTURE AND RELATED
                                                                                                                            PRODUCTION     6.5%

                                                                                                                                 HEALTH    3.6%
                                                                                                            MANUFACTURING AND UTILITIES    2.4%
2016 CENSUS DATA

                                                                                                                                                   13
C
Income                                                                                                                                         2016 CENSUS DATA FOR INCOMES IN 2015

Source of Income
Employment income is income from all forms of paid employment 32                           All income data from the 2016 Census represent the 2015 income of Census
Other market income is income from other non-governmental sources,                              respondents. After-tax income is used as it more accurately reflects the
including investments 33                                                                      amount of money people have available to purchase goods and services.
                                                                                          Median income is the point at which half the population have incomes above
Government transfers are all monies received from any level of government 34
                                                                                                                 the median and half have incomes below the median.

SOURCE OF INCOME

                  GABRIOLA                               43.7%                                                  35.3%                                   20.9%

                    BOWEN                                               67.1%                                                             26.1%                   6.9%

                 NANAIMO                                            64.9%                                                         20.2%                     14.9%

        BRITISH COLUMBIA                                                    70.8%                                                         18.1%                 11.1%

                               0%                       20%                         40%                        60%                         80%                           100%
                                    EMPLOYMENT INCOME         OTHER MARKET INCOME            GOVERNMENT TRANSFERS

SOURCE OF INCOME BY GENDER

                        FEMALE                           42.5%                                               34.5%                                    23.1%
           GABRIOLA
                          MALE                            44.8%                                                   36.2%                                  19.1%

                        FEMALE                                      60.7%                                                        27.7%                          11.2%
             BOWEN
                          MALE                                              70.6%                                                           24.9%                   4.6%

                        FEMALE                                      60.5%                                                   20.5%                        19.0%
          NANAIMO
                          MALE                                           68.2%                                                         20.0%                    11.8%

                        FEMALE                                         65.8%                                                      19.1%                     15.1%
            BRITISH
          COLUMBIA        MALE                                                 74.4%                                                         17.3%                8.3%

                               0%                       20%                         40%                        60%                         80%                           100%
                                    EMPLOYMENT INCOME         OTHER MARKET INCOME            GOVERNMENT TRANSFERS

                                                                                                                                                                                14
C
Individual Income                                           Singles Income
These data represent the incomes from all sources           These data represent the incomes from all sources for single people
for all individuals age 15 and older, whether or not        (i.e., those without a spouse or children) age 15 and older.
they are part of a family or household.

MEDIAN ANNUAL AFTER-TAX INCOME OF INDIVIDUALS               MEDIAN ANNUAL AFTER-TAX INCOME OF SINGLE ADULTS BY GENDER

$40,000                                                     $40,000                                                                   MALE      FEMALE

$35,000                                                     $35,000
                         $34,816
$30,000                                                     $30,000
                                                                                             $30,336 $29,760                          $29,815
                                       $29,249   $29,783
$25,000                                                     $25,000                                               $26,785                       $27,221
                                                                                                                            $25,323
            $24,290                                                               $24,307
$20,000                                                     $20,000
                                                                        $20,288
$15,000                                                     $15,000

$10,000                                                     $10,000

 $5,000                                                      $5,000

     $0                                                          $0
            GABRIOLA      BOWEN        NANAIMO    BRITISH                   GABRIOLA              BOWEN               NANAIMO             BRITISH
                                                 COLUMBIA                                                                                COLUMBIA

2016 CENSUS DATA FOR INCOMES IN 2015

                                                                                                                                                          15
C
Family Income
‘Family' refers to a group of two or more people who live in the same dwelling and are related to each other by blood,
marriage, common-law union, adoption or a foster relationship. A couple may be of opposite or same sex.

               MEDIAN FAMILY INCOME - ALL FAMILY TYPES                            MEDIAN FAMILY INCOME - VARIOUS FAMILY TYPES
                                                                       $90,000
    $100,000
     $90,000                                                           $80,000
     $80,000               $89,088                                     $70,000
     $70,000                                      $77,002
                                       $70,350                         $60,000
     $60,000
     $50,000    $57,440                                                $50,000
     $40,000                                                           $40,000
     $30,000
                                                                       $30,000
     $20,000
     $10,000                                                           $20,000

                                                                                                                                                                                                                           $104,704
                                                                                                                                                                                   $84,864
                                                                                                                                                    $42,226

                                                                                                                                                               $46,668

                                                                                                                                                                         $58,048
                                                                                                        $24,307
                                                                                    $22,984

                                                                                              $20,288

                                                                                                                                                                                                       $70,464
                                                                                                                                                                                             $66,949

                                                                                                                                                                                                                                      $92,201
                                                                                                                                                                                                                 $67,840
                                                                                                                                $34,176

                                                                                                                                          $51,712
                                                                                                                   $30,176

                                                                                                                                                                                                                                                $96,176
           0                                                           $10,000
                GABRIOLA    BOWEN      NANAIMO    BRITISH
                                                 COLUMBIA                     0
                                                                                        SINGLE ADULTS                                LONE-PARENT                          COUPLES WITHOUT                             COUPLES WITH
                                                                                                                                       FAMILIES                              CHILDREN                                   CHILDREN
                                                                                         GABRIOLA                            BOWEN                  NANAIMO               BRITISH COLUMBIA

Employment Income                                MEDIAN EMPLOYMENT INCOME OF FULL-TIME FULL-YEAR WORKERS BY GENDER
These data represent the               $90,000                                                                                                            MALE            FEMALE
incomes from employment of
workers aged 15 and older.             $80,000
                                       $70,000                          $79,382

                                       $60,000
                                                                                   $59,579                                                                    $61,004
                                       $50,000                                                                    $55,261
                                       $40,000               $46,408                                                           $44,559                                   $47,039
                                                   $42,012
                                       $30,000
                                       $20,000
                                       $10,000
                                             0
2016 CENSUS DATA FOR INCOMES IN 2015                  GABRIOLA               BOWEN                                      NANAIMO                               BRITISH COLUMBIA

                                                                                                                                                                                                                                                          16
C
Low Income

       PEOPLE IN LOW INCOME                                 PEOPLE IN LOW INCOME BY AGE

30 %                                                 40 %
         1,000                                       35 %     38.4%
25 %
         24.9%                                       30 %
20 %                                                 25 %              28.7%
                              16,685 694,960
15 %                                                 20 %                                                            22.2%
                               16.5%     15.5%
                     405
                                                     15 %                                                                                      18.5%
10 %                                                                            16.2%                                          16.2%
                    11.0%                                                                                                                              14.8% 14.9%
                                                     10 %                                                                              12.6%
                                                                                            10.5% 11.4% 11.1%
 5%
                                                      5%

 0%                                                   0%
        GABRIOLA   BOWEN      NANAIMO    BRITISH                   GABRIOLA                        BOWEN                  NANAIMO               BRITISH COLUMBIA
                                        COLUMBIA
                                                                0 TO 17 YEARS           18 - 64 YEARS      65 YEARS AND OVER
Low income is measured using the Low-Income
Measure After Tax (LIM-AT), which marks 50 percent
of the national household median income adjusted
for household size. Those with incomes under this           PEOPLE IN LOW INCOME BY AGE AND GENDER - GABRIOLA
threshold are said to be in low income.35
                                                     40 %                                                                                      MALE        FEMALE

                                                     35 %                                               38.9%
                                                                                              37.8%

                                                     30 %
                                                                                                                       30.6%
                                                     25 %                                                                          27.0%
                                                                25.0%      24.8%
                                                     20 %

                                                     15 %                                                                                                  17.2%
                                                                                                                                                15.3%
                                                     10 %

                                                      5%

                                                      0%
                                                                      OVERALL                   0 TO 17 YEARS           18 TO 64 YEARS          65 YEARS AND OVER
2016 CENSUS DATA FOR INCOMES IN 2015

                                                                                                                                                                     17
C
D. Community Wellbeing
The World Health Organization (WHO) defines health as “a state of complete physical,                Alternative Care
mental and social well-being and not merely the absence of disease or infirmity”. 36 While
health care plays a role in community health, it is strongly influenced by having sufficient
                                                                                                   Alternative health care services available
                                                                                                   on Gabriola include acupressure, ANF pain
                                                                                                                                                       27+
income, decent housing, access to nutritious food, living in a safe environment, feeling                                                         ALTERNATIVE
                                                                                                   therapy, art therapy, astrology, Bach flower
you are socially included and having a voice in decisions that affect you.                                                                         THERAPIES
                                                                                                   consulting, Bowen therapy, craniosacral
                                                                                                   therapy, crystals, drama therapy, end of life
Health Care                                                                                        ceremonial services, energy medicine, healing
                                                                                                   touch, herbals, hypnotherapy, Lomi Lomi
Primary Health Care Services                                                                       massage, meditation, movement therapy,
“Primary health care refers to an approach to health and a spectrum of services                    nutrition, Pilates, quantum biofeedback,
beyond the traditional health care system. It includes all services that play a part in            reflexology, Reiki, restorative exercise,
health, such as income, housing, education, and environment.” 37                                   shamanism, sound healing, Tibetan head
                                                                                                   massage, and yoga. 41
General Information
“Primary care focusses on health care services, including health promotion, illness and injury     Acute Care Services
prevention, and the diagnosis and treatment of illness and injury.” 38 A wide range of primary
care services are available on Gabriola; most specialist services are only available off-island.    “The term acute care encompasses a range of clinical health-care
                                                                                                   functions, including emergency medicine, trauma care, pre-hospital
The Gabriola Community Health Centre (GCHC) provides space for physicians, visiting                emergency care, acute care surgery, critical care, urgent care and
specialist services, Island Health services including home care and community care, seniors        short-term inpatient stabilization.” 42 For Gabriolans, acute care is
outreach, public health, mental health and addictions, social work, as well as a medical lab,      provided through the GCHC’s Urgent Treatment Facility (UTF) and
dental hygiene office, massage services and an urgent treatment facility. The GCHC currently         Nanaimo Regional General Hospital.
has three family doctors serving a total patient population of 4,415 in 2019. A number of allied
care providers operate in different facilities on the island, including the Professional Centre.    Urgent Care Services 43

Physician Attachment                                                                               In 2019, in addition to regular patient

The recommended panel size (the number of patients per physician) for rural
                                                                                                   visits, the UTF provided urgent and           1,873
                                                                                                   emergency care to 1,873 cases, up from       emergency
practice is 800 and for urban practice is 1,250. 39 To meet rural practice                         1,324 cases in 2015. This includes people      cases
standards, Gabriola would need two more doctors.                                                   who are not registered with a family
                                                                                                   doctor at GCHC and so are seen on top of
                                                                                                   a full daily patient schedule.
                                                              ADD TWO PHYSICIANS
                                                                                                   The severity of health conditions is rated by the Canadian Triage
                                                current                                            and Acuity Scale (CTAS). Cases rated 1-3 involve urgent and
      4,415                                    panel size                                          emergency situations, 4 are less urgent, and 5 are not urgent. 44

     patients 40                               1,472            for recommended                    Data on the next page are for those cases rated 1-3 on the CTAS.
                                                                  rural panel size

                                                                      800

                                                                                                                                                                           18
D
GCHC Urgent and Emergency Cases by Age and Sex                                                 GCHC Urgent and Emergency Cases by Method of Arrival

500
                                                                                                                                6%        117      AMBULANCE

400
                                                                                                                                8%        147      WALK-IN (Arrive without
                                                                                                                                                   appt and fit-in due to urgency)

300
                                                                                                                                86% 1,602          FIT-IN (Fit into full schedule by
                                                                                                                                                   phone due to urgency)
200
                                                                                                                                                    N = 1,866 (missing = 7)
100

    0
            0-9   10-19   20-29    30-39 40-49 50-59 60-69   70-79    80-89 90-99      100+     GCHC Urgent and Emergency Cases by Attachment to Clinic Physician

 MALE       67       27    30       64    62    112   206    230        85      24      1
                                                                                                                                In 2019, 1,872 patients were seen
FEMALE      76       38    38       51    69    101   231    247        92      18      3
                                                                                                                                at the UTF. 21% of those were not
              MALE        FEMALE                                     N = 1,872 (missing = 1)                      21%           patients of GCHC’s doctors.

                                                                                                                  390              ATTACHED
GCHC Urgent and Emergency Cases by Diagnosis
                                                                                                    79%                            UNATTACHED
                                                                                                                                   (Not a GCHC patient)
Cases seen at the UTF in 2019 included those with neurological, mental
health, cardiac, and respiratory issues, infections, pain, and injuries.                           1,482                           N = 1,872 (missing = 1)
The majority were related to pain and injury, most of which were
fall-related.

                                                                                               GCHC Urgent and Emergency Cases by Urgency

                                                                                                           15%                     CTAS 1-3 (resuscitation, emergent

                                                                                                           288 20%                 and urgent)

                                                                                                                                   CTAS 5 (non urgent)
                                                                                                               365
                                                                                                                                   CTAS 4 (less urgent)

                                                                                                    65%                            N = 1,868 (missing = 5)

                                                                                                   1,215

2019 DATA

                                                                                                                                                                                 19
D
Cases Seen at Urgent Treatment Centre by Type and Outcome                         Emergency Department Utilization (2012-2018) - Gabriola 45

               ALL CASES                             URGENT CASES                 900

                                                                                  800
                                                                                                                                                             854
                                                                                  700                                                               809
                                                                   38%                                                                     754
     92%                                                           140            600

    1,727                  8% 144
                                                    62%                           500          614                  616      625

                                                    225                                                    574
                                                                                  400
                                                                                   ...         2012        2013    2014      2015          2016     2017     2018

            Treated and discharged                   Treated and discharged       In 2019 14% of the Gabriola population used the Nanaimo Regional
            Stabilized and transferred               Stabilized and transferred   General Hospital emergency department, and the average number of
                                                                                  visits was 1.5 per user. Growth over time was predominantly among
            N = 1,871 (missing = 2)                  N = 365                      people aged 75+. About 7% required a stay in hospital.

                                                                                  Hospitalizations (2009-2018) - Gabriola 46
Ambulance Trips to All Locations (2015-2019) - Gabriola

Ambulance trips include 105 trips to the Urgent Treatment Facility and            450
33 transports (including 5 air lifts) with most going to the Nanaimo Regional
General Hospital.                                                                 400

                                                                                  350                                                                               406
    700
                                                                                                                                                           359
                                                                                  300    252                                                 346
    600                                                                                              244
                                                                                                                   329    334                       333
                                                                           659                                                      312
                                                           626                    250                       301
    500
                                             578
    400            526                514                                         200
                                                                                   ...   2009     2010      2011   2012   2013      2014     2015   2016   2017     2018
    300
     ...           2015               2016   2017          2018           2019

             N = 2,903

2019 DATA

                                                                                                                                                                          20
D
Health Status: Disease                                                              Chronic Disease in Order of Incidence

More than 50% of Gabriolans lived with illness and/or a chronic condition in        The top five chronic conditions that people on Gabriola were newly diagnosed
2017/18. Some of these conditions were persistent over time and some were newly     with in 2017/18 are mood and anxiety disorders, depression, hypertension,
diagnosed. “Prevalence” refers to the number of people with a condition.            osteoarthritis and ischemic heart disease. Gabriola has higher rates than BC
“Incidence” refers to the number of people newly diagnosed with a condition.47      for newly diagnosed cases of depression and mood and anxiety disorders, but
                                                                                    lower for hypertension, osteoporosis and COPD.

Chronic Diseases in Order of Prevalence
                                                                                        Condition                           Incidence per 1000 people
The five most prevalent chronic conditions among Gabriolans in 2017/18 were
mood and anxiety disorders, depression, hypertension, osteoarthritis and                Mood & Anxiety Disorders                          22.0
asthma. While Gabriolans have some high disease prevalence rates, particularly          Depression                                        14.5
in the areas of mood and anxiety disorders and depression, the rates for most           Hypertension                                      12.5
are below or well below the rates for all of BC, with significantly lower rates of       Osteoarthritis                                    8.2
hypertension, osteoporosis, diabetes, and COPD.                                         Ischemic Heart Disease                            6.4
                                                                                        Chronic Obstructive Pulmonary Disorder            5.8
    Chronic Disease                       Prevalence per 100 people                     Diabetes                                          5.4
    Mood & Anxiety Disorders                         36.2                               Alzheimer's Disease and Other Dementia            4.4
    Depression                                       28.8                               Asthma                                            4.0
    Hypertension                                     26.5                               Heart Failure                                     3.5
    Osteoarthritis                                   15.0                               Hospitalized Stroke                               3.3
    Asthma                                            9.9                               Gout                                              3.1
    Ischemic Heart Disease                            9.7                               Chronic Kidney Disease                            3.1
    Diabetes                                          7.9                               Acute Myocardial Infarction                       2.1
    Osteoporosis                                      6.9                               Osteoporosis                                      2.1
    Chronic Obstructive Pulmonary Disorder            5.1                               Schizophrenia and Delusional Disorders            N/A
    Gout                                              4.0                               Epilepsy                                          N/A
    Chronic Kidney Disease                            3.3                               Multiple Sclerosis                                N/A
    Acute Myocardial Infarction                       2.6                               Parkinsonism                                      N/A
    Heart Failure                                     2.4                               Rheumatoid Arthritis                              N/A
    Alzheimer's Disease and Other Dementia            1.7
    Rheumatoid Arthritis                              1.7
                                                                                    Cancer                                   Suicide 48
    Hospitalized Stroke                               1.4
                                                                                    In 2017/18, Gabriola had an incidence   Based on location of death and not
    Schizophrenia and Delusional Disorders            1.0
                                                                                    of all cancers of 897.8 per 100,000     on residence of the person, Gabriola
    Epilepsy                                          1.0
                                                                                    people. This works out to approx. 36    had no suicides in 2017/18 but
    Parkinsonism                                      0.5                           people being newly diagnosed with       Nanaimo had 20. However,
    Multiple Sclerosis                                0.4                           cancer out of the total population,     cumulative data over the 13 years
                                                                                    with approximately 10 newly             previous shows that Gabriola’s
                                                                                    diagnosed with female breast cancer     suicide rate was 2.5 times greater
                                                                                    and 4 with colorectal cancer.           than Nanaimo.
2017/18 DATA

                                                                                                                                                               21
D
Social Inclusion
“Social inclusion is defined as the process of improving the terms of participation    Affordable Housing
in society for people who are disadvantaged on the basis of age, sex, disability,
race, ethnicity, origin, religion, or economic or other status, through enhanced      Housing affordability remains a challenge on
opportunities, access to resources, voice and respect for rights.” 49                 Gabriola, as noted on page 8 of this report, but no
                                                                                      subsidized housing is currently available. The
The data in this section represents only some of the avenues through which            Gabriola Housing Society recently applied to the
social inclusion is fostered on Gabriola, and a snapshot of the situations of         Local Trust Council to develop 24 units of
some of the Gabriolans who are served. In future reports we hope to collect           affordable rental housing units, including studios,
more data on this important topic.                                                    1-bedroom, 2-bedroom and 3-bedroom homes. Monthly rents in the development
                                                                                      will be based on three tiers: deep subsidy, rent-geared-to-income, and affordable
                                                                                      market. If approved, construction is expected to begin in 2021/22.50

Grocery and Meal Programs 51                                        MARCH 2019 DATA

People for a Healthy Community Gabriola (PHC) prioritizes social inclusion in all     Grocery Program Participants
its programs, which include food-related programs such as their grocery (food         by Age
bank) and meals programs, as well as health- and education-focused programs
for children, seniors, caregivers, and others. We are presenting food-related
program data here, but in future reports we hope to collect and report more                               ADULTS
                                                                                                                                 72%
data on their other programs and services.
                                                                                                        CHILDREN                                 25%
                                                                                               AGE UNDISCLOSED
Grocery Program Participants by Primary Income Source
                                                                                               Total Participants = 100
DISABILITY-RELATED
                                                                                                                                         3%
          BENEFITS                                                      42%

     EMPLOYMENT                            20%
                                                                                      Grocery Program Participants
SOCIAL ASSISTANCE                       18%                                           by Family Type

       NO INCOME           7%                                                                             SINGLES
                                                                                                                                              22%
                           7%                                                             FAMILIES WITH CHILDREN
 OLD AGE PENSION

    OTHER INCOME          5%
                                                                                             OTHER / DON’T KNOW
                                                                                                                              58%                 12%
                                                                                      FAMILIES WITHOUT CHILDREN

      DON’T KNOW          2%                                                                                                                     8%
                     0%    5%    10%   15%    20%    25%   30%    35%    40%   45%

                                                                                                                                                                   22
D
Grocery Program Participants by Primary Reason for Accessing Food Bank                  Grocery Program Participants by Housing Situation

SOCIAL ASSISTANCE /                                                                      PRIVATE RENTAL
                                                                            42%                                                                                  45%
 BENEFITS TOO LOW
       NOT ENOUGH                                                                       OWN THEIR HOME
                                            15%                                                                                  20%
       WORK HOURS

              OTHER                   10%                                               ROOMING HOUSE                10%
              LOW /
     DELAYED WAGES                    10%                                                        OTHER               10%

    UNEMPLOYED /                                                                                   WITH
                            5%                                                                                      8%
 RECENTLY LOST JOB                                                                       FRIENDS/FAMILY
          SICKNESS /
                            5%                                                            ON THE STREET        5%
    MEDICAL EXPENSE
      RELOCATION
(IMMIGR. / MOVING)               3%                                                         DON’T KNOW         2%

               DEBT              3%                                                                       0%    5%       10%   15%   20%    25%    30%   35%   40%   45%

       UNDISCLOSED               2%

          HOMELESS               2%                                                     Meals Programs

                                                                                        Meals are provided at three weekly Soup
    FAMILY BREAK UP              2%
                                                                                        Socials, the weekly Gabriola Elementary
        UNEXPECTED
                                 2%
                                                                                        School Hot Lunch, Sandwiches/Snacks,           1,300+
           EXPENSE                                                                      and Breakfast programs, and the                    meals
                                                                                        Stepping Up Stepping Out and Seniors’
                       0%        5%     10%   15%   20%   25%   30%   35%   40%   45%
                                                                                        Luncheon programs.

                                                                                                                                                                       23
D
Subsidized GERTIE Rides 52                                                Taxi Saver
GERTIE (Gabriola’s Environmentally                                        In collaboration with the Regional District of Nanaimo
                                                3000              3,389
Responsible Trans-Island Express) is                                      (RDN), People for a Healthy Community offers Taxi Saver            TA XI SAVER
Gabriola’s locally created and managed bus      70 %                      coupons for 50% discounted taxi travel, on Gabriola and            50% OFF
service. Free ride passes, funded by GERTIE,    2000                      for medical appointments in Nanaimo, for seniors and
People for a Healthy Community, and the                                   people with disabilities.
                                                50 %
Auxiliary for Island Health Care, are made
available to lower income Gabriolans in         1000                      In 2019, PHC sold 73 sheets of coupons, each of which         $4,380 TOTAL
                                                                                                                                        $2,190 SAVINGS
need of affordable transportation options.       30 %                      provides $60 worth of taxi travel for $30.53 Gabriolans in
                                                           729
                                                                          need were able to save $2,190 on necessary travel.
                                                   0
                                                           2018   2019
                                                                          Discount Ferry Experience Cards 54

                                                                                                                 To make ferry travel accessible to low
                                      UNSUBSIDIZED RIDES                     EXPERIENCE CARD                     income Gabriolans, the Gabriola Ferry
    83.3%           16.7%                                                                                        Advisory Committee, People for a Healthy
                                                                                      95
                                      SUBSIDIZED RIDES                                        Car and
                                                                                              Driver             Community and Mid-Island Co-Op have
                                                                                              Cards
                                                                                                                 collaborated to provide single-use
                                                                                     101
                                  2019 DATA
                                                                                              Foot
                                                                                              Passenger          Experience Cards for those who may not
                                                                                              Cards
                                                                                                                 have the funds to buy a multiple use card
                                                                                                                 from BC Ferries or who have difficulty
                                                                              198 totals cards in 2019           affording regular single fares.
                                                                               +2 double passenger cards
                                                                                     (discontinued)

                                                                                                                                                             24
D
Civic Engagement
There is good evidence linking health and various aspects of civic engagement,
such as getting involved in community organizations, volunteering, and taking
part in arts, culture, and recreational activities, as well as becoming involved in
governance-related activities. 55

Community Involvement

Community Participation                                                               Arts and Culture

Many studies have shown that membership and participation in groups and               A 2019 World Health Organization report reviewed more than 3,000 studies
organizations can improve physical and mental health, not only through                and found that participation in the arts can play a major role in prevention
becoming more active but also through increasing social capital and decreasing        and health promotion and management and treatment of illness. The report
social isolation. Community participation has been shown to have positive             recommended support for participation in the arts as well as a range of
impacts on health, including improving cardiovascular health, anxiety,                arts-related policy considerations. 57
depression, and hypertension, and preventing cognitive impairment. Building
strong social ties through participation not only contributes to the strength and     As “the Isle of the Arts”, Gabriola has a vibrant and exciting arts scene that
resilience of the community, it builds better health in those who participate. 56     includes both the performing, visual and other cultural arts and is sustained
                                                                                      by numerous writers, actors, poets, painters, dancers, musicians, sculptors,
Gabriola provides countless opportunities for residents to get involved, through      and potters and their audiences and supporters.
becoming a member of or volunteering with local groups and organizations.
                                                                                      The Gabriola Arts Council acts as a member organization for more than 500
Our rough estimate resulted in a tally of 67 non-profits, networks, co-ops and
                                                                                      Gabriola artists, arts afficionados, and arts-related organizations and has
community groups on Gabriola, although we are certain there are many more.
                                                                                      been organizing and providing arts and culture events and services on
With only 16 of these organizations reporting, 2,077 members were identified in
                                                                                      Gabriola for more than 20 years. 58
2019. In addition, these 16 organizations reported having 1,581 volunteers who
contribute 97,571 volunteer hours to the Gabriola community in 2019 – that’s          In future reports we hope to collect data on the number of arts-related groups
4,065 days, 581 weeks, or 134 months.                                                 and organizations on Gabriola, their activities and their audiences.

In future reports we hope to collect more data on the number of community
groups and organizations on Gabriola, their activities and numbers of
participants.

                                                             16 non-profit
                                                         organizations report:
                       · NON-PROFITS

     67+               · NETWORKS
                       · CO-OPS
                       · COMMUNITY GROUPS
                                                          2,077 Members
                                                          1,581 Volunteers
                                                         97,571 Volunteer
                                                                Hours

                                                                                                                                                                       25
D
Recreation

Activities such as organized sports, hiking, going to the gym, and other physical       Gabriola Recreation Society Program Types     Participants
activities are known to have positive impacts on physical and mental health. 59
Gabriola’s system of trails, its many organized and informal sports groups, and its     Kids – Recreation                                 286
gym and training facilities all contribute to the health of the population. Gabriola
Recreation Society participation data is just one example of the range of activities    Kids – Arts                                       70
available.60 In future reports we hope to also collect data on Gabriola’s many formal
                                                                                        Kids – Nature                                     72
and informal recreational opportunities and participants.
                                                                                        Kids – Other (babysitting, Kids in Kitchen)       25
                                                                                        Adults – Recreation/Health/wellbeing              28
                                                                                        Adults – Arts                                     15
                                                                                        Adults – First Aid                                32
                                                                                        All Ages Recreation                               56

                                                                                                                                                     2019 DATA
                                                                                        Drop-in Sports                                    160

                                                                                                                                                                 26
D
Governance
Self-determination and self-governance have been noted as important indicators of health, and the
extent to which people perceive they have voice and participate in the decisions that affect them is
an important aspect of ensuring healthy individuals and communities.61 Serving on community
boards, volunteering, running for elected office, and voting are just some of the ways that people
can influence community health. In future reports we hope to collect more data on the various ways
Gabriolans participate in governance-related activities.

LOCAL GOVERNMENT ELECTIONS VOTER TURNOUT - 2018 62                  PROVINCIAL ELECTION VOTER TURNOUT - 2017 63           FEDERAL ELECTION VOTER TURNOUT - 2019 64

80%                                                                 80%                                                   80%

70%                                                                 70%                                                   70%      73.6%   73.7%
                                                                                     67.1%                                                          68.9%
60%             64.2%                                               60%    64.1%                                          60%                               66.0%
                                                                                              63.0%    61.2%
50%                                                                 50%                                                   50%

40%    44.5%                                                        40%                                                   40%
                          40.4%
30%                                 36.5%                           30%                                                   30%

20%                                                                 20%                                                   20%

10%                                                                 10%                                                   10%

 0%                                                                  0%                                                    0%
      GABRIOLA BOWEN    NANAIMO BRITISH                                   GABRIOLA BOWEN     NANAIMO BRITISH                    GABRIOLA BOWEN     NANAIMO BRITISH
                               COLUMBIA                                                             COLUMBIA                                              COLUMBIA

Gabriola has a unique form of local governance: land use is        turnout is reflective of the election of one mayor and eight
governed through the Islands Trust Local Trust Committee           municipal councillors. The total BC turnout is based on both
while recreation, waste management, and building services          eligible voter estimates and information voluntarily provided
are provided by the Regional District of Nanaimo (RDN).            by the various local jurisdictions in the province.
Bowen Island has a dual governance model as both a
municipality and Local Trust Area. Nanaimo is a municipality.

Voter turnout data are reflective of the following conditions:
Gabriola’s turnout reflects the election of two trustees to the
Islands Trust Local Trust Committee and one RDN regional
director. Because it is an island municipality, Bowen’s turnout
reflects the election of two Islands Trust trustees as well as a
mayor and six municipal councillors. As a city, Nanaimo’s

                                                                                                                                                                     27
D
Safety

Safety describes services established to   Ambulance Service Callouts   Ambulance services are provided by the BC Ambulance Service, which maintains a
ensure the welfare and protection of                                    dedicated station on the island. The data for 2019 includes 105 trips to the Urgent
the general public in response to                                       Treatment Facility at the Gabriola Community Health Centre and 33 transports
situations that may imperil health and                                  (including 5 air lifts) with most going to the Nanaimo Regional General Hospital.
wellbeing. On Gabriola these services
include ambulance, fire, and police                                      700
services. Disaster response planning
and coordination are provided through                                   600
the Regional District of Nanaimo.                                                                                                           659
                                                                        500                                                   626
                                                                                                                578
                                                                                    526          514
Emergency Services     65                                               400

These graphs represent the number of                                    300
times that emergency services – i.e.,                                    ...       2015          2016          2017          2018          2019
ambulance, fire or police – have been
called to an emergency, and include
                                           Fire Services Callouts       Fire services on Gabriola are provided by the Gabriola Volunteer Fire Department,
data for Gabriola, Mudge and
                                                                        which has two stations on the island.
DeCourcy. Increases in callout
numbers may reflect increases in both
                                                                        700
resident and tourist populations.
                                                                        600                       492
                                                                                                                              454
                                                                        500         403                                                     402
                                                                                                                375
                                                                        400

                                                                        300
                                                                         ...       2015          2016          2017          2018          2019

                                           Police Services Callouts     Police services on Gabriola are provided by the RCMP. These callout statistics
                                                                        include calls to Valdes Island.
                                                                                                                              930
                                                                                                                853
                                                                        1000

                                                                        800

                                                                        600                       417

                                                                        400

                                                                         200
                                                                          ...                    2017          2018          2019

                                                                                                                                                              28
D
Policing Statistics 66

Policing on Gabriola is done by three RCMP officers                                                                                      Number      Percent of   Incidence Ratio
                                                           Rank Situation Category
stationed in a dedicated detachment on the island.                                                                                     of Calls   Total (N=896)   (Pop. 4033)
The work of the detachment’s officers runs the gamut
                                                             1   Lost and/or Found Property                                               91         10.2%           1:44
of issues and covers investigation and enforcement of
                                                             2   Suspicious Person, Vehicle, Occurrence / Traffic-Related Issues (tie)      76          8.5%           1:53
local and regional bylaws as well as provincial and
federal legislation. The vast majority of police work on     3   Assault / Causing a Disturbance (tie)                                    47          5.2%           1:85

Gabriola involves situations that are resolved without       4   Theft                                                                   42           4.7%           1:96
charges being pursued or filed – nearly 96% of police         5   Missing Persons / Unspecified Assistance (tie)                           38           4.2%          1:106
calls in 2019 – and which focus on problem-solving,          6   False or Abandoned 911 Calls / Mental Health Act Issues (tie)           37           4.1%          1:109
information-sharing, assistance and referrals.
                                                             7   Mischief                                                                28           3.1%          1:144

The table to the right shows the top ten reasons for         8   Collision / Harassment (tie)                                            26           2.9%          1:155
police being called out on Gabriola in 2019. (Note that      9   Bylaw Infractions                                                       24           2.7%          1:168
calls to Valdes Island are not included here as they are    10   False Alarms                                                            23           2.6%          1:175
on page 28). This data includes all categories of
callouts, including situations where only assistance or
information are provided, where there is insufficient
evidence or the claim is unfounded, as well as where
                                                                   Mental Health Callouts 67
charges are recommended or laid.

The Incidence Ratio indicates how many times police
                                                                   Year to date includes January 1 to May 16.                       YEAR TO DATE                 2020
                                                                   Note that data covering all Vancouver                         JANUARY 1 TO MAY 16
were called for issues in that situation category per
                                                                   Island and Gulf Island detachments
number of people – for example, in 2019 there was                                                                                      2019
                                                                   shows significant increases in mental
one report of lost and/or found property for every
                                                                   health related police callouts between

                                                                                                                                       16                       44
44 Gabriolans.
                                                                   2019 and 2020 in communities that do
                                                                   not have a hospital or an emergency
POLICE SITUATION RESOLUTIONS - 2019                                department.

                                                                                                                                                                 Change
    NO CHARGES
       PURSUED                                                                                                                                                 +175%
     CHARGES
RECOMMENDED                                                        Emergency Preparedness 68
      OR LAID              95.9%                                   Gabriola participates in the RDN’s
                                                                   Neighbourhood Emergency Preparedness
                                                                   Program (NEPP). This program provides
                                                                   information and resources that neighbours can use to
                                         4.1%                      build neighbourhood-based plans to keep each other safe and
                                                                   respond appropriately in the event of an emergency such as a fire
                                                                   or earthquake. This includes planning for pets and other domestic
                                                                   animals in the event of emergency.

                                                                                                                                                                                  29
D
E. Sustainability
                                                                                        PROTECTED AND UNPROTECTED LAND ON GABRIOLA, IN HECTARES - 2018
Community health and wellbeing depends on having a healthy environment.
The long term sustainability of the natural environment is critical to ensuring
population health. This section describes some of the ways Gabriolans                      TOTAL UNPROTECTED
steward their natural resources and protect the environment.
                                                                                           TOTAL PROTECTED

Environment                                                                                                           5,282
Conservation and Protection
                                                                                                                                        535
Gabriola is part of the Coastal Douglas Fir (CDF) Biogeoclimatic Zone, the
smallest and rarest of 16 ecological zones in BC. 69 Conservation and protection
of this unique ecology is shared by many organizations such as the Islands Trust
and Trust Conservancy, the Gabriola Land and Trails Trust, Gabriola                                                                                              1.6
Streamkeepers and Shorekeepers, Sustainable Gabriola, and the Groundwater               PROTECTED LAND AREAS ON                                                        16.3
Management Society. A variety of strategies and activities are employed to              GABRIOLA, IN HECTARES - 2018 71
protect and conserve landforms and species.
                                                                                           ECOLOGICAL RESERVE (1.6)
Protected Land, Parks and Trails 70                                                                                                                         50.4
                                                                                           CONSERVATION COVENANTS (16.3)

                                                      3
                                                                                           PARKS — PROVINCIAL (50.4)

                                        GABRIOLA             Provincial                    PARKS — REGIONAL (58.4)
                                                                                                                               341.3                             58.4
                                           PARKS             Parks
                                                                                           NATURE RESERVES (66.9)

                                                      2
                                                                                           PARK — COMMUNITY (341.3)
                                                             Regional
                                                             Parks                                                                                        66.9

                                                      22          Community
                                                                  Parks

                                                      80+
                                                                                        MEETING THE PROTECTED         20%
                                                                                                                              UNITED NATIONS TARGET 17%
                                                                                        LAND TARGET - 2019 72
                                           TRAILS                       Kilometers
                                                                                                                      15%        Need another
                                                                                                                                 454 hectares!
                                                                                                                                                 14%
                                                                                                                      10%            12%

                                  SHORE ACCESSES
                                                      100               Access Points                                  5%

                                                                                                                       0%
                                                                                                                                 GABRIOLA BOWEN

                                                                                                                                                                          30
E
Managing Invasive Plants

                                                                                   The most pervasive invasive plants are Scotch broom, Daphne laurel, tansy
                                                                                   ragwort, giant hogweed, Japanese knotweed, yellow flag iris, Japanese hedge
                                                                                   parsley, and English ivy. The removal efforts of GaLTT, the Gabriola Lions and
                                                                                   individual Gabriolans are focused on Scotch broom and Daphne laurel. 73

                                                                                   Photo: Lou Skinner

Broombashing at Drumbeg, spring 2020                                                           Heat Pumps

                                                                                                                                                                                  2020 DATA
                                                                                                                                                    758
                                                                                               In 2010, Island Futures began a
Sustainability Issues                                                                          project to provide heat pumps to
                                                                                               local residents at wholesale prices in
Greenhouse Gas Emissions (GHGs) 74                       GHG EMISSIONS BY SOURCE                                                                   Heat pumps sold
                                                                                               order to reduce the use of
                                                                   GABRIOLA 2008               baseboard heaters and increase                           SAVED
                                                                                               energy efficiency on Gabriola.75                         1,100 kWh /
                                                                                                                                                   $1,200 / per unit
                                     SOURCE       TONNES OF CO2
                                OF EMISSIONS       EQUIVALENT
                                                                                               Recycling / Reuse
                                       VEHICLES       5,747              37%                    The Gabriola Island Recycling Organization (GIRO) recycles well over 225,000 kg
                                                                                                of materials annually, as well as numerous items not measured by weight and
                                                                                                operates a Restore that sells many different kinds of gently used donations.76
                                                                                                The Gabe Shop, run by the Gabriola Auxiliary for Island Health Care, also
                                                                                                collects donations of gently used clothing, household goods, books, artwork
                                                                                                and jewellery and offers them for resale to support health care programs and
                                         FERRY        3,120              20%
                                                                                                patient comfort services on Gabriola.77

                                                                                                AMOUNT RECYCLED PER GABRIOLA RESIDENT - 2019 78

                                                                                                22 6                                2                 46                25
                         FOOD PRODUCTION              2,340              15%

                                       PROPANE        1,370               9%                              KG           KG                    KG                 ITEMS            KG

                                 ELECTRICITY          1,279               8%
              ADDITONAL TRANSPORTATION                 697                5%
                                 WASTE                 581                4%
                        FURNACE OIL (2%)               258
                                                                                                  Paper        Glass (Food Jars)        Plastics       Refundables      Metals

                                                                                                                                                                                  31
E
65
Food Security                                                                           Community Gardens
                                                                                                                                                               PLOTS
Food security is “the state of having reliable access to a sufficient quantity of         The Gabriola Commons supports a number                                 North
affordable, nutritious food”.79 The Islands Trust suggests that, “Should supply lines    of community garden plots used by                                      End
                                                                                        individuals and families, both on Commons

                                                                                                                                                                       25
be severed, most of our communities have enough food to last for three days.” 80
                                                                                        land and by agreement with Namaste Farm,
                                                                                        and hosts a large kitchen garden as well as
Agricultural Land 81                                                                    a garden used by People for a Healthy
                                                                                        Community’s food-related programs.82                                           PLOTS
                                                                                                                                                                       South
                                                                                                                                                                       End
                         Gabriola Island                                                Farmers Markets 83
                                                 Legend
                                                      AG-zoned Properties (956.02 ha)
                                                      ALR Properties (978.16 ha)

                                                                                        60                   16               600+
                                                                                                 Farm                                           Shoppers
                                                                                                 Market              Market                     per
                                                                                                 Vendors             Days                       Market

                                                                                           GABRIOLA                                    35

                                                                                                                                                                               2019 DATA
                                                                                                                                                Annual Christmas
                                                                                                                                                Market Vendors

                  Mudge Island                                                          Food Recovery 84

                                                                                        People for a Healthy Community Gabriola (PHC) operates a number of food-related
     18.6% of land base available                                                       programs that contribute to both community and individual food security, including
         for food production.                                                           a weekly Grocery Program / Food Bank for people in need, as well as soup socials,
                                                          DeCourcy Island               the elementary school hot lunch, breakfast, and snacks programs, gardens, farmer's
                                                                                        market coupons, skill building workshops, the GES Garden Program, and more. Food
                                                                                        Recovery is unsold, excess food from Nester's Market that PHC sorts and distributes
                                                                                        for use in the community.

Working Farms                                                                           DISTRIBUTION OF RECOVERED FOOD          54% of food goes directly to

                                 18-20
                                                                                                                                community members.
                                                                                         Item               Amount (lbs)
                                                   Working farms in
                                                                                                                                30% of food goes to farm animals,
                                                   the Gabriola Trust Area               Bread for people         1,328         which helps local farmers.
                                                                                         Dairy for people        10,480
                                                                                                                                16% of food goes to compost at the
                                                                                         Produce for people      13,766         PHC gardens, which elementary
                                                                                         Produce for animals     14,559         school students grow food in for

                                                                                                                                                                               2019 DATA
                                                                                         Compost for gardens       7,869        the Hot Lunches at the school and
                                                                                                                                community food programs.
                                                                                         TOTAL                   48,002

                                                                                                                                                                           32
E
Public Transportation                                                                        Ferry Service 87

                                                                                             Access to Gabriola Island is currently provided by the BC Ferries
Bus Service 85
                                                                                             Corporation vessel the MV Quinsam. The Quinsam makes 15 daily round
Gabriola islanders created their own public transit system in 2013 with the                  trips (except Sundays and Wednesdays) between Gabriola and Nanaimo
introduction of GERTIE (Gabriola’s Environmentally Responsible Trans-Island Express).        and carries 63 cars and 400 total passengers. 88 Many Gabriolans use the
Initially run totally by volunteers, GERTIE is funded through a levy on property taxes       BC Ferries Experience Card to bulk purchase their trips at a reduced price.
approved by referendum and is managed by volunteers through the Gabriola
Community Bus Foundation. 86                                                                 Ferry Ridership

                                                                                             These data represent the daily average number of vehicles and passengers
Total Annual Rides
                                                                                             going in both directions between Gabriola and Nanaimo in each month of 2019.
                           2013 numbers reflect the first seven months of the GERTIE service
25,000                                                                                                          DAILY RIDERSHIP ON THE GABRIOLA FERRY - 2019
                                                                                  20,286     3,000                                                 2,625
20,000                                                                17,083                                                         2,400 2,395
                                                                                                                             2,310                                 2,300 2,280
                                                          15,666                             2,500                   2,160                                 2,785                 2,210
                                                                                                                                                                                         2,105
                                   13,817      13,504                                                1,910
15,000                   12,553
                                                                                             2,000           1,710

10,000           6,270                                                                                                                             1,190 1,200
                                                                                             1,500
                                                                                                                             1,075 1,085 1,110                     1,080 1,070
                                                                                                                     1,010                                                       970     960
                                                                                                      910
                                                                                                             805
 5,000                                                                                       1,000
         2012    2013      2014       2015       2016        2017        2018        2019

                                                                                              500
Bus Ridership
                                                                                                      JAN    FEB     MAR     APR     MAY   JUN      JUL    AUG      SEP   OCT    NOV      DEC

                                                                                                        ALL PASSENGERS                ALL VEHICLES

                                                 YOUTH | 20%

                                                 CHILDREN (
You can also read