HABITAT SUITABILITY INDEX MODEL IMPROVEMENT RECOMMENDATIONS
←
→
Page content transcription
If your browser does not render page correctly, please read the page content below
2023 COASTAL MASTER PLAN

HABITAT SUITABILITY
INDEX MODEL
IMPROVEMENT
RECOMMENDATIONS

REPORT: VERSION 01
DATE: AUGUST 2019
PREPARED BY: SHAYE E. SABLE, DAVID C. LINDQUIST, LAURA D’ACUNTO, ANN
C. HIJUELOS, MEGAN K. LA PEYRE, ANN M. O’CONNELL, & ELIZABETH M.
ROBINSON

                                                 COASTAL PROTECTION AND
                                                  RESTORATION AUTHORITY
                                                     150 TERRACE AVENUE
                                                   BATON ROUGE, LA 70802
                                                    WWW.COASTAL.LA.GOV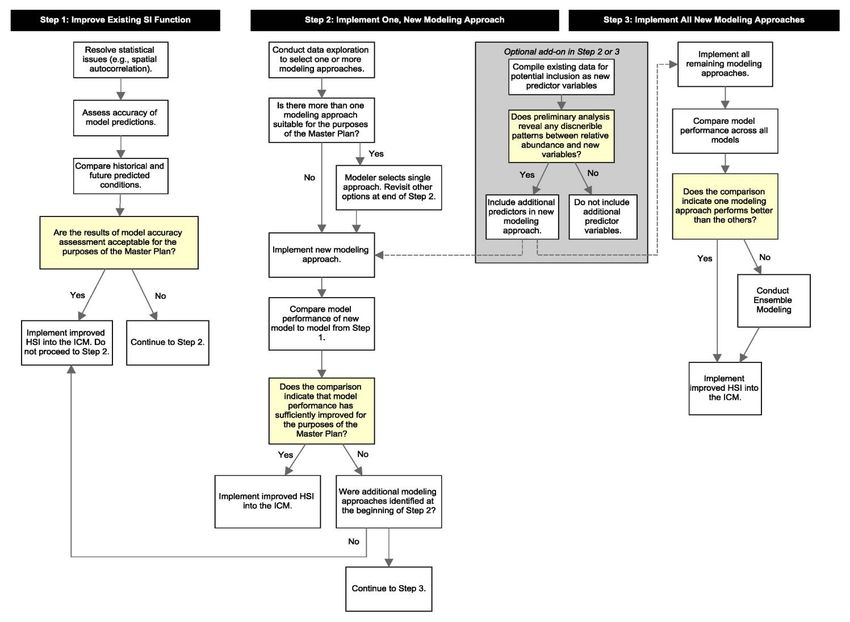
COASTAL PROTECTION AND
RESTORATION AUTHORITY
This document was developed in support of the 2023 Coastal Master Plan being prepared by the
Coastal Protection and Restoration Authority (CPRA). CPRA was established by the Louisiana
Legislature in response to Hurricanes Katrina and Rita through Act 8 of the First Extraordinary Session
of 2005. Act 8 of the First Extraordinary Session of 2005 expanded the membership, duties, and
responsibilities of CPRA and charged the new authority to develop and implement a comprehensive
coastal protection plan, consisting of a master plan (revised every six years) and annual plans. CPRA’s
mandate is to develop, implement, and enforce a comprehensive coastal protection and restoration
master plan.

CITATION
Sable, S.E., Lindquist, D.C., D’Acunto, L., Hijuelos, A.C., La Peyre, M.K., O’Connell, A.M., & Robinson,
E.M. (2019). 2023 Coastal Master Plan: Habitat Suitability Index Model Improvement
Recommendations. Final Report (49 p.) Baton Rouge, Louisiana: Coastal Protection and Restoration
Authority.

2023 COASTAL MASTER PLAN. Habitat Suitability Index Model Improvement
Recommendations                                                   2
ACKNOWLEDGEMENTS
This document was developed as part of a broader Model Improvement Plan in support of the 2023
Coastal Master Plan under the guidance of the Modeling Decision Team (MDT):
Coastal Protection and Restoration Authority (CPRA) of Louisiana – Elizabeth Jarrell,
Stuart Brown, Ashley Cobb, Catherine Fitzpatrick, Krista Jankowski, David Lindquist,
Sam Martin, and Eric White
University of New Orleans – Denise Reed
The following experts were responsible for the preparation of this document:
Shaye E. Sable – Dynamic Solutions, LLC
David C. Lindquist – CPRA
Laura D’Acunto – United States Geological Survey (USGS), Wetland and Aquatic
Research Center
Ann C. Hijuelos – USGS, Wetland and Aquatic Research Center
Megan K. La Peyre – USGS, Louisiana Fish and Wildlife Cooperative Research Unit
Ann M. O’Connell – University of New Orleans
Elizabeth M. Robinson – Louisiana State University (LSU) AgCenter
The authors would like to thank Brady Carter, with the Louisiana Department of Wildlife and Fisheries
(LDWF), and Erik I. Johnson and Katie Percy, with Audubon Louisiana, for their valuable input on these
recommended improvements.
2023 COASTAL MASTER PLAN. Habitat Suitability Index Model Improvement
Recommendations 3
EXECUTIVE SUMMARY
As part of the model improvement effort for the 2023 Coastal Master Plan, the Habitat Suitability
Index (HSI) models used during previous master plans were reevaluated to assess how the model
relationships could be improved, and to determine what species should be included in the master plan
analyses. This process considered the technical reviews, comments, and suggested improvements
provided by model developers, advisory groups, and other experts during previous master plans.
Reviews were then conducted to determine the availability of data and information that could be used
to make model improvements. As a result of this effort, a recommended list of relevant species to
model is provided, and HSI model improvements are recommended that are categorized by whether
the suitability index (SI) relationship to be improved is statistical-based or literature-based.

The species recommended to be included in the 2023 Coastal Master Plan analyses are: eastern
oyster, brown shrimp, white shrimp, blue crab, crayfish, gulf menhaden, spotted seatrout, largemouth
bass, American alligator, gadwall, mottled duck, brown pelican, seaside sparrow, and bald eagle.
These species were selected because they represent a range of taxonomies, life histories, trophic
levels, and habitats, and most are commercially- or recreationally-important in coastal Louisiana. Most
of these species were also included in the 2017 Coastal Master Plan analyses, and the models used
during that effort should be further improved. Seaside sparrow and bald eagle are new for the master
plan, and new models should be developed for the analyses.

The 2017 fish, shrimp, and blue crab HSI models included a water quality SI that was based on
statistical analyses of species catch and environmental data collected by the Louisiana Department of
Wildlife and Fisheries. As suggested during the 2017 Coastal Master Plan, the modeling approach
used to develop the water quality SI was revisited and alternate modeling approaches were explored.
Using literature and an evaluation of the general steps of model development, three components for
HSI model improvement were identified, including 1) selecting alternative modeling approach(es); 2)
detecting and resolving statistical issues; and 3) improving model fit and evaluation. Multiple options
for each component were explored, which resulted in a proposed multi-step phased approach for
model improvement. This proposed approach entails improving the generalized linear models used for
the 2017 water quality SIs and then, if desired, comparing them to alternative model approaches (e.g.,
generalized additive models) to explore model performance and select the best approach to use for
the 2023 Coastal Master Plan HSI models.

All of the existing master plan HSI models include literature-based SIs, which use information from
published studies of species-habitat associations to derive suitability relationships. Similar to previous
master plans, these literature-based SIs should be updated and improved for the 2023 Coastal
Master Plan using recent literature and new ecological knowledge. Preliminary reviews were

2023 COASTAL MASTER PLAN. Habitat Suitability Index Model Improvement
Recommendations                                                   4

conducted and recent information was found that could be used to improve the eastern oyster,
crayfish, and potentially brown pelican HSI models; but no appropriate recent literature was located
for improvement of the American alligator, gadwall, and mottled duck HSI models. However, it is
recommended that the literature reviews and information searches be continued. In addition to the
statistical-based water quality SI, the 2017 fish, shrimp, and blue crab HSI models also included a
structural habitat SI that was based on literature showing high densities of these species in
fragmented marsh. The relationship used for this SI, however, did not account for the effects of other
estuarine habitats, such as submerged aquatic vegetation and oyster reefs, which are also important
to these species. Therefore, a meta-analysis approach is proposed that would estimate the relative
importance of these habitats for each species, and the results of this analysis could be used to
calculate a new structural habitat SI for the 2023 Coastal Master Plan.

2023 COASTAL MASTER PLAN. Habitat Suitability Index Model Improvement
Recommendations                                                   5
TABLE OF CONTENTS
COASTAL PROTECTION AND RESTORATION AUTHORITY ...................................... 2
CITATION ..................................................................................................... 2
ACKNOWLEDGEMENTS.................................................................................... 3
EXECUTIVE SUMMARY .................................................................................... 4
TABLE OF CONTENTS ..................................................................................... 6
LIST OF TABLES............................................................................................. 7
LIST OF FIGURES ........................................................................................... 7
LIST OF ABBREVIATIONS ................................................................................ 8
1.0 INTRODUCTION........................................................................................ 9
2.0 MODEL IMPROVEMENT ACTIVITIES ............................................................12
  2.1 Identify Relevant Species to Model ................................................................................................. 12
  2.2 Improve Statistical-based Suitability Indices .................................................................................. 14
  2.3 Improve Literature-based Suitability Indices .................................................................................. 25
  2.4 Development of New HSI Models .................................................................................................... 33
3.0 SUMMARY OF RECOMMENDATIONS AND OPTIONS FOR IMPLEMENTATION .......35
4.0 REFERENCES ..........................................................................................42

2023 COASTAL MASTER PLAN. Habitat Suitability Index Model Improvement
Recommendations                                                   6
LIST OF TABLES
Table 1. Species included in the 2023 Coastal Master Plan HSI analyses, their
ecological or economic significance, and the source of the HSI model used for the
model improvement effort. .............................................................................13
Table 2. Summary of key considerations for each modeling approach. ..................18
Table 3. Collinearity diagnostics: indices and their critical values..........................23
Table 4. Guidelines for assessing model accuracy using AUC, Cohen’s (Araújo et al.,
2005) and TSS statistics (Landis & Koch, 1977; Eskildsen et al., 2013). ................25
Table 5. Example data table showing nekton density by habitat types from four
independent studies. .....................................................................................27
Table 6. Summary of recommendations that will be implemented for each of the
species.. ......................................................................................................40

LIST OF FIGURES
Figure 1. Statistics-based habitat suitability modeling approaches and the data types
needed to build them.....................................................................................16
Figure 2. Comparison of response curves among different modeling approaches and
with different degrees of control over the complexity of the fitted response curves
(from Merow et al., 2014). .............................................................................21
Figure 3. Graphic and numerical representation of the suitability index function used
to describe juvenile species habitat suitability based on the percentage of marsh
within a modeled cell. ....................................................................................26
Figure 4. Plots of the standardized suitability scores by habitat type for each of the
studies listed in Table 5.. ...............................................................................28
Figure 5. An example demonstration of SI scores for each habitat type estimated
from the suggested meta-analysis of field data collected in coastal Louisiana and
Texas.. ........................................................................................................28
Figure 6. Decision tree for recommended improvements to the statistical-based
suitability indices. .........................................................................................41

2023 COASTAL MASTER PLAN. Habitat Suitability Index Model Improvement
Recommendations                                                   7
LIST OF ABBREVIATIONS
AIC ............................................................. AKAIKE’S INFORMATION CRITERION
AUC .................. AREA UNDER THE RECEIVER OPERATING CHARACTERISTIC CURVE
CART.................................................. CLASSIFICATION AND REGRESSION TREES
CPRA................................. COASTAL PROTECTION AND RESTORATION AUTHORITY
CPUE ........................................................................... CATCH PER UNIT EFFORT
DNVB ................................................................ DEEP NON-VEGETATED BOTTOM
GAM .................................................................. GENERALIZED ADDITIVE MODEL
GLM ..................................................................... GENERALIZED LINEAR MODEL
HSI ....................................................................... HABITAT SUITABILITY INDEX
ICM............................................................. INTEGRATED COMPARTMENT MODEL
LDWF ................................ LOUISIANA DEPARTMENT OF WILDLIFE AND FISHERIES
MDT .............................................................................. MODEL DECISION TEAM
ME .............................................................................................. MARSH EDGE
MI ........................................................................................ MARSH INTERIOR
PM-TAC ....................... PREDICTIVE MODELING TECHNICAL ADVISORY COMMITTEE
PPT ................................................................................ PARTS PER THOUSAND
RMSE ..................................................................... ROOT MEAN SQUARE ERROR
SAV ............................................................. SUBMERGED AQUATIC VEGETATION
SI ...................................................................................... SUITABILITY INDEX
SNVB ..........................................................SHALLOW NON-VEGETATED BOTTOM
TSS ............................................................................... TRUE SKILL STATISTIC
USFWS ...........................................UNITED STATES FISH AND WILDLIFE SERVICE
USGS ....................................................... UNITED STATES GEOLOGICAL SURVEY

2023 COASTAL MASTER PLAN. Habitat Suitability Index Model Improvement
Recommendations                                                   8
1.0 INTRODUCTION
Habitat suitability index (HSI) modeling has a long history in water resource and restoration planning
for describing the quality or capacity of habitats to support fish and wildlife species (United States Fish
and Wildlife Service [USFWS], 1981). HSI models are simple to construct and communicate, and are
informed by species life history information along with presence-absence or relative abundance data
collected over a range of habitat conditions. HSI models consist of functions that relate key
environmental variables to the quality or suitability of the habitat for a species. The individual
relationships for each environmental variable are called suitability indices (SI). The SIs are
standardized to a 0 to 1 scale, with 0 defined as unsuitable and 1 defined as most suitable.

Habitat suitability index models have been used in previous master plan modeling efforts to evaluate
the potential effects of coastal restoration and protection projects on habitat for key coastal fish,
shellfish, and wildlife species. For the 2012 Coastal Master Plan, the HSI models were based on SIs
derived from the literature and best professional judgement from observations of species-habitat
associations in the field (Nyman et al., 2013). For the 2017 Coastal Master Plan, the HSI models
included a mix of SIs informed by literature and statistics (Brown et al., 2017). More specifically, for
blue crab, brown shrimp, white shrimp, gulf menhaden, bay anchovy, spotted seatrout, and
largemouth bass, statistical components of the 2017 HSI models included a water quality SI that
related monthly species catch-per-unit-effort data (CPUE) with corresponding salinity and water
temperature measurements collected by the Louisiana Department of Wildlife and Fisheries (LDWF)
long-term coastwide monitoring program. This water quality SI was then combined with literature-
based SIs for structural habitat and chlorophyll a concentration to form the HSI model for each
species. However, models for eastern oyster, crayfish, American alligator, gadwall, green-winged teal,
mottled duck, and brown pelican continued to be based on literature-derived relationships because of
the lack of suitable datasets for development of statistical-based models.

The 2017 Coastal Master Plan HSI models received feedback and review throughout the entire model
development process from several entities, including the Predictive Modeling Technical Advisory
Committee (PM-TAC), LDWF scientists, and other experts. These reviews provided recommendations
for improvement of the modeling approach for future master plans (Callaway et al., 2017). Major
comments regarding the 2017 HSI models included:

                 1. Re-evaluate the fish, shellfish, and wildlife species included in the modeling
                    effort. This evaluation should consider whether there are additional
                    economically- or ecologically-important species that should be included in the
                    effort. New species should be added if warranted and provided there are
                    sufficient resources available (e.g., existing models or data), to develop an HSI
                    model. Conversely, species could be dropped if they are no longer justified or if

2023 COASTAL MASTER PLAN. Habitat Suitability Index Model Improvement
Recommendations                                                   9
model performance cannot be improved.
2. Re-evaluate the Generalized Linear Model (GLM) approach used to develop the
statistical-based SIs for the 2017 HSI models. The polynomial functions used in
the approach may impose an unrealistic functional form to the CPUE data and
may fit poorly in areas of sparse data (Callaway et al., 2017). More recent,
updated statistical methods should be investigated for development of the HSI
models. It was also recommended that future work investigate the robustness of
the HSI models to alternative formulations and data uncertainty.
3. Incorporate new ecological knowledge into the existing HSIs. Suitability indices
could be adjusted based on revised understanding and/or additional data from
the literature or field studies. For example, suggested revisions include adjusting
eastern oyster life history processes such as spawning in relation to seasonal
environmental conditions. Another example is to reevaluate how to model
suitability for structural habitats, beyond strictly marsh vegetation and open
water, for the fish and shellfish species that differentially use these coastal
habitats for increased foraging and predation refuge.
As part of the model improvement effort for the 2023 Coastal Master Plan, the HSI models were
reevaluated to assess the data and information available to improve existing SIs, as well as to
determine whether additional species or life stages should be included (or excluded). To accomplish
this effort, the 2023 Coastal Master Plan HSI team was established and tasked to: 1) review the 2017
HSI models, results, and lessons learned from implementation into the master plan modeling
framework; 2) consider technical reviews, comments, and suggested improvements provided by model
developers, advisory groups, and other experts; and 3) provide a series of HSI model improvement
recommendations to the master plan Model Decision Team (MDT). The MDT is responsible for
deciding which recommendations to adopt, and then initiating the HSI model improvement activities.
The purpose of this technical memorandum is to document the process the 2023 Coastal Master Plan
HSI Team has taken and communicate potential recommendations to the MDT. This technical
memorandum is organized into four model improvement activities under Section 2. The first activity
(Section 2.1) is to revisit the species included in previous master plan modeling efforts and identify
relevant species to include in the 2023 Coastal Master Plan effort. Most of the species identified in
this memorandum were also included in the 2017 Coastal Master Plan. Consequently, as with 2017
models, the 2023 HSI models for these species are likely to include a mix of literature-based and
statistical-based SIs. The second activity re-evaluates the methods used to develop the statistical-
based SIs, and proposes alternative statistical modeling approaches, methods to detect and resolve
statistical issues, and methods to improve model fit and evaluation (Section 2.2). The third activity
suggests ways in which the literature-based SIs can be updated and improved by incorporating recent
literature, data, and different analyses (Section 2.3). The fourth activity includes suggestions for the
2023 COASTAL MASTER PLAN. Habitat Suitability Index Model Improvement
Recommendations 10development of HSI models for new species (Section 2.4). Lastly, Section 3 summarizes the recommendations (and options for implementing the recommended improvements) to provide CPRA with potential next steps toward implementing the 2023 HSI model improvements. 2023 COASTAL MASTER PLAN. Habitat Suitability Index Model Improvement Recommendations 11
2.0 MODEL IMPROVEMENT
ACTIVITIES
  2.1 IDENTIFY RELEVANT SPECIES TO MODEL

Several factors were considered in selecting relevant species to include in the 2023 Coastal Master
Plan modeling effort. Species were selected to represent the range of habitats that are likely to be
affected by master plan projects, including marshes, swamps, barrier islands, and subtidal water
bottoms. In addition, the selected species represent different taxonomic groups, life histories, and
trophic levels for a more complete assessment of project effects across faunal communities. Because
of their importance to Louisiana’s culture and economy, key species supporting commercial and
recreational fishing and hunting industries were selected. Lastly, species of conservation concern, as
identified by the Louisiana Wildlife Action Plan (Holcomb et al., 2015), were considered and a select
few are recommended to be included.

The species recommended to be included in the 2023 Coastal Master Plan modeling effort are:
eastern oyster, brown shrimp, white shrimp, blue crab, crayfish, gulf menhaden, spotted seatrout,
largemouth bass, American alligator, gadwall, mottled duck, seaside sparrow, brown pelican, and bald
eagle (Table 1). Most of these species were included in the 2017 Coastal Master Plan, and
consequently there are well-developed HSI models that can be further refined and improved. For the
2017 Coastal Master Plan, life stage-specific HSI models were developed for brown shrimp, white
shrimp, gulf menhaden, and spotted seatrout. These should be maintained to account for the
changing habitat requirements that occur for these species during the estuarine phase of their life
cycles. Bay anchovy (Anchoa mitchilli) and green-winged teal (Anas crecca), which were included in
the 2017 Coastal Master Plan, should be dropped for the 2023 Coastal Master Plan because they are
similar to gulf menhaden and gadwall, respectively, in terms of habitats, trophic guilds, and life
histories.

Bald eagles and seaside sparrow are included to increase the diversity of habitats represented in the
analyses. These species were selected following the recommendations of scientists from Audubon
Louisiana, and after an evaluation of available HSI models by the USFWS and other sources. Many
other coastal bird, mammal, and reptile species were considered, but dismissed because either the
species are habitat generalists that would not be significantly affected by master plan projects, or the
master plan’s Integrated Compartment Model (ICM) could not supply the required input data for the
species’ HSI model. Furthermore, some of the models for shoreline or barrier island nesting bird
species are better suited for evaluating existing nesting sites and other small, discrete areas; and thus

2023 COASTAL MASTER PLAN. Habitat Suitability Index Model Improvement
Recommendations                                                  12
are not well-suited for coastwide planning assessments. Wildlife species that were considered but not
included in the 2023 Coastal Master Plan modeling effort were: American coot, clapper rail,
diamondback terrapin, Forster’s tern, great egret, laughing gull, least tern, lesser snow goose, mink,
river otter, roseate spoonbill, slider turtle, white ibis, and white-tailed deer.
Table 1. Species included in the 2023 Coastal Master Plan HSI analyses, their
ecological or economic significance, and the source of the HSI model used for the
model improvement effort. x = separate HSI models for the small and large
juvenile life stages have been developed. y = separate HSI models for juvenile
and adult life stages have been developed.
SPECIES SPECIES SIGNIFICANCE MODEL SOURCE
ESTUARINE, SEDENTARY, PLANKTIVOROUS
EASTERN OYSTER MOLLUSK 2012 COASTAL
(CRASSOSTREA VIRGINICA) PROVIDES VALUABLE ECOSYSTEM SERVICES MASTER PLAN
SUPPORTS IMPORTANT COMMERCIAL FISHERIES
BROWN SHRIMP X BENTHIC CRUSTACEAN THAT USES ESTUARIES AS
2017 COASTAL
(FARFANTEPENAEUS JUVENILE NURSERY HABITAT
MASTER PLAN
AZTECUS) SUPPORTS IMPORTANT COMMERCIAL FISHERIES
BENTHIC CRUSTACEAN THAT USES ESTUARIES AS
WHITE SHRIMP X 2017 COASTAL
JUVENILE NURSERY HABITAT
(LITOPENAEUS SETIFERUS) MASTER PLAN
SUPPORTS IMPORTANT COMMERCIAL FISHERIES
BENTHIC CRUSTACEAN FOUND IN ESTUARINE
BLUE CRAB 2017 COASTAL
HABITATS THROUGHOUT MOST OF ITS LIFE CYCLE
(CALLINECTES SAPIDUS) MASTER PLAN
SUPPORTS IMPORTANT COMMERCIAL FISHERIES
CRAYFISH BENTHIC CRUSTACEAN PRIMARILY ASSOCIATED
2017 COASTAL
(PROCAMBARUS CLARKII WITH FRESHWATER HABITATS
MASTER PLAN
AND P. ZONANGULUS) SUPPORTS IMPORTANT COMMERCIAL FISHERIES
PLANKTIVOROUS FISH THAT USES ESTUARIES AS
GULF MENHADEN Y 2017 COASTAL
JUVENILE NURSERY HABITAT
(BREVOORTIA PATRONUS) MASTER PLAN
SUPPORTS IMPORTANT COMMERCIAL FISHERIES
PREDATORY FISH FOUND IN ESTUARINE HABITATS
SPOTTED SEATROUT Y 2017 COASTAL
THROUGHOUT MOST OF ITS LIFE CYCLE
(CYNOSCION NEBULOSUS) MASTER PLAN
POPULAR RECREATIONAL FISHERY SPECIES
2023 COASTAL MASTER PLAN. Habitat Suitability Index Model Improvement
Recommendations 13SPECIES SPECIES SIGNIFICANCE MODEL SOURCE
LARGEMOUTH BASS PREDATORY FISH PRIMARILY ASSOCIATED WITH
2017 COASTAL
(MICROPTERUS FRESHWATER HABITATS
MASTER PLAN
SALMOIDES) POPULAR RECREATIONAL FISHERY SPECIES
AMERICAN ALLIGATOR UPPER TROPHIC LEVEL REPTILE PRIMARILY
2017 COASTAL
(ALLIGATOR ASSOCIATED WITH FRESHWATER HABITATS
MASTER PLAN
MISSISSIPPIENSIS) COMMERCIALLY-HARVESTED SPECIES
MIGRATORY WATERFOWL THAT USES ESTUARIES
GADWALL 2017 COASTAL
AS WINTERING HABITAT
(ANAS STREPERA) MASTER PLAN
POPULAR RECREATIONALLY-HUNTED SPECIES
WATERFOWL THAT IS YEAR-ROUND RESIDENT OF
MOTTLED DUCK ESTUARIES 2017 COASTAL
(ANAS FULVIGULA) STATE-IDENTIFIED SPECIES OF CONSERVATION MASTER PLAN
NEED
UPPER TROPHIC LEVEL COASTAL SEABIRD THAT
BROWN PELICAN
NESTS PRIMARILY ON COASTAL ISLANDS 2017 COASTAL
(PELECANUS
STATE-IDENTIFIED SPECIES OF CONSERVATION MASTER PLAN
OCCIDENTALIS)
NEED
YEAR-ROUND RESIDENT OF VEGETATED MARSH
SEASIDE SPARROW
HABITATS
(AMMOSPIZA MARITIMA NEW MODEL
STATE-IDENTIFIED SPECIES OF CONSERVATION
FISHERI)
NEED
BALD EAGLE UPPER TROPHIC LEVEL RAPTOR THAT NESTS
PRIMARILY IN WOODED, FRESHWATER HABITATS
(HALIAEETUS L. NEW MODEL
LEUCOCEPHALUS) STATE-IDENTIFIED SPECIES OF CONSERVATION
NEED
2.2 IMPROVE STATISTICAL-BASED SUITABILITY INDICES
The 2017 HSI models developed for blue crab, brown shrimp, white shrimp, gulf menhaden, spotted
seatrout, and largemouth bass included a statistical-based water quality SI. Review of the models by
the PM-TAC (Callaway et al., 2017) indicated that the modeling approach used to develop that SI
should be revisited and alternate modeling approaches should be explored. To address this comment,
the habitat suitability model development literature (also called species distribution models) was
reviewed and each of the general steps of model development was considered, from data preparation
and model fitting to model evaluation, while considering the ecological justification and rationalization
through every step. In keeping with widely accepted principles of model development (e.g., Guisan &
2023 COASTAL MASTER PLAN. Habitat Suitability Index Model Improvement
Recommendations 14Thuiller, 2005) and working within the framework of available data, the 2023 Coastal Master Plan HSI
team identified three components for model improvement:
Component 1: Select Alternative Modeling Approach(es)
Component 2: Detect and Resolve Statistical Issues
Component 3: Improve Model Fit and Evaluation
For each component, multiple options are presented but are not necessarily mutually exclusive. In
instances where they are, the pros and cons of selecting one option over another are summarized,
where guidance is well-established in the literature. Furthermore, decisions made in one component
will influence the available options in other components. To help clarify, the available options are
provided in each of the sections and then it is summarized how these options across components may
be paired together in the summary recommendations in Section 3.
Component 1: Select Alternative Modeling Approach(es)
Several statistical approaches are available to model species-environment relationships. The selection
of the approach is largely driven by the type of data available and the intended purpose and
application of the modeling effort (Guillera-Arroita et al., 2015). The 2017 Coastal Master Plan used
the GLM modeling approach for constructing the water quality SI for the fish and shellfish HSI models.
Although considered a classical and flexible approach, one important limitation with GLMs is their
sensitivity to modeling scale, as is further discussed later in this section. In this section, the use of
GLMs is revisited and alternative modeling approaches are discussed. Each of the modeling
approaches described herein have pros and cons, but it is important to note that there is no
consensus within the current literature on an approach that works best for any given situation.
Commonly used modeling approaches, organized by type of data they require, are presented in Figure
1. Each of these approaches are appropriate to use with the available LDWF data and for evaluating
projected spatial changes in species’ suitability among the 2023 Coastal Master Plan restoration
alternatives. The LDWF collects CPUE (relative abundance) using different gears that target certain
species and life stages across coastal Louisiana. Any of the models using presence-only/presence-
background (Figure 1) will work with the LDWF data but require the data to be rescaled. This means
the CPUE response would be changed to 1s and 0s based on criteria the analyst would decide upon.
However, models constructed with relative abundance data are generally more robust than models
created with presence/absence data (Howard et al., 2014). As a result, the team decided to focus
efforts on those approaches suitable for relative abundance data only: GLMs, Generalized Additive
Models (GAM), Classification and Regression Trees (CART), RandomForest, and Ensemble Modeling.
2023 COASTAL MASTER PLAN. Habitat Suitability Index Model Improvement
Recommendations 15Since the modeling approaches will be used in a predictive application, they have implications for the way they should be fitted and evaluated (Elith & Leathwick, 2009). Under-fit models may not ade- quately describe observed occurrence-environmental relationships while ‘over-fit’ models may ascribe patterns to environmental noise and may not be accurately interpreted (Merow et al., 2014). In the following sections, each modeling approach is described as well as important aspects that should be considered, including model fit and evaluation. The level of effort for model development (i.e., relative to the other modeling approaches described herein) is briefly described. These considerations are then summarized in Table 2 for all modeling approaches side-by-side. Figure 1. Statistics-based habitat suitability modeling approaches and the data types needed to build them. Green shading indicates modeling approaches that were selected for consideration in the 2023 Coastal Master Plan modeling. GLMs are commonly used to model habitat suitability of species; this approach was used in the 2017 HSI models. GLMs are a flexible tool which estimates the relationship between predictor variables (environmental covariates) and the response variable (relative abundance) using Maximum Likelihood Estimation. In cases with enough sample size, this estimation method is robust and generally produces adequate predictive ability. All observations within a GLM must be independent, but random effects can be implemented to address non-independence within the data (through time or space). Additionally, predictor variables can be transformed into non-linear relationships using transformations such as quadratic or cubic (sometimes called polynomials) or interactions between 2023 COASTAL MASTER PLAN. Habitat Suitability Index Model Improvement Recommendations 16
variables can be explored. GLMs can be implemented in any standard statistical software and produce
output that can be translated into an equation for prediction (Zar, 2010). One important limitation with
GLMs is their sensitivity to the modeling scale: these models often are poor at predicting outside the
bounds of the data they are fit to or outside the spatial scale they were fit to (Thuiller et al., 2003).
Given that the GLM modeling approach was used for constructing the water quality SI in the 2017 HSI
models and this equation has already been integrated into the ICM, the level of effort for incorporating
this model into the 2023 HSIs is relatively low (Table 2). However, several other model improvement
steps described in the following sections are recommended for this existing model, as discussed in
Section 3.0, and this would require a minimal amount of time (3 to 4 months).

GAMs are a special case of GLM which automates the process of identifying the most appropriate
transformations of the data to generate a polynomial relationship (Guisan et al., 2002). GAMs allow
parametric and non-parametric predictors to be modeled simultaneously, generally leading to a better
fit model and a greater ability to predict outside the bounds of the data and at multiple scales (Thuiller
et al., 2003). However, this can lead to overfitting and thus great care in the selection of the
‘smoother’ parameter must be taken (Wood, 2006). GAMs can be implemented in most statistical
software and their associated predictive equations extracted, but these equations have the potential
to be large and/or complicated. Large or complicated equations may lead to slightly higher
computation times in both fitting the model and then predicting the model for new conditions in the
future compared to the GLM approach. However, the HSI predictive models implemented within the
ICM framework would still run efficiently compared to the other ICM modeling processes; the GAM
equations would not be limiting the computation times for the numerical simulations in the master
plan. To construct a new water quality SI using the GAM approach, the team estimates a moderate
amount of development and testing time (Table 2).

2023 COASTAL MASTER PLAN. Habitat Suitability Index Model Improvement
Recommendations                                                  17
Table 2. Summary of key considerations for each modeling approach.
“Distribution assumptions” refers to whether there are limits on the statistical
distribution of predictors, “Predictive power” refers to the approach’s ability to
predict into novel space or time periods, “Development time” is the estimated
effort required to build the model, “ease of ICM integration” refers to the level of
programming required to code the model into the ICM, and “computation time”
refers to how long the model takes to run based on a simulated dataset of
10,000 observations and 2 predictors.

                  GLM               GAM             CART             RANDOMFOREST        ENSEMBLE

 DISTRIBUTION     YES               YES, BUT        NONE             NONE                N/A
 ASSUMPTIONS                        FLEXIBLE

 PREDICTIVE       LOW               MODERATE        MODERATE         MODERATE TO         HIGH
 POWER                              TO HIGH                          HIGH

 DEVELOPMENT      ALREADY DONE      6-8 MONTHS      6-8 MONTHS       6-8 MONTHS          12+ MONTHS
 TIME             FOR 2017

 EASE OF ICM      ALREADY DONE      EASY TO         MODERATE         MODERATE            MODERATE
 INTEGRATION      FOR 2017          MODERATE

 COMPUTATION      .01 SEC           0.15 SEC        0.05 SEC         36.33 SEC           1 MIN
 TIME

CARTs are a machine learning technique first introduced in the 1980s to bridge statistics with
computer science (e.g., Breiman et al., 1984) for creating predictive models. CARTS (or decision trees,
regression trees) are commonly used in data mining with the objective of creating a model that
predicts the value of a response variable based on the values of several independent variables. CART
models recursively split observation data using identified predictors to find homogenous (i.e., similar)
response variable groups (Krzywinski & Altman, 2017). Therefore, CARTs do not produce a predictive
equation like GLMs or GAMs, but instead produce rules that can be visualized with a decision tree.
These rules can then be used to predict species patterns using new data (i.e., new predictor variables
are the future environmental simulated conditions from the ICM). Because CARTs can essentially
produce decision trees that are 100% accurate, the models produced with this method can easily be
overfit and therefore have low predictive power when used with other data. To address this, the
modeler can implement a complexity parameter which limits tree growth based on how well a split
improves the relative error in the model (Lever et al., 2016). While there is some guidance on what
this value should be, it is generally up to the modeler to determine and justify this value. The model
development time using statistical software with the LDWF data would be similar to that for the GAM
development and testing (Table 2).

2023 COASTAL MASTER PLAN. Habitat Suitability Index Model Improvement
Recommendations                                                  18
RandomForest is a special kind of CART model that generates multiple classification trees that are then combined into an ensemble classification (Breiman, 2001). As with CART, RandomForest produces a classification tree, not a predictive equation, and are sometimes considered a “black-box” due to the difficulty in examining each individual tree. The algorithm uses an estimate of generalization error called the “out-of-bag” error to determine how strong the classifier is, and the modeler may increase the number of trees produced by the RandomForest algorithm to decrease the error and thus produce a better fit ensemble tree (Breiman, 2001; Peters et al., 2007). Models built using RandomForest are typically highly accurate when tested against data used to build the model (Prasad et al., 2006), but may not necessarily perform any better than other modeling approaches when used in predictive applications with new data (i.e., simulated ICM data inputs). As mentioned, the models are also considered a ‘black box’ as the algorithm cannot be visualized as a predictive equation. The model development time is similar to that of GAMs and CARTs (Table 2), and the implementation of the resulting RandomForest model as a submodule to be used within the ICM framework would be similar to the GAM and/or CART submodule(s) as well. Ensemble models are developed by using a consensus method based on output predictions from multiple modeling approaches (Marmion et al., 2008). In this case, the ensemble modeling approach would mean building the four separate models using GLM, GAM, CART, and RandomForest. The predicted suitability outputs from each of these models would then be converted into a weighted average using the modeler’s chosen accuracy measure (e.g. area under the receiver operating characteristic curve [AUC] or Cohen’s kappa) to produce the ensemble model. Ensemble models have been frequently shown to generate the most accurate and robust habitat suitability models because they incorporate the strengths of all modeling approaches (Grenouillet et al., 2011). However, this approach would require more development time than any of the previous modeling approaches (Table 2), as it requires the modeler to develop each of the above models, and then weigh the predicted responses from each of the four suitability model approaches for the finalized ensemble model. Component 2: Detect and Resolve Statistical Issues Prior to running the statistical-based models, there are common data steps that should be conducted to avoid statistical errors and misinterpretation of model output. These include: 1) detecting outliers, 2) testing for heterogeneity of variance, collinearity, and dependence of observations, 3) zero inflation in generalized linear modeling, 4) fitting the correct type of relationships between dependent and independent variables, and 5) using appropriate data transformations (Zurr et al., 2010). The basic principles of data analysis are widely discussed and summarized in the literature (Hilborn & Mangel, 1997; Quinn & Keogh, 2002; Zurr et al., 2010). Although some of these data steps were performed for the 2017 HSI model development (e.g., detecting outliers, testing for collinearity and dependence of observations), they were not documented in the technical reports. Therefore it is recommended that as part of any improvement to the statistical-based models, each of these elements be revisited and 2023 COASTAL MASTER PLAN. Habitat Suitability Index Model Improvement Recommendations 19
documented to ensure compliance with standard best practices of data analysis.

Component 3: Improve Model Fit and Evaluation

Evaluation of model performance includes assessment of: 1) ecological justification of selected
predictor variables; 2) resulting relationships, including the ability to visually interpret the resulting
habitat suitability response functions; 3) accuracy of model predictions (Austin et al., 2006; Elith &
Leathwick, 2009; Merow et al., 2014). Options for assessing these elements of performance for the
statistical-based SIs is discussed below.

In the water quality SI developed for each species in the 2017 HSI models, two predictor variables,
salinity and temperature were included because of substantial evidence in the literature that suggest
these environmental factors influence habitat suitability for estuarine fish and shellfish life stages
(e.g., Adamack et al., 2012; Baker & Minello, 2010; Rozas & Minello, 2010; Flaherty & Guenther,
2011; Patillo et al., 1997; Kupschus, 2003; Froeschke & Froeschke, 2011). Salinity and temperature
data collected alongside relative abundance data (i.e., CPUE) were also readily available as part of the
existing LDWF fisheries-independent monitoring dataset. Review of the literature revealed that the
functional form of the relationship was likely going to be non-linear and interacting, so both linear and
quadratic forms of salinity and temperature were included in the model development and selected
using stepwise selection procedure (p≤ 0.05). This resulted in a relatively simple SI that identified
some expected response curves demonstrated by the literature. The same salinity and temperature
data were used with the species CPUE data collected by LDWF for the statistical-based water quality SI
improvements.

However, additional ecological predictor variables could be considered to increase model complexity
and potentially reduce total model error. Predictor variables would be selected that are ecologically
relevant and are closely related (i.e., proximal) to the causal factor driving the species CPUE response
(Elith & Leathwick, 2009). Tradeoffs exist on the number of variables that should be included. Simple
models with few predictors are often capable of identifying key trends while smoothing over noise and
variation in the dataset (Figure 2), as is the case with the current water quality SI. Increasing the
number of predictors and ultimately increasing the complexity of the model, allows for fitting many
features (Figure 2), but can only be done with sufficiently large datasets and care must be taken to
avoid over-fitting (Merow et al., 2014).

2023 COASTAL MASTER PLAN. Habitat Suitability Index Model Improvement
Recommendations                                                  20
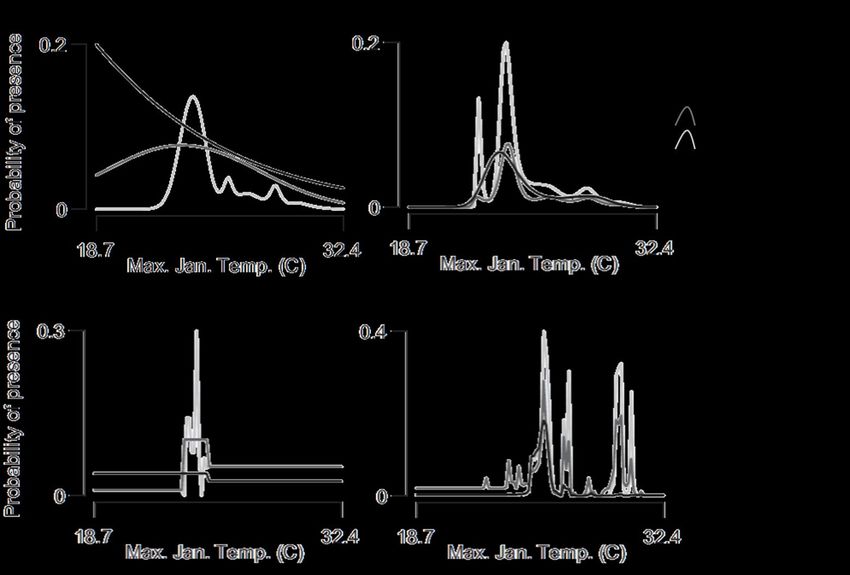
Figure 2. Comparison of response curves among different modeling approaches
and with different degrees of control over the complexity of the fitted response
curves (from Merow et al., 2014).

Although additional predictor variables related to structural habitat and chlorophyll a concentration
were included in the fish, shrimp, and blue crab 2017 HSI models as separate SIs (as discussed in
Section 2.3), they were developed independently of the water quality statistical-based SI. Another
option for improving the statistical-based SI models would be to include additional relevant predictor
variables, in addition to salinity and temperature, and reconstruct the SI using one of the modeling
approaches described previously. These additional predictor variables would have to come from
datasets other than the LDWF fisheries independent monitoring dataset, but that show overlap in
space and time with the LDWF dataset. For example, annual land and water spatial data currently
exist for the Louisiana coast for 16 years between 1985 and 2016 (Couvillion, 2018) and could be
produced for additional years within and around that time period, if needed. Different kinds of
predictor variables could be generated from these spatial data, including land-to-water ratios, distance
to marsh edge, area of marsh edge, and several fragmentation metrics available within ArcGIS Spatial
Analyst. Each of these predictor variables could be calculated within a buffered area around the LDWF
sampling location for the years where the datasets overlap. Although multiple buffer sizes could be
tested, a literature review may help guide what size buffer is most appropriate for calculating these
variables (i.e., at what spatial scale are these variables likely to be important to the species). Although

2023 COASTAL MASTER PLAN. Habitat Suitability Index Model Improvement
Recommendations                                                  21
these data are not currently available for all years of the LDWF data, a reduction in statistical power is
not anticipated given that 16 years of data is still a considerably large dataset for habitat suitability
modeling. However, if the smaller subset of data does generate concerns or issues, additional land
and water datasets could be developed for other years that overlap with the LDWF dataset.

Other predictor variables associated with Mississippi and Atchafalaya River discharge, climate, and
weather, for example, could also be explored for inclusion, pending available data, ease of accessing
data, collinearity with other variables (discussed below), and other considerations determined by the
model developers. Although not all of these predictor variables may be available output from the ICM,
it is important to include them in the expanded data set because they have the potential to adjust the
relationships of other predictor variables. For integration into the ICM, they could be held constant (at
their mean, for example) and would not need to vary over time. Discussion of relevant variables with
LDWF scientists would assist in refining a list of predictor variables for possible inclusion in the
expanded dataset. As part of the model building procedure, variable selection methods (e.g., p-values,
95% confidence intervals) would then be used to select the most appropriate variables for final
inclusion in the updated SI.

One potential outcome of this option for incorporating additional predictor variables in the expanded
dataset is that none of the variables are ultimately selected for inclusion in the model (i.e., variables
are not significant or do not improve model fit). One way to prevent spending too much effort to arrive
at this unwanted outcome for this option would be to first conduct some simple data exploratory steps,
such as testing for correlation between relative abundance and the new predictor variables first, prior
to building the model. If no discernable pattern emerges, the model developers could determine that
continuing this expanded data exploration for model building is likely not a promising endeavor.

Whether the expanded dataset option is included for implementation or not, assessment of model
biases should be performed and documented for the 2023 water quality SI models. After predictors
are selected for the model, model biases such as collinearity among predictors and spatial
autocorrelation in model residuals should be assessed. Model biases were not documented in the
2017 Coastal Master Plan and warrant revisiting as part of the model improvement activity. Several
diagnostics exist for testing for collinearity (

Table 3). Ignoring collinearity can result in increased error and potential failure to detect significant
effects when they exist (i.e. Type II error; Zurr et al., 2010). Where collinearity may be present, one of
the predictor variables could be removed.

2023 COASTAL MASTER PLAN. Habitat Suitability Index Model Improvement
Recommendations                                                  22
Table 3. Collinearity diagnostics: indices and their critical values (from Dormann
et al., 2013).

 Method                                                         Threshold
 Absolute value of correlation coefficients (|r|)               > 0.7 high collinearity
                                                                Near 0 = high collinearity
 Determinant of correlation matrix (D)
                                                                Near 1 = no collinearity
 Condition index (CI)                                           > 30
 Condition number (CN)                                          > 30
 Kappa (K)                                                      5
 Variance-decomposition proportions (VD)                        > 0.5
 Variance inflation factor (VIF)                                > 10
 Tolerance                                                      < 0.1

Spatial autocorrelation, or the tendency for data closer together in space to be more similar, is a well-
known phenomenon in ecology (Legendre, 1993) and may be present in the existing water quality SI.
The presence of spatial autocorrelation can both impact the coefficient estimates and the strength of
the relationships within a model (Lichstein et al., 2002). In models of habitat suitability or species
distribution, accounting for spatial autocorrelation within the observation data can change predictor
variable importance and improve the fit (or reduce levels of uncertainty, Dormann, 2007). To address
spatial autocorrelation within HSI models, researchers typically employ one of two approaches: 1)
spatial thinning of observations or 2) statistical methods that address or account for autocorrelation.
Spatial thinning of observations requires knowledge of the species’ dispersal ability and using that
knowledge to remove observations until there are no observations that are spatially dependent on
each other (Fortin & Dale, 2005). Statistically accounting for spatial autocorrelation within the species
models can be done by adding environmental covariates such as day of year or geographic region to
account for seasonal timing of life stage migrations and species occurrence within the various coastal
habitats. To test whether the existing model’s output is spatially autocorrelated, the residuals of the
existing model can be checked using Moran’s I and a decision can then be made on if and how it
should be addressed (Dormann et al., 2007). If an autocorrelation variable is added to the model
while resolving biases, the variable can be held constant when integrated into the ICM and would not
affect or limit the model’s use in the master plan.

The second step of assessing model performance is evaluating the interpretability of the response
curve (e.g., Figure 2). Once fitted, generating response curves for individual predictor variables, while
holding other variables in the model constant (at their mean, for example), can assist in determining
whether the predicted response is ecologically reasonable (Austin, 2007). The complexity of the model
will have a considerable effect on the generality and interpretability of response curves, as illustrated

2023 COASTAL MASTER PLAN. Habitat Suitability Index Model Improvement
Recommendations                                                  23
in Figure 2. The complexity of the model is a function of the number of predictors, order of interactions, and other features specific to the modeling approaches themselves. In the existing 2017 water quality SI based on salinity and temperature, the fitted response curves confirmed the species-habitat relationships from other studies in coastal Louisiana and Texas (Adamack et al., 2012; Baker & Minello, 2010; Rozas & Minello, 2010; Patillo et al., 1997). However the fitted polynomial response curves often flipped outside of the data range used to fit the model(s), so the model values were truncated to the values at the data extremes. For example, if the habitat suitability score was equal to 0.2 at a salinity of 2 ppt and a temperature of 10 degrees C, then the suitability score was set to 0.2 at temperatures below 10 degrees when salinity was equal or less than 2 ppt. The other statistical modeling approaches can be evaluated with the current GLM approach to determine if the fits and behavior of the functions are better. Several data partitioning methods are available to train (fit the model) and validate (estimate prediction error) habitat suitability models. For sufficiently large datasets, like the LDWF dataset, the data can be randomly divided once into training and validation datasets (for example application see Drexler & Ainsworth, 2013). Alternatively, cross-validation (i.e. k-fold partitioning), jackknifing, and bootstrapping can be used to determine which part of the data is used to fit the model and which part to test it, and the procedure is repeated several times providing a mean and variance for validation measures (for example application see Cianfrani et al., 2010). Because the procedure is repeated a number of times for these alternative approaches, they are more time consuming than the training and validation procedure. However, the cross-validation procedures are presented as an option, because if there is interest in implementing the expanded dataset option for potential addition of new predictor variables, the exercise would result in fewer years of data for an overall smaller dataset. Regardless of the approach, care should be taken in splitting the dataset to control for underlying biases such as spatial autocorrelation, as previously discussed (Merow et al., 2014). Various criteria are available to evaluate the resulting model(s) fit to the data (i.e., original LDWF and/or the expanded data set). Goodness of fit is a measure of the difference between the observed data and predicted values and is typically assessed using the chi-square statistic, coefficient of determination (R2), examination of model residuals, information criterion such as likelihood or Akaike’s Information Criterion (AIC; Akaike, 1973; Thomson & Emery, 2014), or root mean square error (RMSE; Zar, 2010). Model accuracy can also be assessed on the validation dataset by also using RMSE, AUC (Hanley & McNeil, 1982), Cohen's K (Monserud & Leemans, 1992), and/or the true skill statistic (TSS; Allouche et al., 2006). Depending on the statistical modeling approach taken, some of these measures are more appropriate than others. RMSE is commonly reported for assessment of model performance, and is used for all statistical HSI approaches; R2 is used for GLMs and GAMs; AIC is used for GLMs, GAMs, and CART; AUC, Cohen’s K, and TSS are more appropriate for RandomForest. Each of these measures has their own bias, so it is advised to use more than one measure beyond 2023 COASTAL MASTER PLAN. Habitat Suitability Index Model Improvement Recommendations 24
RMSE when assessing model accuracy. Existing guidelines for assessing some of these measures of
model accuracy are provided in Table 4.

Goodness of fit and accuracy of the model predictions were not assessed for any of the water quality
SIs during the 2017 Coastal Master Plan effort. Confidence intervals and goodness of fit tests should
be calculated for the statistical model(s) to define the degree of certainty in the predictions between a
lower and upper bound. Calculation of model accuracy would require an independent dataset to
validate the existing model(s). One option would be to use the LDWF dataset beyond 2013 (2014-
2019) as a validation data set, if the same data set used for the 2017 HSI models (1986-2013) is
used to fit the statistical based SIs. Another option is to divide the full dataset (whether using the
original LDWF data set or the proposed expanded data set) into a test and validation dataset to fit and
then re-run the model(s). This recommendation is elaborated on in Section 3.0.

Table 4. Guidelines for assessing model accuracy using AUC, Cohen’s (Araújo et
al., 2005) and TSS statistics (Landis & Koch, 1977; Eskildsen et al., 2013).

                                                 Model Accuracy Statistics
 Model Accuracy
 Assessment
                                      AUC                  Cohen’s K                      TSS

 Excellent                    >0.90                    >0.75                     1

 Good                         0.80-0.90                0.4-0.75                  0.6-0.9

 Fair                         0.70-0.80                .                         0.4-0.6

 Poor                         0.60-0.70                < 0.40                    0.0-0.4

 Fail                         0.50 - 0.60              .                         0.0

 No predictive ability        ≤0.5                     0                         < 0

  2.3 IMPROVE LITERATURE-BASED SUITABILITY INDICES

All existing master plan HSI models include literature-based SIs. These SIs describe the habitat
suitability for a variety of environmental factors, such as water level, vegetation type, marsh-to-open
water habitat configuration, and chlorophyll a concentration. For the 2012 and 2017 Coastal Master
Plan modeling efforts, these SIs were updated with ecological knowledge from recent literature and
data. It was hoped that the literature-based SIs could be replaced with statistical-based SIs, similar to

2023 COASTAL MASTER PLAN. Habitat Suitability Index Model Improvement
Recommendations                                                  25
You can also read