Mid-term Impacts of Silvicultural Treatments on Soils and Understory Plant Diversity in Temperate Hardwood Forests of Quebec, Canada.
←
→
Page content transcription
If your browser does not render page correctly, please read the page content below
Mid-term Impacts of Silvicultural Treatments on
Soils and Understory Plant Diversity in Temperate
Hardwood Forests of Quebec, Canada.
Romain Jaeger ( jaer01@uqo.ca )
Université du Québec en Outaouais: Universite du Quebec en Outaouais https://orcid.org/0000-0001-
8379-5854
Sylvain Delagrange
Université du Québec en Outaouais: Universite du Quebec en Outaouais
Isabelle Aubin
Natural Resources Canada
Gilles Joanisse
Centre d'enseignement et de recherche en foresterie de Sainte-Foy
Patricia Raymond
Gouvernement du Québec: Gouvernement du Quebec
David Rivest
Université du Québec en Outaouais: Universite du Quebec en Outaouais
Research Article
Keywords: Beta diversity, Biotic homogenization, Forest succession, Scarification, Soil physico-chemical
properties
DOI: https://doi.org/10.21203/rs.3.rs-651074/v1
License: This work is licensed under a Creative Commons Attribution 4.0 International License.
Read Full License
Page 1/35Abstract
Background: Short-term effects of silvicultural treatments on soil properties and understory vegetation in
temperate hardwood forests are well documented, but few studies have examined longer term effects of
treatment intensity. We hypothesized that short-term effects of silvicultural treatments on understory
plant diversity do persist over the medium-term (20 years after treatment); the magnitude of these effects
would be proportional to the intensity of canopy and soil disturbance.
Methods: Soil properties (pH, total C and N, extractable P, exchangeable bases) and understory
community diversity indices were measured in six experimental sites along a longitudinal gradient that
covered different climatic and edaphic conditions in the yellow birch-sugar maple bioclimate domain.
Reference condition, i.e. control forest with no anthropogenic disturbance for at least 80 years (CON) were
compared to twenty years old regeneration treaments representing a gradient of canopy and soil
disturbance intensity: single-tree selection cuts (SIN); group-selection cuts (GRP); and group-selection
cuts with scarification (GRPS).
Results: Geographic location of sites explained more variation in soil properties and community
composition than did treatments. Species richness in both group-selection treatments was higher than
that in CON forests. However, understory plant equitability and beta diversity among sites in GRP and
GRPS were lower than in SIN and CON forests. More intense treatments (GRP and GRPS) increased the
relative occurrence of vegetatively reproducing heliophilic plants, a trait syndrome associated with
adaptations to disturbed environments. These treatments also contributed to the medium-term
persistence of recalcitrant competitor species (e.g., Rubus idaeus, Prunus pensylvanica) whereas soil
scarification appears to have negative sustained effects on species known to be sensitive to regeneration
treatments (e.g. Monotropa uniflora, Dryopteris spinulosa).
Conclusion: Of the treatments studied, single-tree selection cutting appears to be the most appropriate
silvicultural treatment for maintaining soil functions and heterogeneous understory plant communities
with compositions and structures similar to natural forests, while more intense treatments rather
maintain and expand species that are better adapted to a wider range of environmental conditions,
including open environments.
Background
Within temperate forest ecosystems, the diversity of understory plant communities is a key determinant
of forest dynamics. These communities play important roles in the occurrence and maintenance of
several key ecological processes (e.g., nutrient recycling, regeneration; Gracia et al. 2007; Moisan-De
Serres et al. 2018). Yet, these communities exhibit increased environmental sensitivity that could be
exacerbated by repeated harvesting pressures that disturb both the soil and forest cover (Roberts and Zhu
2002; Ellum 2009).
Page 2/35Since the 1990s, researchers have been interested in the relationships between silvicultural treatment
intensification (i.e., increased disturbance intensity or frequency; Foley et al. 2005), forest productivity and
biodiversity (Gilliam and Roberts 1995; Brockerhoff et al. 2008; Paquette and Messier 2010). Some have
suggested that intensification required of forest management practices threatens forest landscapes (e.g.,
through decreases in structural complexity; Chaudhary et al. 2016) and biodiversity (e.g., changes in
species composition, decreases in heterogeneity and functional diversity; Lindenmayer 2012, 2016;
Gauthier et al. 2016; Yeboah et al. 2016; Messier et al. 2019). Others have suggested that by maintaining
forest harvesting, more services in fact are produced (e.g., wood production) than could be achieved
without management (Puettmann et al. 2009; O'Hara 2015).
In temperate hardwood forests, silvicultural treatments can have contrasting effects on biotic and abiotic
conditions (Siemion et al. 2011; Duguid and Ashton 2013). Different levels of soil and canopy
disturbance intensity, relative to the size of canopy openings and the nature of machinery that is used,
can alter plant community composition and soil properties (Roberts 2004). For example, species richness
and relative abundance of shade-intolerant species increases with the percentage of canopy openings
(Keenan and Kimmins 1993). In contrast, small canopy openings, such as those that are created by
natural disturbances, i.e., senescence and death of an individual tree or small group of individuals, tend to
maintain the native flora of closed natural environments (Angers et al. 2005; Poznanovic et al. 2013).
Large canopy disturbances also provide opportunities for competitive pioneer species to establish and
spread over the short-term (Webster and Lorimer 2005), which can interfere with the regeneration of
commercially important species (Royo and Carson 2006; Shields and Webster 2007; Powers and Nagel
2009) and locally decrease the occurrence of late-successional species (Paillet et al. 2010; Duguid and
Ashton 2013). Also, while emulation of strong soil disturbances that are caused by windthrow in the case
of the natural disturbance regime, or following scarification, are implemented to create microsites that
favour desired commercial species, e.g., Betula alleghaniensis Britton (yellow birch) (Erdmann 1990), the
application of these techniques can also substantially modify soil physico-chemical properties, such as
reductions in C and N concentrations, soil compaction and decreases in the organic horizon thickness
(Siemion et al. 2011; Chaudhary et al. 2016).
Management of North American hardwood forests has evolved towards alternative regeneration
processes in order to maintain forests that are resilient to global change and to address problems that are
related to biodiversity conservation. These alternative forms of management include partial cuts, which
involve lower levels of disturbance that are closer to the natural disturbance regime, i.e., the ecosystem
approach (D'Amato et al. 2018). Maintaining a permanent cover and uneven-aged structure allows the
natural dynamics of regeneration to be maintained through the accumulation of woody biomass and the
development of a complex structure with various tree ages and sizes (Rogers et al. 2018). Forest
management that aims to simulate the natural disturbance regime also promotes the presence and
maintenance of taxonomic groups that are sensitive to abrupt changes in abiotic conditions (e.g., large-
seeded spring geophytes, with poor dispersal; Aubin et al. 2007; Paillet et al. 2010; Duguid and Ashton
2013) in highly diverse vascular plant, moss and lichen communities (Hart and Grissino-Mayer 2009;
Hilmers et al. 2018).
Page 3/35To date, the relationships between understory plant community diversity, soil properties, and the intensity
of canopy and soil disturbances remain unclear. In the short-term, hardwood forests that are disturbed by
logging tend to have higher species richness than unmanaged forests, but exhibit a lower degree of
heterogeneity (Falk et al. 2008; Markgraf et al. 2020). This response is particularly due to the
establishment of competitive pioneer species that specialize in openings within communities that are
composed primarily of species that are associated with late-successional forests (Archambault et al.
1998; Naaf and Wulf 2007; Moola and Vasseur 2008). During ecological succession, the coexistence of
pioneer and late-successional species is generally considered to be transient, i.e., lasting less than 20
years (Moola and Vasseur 2008). However, for a given disturbance, the functional traits of competitive
pioneer species and their spatio-temporal capacities to exploit available resources may allow them to
remain in the community for longer term and, ultimately, slow down successional trajectories (Roxburgh
et al. 2004; Wyatt and Silman 2010). Few studies have investigated this phenomenon in the medium-term
(~ 20 years after cutting). Thus, it is important to verify whether the intensification of silvicultural
treatments contributes both to longer persistence of these competitive species and to the decrease in
structural and functional heterogeneity of understory plant communities, or whether it allows a
convergence of plant communities towards the attributes of unmanaged forests (Paillet et al. 2010;
Duguid and Ashton 2013).
A set of metrics covering taxonomic and functional diversity was selected to capture different
dimensions of the response of plant communities to silvicultural treatments (Mayfield et al. 2010). The
taxonomic approach can detect the presence of rare species, but its indicators have low analytical power
to characterize biodiversity and the effects of disturbance on ecosystem functions (Daly et al. 2018; Willis
and Martin 2020). Consequently, substantial variations in understory plant diversity not only remain very
difficult to measure, but also difficult to predict along a disturbance intensity gradient on the basis of
species richness alone, for example, using meta-analyses (Gilliam and Roberts 1995; Elliott and Knoepp
2005; Paillet et al. 2010; Duguid and Ashton 2013; Nolet et al. 2018). In contrast, the functional approach
provides more information on the processes of species responses to biotic and abiotic conditions (Aubin
et al. 2007; Lavorel et al. 2007). The study of diversity according to these components thus permits a
more detailed understanding to be gained regarding ecological processes and understory dynamics
within disturbed systems (Hooper et al. 2005; Cadotte et al. 2011).
The objective of this study was to assess medium-term effects of different regeneration processes on soil
properties and on the specific and functional composition of understory plant communities in temperate
hardwood forests. We hypothesized that short-term effects of silvicultural treatments on soil properties
and understory plant communities persist in the medium-term (i.e., 20 years after treatment); the
magnitude of these effects would be proportional to the intensity of both forest canopy and soil
disturbance. We measured soil chemical properties (pH, total C and N, extractable P, exchangeable bases),
together with several indices and metrics of understory plant community diversity, in six experimental
sites that had been established primarily in yellow birch-sugar maple (Acer saccharum Marsh.) and
yellow birch-balsam fir (Abies balsamea (L.) Mill.) stands in southern Quebec, Canada. We compared a
gradient of disturbance intensity treatments: 1) single-tree selection cutting; 2) group-selection cuts; and
Page 4/353) group-selection cuts with soil scarification, to reference condition, i.e. control forests with no
silvicultural treatment known for ≥ 80 years.
Materials And Methods
Study sites and experimental layouts
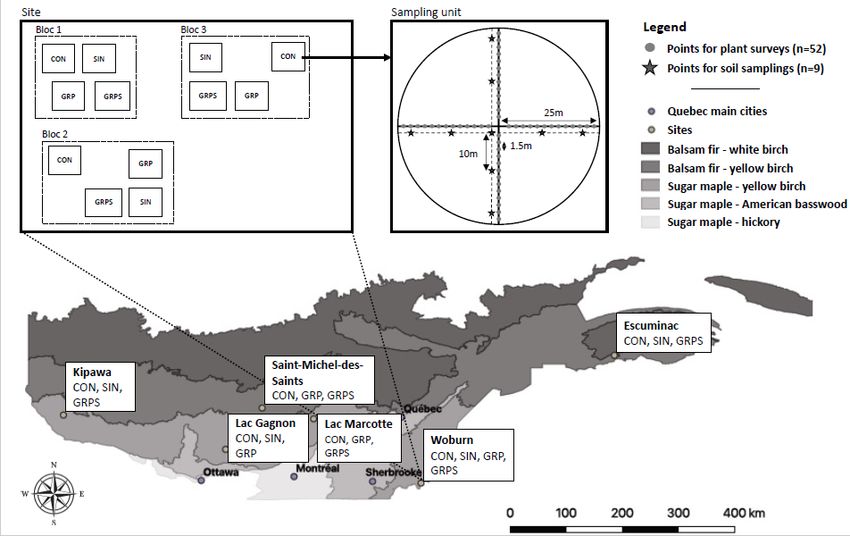
Six experimental sites were selected within the Great Lakes-St. Lawrence Forest Region (Rowe 1972) of
southern Quebec, Canada, along a longitudinal gradient (Fig. 1) that covered different climatic and
edaphic conditions (Table 1). Five sites are located in the yellow birch-sugar maple bioclimatic domain
(Saucier et al. 2009), where the latter two species dominated the canopy, with contributions of American
beech (Fagus grandifolia Ehrh.), American basswood (Tilia americana L.), and hophornbeam or ironwood
(Ostrya virginiana [Mill.] K.Koch). Site six is located in the yellow birch-fir bioclimatic domain.
Consequently, it is dominated by balsam fir and yellow birch, with contributions from trembling aspen
(Populus tremuloides Michx.), paper or white birch (Betula papyrifera Marsh.), and white spruce (Picea
glauca [Moench] Voss). The creation of small canopy gaps following tree senescence and death is
characteristic of the domain’s natural disturbance regime, with occasional larger scale disturbances such
as windthrows and freezing rain (Runkle 1985). Soils that have developed on the sites are Brunisols and
Podzols (Soil Classification Working Group 1998; 7th Approximation: Inceptisols and Spodosols).
Legend: The experimental have a surface area of 1962.5 m2 comprising 52 floristic inventory points and
9 soil sampling points distributed along the four inventory transects. CON: controls; SIN: single-tree
selection cuts; GRP: group-selection cuts; GRPS: group-selection cuts with scarification).
The sites were selected with the aim of comparing Control Forest that was not logged for at least 80
years (CON, n = 21) to three levels of disturbance intensity stemming from the following regeneration
treatments. 1) Single-tree Selection Cuts exemplified shelterwood cutting (SIN, n = 13), with the goal of
removing about 30% of average basal area. 2) Group-Selection Cuts (GRP, n = 15) resulted in openings
ranging in area from 1500 m2 to 2500 m2. 3) Group-Selection Cuts with Scarification (GRPS, n = 17)
created areas that are equivalent to those of GRPs, with the addition of soil disturbance (Table 1).
Scarification of the Lac Marcotte and Saint-Michel-des-Saints sites was carried out immediately after
GRP using a harrow. At Escuminac, Kipawa and Woburn, scarification was carried out the year following
the cut using a mechanical shovel, thereby creating an average 400 pits (ca. 2 x 3 m) per hectare. We
have assumed that the two scarification treatments that were considered in this study both generated
substantially greater disturbance to the soil and herbaceous layer compared to the unscarified portions.
We therefore combined these two scarification approaches into a single treatment for subsequent
statistical analyses. Each site consisted of 3–6 randomized complete blocks in which three to four
regeneration treatments were compared (Table 1).
Page 5/35Table 1
Environmental, ecological and edaphic characteristics of the study sites that were located in southern
Quebec, Canada.
Municipality ZEC Lac Gagnon Saint- Lac Marcotte Woburn Escuminac
Kipawa (Papineau- Michel- (Mastigouche
Labelle Wildlife des- Wildlife
Reserve) Saints Reserve)
Latitude 46°52'N 46°06'N 47°01'N 46°77'N 45°21'N 48°09'N
Longitude 78°42'W 75°08'W 74°20'W 73°11'W 70°48'W 66°31'W
Mean 2.7 4.6 3.1 4.1 3.9 4.0
annual
temperature
(°C)
Annual 956 1090 933 1070 1367 951
precipitation
(mm)
Ecological YBSM YBSM (west) YBSM YBSM (east) YBSM YBBF
type 1 (sub- (west) (west) (east)
domain)
Sand (%) 53 57 53 38 53 21
Clay (%) 5 33 37 9 38 57
pH (2:1 4.5 (0.2) 4.9 (0.3) 4.5 (0.2) 4.7 (0.2) 4.7 (0.2) 4.7 (0.2)
soil:water) 2
Treatments CON, CON, SIN, GRP CON, CON, GRP, GRPS CON, CON, SIN,
3 SIN, GRP, SIN, GRPS
GRPS GRPS GRP,
GRPS
Number of 3 6 6 3 3 3
blocks
Year of 2001 2006 2000 1998 1997 1999
cutting
Year of 2002 -- 2000 1998 1998 2000
scarification
1
Ecological type: YBSM, yellow birch-sugar maple domain, YBBF, yellow birch-fir domain.
2
The value in parentheses is the standard deviation.
3
Treatments: CON is the control, SIN corresponds to single-tree selection cut, GRP corresponds to
group-selection cut, and GRPS corresponds to group-selection cut with scarification.
Understory vegetation inventories
Page 6/35From the end of June to mid-August 2019, herbs, ferns and woody plants up to 2 m in height (i.e., the
understory vegetation) were inventoried in the 66 experimental plots of the study. We did not count spring
ephemerals, such as Erythronium americanum (trout lily). All individuals were identified to species using
the identification key for vascular plants of the Flore Laurentienne (Marie-Victorin et al. 2002). Given the
difficulty of identifying taxa at the vegetative stage in both the genus Carex genus and the family
Poaceae, they were respectively grouped under Carex spp. and Poaceae spp. Taxonomic nomenclature
was standardized according to the Database of Vascular Plants of Canada (VASCAN;
https://data.canadensys.net/vascan).
Each experimental plot (Fig. 1) covered an area of 1962.5 m2 and included 52 inventory points, each with
a radius of 15 cm, and separated by 1.5 m. These were systematically distributed along four 25 m
transects following Aubin et al. (2007). We assigned an occurrence value of 1 for each species that was
present at an inventory point, with a maximum value of 52 for that same species within an experimental
plot. Species present in the plot, yet never encountered at any of the 52 inventory points were scored 0.5
to account for the total species richness of the plot. The total number of recorded occurrences provides
an estimate of species abundance. We considered the relative occurrence (F, as %) of a species within a
plot by dividing its occurrence value by 52.
Environmental performance traits
The environmental performance traits (sensu Violle et al 2007) that were used in the study had been
obtained from the TOPIC database (Aubin et al. 2020). These were selected for the analyses because of
their links with competitive abilities (biological type) and potential for colonization following disturbance
(reproductive mode, shade tolerance; Table 2).
Table 2
Individual environmental performance traits that were included in the analysis.
Trait Description of trait
Biological Qualitative variable: evergreen, deciduous, shrub, bush, sporophyte, monocot,
type graminaceae, asterales, other herbaceous plant.
Reproductive Qualitative variable: mainly asexual, mainly sexual, asexual and sexual.
mode
Shade Qualitative variable: shade-intolerant, intermediate tolerance, shade-tolerant
tolerance
Soil sampling and laboratory analyses
We collected a composite sample of the organic (FH) and mineral (0-20 cm) soil horizons in each
experimental plot. Cores (8 cm dia.) were taken at nine sampling points and bulked for each of the plot
(Fig. 1). Organic horizon (FH) thickness (cm) was also measured at the nine sampling points. Samples
were air-dried and sieved to pass a 2 mm mesh. Bulk pH was measured using a soil:distilled water ratio
Page 7/35of 1:2 for mineral soil and 1:10 for organic soil (Hendershot et al. 2008). Total nitrogen (N) and carbon (C)
concentrations were measured by high-temperature combustion (1450 °C) followed respectively by
infrared detection (C) and by thermal conductivity (N) on a TruMac CNS analyzer (LECO, St. Joseph, MI,
USA). Phosphorus (P) concentrations were determined colorimetrically (as molybdate blue) on Mehlich III
soil extracts (Zidia and Tran 2008) with a flow-injection analyzer (Lachat Instruments, Milwaukee, WI,
USA). Exchangeable base (Ca, Mg, K, Al) concentrations were measured on BaCl2 (0.1 M) soil extracts by
atomic absorption spectrophotometry (Varian 220 FS, Agilent Technologies, Palo Alto, CA, USA) (Tran and
Simard 2008).
Data analyses
Soil properties response to treatment
The effects of silvicultural treatments on each soil property were measured using random-effects
generalised linear mixed models (glmm), where sites and blocks that were nested within sites were
considered as random effects and silvicultural treatments were treated as fixed effects.
PERMANOVA was also used to assess the variance partitioning of the set of soil properties and tests of
their multivariate means among treatments were determined by permutational multivariate analysis of
variance (PERMANOVA, Anderson 2017). PERMANOVA (with 999 permutations) tested the effects of
silvicultural treatments, sites and their interaction, while constraining permutations within blocks to
reproduce random effects.
Relationships between soil properties and plant communities
Relationships between soil properties and plant community composition and understory species
distributions were analyzed using redundancy analysis (dbRDA) that employed Sorensen's index for
distance matrix creation (Peres-Neto et al. 2006; Legendre et al. 2009). For this purpose, species that were
present in less than 10% of the plots were excluded, given that rare species provides only limited
information regarding habitat preferences and factors influencing co-occurrence between species (Azeria
et al. 2012).
Taxonomic response to treatment
To assess the effects of the different treatments on the understory plant community, we first tested the
response of potentially sensitive and potentially recalcitrant species. Among the species in present in our
dataset, eight were identified in the literature as being potentially sensitive to soil and canopy disturbance
in temperate forests ecosystems: Dryopteris carthusiana (Vill.) H.P. Fuchs (= D. spinulosa [O.F. Muell.] O.
Kuntze), Athyrium filix-femina (L.) Roth, Lycopodium spp., Oxalis acetosella ssp. montana (Raf.) Hultén
ex Löve, Coptis trifolia Salisb., Monotropa uniflora L., Circaea alpina L., and Cypripedium acaule Aiton
(Haeussler et al. 2002; Moola and Vasseur 2004; Flinn 2007). Other species that are known to be
sensitive, such as spring geophytes (e.g., Trillium spp., Streptopus lanceolatus (Aiton) Reveal [= S.
Page 8/35roseus Michx.]; Aubin et al. 2007) and orchids (e.g., Goodyera spp.; Turcotte 2008), had too low relative
occurrence to be considered in the analysis. Six other species have been identified in the literature as
potentially recalcitrant and competitive with commercial woody and late-successional species in eastern
Canada (Jobidon 1995; Bell et al. 2011): Acer spicatum L., Corylus cornuta Marshall, Populus tremuloides
Michaux, Prunus pensylvanica L.f., Pteridium aquilinum (L.) Kuhn, and Rubus idaeus L. We tested the
differences in relative occurrence between different silvicultural treatments for potentially susceptible and
potentially recalcitrant species using one-way ANOVA with permutations (n = 999) (Borcard et al. 2011;
Anderson 2017). Post hoc multiple comparisons with t-tests were performed to separate the treatments.
When a significant difference was observed, Bonferroni correction was applied to the P-value.
Several univariate measures of alpha diversity were calculated to account for the distributions and
patterns of species within understory plant communities. 1) Species richness (S) was measured as the
number of species that were present in each plot. 2) The Shannon index or information measure (H')
combined species richness (S) and equitability (E) using the geometric mean of proportional abundances
of i species (pi) in the respective communities, which was calculated as: H' = - ∑Si pi ln pi (Shannon
1948). 3) The "effective number" of species (i.e., true diversity) was calculated from the Shannon entropy
exponent formula: 1D = e(H') (Jost 2006). 4) The equitability index (E) was calculated according to the
formula: E = 1D/S (Tuomisto 2010). Effects of silvicultural treatments on alpha diversity indices were
analyzed using random-effects generalized linear mixed models (glmm) that were equivalent to those
used for soil properties.
Functional response to treatment
In order to compare the functional diversity between different silvicultural treatments, we first calculated
the functional dispersion index (Fdis; Laliberté and Legendre 2010). We also calculated the functional
diversity of each individual trait using the Rao index (Rao 1982), to compare the variation of species traits
composition within the communities. Finally, we determined the community-weighted means (CWM) for
three environmental performance traits, namely 1) biological type, 2) reproductive mode, and 3) shade
tolerance, to compare functional redundancy between silvicultural treatments.
Beta diversity
Beta diversity was measured to quantify the extent of heterogeneity between plots within the same
silvicultural treatment, between plots of different treatments, and between sites (Appendix A). Within a
treatment, beta diversity (Bwithin_Treat) was calculated as the alpha diversity (1D) that was measured at the
plot level, divided by the average 1D, which was calculated for each of the three plots in the treatment
(Anderson et al. 2011; Royer-Tardif et al. 2018). To compare beta diversity between regeneration
treatments, we considered Bbetween_Treat to be the multivariate dispersion of vegetation composition
(Anderson et al. 2011) by calculating the average distance to the centroid for all plots within a treatment.
To compare beta diversity between sites for each treatment, we considered Bbetween_Site as the
multivariate dispersion of vegetation composition by calculating the average distance between centroids
Page 9/35of sites for the same treatment. Both distance calculations were based on the Euclidean distance matrix
corresponding to distance to centroid (dcen) (Anderson et al. 2011).
Species composition patterns
We assessed compositional differences between regeneration treatments using PERMANOVA (based on
999 permutations; Anderson 2017) based on distance matrices that were calculated from Hellinger
distances. PERMANOVA tested for differences in species assemblages among silvicultural treatments
and among sites, together with their interaction (Treatments x Sites). When significant differences were
detected for the interaction and main effects, we performed multiple comparison tests; P-values were
adjusted using the Holm-Bonferroni sequential method. A significant result that is obtained by
PERMANOVA may originate from mean differences in species assemblages between the treatments, may
indicate differences in variation within treatments (i.e., heterogeneity in multivariate scatter within
groups), or may be a combination of both. To provide the appropriate interpretation of significant results,
we used the function PERMDISP to test the homogeneity of the multivariate spread. PERMDISP is a
permutation-based multivariate extension of Levene’s test of homogeneity of variance (Anderson 2017).
When these tests detected significant differences, we used the function TukeyHSD() to perform pairwise
means comparisons of the different regeneration treatments.
We used a measure of multivariate functional dispersion
(FDis; Lalibert é and Legendre 2010) to compare trait
diversity between baseline and future conditions using data
on all traits simultaneously. FDis calculates the average
distance of individual species to their group centroid in
multivariate trait space that has been defi ned by an appropri-
ate distance measure. Tighter clustering of species in multi-
variate trait space corresponds to lower functional diversity
and thus lower FDis values. Although a range of functional
diversity indices exist we chose FDis because, unlike other
techniques, it is largely unaff ected by species richness
(sample size).
We used a measure of multivariate functional dispersion
Page 10/35(FDis; Lalibert é and Legendre 2010) to compare trait
diversity between baseline and future conditions using data
on all traits simultaneously. FDis calculates the average
distance of individual species to their group centroid in
multivariate trait space that has been defi ned by an appropri-
ate distance measure. Tighter clustering of species in multi-
variate trait space corresponds to lower functional diversity
and thus lower FDis values. Although a range of functional
diversity indices exist we chose FDis because, unlike other
techniques, it is largely unaff ected by species richness
(sample size
The random effects mixed models were performed with the function glmmTMB() in the
glmmTMB package (Brooks et al. 2017). Tukey post hoc tests for generalized linear random effects
models were performed with the functions TukeyHSD() or glht() from the multcomp package (Hothorn et
al. 2008). Hellinger transformations were performed with the function decostand(); multivariate
dispersion analyses were performed with betadisper(); and centroid positions were tested with adonis2().
All of these functions are from the vegan package (Oksanen et al. 2017). Beta diversity partitioning was
performed with the function beta.pair() from the betapart package (Baselga 2010, 2012). All statistical
analyses were performed in R (R version 3.5.2; R Core Team 2017).
Results
Effects of silvicultural treatments on soil properties
According to the multivariate variation-partitioning test (PERMANOVA), site location explained a
significant portion of the variation in soil properties (R2 = 0.36, P < 0.001). Treatments alone had a small
but significant effect on variation in these properties (R2 = 0.05, P = 0.039) (Table 3). Multiple comparison
tests showed no significant differences in soil properties between each pair of silvicultural treatments
(Table 4).
Page 11/35Table 3
Multivariate variation partitioning (PERMANOVA) of soil properties, species assemblage and biological
type assemblage across regeneration treatments, sites and their interaction.
Soil properties Species assemblage Biological type assemblage
Source R2 P R2 P R2 P
Treatments 0.05 0.039 0.07 < 0.001 0.10 < 0.001
Sites 0.36 < 0.001 0.44 < 0.001 0.35 < 0.001
Treatments * Sites 0.08 0.848 0.10 0.046 0.13 0.050
Error 0.50 0.39 0.42
Results that are significant at α = 0.05 are shown in bold.
Table 4
Multiple comparisons (Tukey HSD tests) among regeneration treatments, according to variation in soil
properties, species assemblage and biological types.
Soil properties Species assemblage Biological type assemblage
Pairs P P adjusted P P adjusted P P adjusted
CON vs SIN 0.070 0.420 0.442 1.000 0.212 1.000
CON vs GRP 0.584 1.000 0.133 0.798 0.030 0.180
CON vs GRPS 0.588 1.000 0.008 0.048 0.004 0.024
SIN vs GRP 0.068 0.408 0.261 1.000 0.156 0.936
SIN vs GRPS 0.212 1.000 0.012 0.072 0.018 0.108
GRP vs GRPS 0.951 1.000 0.164 0.984 0.295 1.000
CON: controls; SIN: single-tree selection cut; GRP: group-selection cut; GRPS: group-selection cut with
scarification.
Univariate analyses of the effect of treatments on each of the soil properties revealed significant
differences between treatments for FH horizon thickness, C/N ratio and K content in the organic horizon
and P content in the mineral horizon (Table 5). FH-horizon thickness in CON was significantly higher
(almost two-fold) than in the GRPS. C/N ratio of the organic horizon in the control stands were higher
than in the GRPS. In the mineral horizon, P content of the GRPs was three times higher than in the CON.
Page 12/35Table 5
Soil properties of the organic and mineral horizons, as a function of regeneration treatment.
Property Control Single-Tree Group- Group-Selection Cut with
Selection Selection Cut scarification
Organic FH 9.0 (7.5) a 7.4 (5.4) ab 6.6 (4.7) ab 4.9 (3.8) b
thickness
(cm)
pH 4.6 (0.6) 4.5 (0.5) 4.8 (0.4) 4.7 (0.4)
C (%) 34.9 30.8 (11.5) 32.0 (11.6) 28.5 (9.7)
(14.6)
N (%) 1.7 (0.7) 1.6 (0.5) 1.8 (0.6) 1.6 (0.5)
C/N 19.8 (4.1) 19.4 (3.9) ab 17.6 (1.7) ab 17.7 (3.8) b
a
P (mg·kg− 1) 33.6 26.9 (21.7) 27.1 (17.7) 30.0 (22.6)
(27.0)
K (mg·kg− 1) 325.3 217.5 (271.4) 244.4 (146.3) 257.0 (144.0)
(261.1)
Ca (mg·kg− 2008.1 2323.1 2176.8 2159.9 (1317.0)
1) (1362.3) (1622.3) (1434.9)
Mg (mg·kg− 222.8 251.9 (79.9) 284.0 (237.3) 231.1 (140.9)
1 (134.4)
)
Al (mg·kg− 1007.0 977.1 (608.0) 920.9 (626.0) 1169.6 (605.5)
1 (856.7)
)
Mineral pH 4.6 (0.2) 4.8 (0.3) 4.6 (0.2) 4.6 (0.2)
C (%) 4.9 (2.1) 3.3 (1.2) 5.0 (1.7) 4.5 (2.3)
N (%) 0.30 0.21 (0.08) 0.30 (0.10) 0.28 (0.15)
(0.15)
C/N 16.8 (4.4) 16.8 (4.7) 16.6 (2.3) 16.7 (5.0)
P (mg·kg− 1) 5.3 (3.4) b 8.6 (13.4) ab 15.6 (19.2) a 13.8 (19.4) ab
K (mg·kg− 1) 46.0 49.0 (20.2) 41.2 (19.5) 39.2 (15.1)
(18.8)
Ca (mg·kg− 159.5 274.1 (248.3) 213.0 (170.4) 174.1 (212.3)
1) (165.2)
Mg (mg·kg− 22.3 31.2 (17.7) 25.8 (27.5) 22.3 (26.5)
1 (16.6)
)
Page 13/35Property Control Single-Tree Group- Group-Selection Cut with
Selection Selection Cut scarification
Al (mg·kg− 1902.2 1600.0 1951.7 1925.0 (329.4)
1) (423.0) (397.5) (476.8)
Values in parentheses are standard deviations of the means. Within rows, mean values followed by the
same boldface letter do not differ significantly at P = 0.05 (Tukey tests).
Relationship between soil properties and plant
communities
Redundancy analysis showed that soil properties were significantly associated with the composition and
distribution of understorey plant communities (P < 0.001; Fig. 2). The set of soil properties that we
measured explained 36% of variation in the specific assemblage of understory plant communities (R2adj
= 0.359, P < 0.001).
Soil properties alone explained 30% of the variation in the assemblage of biological types (R2adj = 0.304,
P < 0.001). RDA ordination and Pearson correlation test show the positive relationships between the
presence of conifers and increasing C/N ratio of the organic horizon (Pearson r = 0.60, P < 0.001), and
decreasing soil pH in the organic (r = 0.46, P < 0.001) and mineral (r = 0.33, P < 0.001) horizons.
Legend: Sample treatments are indicated by symbols (CON: controls; SIN: single-tree selection cut; GRP:
group-selection cut; GRPS: group-selection cut with scarification), explanatory variables by arrows.
Percentage variance explained along each axis corresponds to R2.
Effects of silvicultural treatments on the alpha diversity of
plant communities
A total of 149 species were identified in the floristic surveys. We counted an average 30 species in the
CON plots, 31 species in SIN plots, 34 species in GRP plots, and 34 species in the GRPS plots. Species
richness in GRPs and GRPSs was higher than in CON plots (P = 0.005, Fig. 3). Equitability (E) in CON and
SIN was higher than in GRPS (P < 0.001). True diversity (1D) did not differ among regeneration
treatments.
Legend: CON: controls; SIN: single-tree selection cut; GRP: group-selection cut; GRPS: group-selection cut
with scarification. Means with different letters significantly differ following pairwise Tukey's tests (P <
0.05). Box-and-whisker plots in each panel display 25th and 75th percentiles (the inter-quartile range from
the lower and upper edges of the box), the horizontal lines within boxes indicate the 50th percentiles
(medians), and bullets within boxes indicate means; whiskers below and above boxes indicate 10th and
90th percentiles, respectively, beyond which dots indicate outliers (values > 1.5 x IQR).
Effects of silvicultural treatments on taxonomic and
functional metrics
Page 14/35Increasing the intensity of silvicultural treatments significantly affected species richness (S) and relative
occurrence (F) of functional categories that were related to biological type, shade tolerance and
reproductive mode (Table 6). GRPS increased species richness and relative occurrence, i.e., functional
redundancy, of shrubs compared to the other treatments (P < 0.05). The relative occurrence of grasses in
GRPs and GRPSs was higher than in CON and SIN. Species richness of exclusively vegetatively
reproducing and shade-intolerant species in GRPs and GRPSs was higher than in CONs and SINs.
Richness of species with both modes of reproduction (i.e., sexual and vegetative reproduction) and the
relative occurrence of shade-intolerant species in GRPs was higher than in SINs. We did not observe any
differences among treatments in terms of overall functional diversity (Fdis) (Fig. 3) or functional diversity
for each environmental performance trait (Rao index) (Table 6).
Page 15/35Table 6
Functional diversity (Rao index), mean species richness (S) and mean relative occurrence (F) of
environmental performance traits as a function of regeneration treatments.
Biological type Index CON SIN GRP GRPS
Functional diversity Rao 0.40 0.41 0.41 0.42
Evergreen S 1.7 (1.0) 1.5 (1.1) 1.4 (0.9) 1.3 (1.3)
F 0.34 (0.25) 0.31 (0.22) 0.28 (0.30) 0.27 (0.32)
Deciduous S 3.2 (0.8) 3.2 (0.9) 3.8 (0.9) 3.5 (1.3)
F 0.46 (0.33) 0.46 (0.45) 0.54 (0.33) 0.50 (0.33)
Shrubs S 5.2 (1.7) 4.3 (1.4) 5.7 (1.9) 6.0 (1.9)
F 0.43 (0.27) 0.36 (0.25) 0.48 (0.29) 0.50 (0.28)
Bushes S 1.3 (0.9) b 1.8 (0.9) b 1.7 (1.0) b 2.1 (0.9) a
F 0.33 (0.23) b 0.44 (0.29) b 0.43 (0,.5) b 0.53 (0.28) a
Asterales S 1.3 (0.9) 1.1 (1.1) 1.6 (1.1) 1.1 (0.8)
F 0.32 (0.25) 0.27 (0.18) 0.40 (0.26) 0.28 (0.22)
Graminaceae S 0.9 (0.8) b 0.8 (0.8) b 1.3 (0.6) b 1.6 (0.6) a
F 0.45 (0.24) b 0.42 (0.16) b 0.63 (0.42) a 0.79 (0.12) a
Monocots S 4.5 (1.6) 4.2 (1.6) 4.3 (1.7) 4.9 (1.6)
F 0.50 (0.27) 0.54 (0.26) 0.48 (0.26) 0.55 (0.34)
Sporophytes S 4.1 (1.6) 3.4 (1.5) 4.5 (1.6) 4.9 (1.6)
F 0.37 (0.28) 0.32 (0.26) 0.41 (0.27) 0.45 (0.27)
Other flowering plants S 5.5 (2.9) 6.6 (2.1) 6.2 (2.0) 6.3 (1.9)
F 0.26 (0.25) 0.32 (0.25) 0.30 (0.25) 0.30 (0.28)
Reproductive mode
Functional diversity Rao 0.33 0.34 0.34 0.33
Vegetative S 14.3 (4.1) b 15.3 (2.9) b 15.4 (3.2) b 16.6 (2.0) a
F 0.36 (0.27) 0.38 (0.28) 0.39 (0.29) 0.41 (0.33)
Sexual & vegetative S 10.0 (2.2) ab 9.3 (2.4) b 11.8 (2.6) a 12.7 (3.5) a
F 0.41 (0.28) 0.38 (0.29) 0.47 (0.26) 0.48 (0.25)
Sexual S 2.5 (0.7) 2.2 (1.3) 2.6 (1.0) 2.7 (1.1)
Page 16/35Biological type Index CON SIN GRP GRPS
F 0.31 (0.18) 0.27 (0.15) 0.33 (0.25) 0.32 (0.29)
Shade tolerance
Functional diversity Rao 0.30 0.28 0.32 0.32
Shade-intolerant S 1.0 (1.3) b 0.6 (0.9) b 2.0 (1.1) a 2.5 (1.3) a
F 0.15 (0.09) ab 0.09 (0.09) b 0.29 (0.18) ab 0.35 (0.20) a
Intermediate tolerance S 6.9 (1.9) 6.9 (2.6) 7.5 (2.2) 8.1 (2.0)
F 0.34 (0.25) 0.34 (0.26) 0.37 (0.27) 0.41 (0.27)
Shade-tolerant S 19.8 (5.3) 20.2 (4.6) 21.1 (4.9) 21.2 (3.1)
F 0.41 (0.27) 0.42 (0.27) 0.44 (0.29) 0.44 (0.32)
Values in parentheses are standard deviations of the means. With rows, means followed by the same
letter do not differ significantly at α = 0.05 according to pairwise Tukey’s tests. CON: control; SIN: single-
tree selection cut; GRP: group-selection cut; GRPS: group-selection cut with scarification.
Effects of silvicultural treatments on sensitive vs
competitive species
Intensification of silvicultural treatments resulted in a significant decrease in the relative occurrences of
the sensitive species toothed wood fern (Dryopteris spinulosa; P = 0.0154) and ghost pipe (Monotropa
uniflora; P = 0.0016), together with a marginally significant decrease for northern wood sorrel (Oxalis
acetosella ssp. montana; P = 0.085) in GRPS compared to the other silvicultural treatments (Table 7).
Of the six potentially recalcitrant species, intensified disturbances of the canopy and soil had a
significant effect on the relative occurrence of pin cherry (Prunus pensylvanica) and raspberry (Rubus
idaeus). These two species occurred more frequently in the GRP and GRPS treatments compared to SIN
and CON (Table 7).
Page 17/35Table 7
Taxon-specific responses of potentially sensitive and potentially recalcitrant species to
regeneration treatments.
Relative occurrence ANOVA
CON SIN GRP GRPS p-value
Sensitive
Athyrium filix-femina 1.12 0.55 1.11 1.27 0.7947
Circeae alpina 0.37 0.23 0.26 0.06 0.7173
Coptis trifolia 4.96 6.52 3.69 2.65 0.5869
Cypripedium acaule 0.64 0.70 0.59 0.18 0.6244
Dryopteris spinulosa 31.46 27.94 26.28 11.03 0.0154
Lycopodium spp. 1.97 1.20 1.66 1.09 0.8245
Monotropa uniflora 0.42 0.47 0.58 0.13 0.0016
Oxalis acetosella ssp. montana 15.40 9.61 11.79 6.01 0.0849
Recalcitrant
Acer spicatum 25.41 29.27 27.51 21.15 0.6159
Corylus cornuta 5.52 5.32 5.14 6.71 0.9206
Populus tremuloides 0.05 0.01 0.36 0.44 0.1056
Prunus pensylvanica 0.04 0.29 2.24 3.56 0.0441
Pteridium aquilinum 1.25 1.20 0.40 0.42 0.6335
Rubus idaeus 0.41 0.44 3.52 2.83 0.0370
Mean relative occurrence values (%) are presented and two-way permutation ANOVA p-values. Significant
treatment effects are represented by a P-value in bold (P < 0.05). Within rows, means followed by the
same letter do not differ significantly from one another at α = 0.05 according to pairwise Tukey’s tests.
CON: controls; SIN: single-tree selection cut; GRP: group-selection cut; GRPS: group-selection cut with
scarification.
Effects of silvicultural treatments on beta diversity of plant
communities
Silvicultural treatments explained less variation in the understorey plant species assemblage and
biological types than did the site location (Table 3). The interaction between regeneration treatments and
sites was also significant. Based on the two-way comparison of treatments, species assemblage (P =
Page 18/350.048) and biological type assemblage (P = 0.024) in the control forests differed from those in the GRPS
(Table 4). Silvicultural treatments did not significantly affect beta diversity between silvicultural
treatments (P = 0.10). Nevertheless, beta diversity between silvicultural treatments in CON and SIN tended
to be higher than in GRP and GRPS (Fig. 4). Silvicultural treatments had a significant effect on beta
diversity between sites (P = 0.018). Beta diversity between sites in CON and SIN was higher than in GRPS
(Fig. 4).
Legend: Beta diversity among sites as a function of treatments (Bbetween_Sites) are plotted as mean
Euclidean distances between centroids for the same treatments and (b) beta diversity among
regeneration treatments (Bbetween_Treat) are plotted as Euclidean distances to the centoid as a function of
the regeneration treatments. CON: controls; SIN: single-tree selection cut; GRP: group-selection cut; GRPS:
group-selection cut with scarification.
Discussion
Effects of silvicultural treatments on soil properties
First of all, the silvicultural treatments considered in our study had more limited longer term effects on
soil properties than we had anticipated although other studies have shown medium-term recovery of soil
chemical properties following forest harvesting and scarification treatments (Hope 2007). However, in our
high intensity treatment (GRPS), substantial decrease in FH-horizon thickness, C/N ratio and
exchangeable K were still observed 20 years after treatment compared to control forests. This decrease
can be attributed to the extraction of forest biomass and subsequently lower inputs of fresh litter (Saint-
Laurent et al. 2000; Thiffault et al. 2011; Clarke et al. 2015), higher litter decomposition rates from early
successional species (i.e., with lower C/N ratios) compared to late-stage species (Kazakou et al. 2009),
and the burial of surface organic matter in the soil mineral horizon (Henneb et al. 2019). In addition, an
increase in light availability and soil temperature in the short- term following GRPS can enhance rates of
decomposition and C-mineralization in the soil organic horizon (Nieminen 2004; Bekele et al. 2007;
Diochon et al. 2009). Our results indicate that high-intensity silvicultural treatments in temperate
hardwood forests can leave a legacy effect on soils that persists in the medium-term, especially in the
surface horizon. Other studies suggest that it may take several decades for soil properties to recover from
the effects of high-intensity silvicultural treatments (Prest et al. 2014; Zhou et al. 2015; Bowd et al. 2019).
However, we found site location to explain more of the variation in soil properties than did silvicultural
treatments, which has been observed in other studies (e.g., Heuvelink and Webster 2001; Nave et al.
2010). Indeed, soil properties are largely influenced by natural inter-site variability in surface deposits, and
biotic and abiotic conditions that are associated with regional and local variation in climate and
microclimate, together with vegetation type, and the phenological and phenotypic characteristics of the
most abundant species (Walmsley et al. 2009; Jang et al. 2016).
Page 19/35Relationships between soil properties and understorey plant
communities
Our results show that much of the variability in understory plant community composition is associated
with variation in soil properties between sites. For example, we observed that sites with a more coniferous
understory were associated with higher C/N ratios in the organic horizon and lower pH values in the
organic and mineral horizons. Lower pH can limit activity of the soil microflora and fauna, leading to
lower rates of litter decomposition, thereby resulting in increased organic soil accumulation and C/N
ratios (Sinsabaugh et al. 2008). Such changes in edaphic conditions and the presence of feedback
processes between soil nutrients and the above- and belowground parts of decomposing plants can
markedly alter the plant composition of the understory (Hobbie 2015; Zhang et al. 2016). Indeed,
understory plant communities are very sensitive to the nature of surface deposits, texture, horizon
thickness, pH, and nutrient availability (Haeussler et al. 2002; Vockenhuber et al. 2011).
Furthermore, different taxonomic groups respond differently to edaphic changes that result from
silvicultural treatments (Paillet et al. 2010). For example, the shrub and grass groups are associated with
lower C/N ratios and thinner organic horizons in intensively disturbed forests, whereas the sporophyte
group and some forbs (e.g., genus Pyrola, Goldthread [Coptis trifolia]) were mainly found in control
forests with a thicker FH-horizon. These species are known to favour stable edaphic conditions and a
dense cover of mature trees with increased litterfall in the autumn (Vockenhuber et al. 2011; Márialigeti et
al. 2016).
Effects of silvicultural treatments on understory plant
community composition
Species richness of understory plant communities in the more intense treatments (i.e., GRP and GRPS)
was slightly, but significantly, higher than in the control forests. The increase in the intensity of soil and
canopy disturbance would have led to an increase in resource availability (e.g. light, nutrients), especially
for early successional species (Keenan and Kimmins 1993; Wardle et al. 2003), which may have favoured
the presence of a greater number of species (Deconchat and Balent 2001; Hilmers et al. 2018). At the
same time, species richness and composition in the SIN were similar to those in the CON forests. These
results accord with other studies that have measured negligible effects of single-tree section cuts on both
environmental conditions and understory plant diversity (Smith et al. 2008; Raymond et al. 2018).
The species equitability index in the GRPSs was lower than in the CON and SIN forests, indicating
dominance of certain species in the GRPSs. Soil scarification treatments are frequently given little
consideration from a biodiversity conservation perspective (Duguid et al. 2013), particularly in the boreal
forest where the combination of high soil and canopy disturbance can have negative effects on the
abundance of species that are known to be sensitive to habitat change (e.g., epiphytic bryophytes,
lichens) (Bergstedt et al. 2008; Caners et al. 2013; Venier et al. 2015). Open and disturbed environments
mainly favour pioneer species (Clavel et al. 2011; Tullus et al. 2018), which benefit from an ability to
Page 20/35initiate efficient differential physiological responses through a wide range of functional trait values (Violle
et al. 2007; Mayfield et al. 2010). Thus, we observed higher relative occurrence values in GRP and GRPS
for early successional species, but also identified the latter as being recalcitrant from the literature (e.g.,
Rubus spp, pin cherry (Prunus pensylvanica)) (Jobidon 1995; Royo and Carson 2006), 20 years after the
most intensive silvicultural treatments, compared to control forests and SINs. Furthermore, although the
dominance of pioneer species following the intensification of forest disturbances is likely to disappear
over time (Bergeron et al. 2014; Yeboah et al. 2016), it is known that soil disturbances generated by
scarification or forest harvesting activities can lead to species dominance effects and a time lag in the
recovery and recolonisation processes of species adapted to natural forests (Bergstedt et al. 2008).
Finally, although the presence of shade-intolerant and competitive pioneer species is not at the expense
of late-successional species requiring more stable environmental conditions, severe soil disturbance may
constrain dispersal and recruitment processes for the regeneration of forest interior species, thereby
favouring the longer-term persistence of competitive and vegetatively reproducing pioneer species
through interspecific competition and exclusion processes (Aschehoug et al. 2016).
Effects of silvicultural treatments on the beta diversity of
understory plant communities
The combination of edaphic and microclimatic conditions within a bioclimatic region that undergoes the
natural disturbance regime would generate a region-specific assemblage of indicator species. This
assemblage is involved in maintaining beta diversity between geographically distant sites at the
landscape scale (Vellend 2010; Saucier et al. 2010). Although control forests and SINs in our study had
fewer understory species on average, they were associated with higher beta diversity between sites
compared to GRPS, indicating more heterogeneous plant communities across forests and sites. Several
studies have attributed similar results to increased resource heterogeneity and understory structural
diversity in unevenly managed and control forests (i.e., SINs) compared to the most disturbed forests,
which may favour the development of biotic homogenization processes (Falk et al. 2008; Brewer et al.
2012; Markgraf et al. 2020). However, other studies have shown limitations to uneven-aged management
that initiates only small disturbances, including lack of early successional habitats and landscape-scale
homogenisation of stand structure and composition (Werner and Raffa 2000; Decocq et al. 2004; Angers
et al. 2005). Furthermore, heavy canopy and soil disturbances, although less frequent in the natural
disturbance regime within temperate hardwood forests (Runkle 1985), may allow specific regeneration
needs to be met and favour the presence of pioneer plant species important for biodiversity (Swanson et
al. 2011).
Finally, plant communities are sensitive to intense silvicultural disturbance and ecosystem-based
management that is characterized by a low-level intensity of canopy and soil disturbance (Schall et al.
2017). In both cases, biotic homogenization can occur at the landscape scale and steer ecological
successional processes towards either predominantly juvenile or old growth communities (Angers et al.
2005; Kern et al. 2017; Schall et al. 2017). In this sense, silvicultural management needs to find a balance
Page 21/35at the landscape scale that allows for both light and moderate disturbances while drawing on natural
dynamics.
Conclusions
Our results suggest that, in temperate hardwood forests, there is a legacy of high-intensity silvicultural
treatments on soil properties, particularly in the surface horizon. This legacy, in turn, can affect the
composition and diversity of understory plant communities. The most intense silvicultural treatments
(i.e., GRP and GRPS) not only resulted in slight increased species richness in the medium-term, but also a
decrease in understory plant community heterogeneity. The most intense silvicultural treatments resulted
in an increased relative occurrence of shade-intolerant, mainly vegetatively reproducing species
adaptated to disturbed environments. These treatments contributed to the persistence of competitive
potentially recalcitrant species which coud compete with commercial species and and alter plant
community composition. Among the studied treatments, single-tree selection cutting (SIN) appeared to be
the most appropriate silvicultural treatment for maintaining soil functions and understory plant
communities of unmanaged forests. On the other side, more intense treatments favored species adapted
to a wider range of environmental conditions, including open environments. Therefore, at the landscape
level, the guarantee of maintaining the highest biodiversity of plant communities will lie in the search for
adequate spatial representativeness of the different silvicultural treatments by considering the functions
of the species that they favor over the long term.
Abbreviations
Al: Aluminium; Bbetween_Site: Beta diversity between sites; Bbetween_Treat: Beta diversity between treatments;
C: Carbon; Ca; Calcium; C/N: Carbon/Nitrate ratio; CON: Control forests with no silvicultural treatments for
at least 80 years; CWM: Community weighted mean; dcen: Distance to the centroid; E: Evenness; F:
Relative occurrence; Fdis: Functionnal dispersion; FH: Fibro-humic horizon; GRP: Group-selection cutting;
GRPS: Group-selection cutting with scarification; H’: Shannon index; K: Potassium; N: Nitrate; P:
Phosphore; S: Species richness; SIN: Single-tree selection cutting.
Declarations
Acknowledgments
We would like to thank Hélène Lalande and Eve-Marie Hébert for their technical assistance. Thanks to the
Canadian Trait Network and Laura Boisvert-Marsh to make the functional trait data available. Dr. William
F.J. Parsons revised the English.
Funding
This research was made possible through the financial support of MFFP (Ministère de la faune, des forêts
et des parcs du Québec).
Page 22/35Availability of data and materials
Data are available from the corresponding author on request.
Ethics approval and consent to participate
The subject has no ethic risk.
Consent for publication
Not applicable.
Competing interests
The authors declare no conflict of interest. The funders had no role in the design of the study; in the
collection, analyses, or interpretation of data; in the writing of the manuscript, or in the decision to publish
the results.
Authors' contributions
R.J, S.D. and D.R. developed the idea; R.J. collected and analyzed the data, and wrote the first draft of the
manuscript; S.D., I.A., G.J., P.R. and D.R. contributed critically to the drafts and approved the final
manuscript.
References
1. Anderson MJ (2017) Permutational Multivariate Analysis of Variance (PERMANOVA). Statistics
Reference Online, Wiley StatsRef
2. Anderson MJ, Crist TO, Chase JM, Vellend M, Inouye BD, Freestone AL, Inouye BD, Freestone AL,
Sanders NJ, Cornell HV, Comita LS, Davies KF, Harrison SP, Kraft NJB, Stegen JC, Swenson NG (2011)
Navigating the multiple meanings of β diversity: a roadmap for the practicing ecologist. Ecol Let
14(1):19–28. https://doi.org/10.1111/j.1461-0248.2010.01552.x
3. Angers AA, Messier C, Beaudet M, Leduc A (2005) Comparing composition and structure in old-
growth and harvested (selection and diameter-limit cuts) northern hardwood stands in Quebec. For
Ecol Manag 217:275–293. https://doi.org/10.1016/j.foreco.2005.06.008
4. Archambault L, Morissette JL, Bernier-Cardou M (1998) Forest succession over a 20-year period
following clearcutting in balsam fir-yellow birch ecosystems of eastern Quebec, Canada. For Ecol
Manage 102:61–74. https://doi.org/10.1016/S0378-1127(97)00109-6
5. Aschehoug ET, Brooker R, Atwater DZ, Maron JL, Callaway RM (2016) The mechanisms and
consequences of interspecific competition among plants. Annu Rev Ecol Evol Syst 47(1):263–281.
https://doi.org/10.1146/annurev-ecolsys-121415-032123
Page 23/356. Aubin I, Gachet S, Messier C, Bouchard A (2007) How resilient are northern hardwood forests to
human disturbance? An evaluation using a plant functional group approach. Ecoscience 14(2):259–
271. https://doi.org/10.2980/1195-6860(2007)14[259:hranhf]2.0.co;2
7. Aubin I, Cardou F, Boisvert-Marsh L, Strukelj M, Munson A (2020) Managing data locally to answer
global-scale questions in ecology: the role of collaborative science. J Veg Sci 31(3):509–517.
https://doi.org/10.1111/jvs.12864
8. Aussenac G (2000) Interactions between forest stands and microclimate: Ecophysiological aspects
and consequences for silviculture. Ann For Sci 57(3):287–301.
https://doi.org/10.1051/forest:2000119
9. Azeria ET, Ibarzabal J, Hébert C (2012) Effects of habitat characteristics and interspecific interactions
on co-occurrence patterns of saproxylic beetles breeding in tree boles after forest fire: null model
analyses. Oecologia 168:1123–1135. https://doi.org/10.1007/s00442-011-2180-0
10. Baselga A (2010) Partitioning the turnover and nestedness components of beta diversity. Glob Ecol
Biogeogr 19:134–143. https://doi.org/10.1111/j.1466-8238.2009.00490.x
11. Baselga A (2012) The relationship between species replacement, dissimilarity derived from
nestedness, and nestedness. Glob Ecol Biogeogr 21:1223–1232. https://doi.org/10.1111/j.1466-
8238.2011.00756.x
12. Bekele A, Kellman L, Beltrami H (2007) Soil profile CO2 concentrations in forested and clear cut sites
in Nova Scotia, Canada. For Ecol Manage 242(2):587–597.
https://doi.org/10.1016/j.foreco.2007.01.088
13. Bergeron Y, Chen HYH, Kenkel NC, Leduc AL, Macdonald SE (2014) Boreal mixedwood stand
dynamics: Ecological processes underlying multiple pathways. For Chron 90(02):202–213.
https://doi.org/10.5558/tfc2014-039
14. Bergstedt J, Hagner M, Milberg P (2008) Effects on vegetation composition of a modified forest
harvesting and propagation method compared with clear-cutting, scarification and planting. Appl
Veg Sci 11(2):159–168. https://doi.org/10.3170/2007-7-18343
15. Borcard D, Gillet F, Legendre P (2011) Numerical Ecology with R. Springer, New York
16. Bowd EJ, Banks SC, Strong CL, Lindenmayer DB (2019) Long-term impacts of wildfire and logging on
forest soils. Nat Geosci 12:113–118
17. Brewer J, Bertz C, Cannon J, Chesser J, Maynard E (2012) Do natural disturbances or the forestry
practices that follow them convert forests to early-successional communities? Ecol Appl 22(2):442–
458. https://doi.org/10.1890/11-0386.1
18. Brockerhoff EG, Jactel H, Parrotta JA (2008) Plantation forests and biodiversity: oxymoron or
opportunity? Biodivers Conserv 17:925–951
19. Brooks ME, Kristensen K, van Benthem KJ, Magnusson A, Berg CW, Nielsen A, Skaug HJ, Maechler M,
Bolker BM (2017) glmmTMB balances speed and flexibility among packages for zero-inflated
generalized linear mixed modeling. R J 9(2):378–400. https://journal.r-project.org/archive/2017/RJ-
2017-066/index.html
Page 24/35You can also read