Ultraviolet radiation modelling from ground-based and satellite measurements on Reunion Island, southern tropics
←
→
Page content transcription
If your browser does not render page correctly, please read the page content below
Atmos. Chem. Phys., 18, 227–246, 2018
https://doi.org/10.5194/acp-18-227-2018
© Author(s) 2018. This work is distributed under
the Creative Commons Attribution 4.0 License.

Ultraviolet radiation modelling from ground-based and satellite
measurements on Reunion Island, southern tropics
Kévin Lamy1 , Thierry Portafaix1 , Colette Brogniez2 , Sophie Godin-Beekmann3 , Hassan Bencherif1,4 ,
Béatrice Morel5 , Andrea Pazmino3 , Jean Marc Metzger6 , Frédérique Auriol2 , Christine Deroo2 , Valentin Duflot1 ,
Philippe Goloub2 , and Charles N. Long7
1 LACy,  Laboratoire de l’Atmosphère et des Cyclones (UMR 8105 CNRS, Université de La Réunion,
Météo-France), Saint-Denis, Reunion Island, France
2 Laboratoire d’Optique Atmosphérique (LOA), Université Lille 1 Sciences et Technologies, Villeneuve d’Ascq, France
3 Laboratoire Atmosphères, Milieux, Observations Spatiales, Service d’Aéronomie (LATMOS), CNRS,

Institut Pierre Simon Laplace, Pierre et Marie Curie University, Paris, France
4 School of Chemistry and Physics, University of KwaZulu Natal, Durban, South Africa
5 Laboratoire d’Energétique, d’Electronique et Procédés (LE2P), Université de la Réunion,

Saint-Denis, Reunion Island, France
6 Observatoire des Sciences de l’Univers Réunion (OSU-R), UMS 3365, Université de la Réunion,

Saint-Denis, Reunion Island, France
7 National Oceanographic and Atmospheric Administration, Earth System Research Laboratory, Boulder, Colorado, USA

Correspondence: Kévin Lamy (kevin.lamy@univ-reunion.fr)

Received: 20 June 2017 – Discussion started: 24 July 2017
Revised: 30 October 2017 – Accepted: 9 November 2017 – Published: 9 January 2018

Abstract. Surface ultraviolet radiation (SUR) is not an in-       the same latitude or at midlatitudes. Ground-based measure-
creasing concern after the implementation of the Montreal         ments of SUR have been taken on Reunion Island by a Ben-
Protocol and the recovery of the ozone layer (Morgenstern         tham DTMc300 spectroradiometer since 2009. This instru-
et al., 2008). However, large uncertainties remain in the pre-    ment is affiliated with the Network for the Detection of At-
diction of future changes of SUR (Bais et al., 2015). Several     mospheric Composition Change (NDACC). In order to quan-
studies pointed out that UV-B impacts the biosphere (Erick-       tify the future evolution of SUR in the tropics, it is necessary
son et al., 2015), especially the aquatic system, which plays a   to validate a model against present observations. This study is
central part in the biogeochemical cycle (Hader et al., 2007).    designed to be a preliminary parametric and sensitivity study
It can affect phytoplankton productivity (Smith and Cullen,       of SUR modelling in the tropics.
1995). This influence can result in either positive or negative      We developed a local parameterisation using the Tropo-
feedback on climate (Zepp et al., 2007).                          spheric Ultraviolet and Visible Model (TUV; Madronich,
   Global circulation model simulations predict an accelera-      1993) and compared the output of TUV to multiple years of
tion of the Brewer-Dobson circulation over the next century       Bentham spectral measurements. This comparison started in
(Butchart, 2014), which would lead to a decrease in ozone         early 2009 and continued until 2016.
levels in the tropics and an enhancement at higher latitudes         Only clear-sky SUR was modelled, so we needed to sort
(Hegglin and Shepherd, 2009). Reunion Island is located in        out the clear-sky measurements. We used two methods to de-
the tropics (21◦ S, 55◦ E), in a part of the world where the      tect cloudy conditions: the first was based on an observer’s
amount of ozone in the ozone column is naturally low. In          hourly report on the sky cover, while the second was based on
addition, this island is mountainous and the marine atmo-         applying Long and Ackerman (2000)’s algorithm to broad-
sphere is often clean with low aerosol concentrations. Thus,      band pyranometer data to obtain the cloud fraction and then
measurements show much higher SUR than at other sites at          discriminating clear-sky windows on SUR measurements.

Published by Copernicus Publications on behalf of the European Geosciences Union.
228                       K. Lamy et al.: Ultraviolet radiation modelling from ground-based and satellite measurements

Long et al. (2006)’s algorithm, with the co-located pyra-          activities. Sunburn risks among children and outdoor work-
nometer data, gave better results for clear-sky filtering than     ers were evaluated on Reunion Island and in South Africa.
the observer’s report.                                             High values of cumulative daily ambient solar UV radiation
   Multiple model inputs were tested to evaluate the model         were found for the three sites studied (Wright et al., 2013).
sensitivity to different parameters such as total ozone               Total solar irradiance at the top of the atmosphere is, of
column, aerosol optical properties, extraterrestrial spec-         course, the source of surface UV radiation. Its intensity varies
trum or ozone cross section. For total column ozone, we            directly with sun radiative intensity. The sun has an 11-year
used ground-based measurements from the SAOZ (Sys-                 solar cycle period (Willson and Hudson, 1991) which has a
tème d’Analyse par Observation Zénithale) spectrometer             direct influence on total solar irradiance at the top of the at-
and satellite measurements from the OMI and SBUV in-               mosphere. Total solar irradiance at the top of the atmosphere
struments, while ozone profiles were derived from radio-           is also modulated by the variation in Earth’s orbital param-
soundings and the MLS ozone product. Aerosol optical prop-         eters, which should be taken into account in very long-term
erties came from a local aerosol climatology established us-       climate studies but can be neglected in multi-decadal studies
ing a Cimel photometer. Since the mean difference between          such as ours.
various inputs of total ozone column was small, the corre-            SUR is attenuated by absorbing and scattering processes
sponding response on UVI modelling was also quite small, at        in the atmosphere from the top of the atmosphere to the sur-
about 1 %. The radiative amplification factor of total ozone       face. By investigating SUR variability from 1 year of ground-
column on UVI was also compared for observations and the           based measurements, McKenzie et al. (1991) showed that the
model. Finally, we were able to estimate UVI on Reunion Is-        dominant variation of SUR was linked to SZA, while atten-
land with, at best, a mean relative difference of about 0.5 %,     uation by clouds could exceed 50 % and a total ozone col-
compared to clear-sky observations.                                umn reduction of 1 % could induce an increase in SUR of
                                                                   1.25 ± 0.20 %.
                                                                      Due to the depletion of the ozone layer by human-made
                                                                   halogenated substances and the significant impact of ozone
1   Introduction                                                   on climate change, a major observing programme was set
                                                                   up to monitor atmospheric ozone in the last decades. The
Ozone recovery prevented a significant increase in SUR level       latest assessment of the state of the ozone layer (WMO,
(e.g Morgenstern et al., 2008; van Dijk et al., 2013; New-         2014) reported the end of the stratospheric ozone decline
man et al., 2009... ). However, large uncertainties remain         since the end of the 1990s, with a stabilisation of ozone lev-
in the prediction of the future changes of SUR (Bais et al.,       els at about 2 % below those observed in the early 1980s.
2015). Overexposure to this radiation is the main cause of         However, global circulation model simulations predict an ac-
the development of non-melanoma and melanoma skin can-             celeration of the Brewer-Dobson circulation over the next
cers. Non-melanoma skin cancer is induced by chronic ex-           century (Butchart, 2014), which would lead to a decrease in
posure and melanoma is induced by repeated burning and             ozone levels in the tropics and an enhancement at higher lati-
chronic exposure (Matsumura and Ananthaswamy, 2004).               tudes (Hegglin and Shepherd, 2009). Clouds and aerosols are
Holick et al. (1980) studied the beneficial effect of UV radi-     also being intensively investigated, given their role in the cli-
ation on health through the synthesis of pre-vitamin D and         mate energy budget and the fact that their radiative forcing
numerous studies have assessed the balance between ben-            remains the main uncertainty for climate studies (Boucher
efits and risks. McKenzie et al. (2009) looked at the rela-        et al., 2013). They also are the main uncertainty factors
tion between erythemal-weighted UV (McKinlay and Dif-              in the future projections of the solar UV irradiance (Bais
fey, 1987) and vitamin-D-weighted UV (MacLaughlin et al.,          et al., 2015). Global maps of UV-absorbing aerosols were de-
1982). This work showed that, during summer at midlati-            rived by Herman et al. (1997). Later Krzyścin and Puchalski
tudes, vitamin D can be produced in a few minutes while            (1998) showed that a 10 % decrease in aerosol optical thick-
avoiding the skin damage that occurs after an hour of expo-        ness (AOT) at 550 nm induced a ∼ 1.5 % increase in UV ery-
sure; of course this depends on the skin area exposed. Be-         themal daily dose. More recently Kazadzis et al. (2009) in-
havioural studies have also been conducted in order to un-         vestigated the aerosol forcing efficiency in the UVA region,
derstand human activities in relation to UV intensity. Par-        between 325nm and 340nm and found a mean reduction of
ticipating in outdoor sports activities without sufficient solar   irradiance of 15.2 % per unit of AOT slant column at 340 nm
protection has been shown to increase the risk of develop-         during autumn. Correa et al. (2013) looked at the influence of
ing skin lesions in childhood (Mahé et al., 2011). Tourism in      aerosol properties on projected changes in clear-sky erythe-
northern midlatitude cities in summer can also present a non-      mal UV doses throughout the 21st century. It has been shown
negligible risk of skin cancer (Mahé et al., 2013). UV expo-       that clouds usually reduce SUR variability (Bais et al., 1993;
sure and sun-protective practices during childhood were also       Calbó et al., 2005), but broken clouds can also enhance it
investigated in New Zealand (Wright et al., 2007), and differ-     under specific conditions (Mayer et al., 1998).
ences in children’s exposure were explained by their different

Atmos. Chem. Phys., 18, 227–246, 2018                                                 www.atmos-chem-phys.net/18/227/2018/
K. Lamy et al.: Ultraviolet radiation modelling from ground-based and satellite measurements                                 229

   Those three time-evolving parameters being important          blow onto the mountain. There is a strong contrast between
sources of variability of UV radiation, we need to better un-    the east and west sides of the island, because the accumula-
derstand their effects on surface UV. Radiative transfer mod-    tion of clouds leads to more precipitation on the east coast,
elling plays a key role in deducing UV evolution over the        while the west coast is mostly dry.
next century, but it needs to take into account a fair projec-      Surface UV measurements show a very high UV index
tion of those parameters. Climate models associated with ra-     compared to other sites at the same latitude (Lee-Taylor
diative transfer models or empirical methods have been used      et al., 2010). Aerosol optical thickness shows a mean value
to assess SUR evolution over the coming century. Bais et al.     of ∼ 0.07 at 440 nm, with an occasional maximum at ∼ 0.3.
(2011) and McKenzie et al. (2011) respectively found de-         These multiple conditions – mountainous, tropical island
creases of 12 and 20 % in UVI at high latitude, 3 to 5 % at      with low aerosol concentrations – makes Reunion Island an
midlatitudes and increases of 1 to 3 % in the tropics. These     interesting site for studying surface UV radiation. Since the
projections depend strongly on the evolution of future cli-      island presents a very high UVI, and the population lives at
mate, and Butler et al. (2016) presented the complexities as-    low to relatively high altitudes, the highest cities being lo-
sociated with future ozone change and therefore surface UV       cated at about 1.5 km a.s.l., surface UV radiation is a signif-
change.                                                          icant health concern. Note that the time zone of the site is
   The ultraviolet index (UVI) (WHO, 2002) is one of the         UTC + 04:00.
most common parameters used to investigate the impact of            In Sect. 2, we will first present the different data and the
SUR on human health. It is the weighted integral of the ul-      radiative transfer model used in this study. As discussed pre-
traviolet irradiance between 280 and 400 nm, with the weight     viously, clouds are an important factor of UV variability and,
depending on the human skin’s response to erythema de-           since clouds are not well resolved in the radiative transfer
termined by McKinlay and Diffey (1987). UVI modelling            model, we chose to work only on clear-sky UVI modelling
was investigated thoroughly by Badosa et al. (2007), who         here. The data sets used in this study will also be presented.
tested multiple inputs and compared the results to obser-           In Sect. 3, we will address the filtering method used to se-
vations at four different sites (Lauder, 45.04◦ S; Boulder,      lect only UVI observations for clear-sky conditions with the
40.01◦ N; Mauna Loa, 19.53◦ N; and Melbourne, 37.63◦ S).         use of broadband pyranometer global and diffuse solar irra-
They found mean relative differences in UVI between the          diances and Long et al. (2006) algorithm. A brief comparison
model and observations ranging from 10 % to less than 0.1 %.     will be made with a human observer’s report on cloud cover-
   Following these studies, the present work tries to improve    age.
the understanding of surface UV variability in the southern         In Sect. 4, we will discuss the radiative transfer model sen-
tropical region, a sensitive area where very few studies have    sitivity to various input parameters. Multiple modelling cases
been conducted. This article is intended to improve surface      were run using different ozone and aerosol data at the time
UV modelling by analysing the model sensitivity to differ-       of the UV measurements and with different input ozone cross
ent inputs. Six years of ground surface UV measurements          sections and solar irradiance spectra at the top of the atmo-
made with a Bentham DTMc300 spectroradiometer are anal-          sphere. The impact on the UVI modelled will be analysed.
ysed in comparison to ozone, cloud and aerosol data derived         In Sect. 5, the model will be validated against the clear-sky
from ground and satellite measurements spanning the same         UVI observations on Reunion Island. We will investigate the
time period. As discussed previously, climate model simu-        model’s ability to reproduce diurnal and seasonal variation
lations predict a decrease in ozone levels in the tropics and    of UVI, and its ability to reproduce the effect of total ozone
their enhancement at higher latitudes. This study is designed    column (TO3 ) variation on UVI. Lastly we will discuss the
to establish a fine parameterisation of UVI modelling in the     results and draw some conclusions. A glossary of all abbre-
tropics in order to later couple radiative transfer modelling    viated terms is available as a Supplement.
and a chemistry climate model to obtain precise UVI projec-
tions.
   Reunion Island is a small tropical island located in the      2   Data sets
Indian Ocean at a latitude of 20.90◦ S and a longitude of
55.50◦ E. This island is very mountainous with a peak at         The multiple types of measurements used in this study, as in-
3070 m a.s.l. and a mean altitude of ∼ 600 m a.s.l.. Almost      put for the radiative transfer model or as reference to validate
all of the ground measurements were made at Reunion Is-          the model output, are summarised in Table 1.
land University, which is situated in the north of the island       UVI measurements were taken with a Bentham DTMc300
at an altitude of 80.0 m and less than 2 km from the coast.      spectroradiometer affiliated with NDACC. This spectrora-
The atmosphere in the boundary layer is dominated by the         diometer is composed of two monochromators and scans the
ocean and is often clean with low aerosol concentration. The     wavelength range of 280–450 nm. According to Brogniez
usual weather follows a typical pattern during the day due to    et al. (2016), Bentham DTMc300 UVI measurements have
the trade winds: the sky is usually free of clouds at sunrise,   an expected uncertainty of about 5 % for a coverage factor of
but clouds start to appear during the day as the trade winds     2. Recalibration is made every 3 to 4 months with a 150 W

www.atmos-chem-phys.net/18/227/2018/                                                 Atmos. Chem. Phys., 18, 227–246, 2018
230                              K. Lamy et al.: Ultraviolet radiation modelling from ground-based and satellite measurements

Table 1. Data sets.

 Data                                            Instrument            Location             Frequency             Contact (PI)       Affiliation
 UV index (UV spectrum integrated fol-           Bentham               Saint-Denis          dt = 15 min           C. Brogniez        LOAa (Lille, France)
 lowing McKinlay and Diffey, 1987)               DM300                 Réunion Island       dw = 0.5 nm
                                                                       University           [280–450 nm]
 Aerosol optical thickness at 340 nm             Cimel Sunpho-         Saint-Denis          Daily mean            P. Goloub          LOAa (Lille, France)
 (AOT)                                           tometer               Réunion Island
 Single-scattering albedo at 438 nm                                    University
 (SSA)
 Ångström exponent at 340–440 nm (α)
 Cloud                                           Observer report       Saint-Denis          dt = 1 h              F. Bonnardot       MFb (Saint-Denis)
                                                                       Gillot
 Global and diffuse total irradiance             SPN1                  Saint-Denis          dt = 1 min            B. Morel           LE2Pc (Saint-Denis)
                                                 Shaded Pyra-          Réunion Island                             P. Jeanty
                                                 nometer               University
 Total ozone column                              SAOZ                  Saint-Denis          Daily                 A. Pazmino         LATMOS (Paris, France)
 (TO3 )                                                                Réunion Island                             T.Portafaix        LACye (Saint-Denis)
                                                                       University
                                                 SBUV2                 Satellite            Daily overpass        Richard            NASA
                                                                                                                  McPeters
                                                 OMI-DOAS              Satellite            Daily overpass        P. Veefkind        KNMI (Netherlands)
 Total nitrogen dioxide column                   SAOZ                  Saint-Denis          Daily                 A. Pazmino         LATMOSd (Paris, France)
 (TNO2 )                                                               Réunion Island                             T.Portafaix        LACye (Saint-Denis)
                                                                       University
 Ozone and temperature profiles                  Ozone sonde           Saint-Denis          Weekly                F. Posny           LACye (Saint-Denis)
                                                                       Réunion Island                                                Réunion Island University
                                                                       University
                                                 MLS                   Satellite            Daily overpass        L. Froidevaux      NASA-JPL
a LOA: Laboratoire d’Optique Atmosphérique. b MF: Météo France. c LE2P: Laboratoire d’Energétique, d’Electronique et Procédé. d LATMOS: Laboratoire Atmosphères,
Milieux, Observations Spatiales. e LACy: Laboratoire de l’Atmosphère et des Cyclones.

lamp and a 1000 W quartz tungsten halogen lamp traceable to                             Several data sets are available of ozone cross sections
National Institute of Standards and Technology. In this study,                        (O3XS) absorption:
we used the standard erythemal action spectrum published
by the International Commission on Illumination to calcu-                                – Malicet et al. (1995) and Brion et al. (1998) (BDM)
late erythemal-weighted UV (Commission Internationale de                                   works are currently used for SBUV instruments:
l’Eclairage, 1998). Simulation experiments under clear-sky                                     – 280–345 nm at 295, 243, 228 and 218 K from Mal-
conditions were conducted over the time period covered by                                        icet et al. (1995).
SUR measurements, i.e. from 2009 to 2015. The data used in
                                                                                               – 345–450 nm at 195 K from Brion et al. (1998).
this study for modelling are described below.
   TO3 measurements are as follows:                                                      – Bass and Paur (1985) (BP) are used currently for
                                                                                           OMTO3.
   – ground-based measurements from the SAOZ (Système
     d’Analyse par Observation Zenithal) (Pommereau and                                  – Gorshelev et al. (2014) and Serdyuchenko et al. (2014)
     Goutail, 1988) UV-visible spectrometer collocated with                                obtained high spectral resolution ozone absorption cross
     the Bentham,                                                                          sections (called SER hereafter) from a combination of
                                                                                           Fourier transform and Echelle spectrometers. Measure-
   – satellite measurements from OMI (OMTO3 product)
                                                                                           ments, data analysis and comparisons are presented in
     and SBUV (Bhartia and Wellemeyer, 2002).
                                                                                           the first paper (Gorshelev et al., 2014), and temperature
   Extraterrestrial solar spectra (ETS) were obtained from                                 dependence is investigated throughout the second paper
                                                                                           (Serdyuchenko et al., 2014).
   – Chance and Kurucz (2010),
                                                                                         Orphal et al. (2016) published a recent report on the evalu-
   – Dobber et al. (2008).                                                            ation of different absorption cross sections of ozone. They

Atmos. Chem. Phys., 18, 227–246, 2018                                                                         www.atmos-chem-phys.net/18/227/2018/
K. Lamy et al.: Ultraviolet radiation modelling from ground-based and satellite measurements 231
found that BP data should no longer be used for retrieval
of atmosphere ozone measurements. Either BDM or SER
should be used in ground-based or satellite retrieval. These
findings led us to choose BDM and SER O3XS in our cur-
rent study.
Ozone and temperature profiles came from radio-
Cloud fraction
soundings that have been taken weekly on Reunion Island
UV index
since 1993, and from MLS satellite measurements (Froide-
vaux et al., 2008). Nitrogen dioxide measurements were ob-
tained with the SAOZ spectrometer. Aerosol measurements
were derived from Cimel sun photometer measurements be-
tween 2009 and 2016. Cloud observer reports were made on
Reunion Island every hour at about 10 km north of the UVI
measurements, while global and diffuse total irradiance were
measured every minute at the same location as the UVI mea-
surements.
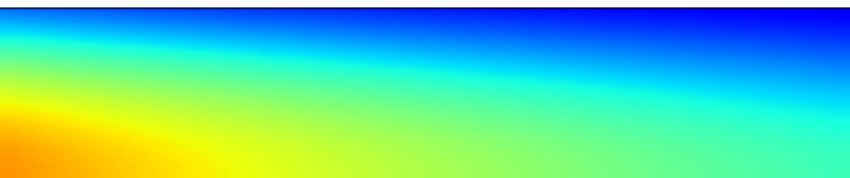
Figure 1. Daily UV index at Reunion Island on 31 December 2010;
3 Clear-sky filtering for UV-ALL Bentham measurements in black circles, UV-SWF:
UV data filtered with CF-SWF in blue circles, UV-SYNOP: UV
data filtered with CF-SYNOP in red circles. Cloud fraction (CF-
Clouds are known to play an important role in surface UV
SWF) is also represented by the blue dashed line.
variability (Bais et al., 1993; Calbó et al., 2005 and Mayer
et al., 1998). As mentioned previously, this study was lim-
ited to clear-sky UV observations and simulations. In order
to filter out cloudy conditions, two different methods were An example of a typical day with varying cloud fractions is
used. The first, commonly used one was based on synoptic represented in Fig. 1. UVI corresponding to all-sky condi-
observer reports (SYNOP) made at a Météo France weather tions (UV-ALL) are marked in black circles. The blue circles
station located about 10 km from the UV measurements site. represent UV-SWF and the red ones UV-SYNOP. CF-SWF
The observer reports follow WMO guidelines for cloud ob- is also represented by the blue dashed line. A clear-sky day
servations (http://worldweather.wmo.int/oktas). Sky obser- would produce a UVI diurnal cycle resembling a Gaussian-
vations are made every hour and are quantified on a scale in shaped function centred on the solar noon, while moderate
oktas from 0 (clear-sky) to 8 (totally overcast sky). We kept to high cloud fractions would generally reduce UVI. In some
only UV measurements made for cloudiness ≤ 1 okta. Since cases, broken cloud conditions may increase UVI by 20 %
the UV measurements are made every 15 min and sky ob- relative to clear-sky conditions (Cede et al., 2002). Early
server reports are hourly, we interpolated these observations in the day, at about 04:00 UTC, both UV-SYNOP and UV-
every 15 min. The effect of interpolation is taken into consid- SWF are absent, as no clear-sky conditions are detected:
eration and analysed below. The second method used Long cloud fraction at that time is quite high and impacts the UVI
and Ackerman (2000) and Long et al. (2006) algorithms. As slightly. At around 09:00 UTC we clearly see the impact of a
input for this algorithm we used 1 min data of global and rising CF on UV-ALL, which rapidly decreases. UV-SWF is
diffuse total irradiances measured at the same location as absent, but CF-SYNOP still labels UV-ALL measurements
the UV measurements, with a SPN1 shaded pyranometer. (UV-SYNOP) as clear-sky while they are clearly not. This
These algorithms performed multiple tests on the global, dif- example, among many others, made us decide to use only
fuse and direct irradiance in order to identify periods of clear UV-SWF for the UVI clear-sky measurements in all further
skies. They have been validated against a whole sky imager, work.
lidar data and observer reports (Long et al., 2006). We then investigated the daily and monthly densities of
In order to compare the two methods, we tried multiple UVI measurements. In Fig. 2a, average UVI data distribu-
thresholds of the cloud fraction for the Cloud Observer Re- tion through the day represents UV-ALL (green bars) and
port (CF-SYNOP) and cloud fraction obtained with the Long UV-SWF (blue bars), along with the mean CF-SWF (black
et al. (2006) algorithm, called CF-SWF hereafter. We consid- dashed line). We can see that UV-ALL is equally distributed
ered that clear-sky conditions prevailed when the cloud frac- through the day, since UVI measurements are made every
tion was less than or equal to the CF-SYNOP or CF-SWF day at 15 min intervals. In contrast, for clear-sky data UV-
thresholds. From these we obtained UVI filtered data, called SWF, there are more measurements available in the morn-
UV-SYNOP and UV-SWF hereafter. ing than in the afternoon, which is anti-correlated with the
We investigated numerous days and found CF-SWF to be mean climatological CF-SWF. As clouds tend to form dur-
more responsive and consistent with the UVI measurements. ing the day, clear-sky UV measurements are less frequent in
www.atmos-chem-phys.net/18/227/2018/ Atmos. Chem. Phys., 18, 227–246, 2018232 K. Lamy et al.: Ultraviolet radiation modelling from ground-based and satellite measurements
UVi diurnal and monthly data distribution
(a) UVi data: daily distribution by hour (b) UVi data: monthly distribution
SWF mean cloud fraction
SWF mean cloud fraction
Mean cloud fraction
Mean cloud fraction
Time of day (UTC)
Figure 2. UVI data distribution and cloud fraction for 1 h bins. UVI-ALL is in green, UVI-SWF is in blue, cloud fraction is indicated by the
dotted line.
the afternoon. In Fig. 2b, which represents UVI data distri- is more accurate (Petropavlovskikh and Brasseur, 1995). N-
bution during the year, we see that UV-ALL are not equally stream discrete ordinates schemes use analytical treatment
distributed. There are fewer UV-ALL data for the first 4 before computation. The radiative transfer equation is de-
months, especially during March and April, due to a few composed into a 2N differential equation. Then, with ap-
failures and technical maintenance of the Bentham spectro- propriate boundary conditions, the system is numerically
radiometer during the 6 years analysed here. We then see a solved for each layer of the atmosphere. No approximation
seasonal variation of the availability of clear-sky UVI mea- is made on the vertical inhomogeneity of the atmosphere or
surements. During the austral summer, there is an increasing on the phase function. Without computational time require-
mean cloud fraction and therefore fewer clear-sky measure- ment, these schemes can have high levels of accuracy. On
ments. Since the solar zenith angle and total ozone column the other hand, 2-stream methods assume an irradiance inde-
also follow a diurnal and annual variability, respectively, the pendent of the azimuth angle and divide it into upward and
uneven clear-sky UVI distribution through the day or through downward components. These approximations induce errors,
the year will induce a statistical bias on the following com- specifically in the lower troposphere and on the diffuse part
parisons. The threshold chosen for the rest of the study is of the irradiance.
one-eighth. There was 85 412 measurements. After clear-sky The following parameters were modified in the model in
filtering only 16 390 remained. order to reproduce the UVI measurements and site-specific
climatology:
4 UV modelling – extraterrestrial spectrum (ETS),
– solar zenith angle (SZA),
4.1 Radiative transfer model
– total ozone column amount (TO3 ),
For UVI modelling, we used the Tropospheric Ultravi-
olet Visible (TUV) radiative transfer model version 5.3 – total nitrogen dioxide (TNO2 ),
(Madronich, 1993). TUV is available with two different ra-
diative transfer schemes. We used the pseudo-spherical 8- – ozone profile (OP),
stream discrete ordinates (psndo.f) (Stamnes et al., 1988)
method to solve the radiative transfer equation. The com- – temperature profile (TP),
putation time is higher than with the generalised 2-stream
method (Toon et al., 1989), also available in TUV, but psndo.f – aerosol optical thickness (AOT) at 340 nm,
Atmos. Chem. Phys., 18, 227–246, 2018 www.atmos-chem-phys.net/18/227/2018/K. Lamy et al.: Ultraviolet radiation modelling from ground-based and satellite measurements 233
– aerosol Ångström exponent (α) between 340 and Table 2. Baseline configuration of the TUV model.
440 nm,
Parameter
– single-scattering albedo (SSA) (Takemura et al., 2002
and Lacagnina et al., 2015; see below for more details), Period 2009–2016
Latitude −20.90
– ground surface albedo (alb), Longitude 55.50
Temporal resolution (dt) 15 min
– altitude (z). Vertical scale 0–80 km
Vertical resolution (dz) 1 km
Due to the lack of reliable data, total column sulfur diox- Wavelength 280–450 nm
ide (TSO2 ) was set to zero, which could induce a modelling Wavelength resolution (dw) 0.5 nm
error during a volcanic eruption. Between 2009 and 2015, Albedo Koelemeijer et al. (2003)
there were a few volcanic eruptions from the Piton de la TNO2 SAOZ
Fournaise, which is located on the opposite coast of Reunion TSO2 0
Cloud fraction 0
Island to the site where the UVI measurements were taken.
OP McPeters and Labow (2012)
Unfortunately there are no TSO2 data available for this pe-
TP McPeters and Labow (2012)
riod. Following McPeters and Labow (2012), a monthly cli- SSA 0.95
matology of ozone and temperature profile was derived from Aerosol profile Elterman (1968)
ozone soundings and MLS satellite measurements. Single-
scattering albedo from the Cimel sun photometer was not us-
able, as Dubovik et al. (2000) showed that SSA has a large (i-RTUV), with constant Earth–Sun distance, total ozone col-
uncertainty if the AOT is lower than 0.3, which was almost umn varying from 250 to 350 DU, solar zenith angle varying
always the case here. As proposed by Lacagnina et al. (2015) from 0 to 60◦ and mean values of aerosol representing the
and Takemura et al. (2002), a fixed SSA of 0.95 was set. The entire study period (see Table 3).
errors due to the use of a standard SSA were not investigated Since we want to understand the sensitivity to the ET
here and should be investigated in the future (Correa et al., spectrum, i-RTUV was run with the Dobber et al. (2008) or
2013). Chance and Kurucz (2010) ET spectrum. From there we took
Following Koelemeijer et al. (2003), surface albedo was UVI output and defined the UVI relative difference (RD) be-
taken to be constant at 0.08. According to Koepke et al. tween these two cases as
(1998), the UVI modelling error is about 5 % for a coverage
UVIdobber − UVIchance
factor of 2. RD[%] = 200 × . (2)
UVIdobber + UVIchance
4.2 Influence of input parameters RD on the surface UVI modelled between the two ET
spectra for the SZA and TO3 studied is represented in a
To study the impact of various inputs on surface UV calcula-
monthly climatological OP and TP in Fig. 4a for January and
tions, we tested multiple inputs from a baseline configuration
in Fig. 4b for October. The highest RD appears to occur for
(Table 2). Then different RTUV (Reunion Tropospheric Ul-
low SZA and low TO3 , at about 5 % for January and about
traviolet) cases were run with only one parameter varying in
4 % for October. Minima of RD are for high SZA and high
each (Table 3).
TO3 , at about 3 and 2 % for January and October, respec-
tively. At fixed TO3 , when SZA increases, the path length
4.2.1 Earth–Sun distance and extra-terrestrial
travelled by the radiation crossing the atmosphere is longer
spectrum
and other processes, such as Rayleigh scattering, have more
In order to take into account the varying Earth–Sun distance impact on the surface UVI modelled than different ET spec-
(ESD, in astronomical unit), a time dependent coefficient tra. At fixed SZA, when TO3 increases, the RD decreases, or
(ESF) is used in TUV: ESF(t) = 1/ESD2 . The new extrater- when ozone molecular absorption increases the differences
restrial spectrum ET0 , which is the spectrum at the top of the in the ET spectra are less important.
atmosphere corrected for any instant of time (it) is then (1): During the month of October, OP shifts from the annual
mean (Fig. 3). There is an increase in tropospheric ozone
ET0 = ESF(it) × ET. (1) through the arrival of emissions due to biomass burning over
the western part of the Indian Ocean zone (Baldy et al.,
For convenience, we will now refer to the corrected ex- 1996). The absorption effectiveness of tropospheric ozone
traterrestrial spectrum simply as ET. The ESD correction is relative to stratospheric ozone depends on SZA (Brühl and
done when RTUV is used for time series studies but, in order Crutzen, 1989). This is why there is a small difference (about
to study the sensitivity to the ET spectrum (or to the O3XS 1 %) between January and October. This difference is only
later in Sect. 4.2.2), we chose to run TUV in an idealised state due to the shift in ozone and temperature profiles.
www.atmos-chem-phys.net/18/227/2018/ Atmos. Chem. Phys., 18, 227–246, 2018234 K. Lamy et al.: Ultraviolet radiation modelling from ground-based and satellite measurements
Table 3. Case configurations.
Case TO3 Aerosols ETS O3 XS ESD
RTUV01 SAOZ Cimel daily Dobber et al. (2008) SER f(t)
RTUV02 OMI Cimel daily Dobber et al. (2008) SER f(t)
RTUV03 SBUV Cimel daily Dobber et al. (2008) SER f(t)
RTUV04 SAOZ Cimel monthly Clim Dobber et al. (2008) SER f(t)
RTUV05 SAOZ Cimel daily Chance and Kurucz (2010) SER f(t)
RTUV06 SAOZ Cimel daily Dobber et al. (2008) BDM f(t)
RTUV07 SAOZ AOT: 0.05 Dobber et al. (2008) SER
SSA: 0.95 esfact = 1
α: 0.90
i-RTUV 250–345 DU AOT: 0.05 Dobber et al. (2008) SER Constant
SSA: 0.95 or or esfact = 1
α: 0.90 Chance and Kurucz (2010) BDM SZA = [0,60]◦
Ozone variability over Reunion Island
(a) (b)
Monthly climatology of total ozone column Ozone mean profile
Total ozone column [DU]
Ozone number density [n(O3) cm–3]
Figure 3. Ozone variability over Reunion Island. (a) Monthly climatology of total ozone column for three data sets (OMI in blue, SAOZ in
green and SBUV in red). (b) Mean ozone profile from McPeters and Labow (2012) climatology. Annual mean in blue, January in green and
October in red.
In Fig. 4c, the monthly mean of UVI RD between ability (about 1 %). RD is modulated through the year with
RTUV05 and RTUV01 is represented by a dashed blue line. the variation of SZA. Finally, Chance’s spectrum impact on
These two RTUV cases have the same configuration except the surface UVI modelled will be an increase of about 3.0 %
for the ET spectrum. The sign of the RD here is coherent with with respect to Dobber’s.
Eq. (2), i.e. RTUV05 (Chance ET) minus RTUV01 (Dobber
ET). The monthly mean of RD between these cases oscil- 4.2.2 Ozone cross sections
lates between 2.7 and 3.4 %, these values being of the same
of order as the i-RTUV cases. The oscillation observed here Following these studies we investigated the impact on simu-
is anti-correlated with the maximum of SZA at solar noon at lated UV irradiance modelled with different absorption cross
the site studied. sections of ozone (O3XS). As mentioned previously we used
To conclude, UVI dependency on the ET spectra is higher BDM and SER and defined the relative difference between
at low SZA and low TO3 , which are also the conditions the two modelling cases as
where we find the maximum of UVI, i.e where the health xBDM − xSER
risk is highest. While the RD is dependent on SZA and TO3 RD[%] = 200 × . (3)
xBDM + xSER
(at about 3.0 %), OP and TP also constitute factors of vari-
Atmos. Chem. Phys., 18, 227–246, 2018 www.atmos-chem-phys.net/18/227/2018/K. Lamy et al.: Ultraviolet radiation modelling from ground-based and satellite measurements 235
(a)
(b)
(c) mean
Figure 4. (a) UVI relative difference between two idealised runs with different ET spectra for a varying TO3 and SZA for a climatological
OP and TP of January. (b) Same as panel (a) but for OP and TP of October. (c) Monthly mean of UVI RD between RTUV05 and RTUV01
(blue dashed line). Monthly mean of SZA at solar noon. (red dashed line).
Figure 5a represents the UVI RD using two different the idealised state, these simulations were conducted with
O3XS (Eq. 3) in an idealised run (i-RTUV) for October OP varying Earth–Sun distance. The relative difference distribu-
and TP climatologies. Here, RD ranges from 2.4 to 2.9 %. tions for TO3 and UVI are represented in Fig. 6 with 1 %
We observe the same variability as for the ET sensitivity: the bins. Mean RD between TO3 data sets is smaller than 0.3 %
highest values of RD correspond to low SZA and low TO3 , with a standard deviation of about 2 %. The impact on the
and as either SZA or TO3 increases, UVI RD will decrease. surface UVI modelled is slightly higher. There is a small
Figure 5b shows the role of the varying Earth–Sun distance mean relative difference of ≈ 0.1 ± 2.3 % between SBUV
by using the corresponding RTUV cases (RTUV06 with and OMTO3, 0.4 ± 2.0 % between SAOZ and OMTO3 and
BDM and RTUV01 with SER), which differ only by O3XS. −0.3 ± 1.8 % between SAOZ and SBUV.
There is also a yearly UVI RD oscillation anti-correlated Since TO3 and surface UVI are anti-correlated, a positive
with the maxima of SZA at solar noon. The mean RD is about RD in TO3 will lead to a negative RD on UVI and vice versa.
2.7 %, which is consistent with the i-RTUV case. The oscil- This is expressed by the opposite sign of the mean RD be-
lation around the annual mean is smaller here than for the ET tween TO3 and UVI and by the RD distribution. If the distri-
spectra (about 0.5 %) but so is the mean RD. bution of RD of TO3 tends to shift towards positive values,
To summarise O3XS for this studied site, using SER the distribution of UVI RD will shift towards negative values.
O3XS instead of BDM O3XS increases the mean surface
UVI by about 2.7 %. This UVI RD is modulated by the SZA, 4.2.4 Aerosol climatology and observations
TO3 , OP and TP.
Aerosol concentrations are usually very low in this region ex-
4.2.3 Total ozone column cept during a specific period of biomass burning or volcanic
eruption. Here the objective is to evaluate the impact of the
Three different TO3 data sets covering the period 2009 to aerosol variability on UVI modelling.
2016 in RTUV01 (SAOZ), RTUV02 (OMTO3) and RTUV03 Figure 7a, b and c represent the monthly climatological
(SBUV) were investigated. In contrast to the simulations in values of AOT, SSA and Ångström exponent provided by
www.atmos-chem-phys.net/18/227/2018/ Atmos. Chem. Phys., 18, 227–246, 2018236 K. Lamy et al.: Ultraviolet radiation modelling from ground-based and satellite measurements
(a)
(b) mean
Figure 5. (a) UVI relative difference between two idealised runs with different O3XS for a varying TO3 and SZA and for climatological OP
and TP of October. (b) Monthly mean of UVI RD between RTUV06 and RTUV01 (blue dashed line). Monthly mean of SZA at solar noon
(red dashed line).
a Cimel instrument. Aerosol optical thicknesses are usually of the year. Most of these anomalies are due to biomass burn-
quite low. There is a peak centred around October. It coin- ing emissions. Figure 7e shows UVI RD between RTUV04
cides with the arrival of biomass burning emissions over the and RTUV01. The succession of AOT anomalies has a direct
western part of the Indian Ocean zone (Baldy et al., 1996). impact on surface UVI; for the 0.25 increase in AOT, dur-
In Fig. 7b, the monthly climatologies of SSA (at 438 nm) de- ing the end of 2010, there is a ≈ 30 % relative difference be-
rived from Cimel measurements are represented. These val- tween the two surface UVI modelled. This is better observed
ues are very uncertain as mentioned previously. Ångström on Fig. 7f and g, which represent the monthly distribution
exponent represents 340–440 nm and describes the spectral of positive AOT anomalies and negative UVI relative dif-
dependence of the AOT. ference split into three categories. Quantitatively more AOT
As aerosol input for UVI modelling, two data sets were anomalies (more than 0.15 AOT daily anomalies) are centred
used in this study, one being a monthly climatology derived around October, which leads to higher values of UVI relative
from the Cimel sun photometer measurements from 2009 to difference.
2016 and hereafter called Cimel Clim, and the other being To summarise the aerosol findings, even though the mean
the daily mean derived from the same instrument and here- relative differences in surface UVI for the two cases are very
after called Cimel daily. RTUV01 was run with Cimel daily low for the entire studied period (−0.40 %), there is still a
and RTUV 04 with Cimel Clim (see Table 3). We define the punctual effect where surface UVI could be overestimated
AOT anomaly as the difference between AOT daily mean and by ∼ 30 % when using aerosol climatology.
monthly climatology:
AOTANOM = AOTCimeldaily − AOTCimelClim . (4)
5 Model validation
Figure 7d represents the aerosol daily anomaly for the
entire study period. We can observe few sharp peaks of a In this section, we compare observations made only in clear-
0.25 AOT anomaly and several decreases to about a 0.1 AOT sky conditions against the different RTUV modelling cases
anomaly. The maximum anomaly usually appears at the end (Table 3).
Atmos. Chem. Phys., 18, 227–246, 2018 www.atmos-chem-phys.net/18/227/2018/K. Lamy et al.: Ultraviolet radiation modelling from ground-based and satellite measurements 237
Relative difference (RD) distribution between data sets
Total ozone column
Mean Mean Mean
UV index
Mean Mean Mean
Figure 6. Distribution of relative difference (%) between different TO3 data sets and between the corresponding surface UVI modelled at all
SZA.
5.1 Radiative amplification factor If we derive the power law we can obtain a linear form of
the RAF (Booth and Madronich, 1994):
To study the sensitivity of the modelling output to TO3 , we
need to understand the variability of UVI and ozone. The 1UVI 1TO3
RAFL = − / . (7)
scaling function between UVI and ozone is commonly de- UVIt1 TO3 t1
scribed as the radiative amplification factor (RAF). Follow-
ing Madronich (1993), we define the RAF as a power law: Since the derivative is local, only a small percent change
should be used, here we choose to select a percent change
TO3 t1 −RAFP smaller than 10 %. We proceed by considering every total
UVIt1
= (5) ozone column measurement at a specific date t and the cor-
UVIt2 TO3 t
2 responding UVI. We then compute the relative difference for
UVIt1 TO3 t2
RAFP = ln / ln . (6) a specific SZA interval between all pairs of UVI and TO3 ,
UVIt2 TO3 t1 such as at two dates t1 and t2:
From there we can take every total ozone column measure- 1UVI UVIt1 − UVIt2
ment at a specific date t and the corresponding UVI and com- = (8)
UVIt1 UVIt1
pute ratio.
1TO3 TO3 t1 − TO3 t2
= . (9)
TO3 t1 TO3 t1
www.atmos-chem-phys.net/18/227/2018/ Atmos. Chem. Phys., 18, 227–246, 2018238 K. Lamy et al.: Ultraviolet radiation modelling from ground-based and satellite measurements
Influence of aerosol climatology against aerosol dailymeasurements for UVi modeling
(a) Aerosol optical thickness monthly climatology at multiple wavelength (CIMEL)
(b) Single scattering albedo monthly clomatology at multiple wavelength (CIMEL)
(c) exponent monthly clomatology at multiple wavelength (CIMEL)
(d) AOT anomalies (CIMEL daily–CIMEL clim)
( m
(f) Aerosol optical thickness anomalies monthly distribution
(g) UVi relative difference monthly distribution
Figure 7. Impact of aerosols on UVI modelling. (a) AOT monthly climatology. (b) SSA monthly climatology. (c) Ångström exponent
monthly climatology. (d) AOT anomalies during the study period. (e) UVI relative difference between a run with climatological aerosols and
daily aerosols. (f) AOT anomalies distribution. (g) UVI relative difference monthly distribution.
In previous works, Booth and Madronich (1994) found latitude profile. Bodhaine et al. (1997) analysed 1 year of
a RAFL of 1.1 from broadband measurements in Antarc- UV measurements at Mauna Loa, Hawaii and found RAFP
tica. More recently, from a theoretical point of view, Her- values between about 1.3 at a SZA of 15◦ and 0.6 at 85◦
man (2010) found a RAFP of 1.25 at low SZA, decreasing SZA. At a SZA of 45◦ , while Bodhaine et al. (1997) found a
to 1.1 at higher SZA. These values correspond to a mid-
Atmos. Chem. Phys., 18, 227–246, 2018 www.atmos-chem-phys.net/18/227/2018/K. Lamy et al.: Ultraviolet radiation modelling from ground-based and satellite measurements 239 Figure 8. Radiative amplification factor. (a) 1UV/UV versus 1TO3 / TO3 for UV-SWF (blue crosses), RTUV07 (red crosses) and i-RTUV (green crosses). Linear fitted functions are in coloured curves of corresponding colours. (b) Same as panel (a) but for a power-law fit between ln(UV/UVt1 ) and ln(O3/O3t1 ). (c, d) Linear and power RAFs deduced from the previous fit for a varying SZA with a 2σ dispersion bar. (e) Number of permutations (Npair ) and number of cases (N ) available in comparison to SZA for the linear RAF. RAFP of 1.38 ± 0.20, McKenzie et al. (1991) found a RAFP from which RAFL is also deduced (Booth and Madronich, of 1.25 ± 0.20 at Lauder, New Zealand (45◦ S). 1994). This range of SZAs is chosen due to the availability of Here, both RAFs (linear and power) are calculated for an measurements. Because of the annual variation of the SZA, ideal modelling case (i-RTUV) with SER O3XS and Dob- lower values of SZA occur during the rainy season, when we ber ET spectrum, for the observations (UV-SWF) and for a filter out most of our data. UV-SWF is in blue, RTUV07 in real-condition modelling case (RTUV07) where we fixed ev- red and i-RTUV in green. In Fig. 8b, the same method is used ery parameter except TO3 and monthly ozone and temper- to retrieve RAFP (Madronich, 1993). Figure 8c and d repre- ature profiles. Observations are multiplied by the inverse of sent RAFL and RAFP plotted against SZA for the three cases, the ESF to bring them to constant ESD and be more similar with a 2σ dispersion bar. Figure 8e represents the number of with modelling at constant ESD. The first objective is to eval- cases and permutations used for the regression. Even if the uate the RAF of TO3 on the UVI for the three cases, to see number of permutations which are used for computation of how they compare to each other and to determine whether the RAFs are high, the number of cases compared with each RTUV07 is close to the observations (UV-SWF) by being other are quite low. able to reproduce the RAF of TO3 . The second objective is For i-RTUV, RAFP (dashed green line) are at about 1.20 to compare the RAFs found here with those found previously for a SZA of 25◦ decreasing to 1.11 for a SZA of 60◦ , in other studies at other sites. RAFL (solid green line) decreases from 1.34 to 1.23. Be- In Fig. 8a, 1UVI/UVI is plotted against 1TO3 / TO3 for a tween the same SZAs, while RAFP derived from the clear- SZA of 25◦ ± 0.1◦ for the three cases. The best-fitting curve sky observations (UV-SWF, dashed blue line) decreases of each case is obtained from a least squares fitting method, from 2.01 ± 0.11 to 1.73 ± 0.07, RAFL (solid blue line) de- www.atmos-chem-phys.net/18/227/2018/ Atmos. Chem. Phys., 18, 227–246, 2018
240                       K. Lamy et al.: Ultraviolet radiation modelling from ground-based and satellite measurements

creases from 1.23 ± 0.27 to 1.02 ± 0.09. From RTUV07,              as input (RTUV03), with a mean relative difference (MRD)
RAFP (dashed red line) ranged between 1.40 ± 0.02 and              of 0.43 ± 5.60 %. It is 0.11 % lower than RTUV02 (OMI) and
1.17 ± 0.07. At a SZA of 45◦ from the observations, the            0.51 % lower than the run with SAOZ measurements as input
RAFP obtained was 1.65 ± 0.12. This value is higher than           (RTUV01). Standard deviations (SDs) are about the same for
the one that found by Bodhaine et al. (1997), of 1.38 ± 0.20,      the five cases, around 5.7 %. RTUV03 obtains the lowest me-
for a similar site in the tropics.                                 dian (MED) at 0.44 %. Nonetheless, some of those results are
   RAF tends to decrease as SZA increases. When the SZA            not significant because they are lower than the uncertainty of
increases the path travelled through the atmosphere will be        the UVI measurements (±5 %).
longer and other processes, such as Rayleigh scattering, will         For different extraterrestrial spectra in RTUV01 (Dobber
have a higher impact on the UVI. Since the absorption effec-       et al., 2008) and RTUV05 (Chance and Kurucz, 2010), a
tiveness of tropospheric ozone relative to stratospheric ozone     3.24 % difference is found between both MRD and MED.
depends on SZA (Brühl and Crutzen, 1989), the ozone distri-        The difference is consistent with the one found in Sect. 4.2.1.
bution and the temperature profile have an impact on the RAF          The influence of the choice of ozone cross sections on UVI
value. This is one of the reasons why both RAFs deduced            modelled can be analysed with RTUV01 (SER) and RTUV06
from i-RTUV cases present a smooth line. In i-RTUV, noth-          (BDM). The first is 3.44 % lower than the second. The differ-
ing changes except TO3 and SZA. However, in UV-SWF,                ence between the two is higher here than the difference found
variations in aerosols, TNO2 , ESD, OP and TP between t1           previously (Sect. 4.2.2) in an idealised run, where only one
and t2 are naturally included. In RTUV07 only TO3 , SZA,           profile of temperature and one of ozone were used for the
ozone and temperature profiles are not constant. The impact        sensitivity test. BDM O3XS (Brion et al., 1998 and Malicet
of OP and TP can be appreciated if we look at the difference       et al., 1995) were calibrated for four temperatures, 295, 243,
between RTUV07 and i-RTUV.                                         228 and 218 K, while SER was run with temperatures rang-
   RAFL determined by the observations (UV-SWF) is al-             ing from 193 to 293 K with a 10 K step. Since UVI is sen-
ways lower than i-RTUV, by about 0.2. However, RAFP de-            sitive to the ozone and temperature profiles, different O3XS
termined by the observations (UV-SWF) is higher than the           can induce higher differences in surface UVI than we calcu-
idealised case by about 0.6 at low SZA, between 25 and             lated previously during the sensitive test. This needs to be
35◦ . It is closer at higher SZA. The result from the obser-       investigated further, in particular the impact of O3XS and
vations should be considered carefully. When two cases are         ozone and temperature profiles on the surface UVI.
compared the relative difference between every other param-           A linear regression representation and mean relative differ-
eters associated with theses cases (such as AOT, TNO2 and          ence plots versus SZA are given in Fig. 9 for all RTUV cases.
OP) are selected to be smaller than 10 %. Uncertainties are        On all subplots of Fig. 9a, data corresponding to a daily mean
still important for the corresponding TO3 , AOT, TNO2 , OP,        AOT higher than the monthly mean AOT are represented
TP and clear-sky filtering associated with each UVI measure-       in red. All conditions are in blue. RTUV01 and RTUV04
ment. It is difficult to determine whether observations are bet-   use different aerosol inputs, RTUV01 was modelled with an
ter represented by a linear law or a power law as dispersion       aerosol daily mean and RTUV04 used a monthly climatol-
is high and the number of cases are low (Fig. 8e) for both.        ogy. The MRD of RTUV01 is lower than that of RTUV04,
                                                                   whereas the opposite is true for the MED. Unlike the mean,
5.2   Validation against observed clear-sky UVI                    the median is insensitive to outliers. In Sect. 4.2.4 it was
                                                                   noted that, even if MRD is very low, there are also singular
In order to validate UVI modelling for the southern tropics,       peaks that can reach up to 30 % MRD. These are the outliers
we compared the output of multiple model cases against UVI         that are taken into account in RTUV04. Close examination
clear-sky measurements. Table 4 presents relative difference       of Fig. 9a reveals consistent outliers under the fitted curves
and standard deviation for the six Reunion Tropospheric Ul-        for RTUV01, 02, 03, 05 and 06, which correspond to an un-
traviolet (RTUV) model cases.                                      derestimation of the UVI (due to an overestimation of AOT).
   We define the relative difference between RTUV and UV-          For RTUV04, which is the case with monthly climatological
SWF as                                                             values of AOT, there are of course only blue crosses. Bottom
                  UVIRTUV − UVIOBS                                 outliers on every other RTUV case can be explained by the
RD[%] = 100 ×                      .                       (10)    use of an AOT daily mean. Since the Cimel sun photome-
                       UVIOBS
                                                                   ter only takes measurements when the sun is directly visible,
   The closest agreement between the measurements and              and we have previously shown a strong presence of clouds,
model is found for the RTUV03 case. This corresponds to            using an AOT monthly climatology can sometimes be better
a configuration with daily aerosol measurements, Dobber ET         than the daily mean.
spectrum, TO3 from SBUV and SER ozone cross sections.                 The optimised input configuration is RTUV03. The corre-
We compared measurements at SZA ≤ 60◦ . Of the three sets          sponding statistical values are consistent with those found in
of ozone total column, the agreement between the measured          other studies. Badosa et al. (2007) found a MRD lower than
and modelled UVIs is optimal when SBUV data set is used            10 % concerning observations with a similar instrument and

Atmos. Chem. Phys., 18, 227–246, 2018                                                www.atmos-chem-phys.net/18/227/2018/
K. Lamy et al.: Ultraviolet radiation modelling from ground-based and satellite measurements 241
Table 4. RTUV Cases against clear-sky UVI observations.
Parameter RTUV01 RTUV02 RTUV03 RTUV04 RTUV05 RTUV06
Mean relative difference (%) 0.94 0.54 0.43 1.29 4.18 4.38
Standard deviation 5.60 5.86 5.83 5.32 5.77 5.78
Median of the RD 1.07 0.70 0.44 0.73 4.31 4.51
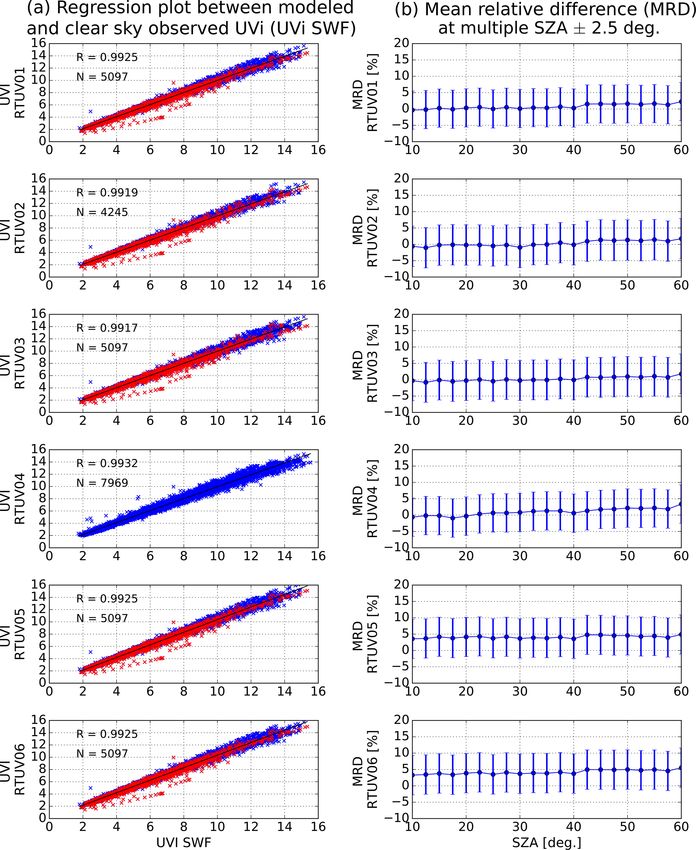
austral winter (June, July and August) and austral summer
(December, January and February). Since the SAOZ instru-
ment is colocated with the Bentham spectrometer we chose
to use RTUV01 for the comparison even if RTUV03 gave
better results. RD tends to increase during the day for the
whole year and both seasons due to the formation of clouds.
The standard deviation is higher in the afternoon during sum-
mer due to the strong presence of clouds in this period (see
Fig. 2). Since there are fewer clear-sky measurements for this
period, the comparison is statistically weaker here, which in-
creased the dispersion. In winter, there is more data avail-
able and less filtering (see Fig. 2), so standard deviations are
smaller.
In Fig. 11 the diurnal cycle of the UVI seasonal mean and
maximum are represented. Consistent results are obtained.
Mean non-filtered UVIs are always lower than mean clear-
sky values. As mentioned before, the model tends to overes-
timate clear-sky UVI. Both filtered data sets (UVI-SWF and
UVI-SYNOP) are in agreement: UVI-SYNOP diverges from
UVI-SWF during the afternoon for the austral summer but, as
stated before, SYNOP observer reports are less accurate than
SWF cloud fractions. This is probably due to the distance be-
tween SYNOP observer reports, which are about 10 km from
SWF, and UVI measurements, and the sampling difference:
1 h for SYNOP, 1 min for SWF and 15 min for UV measure-
ments. It would be very interesting to add an all-sky cam-
Figure 9. Comparisons of RTUV modelling cases with UVI-SWF
era to the same site for more accurate indications of cloudi-
observations. (a) UVI RTUV against UVI SWF. Linear regression
ness. Austral summer is usually a very cloudy season in this
shown with a black line, all RTUV data against UVI SWF are
marked with blue crosses, and RTUV data modelled with an AOT southern tropical region. A maximum of UVI appears for un-
higher than the monthly mean AOT are represented in red. (b) Mean filtered data (green dashed line) with strong values, usually
relative difference for a varying SZA with dispersion bar ± 1 σ up to 18, around 08:00 UTC (local noon time). This is prob-
(standard deviation). ably due to UV enhancement by cloud fractional sky cover.
This phenomenon has been described before, for example by
Calbó et al. (2005) and Jégou et al. (2011), and its quantifi-
cation in the southern tropics will be the subject of a future
filtering techniques at Lauder (45.04◦ S), Boulder (40.01◦ N),
study.
Mauna Loa (19.53◦ N) and Melbourne (37.63◦ S). Mauna
Loa can be compared with Reunion Island as both sites are
in the tropics and have similar weather conditions. MRD be- 6 Conclusions
tween Badosa et al. (2007) model cases and observations
ranged from −1.8 to 3.6 %. In the present study comparable The physics of radiative transfer is well understood but
values of MRD were found (ranging from 0.43 to 4.38 %, the modelling of surface UV radiation is still a challenge
which is well within the modelling uncertainty of 5 %). The since multiple parameters need to be taken into account. For
filtering method at Mauna Loa was probably stronger due to clouds, we can simply filter observations and work under
the use of a whole sky imager. clear-sky conditions.
Diurnal cycles of RD between RTUV01 and UV-SWF are We investigated the sensitivity of clear-sky UV radiation
represented in Fig. 10 for the entire year and for two seasons, modelling to various input parameters. The impact of dif-
www.atmos-chem-phys.net/18/227/2018/ Atmos. Chem. Phys., 18, 227–246, 2018You can also read