What millimeter-wavelength radar reflectivity reveals about snowfall: an information-centric analysis
←
→
Page content transcription
If your browser does not render page correctly, please read the page content below
Atmos. Meas. Tech., 14, 869–888, 2021
https://doi.org/10.5194/amt-14-869-2021
© Author(s) 2021. This work is distributed under
the Creative Commons Attribution 4.0 License.

What millimeter-wavelength radar reflectivity reveals about
snowfall: an information-centric analysis
Norman B. Wood1 and Tristan S. L’Ecuyer2
1 Space   Science and Engineering Center, University of Wisconsin – Madison, Madison, WI, USA
2 Department   of Atmospheric and Oceanic Sciences, University of Wisconsin – Madison, Madison, WI, USA

Correspondence: Norman B. Wood (norman.wood@ssec.wisc.edu)

Received: 4 June 2020 – Discussion started: 29 June 2020
Revised: 22 October 2020 – Accepted: 24 November 2020 – Published: 4 February 2021

Abstract. The ability of single-frequency, millimeter-              as those provided by profiling ground-based, airborne, and
wavelength radar reflectivity observations to provide use-          satellite-borne radars under lighter snowfall conditions when
ful constraints for retrieval of snow particle size distribu-       attenuation and multiple scattering can be neglected.
tion (PSD) parameters, snowfall rates, and snowfall accu-
mulations is examined. An optimal estimation snowfall re-
trieval that allows analyses of retrieval uncertainties and in-
formation content is applied to observations of near-surface        1   Introduction
W-band reflectivities from multiple snowfall events dur-
ing the 2006–2007 winter season in southern Ontario. Re-            Radar observations focused on snowfall from platforms out-
trieved instantaneous snowfall rates generally have uncer-          side the established weather surveillance radar networks have
tainties greater than 100 %, but single-event and seasonal          become ubiquitous over the last 2 decades, largely due to
snow accumulations from the retrieval results match well            increased interest in the role of snowfall in mid- and high-
with collocated measurements of accumulations. Absolute             latitude microphysics, hydrology, and climate. This research
fractional differences are mainly below 30 % for individual         accelerated with the advent of satellite-borne radars flown
events that have more substantial accumulations and, for the        by missions to quantify global hydrometeor and precipita-
season, 12.6 %. Uncertainties in retrieved snowfall rates are       tion properties. These satellite-borne radars (specifically the
driven mainly by uncertainties in the retrieved PSD param-          CloudSat mission’s Cloud Profiling Radar (CPR) (Tanelli
eters, followed by uncertainties in particle model parame-          et al., 2008) and the Global Precipitation Measurement
ters and, to a lesser extent, the uncertainties in the fall-speed   (GPM) mission’s Dual-frequency Precipitation Radar (DPR)
model. Uncertainties attributable to assuming an exponential        (Toyoshima et al., 2015), with two others anticipated to
distribution are negligible. The results indicate that improve-     launch in the coming decade) are capable solely of measuring
ments to PSD and particle model a priori constraints provide        vertical profiles of radar reflectivity factor (hereafter, reflec-
the most impactful path forward for reducing uncertainties in       tivity) along with path-integrated attenuation under certain
retrieved snowfall rates. Information content analyses reveal       conditions. To understand the capabilities of these satellite-
that PSD slope is well-constrained by the retrieval. Given the      borne radars for quantifying snowfall, we must know how
sensitivity of PSD slope to microphysical transformations,          well radar reflectivity observations constrain snowfall prop-
the results show that such retrievals, when applied to radar        erties.
reflectivity profiles, could provide information about micro-          To these ends, CloudSat and GPM have contributed to
physical transformations in the snowing column. The PSD             multiple field experiments involving ground-based radars
intercept is less well-constrained by the retrieval. While ap-      and designed to provide, in part, ground validation data for
plied to near-surface radar observations in this study, the re-     the radar remote sensing of snowfall: the Canadian CloudSat-
trieval is applicable as well to radar observations aloft, such     CALIPSO Validation Project (C3VP) (Hudak et al., 2006),
                                                                    the Global Precipitation Measurement (GPM) Cold-season

Published by Copernicus Publications on behalf of the European Geosciences Union.
870                N. B. Wood and T. S. L’Ecuyer: What millimeter-wavelength radar reflectivity reveals about snowfall

Precipitation Experiment (GCPEx) (Skofronick-Jackson et             ships between reflectivity and snowfall rate (“Z–S” relation-
al., 2015), the Light Precipitation Validation Experiment           ships) (Liu, 2008; Kulie and Bennartz, 2009; Matrosov et al.,
(LPVEx) (Petersen et al., 2011), the International Collabo-         2008, 2009). This approach allows the uncertainty in a re-
rative Experiment during the PyeongChang 2018 Olympics              trieved snowfall rate to be estimated, but the existing stud-
and Paralympics (ICE-POP) (Chandrasekar et al., 2019), and          ies have not provided insight into the dominant sources of
the Olympic Mountains Experiment (OLYMPEx) (Houze et                uncertainty nor into the ability of observed radar reflectivity
al., 2017). These and a number of smaller, more focused field       to constrain various properties controlling the snowfall rate.
campaigns (Pettersen et al., 2020; Schirle et al., 2019) have       Posselt et al. (2015) examined uncertainties and information
made extensive use of small K-band profiling radars, e.g.,          content for radar observations of mixed- and ice-phase re-
METEK’s Micro Rain Radar (MRR, Klugmann et al., 1996),              gions of a convective storm but targeted radar systems with
but several experiments, including C3VP, GCPEx, and ICE-            more advanced capabilities. Mascio and Mace (2017) used
POP, have deployed ground-based, W-band scanning, or pro-           CloudSat and aircraft observations to assess how uncertain-
filing radars. Although these ground-based radars may pro-          ties in the ice particle mass-dimension relationship contribute
vide advanced capabilities such as Doppler velocity measure-        to radar reflectivity forward model uncertainties but used
ment, their reflectivity measurements in snowfall are a valu-       known, observed particle size distributions and did not ex-
able resource for examining the capabilities of the satellite-      amine the influence of the mass-dimension uncertainties on
borne radars (Maahn et al., 2014; Matrosov et al., 2008).           snowfall retrieval performance.
    The ability of radar reflectivity to constrain snowfall prop-      In this work, we provide uncertainty and information con-
erties, however, has not been well-evaluated. Snowfall ex-          tent analyses for retrieving snowfall from observations of
hibits a wide range of microphysical characteristics that in-       radar reflectivity at millimeter wavelengths, focusing on W-
fluence radar reflectivity and snowfall rate. Most notable          band (94 GHz). The results are representative of the gen-
to casual observers are variations in particle habits: pris-        eral problem of estimating snowfall from such remote radar
tine dendrites, needles, columns, plates, and bullets; aggre-       reflectivity observations without supplementary collocated
gates of the same; pellets and graupel for example. Un-             observations of snow particle mass-dimension relationships,
derlying these differences in habit are variations in mass,         fall speeds, and particle size distributions. The results apply
and, given a particular mass, variations in how mass is dis-        particularly to observations by the CPR (Tanelli et al., 2008)
tributed within the particle. Unlike longer-wavelength radars       and by the DPR’s Ka-band radar, but also to reflectivity mea-
for which radar backscattering properties of snow particles         surements from ground-based radars such as the MRR (Klug-
are sensitive primarily to particle mass, at millimeter wave-       mann et al., 1996) and the Department of Energy Atmo-
lengths those properties are additionally sensitive to parti-       spheric Radiation Measurement (ARM) program’s Millime-
cle shape. Investigations of particle mass and area (an as-         ter Wavelength Cloud Radar (Moran et al., 1998) and Ka-
pect of shape) (Kajikawa, 1972, 1975, 1982; Zikmunda and            band ARM Zenith Radar (KAZR) (Bharadwaj et al., 2013).
Vali, 1972, 1977; Heymsfield, 1972; Locatelli and Hobbs,            The retrieval method used here is the foundation for the re-
1974; Mitchell et al., 1990; Mitchell, 1996; Heymsfield and         trieval used for CloudSat’s 2C-SNOW-PROFILE product;
Miloshevich, 2003) have painstakingly determined the broad          that application is the subject of a future companion pa-
extent of these variations. Along with differences in single-       per. Our objectives here are to identify the snowfall prop-
particle properties, populations of falling snow particles vary     erties that are best constrained by such observations and the
substantially in their concentrations with size (i.e., the spec-    most significant sources of uncertainty in the radar retrieval
tral particle size distribution, PSD) based on measurements         of snowfall. The results establish a performance baseline
from the ground (e.g., Nakada and Terada, 1935; Imai et             for reflectivity-only observations of snowfall, indicate where
al., 1955; Gunn and Marshall, 1958; Rogers, 1973; Brandes           uncertainty reduction efforts should be focused, and sug-
et al., 2007) and, more recently, with the advent of imag-          gest what improvements to radar-observing systems could be
ing particle probes, from aircraft (e.g., Passarelli, 1978; Gor-    most beneficial.
don and Marwitz, 1984, 1986; Braham, 1990; Woods et al.,               The analyses use the optimal estimation (OE) retrieval
2008; Heymsfield et al., 2008, and references therein). The         technique (Rodgers, 2000), which inherently diagnoses in-
observed particle concentrations vary over several orders of        formation content and uncertainties in retrieved quantities
magnitude.                                                          subject to specified uncertainties in measurements, forward
    In radar-based remote sensing scenarios when these prop-        models, and a priori knowledge of the quantities to be re-
erties are not known, these variations produce uncertainty          trieved (L’Ecuyer et al., 2006; Cooper et al., 2006). The re-
in the relationship between radar reflectivity factor (here-        trieval produces best estimates of snow size distribution pa-
after, reflectivity) and associated water content and snow-         rameters by using the radar reflectivity observations to refine
fall rate. A common approach to estimating this uncertainty         a priori estimates of those parameters (Sect. 2). The infor-
has been to evaluate modeled reflectivities, water contents,        mation content metrics provided by OE require all sources
and snowfall rates using a range of assumed particle mod-           of uncertainties in the retrieval process to be specified. These
els and PSDs. The results are often expressed using relation-       are discussed in Sect. 3. Ground-based radar and precipita-

Atmos. Meas. Tech., 14, 869–888, 2021                                                 https://doi.org/10.5194/amt-14-869-2021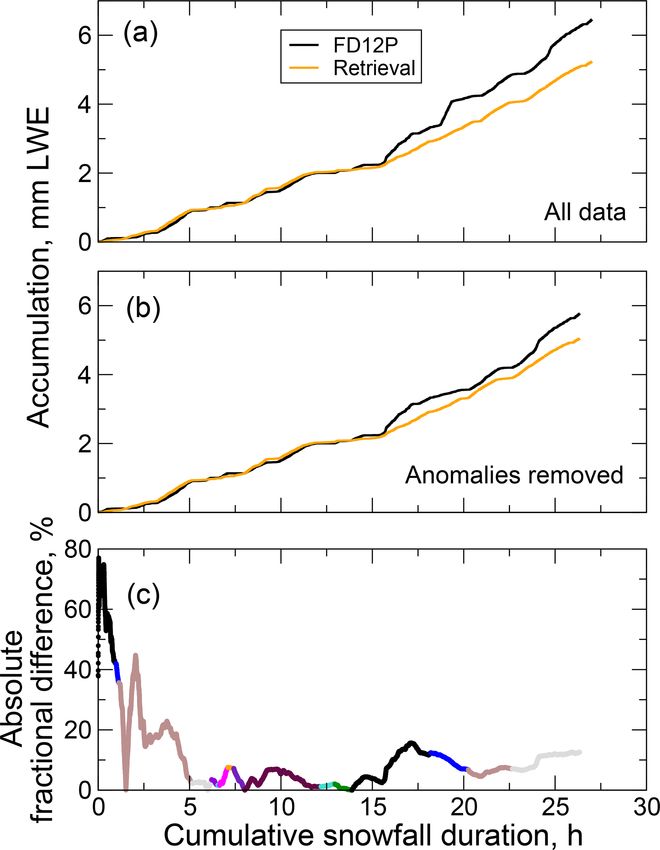
N. B. Wood and T. S. L’Ecuyer: What millimeter-wavelength radar reflectivity reveals about snowfall                               871

tion observations allow the retrieval to be tested, showing that     Assuming Gaussian statistics for the model-measurement er-
size distribution width is best constrained by the retrieval and     rors and the a priori state, minimizing the cost function
that uncertainties in retrieved size distribution parameters                                      T
(but not uncertainties due to the assumed exponential form of        8(x, y, x a ) = y − F (x, b̃) S−1     y − F (x, b̃)
the PSD itself) are the strongest contributors to uncertainties
in estimated snowfall rates (Sect. 4). The results suggest that                    + (x − x a )T S−1
                                                                                                  a (x − x a )                     (3)
the retrieved size distribution widths could be useful for di-
                                                                     with respect to x gives this PDF, where S is the covari-
agnosing changes in PSD resulting from microphysical pro-
                                                                     ance matrix representing the uncertainties . The Gaussian
cesses (Lo and Passarelli, 1982) and that improved observa-
                                                                     assumption is reasonable if the expected values and covari-
tional constraints on size distribution parameters, as might be
                                                                     ance matrices are known for the model-measurement uncer-
provided by dual-wavelength radar observations (Matrosov,
                                                                     tainties and the a priori state, but other details are lacking. In
1998), would likely enhance snowfall retrieval performance
                                                                     that case, the Gaussian form maximizes the entropy of a PDF
(Sect. 5).
                                                                     (Shannon and Weaver, 1949; Rodgers, 2000). Assuming an
                                                                     alternate form would introduce constraints on the retrieval
2   Retrieval method                                                 that are not justified based on the limited knowledge of the
                                                                     PDF.
The retrieval uses measurements of reflectivity to estimate              Provided the forward model is not excessively nonlinear,
snow microphysical properties and to quantify water content          Newtonian iteration
and snowfall rate. At the wavelengths characteristic of cloud                                            −1
                                                                                               T −1
radars such as CloudSat and shorter-wavelength precipita-            x̂ i+1 = x̂ i + S−1a + Ki S Ki
tion radars, scattering by precipitation-sized particles does               h                                            i
not follow the Rayleigh approximation, and both attenuation                  KTi S−1
                                                                                      y − F (x̂ i , b̃) − S−1
                                                                                                            a (x̂ i − x a )         (4)
and multiple scattering may affect the radar signal. At these
wavelengths, snow particle scattering and extinction proper-         leads to x̂, where K is the Jacobian of the forward model with
ties depend not only on mass, but on shape as well. With even        respect to x, and Ki = K(x̂ i ). Iteration continues until the
simple parameterized expressions for particle mass, shape,           squared difference in successive x̂ i normalized by the current
and size distribution, single-frequency observations of radar        estimate of the a posteriori covariance Ŝx is much smaller
reflectivity alone are insufficient to reasonably constrain the      than the number of state vector elements (Rodgers, 2000). At
resulting set of parameters.                                         convergence, this covariance of x̂ is obtained as
   To address this insufficiency, retrievals must incorporate                                −1
a priori information about particle microphysical and scatter-       Ŝx = K̂T S−1         −1
                                                                                    K̂ + Sa      ,                              (5)
ing properties. This is accomplished here using OE (Rodgers,
2000), a Bayesian technique that allows a priori information         where K̂ = K(x̂). As a diagnostic test of the results, a
to be included explicitly. The input for this retrieval is the Ze    χ 2 statistic is calculated using the retrieved state vector in
observed by the radar for a range gate identified as containing      Eq. (3). A value near the number of observations suggests
snow. For notational consistency with other work, we show            correct convergence (Marks and Rodgers, 1993). Several
this as a vector:                                                    metrics, determined from the retrieved state and based on
     h       i                                                       information theory, provide insight into the retrieval perfor-
         obs
y = Ze,1       .                                               (1)   mance; these metrics are presented in Sect. 4.

A forward model F (x, b̃) relates y to x, a state vector of          2.1   The forward model
unknown properties to be retrieved, as
                                                                     To assess the information provided purely by reflectivity ob-
y = F (x, b̃) + ,                                            (2)    servations, whether from ground-, aircraft-, or space-based
                                                                     radars, the retrieval ignores attenuation and multiple scatter-
where b̃ are parameters not being retrieved but which influ-         ing. This treatment would be appropriate for cases with little
ence the forward model results. The forward model approx-            intervening scattering and extinction between the radar and
imates the true physical relation between x and y, and there         observed snowfall, such as when the radar bin containing the
are uncertainties associated with both the observations y and        snowfall of interest is near the radar or under light snowfall
the forward model parameters b̃.  represents the total uncer-       conditions. For such a case, the singly-scattered reflectivity
tainty due to all sources. OE attempts to find x̂, an estimate       Zess as a function of range R from the radar is given by
of the state which maximizes the posterior conditional prob-
                                                                                                D
                                                                                                Zmax
ability density function (PDF) P (x|y), subject also to prior                        34
knowledge about the values of x. This prior knowledge is             Zess (R) =                       N (D, R)σbk (D, R)dD,        (6)
described by expected values x a and their covariances Sa .                       kKw k2 π 5
                                                                                               Dmin

https://doi.org/10.5194/amt-14-869-2021                                                    Atmos. Meas. Tech., 14, 869–888, 2021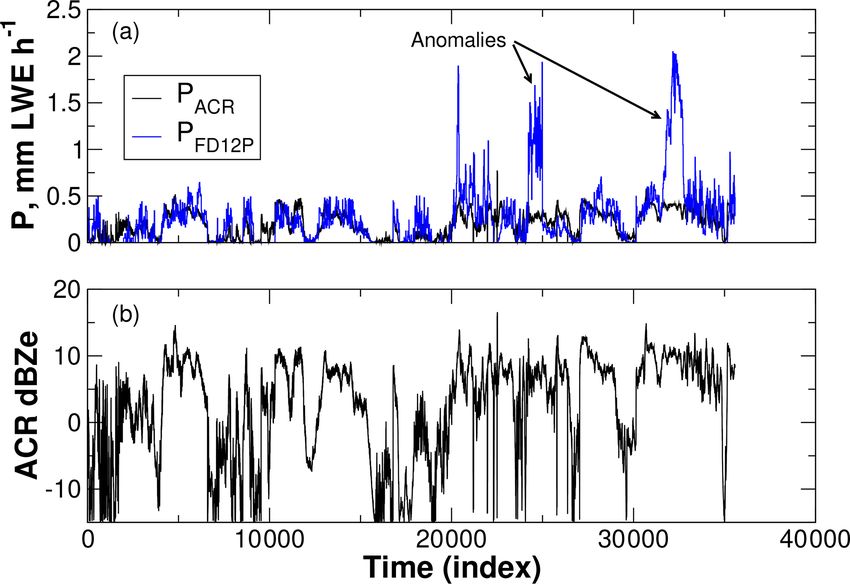
872 N. B. Wood and T. S. L’Ecuyer: What millimeter-wavelength radar reflectivity reveals about snowfall
where σbk (D, R) is the backscatter cross section for particle disdrometer over the course of several winter seasons. Al-
size D at range R, N (D, R) is the PSD at range R, 3 is the though about 22 % of the observed snow distributions ex-
radar wavelength, and Kw is the dielectric factor for water. hibited super-exponential features, more commonly the fitted
gamma distributions were nearly equivalent to exponential
2.1.1 Forward model parameters: snow particle model distributions. Several aircraft-based studies using in situ ob-
servations under a wide range of atmospheric conditions have
Backscattering and extinction cross sections depend inti- confirmed exponential behavior, especially at larger particle
mately on particle mass, shape, and orientation relative to sizes (Passarelli, 1978; Houze et al., 1979; Lo and Passarelli,
the radar beam. These properties are highly variable for snow 1982; Gordon and Marwitz, 1984; Braham, 1990; Woods et
particles, and the approach used here is to specify their PDFs al., 2008). While other studies of aircraft observations have
a priori using best estimates and treat their variability as a noted departures from exponential behavior (e.g., “super-” or
source of uncertainty in the retrieval. We adopt the common “sub-exponential”, Herzegh and Hobbs, 1985), Heymsfield
model (e.g., Locatelli and Hobbs, 1974; Mitchell, 1996) in et al. (2008) examined the suitability of exponential distri-
which mass and horizontally projected area are described us- butions for snow. They found that fitted exponential distribu-
ing power laws, tions, when used to simulate IWC and Ze, could provide gen-
β erally good agreement with IWC and Ze calculated directly
m (DM ) = αDM , (7)
from the observed discrete size distributions. These studies
σ
Ap (DM ) = γ DM , (8) support the adequacy of exponential distributions for retriev-
ing snowfall. D may be an actual dimension of the snow par-
on particle maximum dimension, DM , and use the parti- ticle, the diameter of an equivalent mass ice sphere, or the
cle properties and shape “B8pr-30” (Wood et al., 2015), an melted drop diameter. The choice is significant because N0
idealized branched spatial particle that was found to min- and λ depend on the choice of D. For this work, we use the
imize bias in simulated reflectivities versus coincident W- maximum particle dimension, DM , because DM is closely
band radar observations. That work used in situ measure- related to the particle dimensions measured by imagers such
ments and remotely sensed X-band reflectivity observations as video disdrometers (Wood et al., 2013) and aircraft par-
of snow from C3VP (Hudak et al., 2006) along with pre- ticle probes, making comparisons with other datasets more
viously reported single-particle measurements to develop straightforward.
best estimates and covariances for the power-law parame- The exponential size distribution parameters N0 and λ are
ters α, β, γ , and σ . These results then constrained discrete the desired state variables. Values for N0 may range over
dipole approximation calculations using DDSCAT (Draine several orders of magnitude, so log (N0 ) is retrieved instead.
and Flatau, 1994) to obtain best estimates of snow parti- The variability of λ is significantly smaller than that of N0 ;
cle single-scattering properties and their uncertainties at the however, examination of fitted exponential distributions from
desired wavelengths. These a priori descriptions of size- C3VP snow events indicated that the distribution of values
resolved particle mass, Ap , σbk , σext , and their uncertainties for λ was strongly non-Gaussian. The log-transformed val-
constitute the particle model used in the retrieval and are ues are much less skewed (Fig. 1a), and accordingly, log(λ)
summarized in Appendix B. is retrieved instead. The corresponding state vector to be re-
trieved is then
2.2 The retrieved state
log (N0 )
The relationship described by Eq. (6) requires information x̂ = , (10)
log (λ)
about particle size distributions and single-scattering proper-
ties. With scattering properties and their uncertainties speci- and the associated covariance matrix obtained from the re-
fied a priori as described in Sect. 2.1.1, this leaves the snow trieval is of the form
PSD parameters and their PDFs to be determined by the re-
trieval. 2 (log (N )) s (log (N0 ) ,
s 0
Snow PSDs are frequently characterized as exponential:
log (λ))
Ŝx =
s (log (N0 ) ,
. (11)
2
s (log (λ))
N(D) = N0 exp (−λD) , (9) log (λ))
where λ is the slope of the distribution and N0 its intercept.
Rogers (1973) used photographs of snowflakes to develop es- 2.3 Prior estimates of the state
timates of snow size distributions based on actual dimensions
and found snow size distributions to be exponential. Brandes For each profile, the a priori state consists of a vector of
et al. (2007) evaluated both exponential and gamma forms, expected values x a and the corresponding covariance ma-
which have the ability to represent sub- or super-exponential trix Sa , having the same sizes as the state vector x (Eq. 10)
behavior, for snow size distributions observed by a 2D video and its covariance matrix Sx (Eq. 11). A priori estimates of
Atmos. Meas. Tech., 14, 869–888, 2021 https://doi.org/10.5194/amt-14-869-2021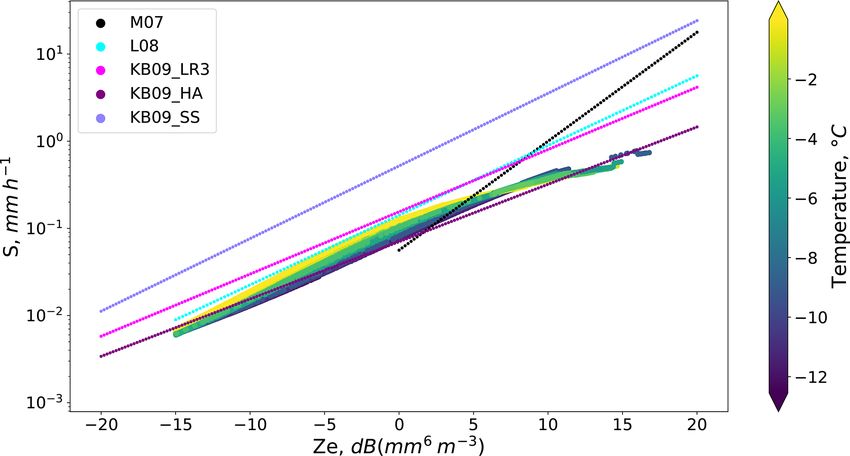
N. B. Wood and T. S. L’Ecuyer: What millimeter-wavelength radar reflectivity reveals about snowfall 873
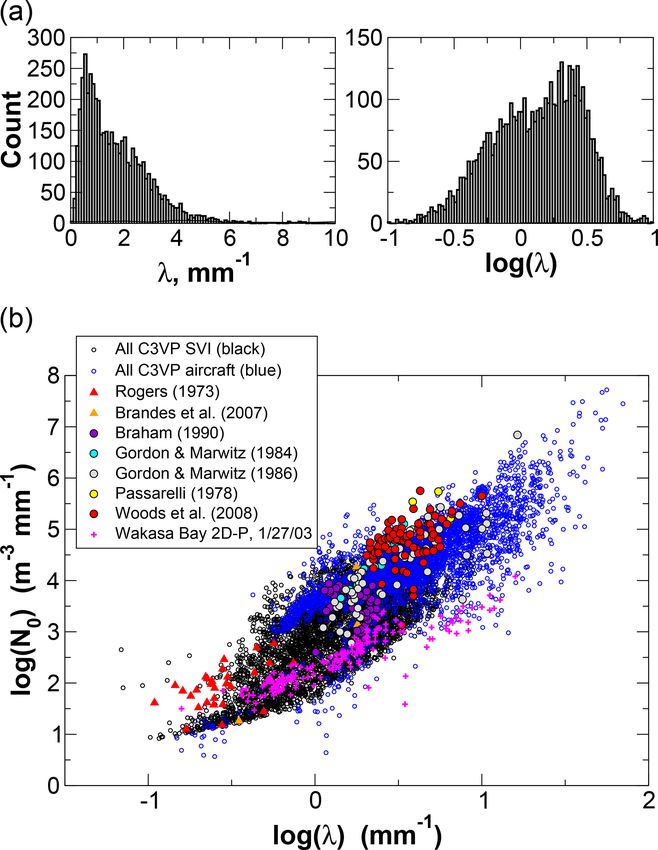
Both λ and N0 have been observed to vary log-linearly
with temperature (e.g., Houze et al., 1979; Woods et al.,
2008; and works reviewed in Ryan, 1996). Fits were there-
fore constructed for both parameters using the combined
C3VP aircraft and SVI data and uncertainties estimated us-
ing residual standard deviations (RSDs) calculated for data
binned into 2 K intervals (Fig. 2). The narrow temperature
ranges for the Wakasa Bay and Brandes et al. (2007) obser-
vations make comparisons against the C3VP temperature de-
pendence uninformative. For λ, the Rogers (1973) observa-
tions are largely outside the bounds of the RSDs but are gen-
erally consistent with the C3VP histogram for warmer tem-
peratures. The aircraft observations other than Wakasa Bay
follow a temperature trend similar to the C3VP observations.
For N0 , several of the comparison datasets lie mostly above
the RSD bounds but would be well within a +2 RSD bound.
Based on the similarity of C3VP to results from other ex-
periments, the a priori states derived from these observa-
tions can be expected to represent a broad range of snowfall
regimes and were adopted for the retrieval. A priori values
for log (λ) and log (N0 ) were estimated from the linear fits as
log λap = −0.03053(T − 273.) − 0.08258, (12)
log N0,ap = −0.07193(T − 273.) + 2.665,
with λ in mm−1 , N0 in m−3 mm− 1, and T in K. The RSDs
show little variation with temperature except in the vicin-
Figure 1. (a) Histograms of λ and log(λ) fitted to C3VP SVI ob-
ity of 240 K, where they increase substantially. These large
servations. (b) Estimates of λ and N0 determined from fits to size
RSDs are in response to a few outlying samples with small λ
distributions from C3VP observations, with values provided from
several earlier studies for comparison. and N0 values. Accordingly, variances were treated as con-
stant and were estimated as the squared RSDs averaged over
all temperatures. The uncertainty model also includes the
log (N0 ) and log (λ) are determined using temperature-based covariance between log (N0 ) and log (λ). Correlation coef-
parameterizations derived using snow PSDs observed during ficients were evaluated for each of the temperature-binned
C3VP and other field experiments. Exponential size distribu- data subsets, giving a mean coefficient of 0.72 with a stan-
tions were fit to the observed size spectra from both ground- dard deviation of 0.12.
The a prioricovariance was modeled
based Snowflake Video Imager, or SVI (Newman et al., 2009; as 0.72 · s log λap · s log N0,ap :
Wood et al., 2013), and from 2D particle probes carried
s 2 log λap
aboard the National Research Council Canada’s Convair-580 = 0.133,
during three C3VP research flights (Fig. 1b). Results from s 2 log N0,ap
= 0.95, (13)
a number of earlier studies are shown as well for compari- s log λap , log N0,ap = 0.26.
son, including ground-based observations taken in and near
the Rocky Mountain Front Range (Rogers, 1973; Brandes et
3 Implementation and uncertainty sources
al., 2007); and aircraft observations over the central Sierra
Nevada (Gordon and Marwitz, 1984, 1986), in lake effect Applying the exponential distribution in Eq. (6), the singly-
snow over Lake Michigan (Braham, 1990), in synoptic snow- scattered non-attenuated reflectivity Z ss
e is
fall over central Illinois (Passarelli, 1978), and in orographic
and frontal wintertime precipitation in the Pacific Northwest DZ
M,max
(Woods et al., 2008). Also shown are similar fits performed 34
Z ss
e (R) = N0 exp (−λDM ) σbk
on 2D probe observations from a Wakasa Bay research flight kKw k2 π 5
DM,min
on 27 January 2003 (Lobl et al., 2007). The results suggest
that the C3VP observations adequately represent snowfall (DM , b̃) dDM . (14)
from a number of different regimes, although the number
concentrations from several studies are at the margins of the The backscatter cross section σbk has been written to show
C3VP observations. its dependence on a vector of parameters b̃ as well as on DM .
https://doi.org/10.5194/amt-14-869-2021 Atmos. Meas. Tech., 14, 869–888, 2021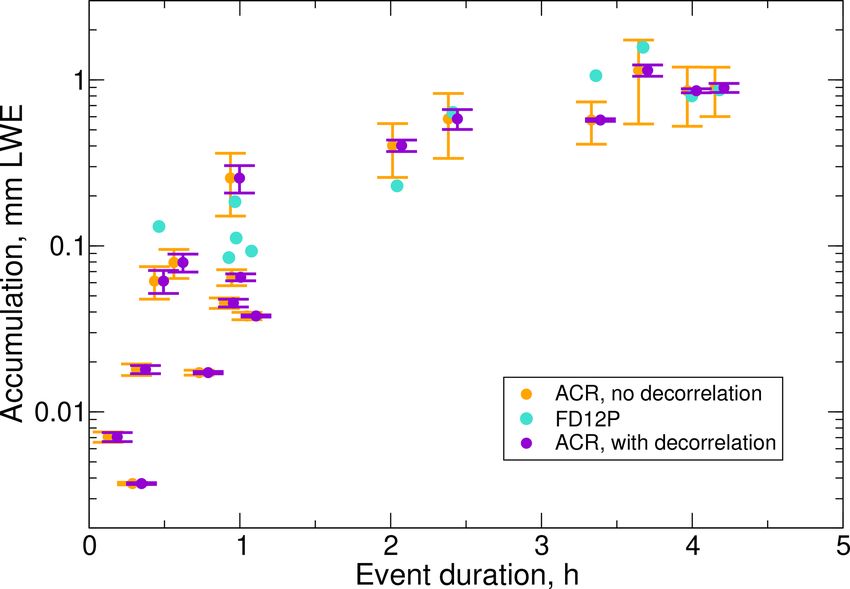
874                 N. B. Wood and T. S. L’Ecuyer: What millimeter-wavelength radar reflectivity reveals about snowfall

Figure 2. Dependence of log (λ) and log (N0 ) on temperature. Central red lines show the best-fit relationships, while the upper and lower
blue lines show bounds given by ±1 residual standard deviation. The shaded gray shows the 2D histogram of values for the C3VP surface
and aircraft observations (a and c). Symbols (b and d) match those from Fig. 1 except that, in lieu of symbols for Woods et al. (2008), the
dashed black line shows a linear best fit reported by the authors.

The vector b̃ includes the parameters for the mass- and area-           3.1.1   Uncertainties for measured reflectivities
dimension relations α, β, γ , and σ which were used to con-
struct the particle models from which the scattering proper-            The sources of reflectivity measurement error include er-
ties were calculated. The tilde indicates that these parameters         rors in the absolute radiometric calibration and measurement
are approximations of the true values and a source of uncer-            noise. For this work, we assume the radar is well-calibrated,
tainty.                                                                 leaving noise as the uncertainty source. To estimate Sy , we
                                                                        model the noise using the well-characterized CloudSat CPR
3.1   Model-measurement uncertainties                                   (Tanelli et al., 2008). For reflectivities above −10 dBZ, 1
                                                                        standard deviation of noise as a fraction of the mean signal is
The error covariance matrix S is                                       about −16 dB, while for reflectivities below −10 dBZ, noise
                                                                        is an increasing fraction of the signal, reaching 0 dB at the
                                                                        minimum detectable signal of −30 dBZ (Richard T. Austin,
 S   = Sy + SF
                                                              (15)      personal communication, 4 November 2008). The resulting
      = Sy + Sss   ss
              B + SF ,                                                  uncertainties range from 3 dBZ for a reflectivity of −30 dBZ
                                                                        to about 0.1 dBZ for reflectivities above −10 dBZe (Fig. 3).
where Sy is the covariance matrix for the measurement un-
certainties and SF is that for the singly-scattered reflectivi-         3.1.2   Forward model uncertainties
ties given in Eq. (14). The forward-model uncertainties may
be further decomposed as the sum of two terms: Sss    B , which         Uncertainties Sss B due to the forward model parameters b̃ =
is a covariance matrix describing uncertainties due to the for-         (α, β, γ , σ )T that describe the snow particle model were ex-
ward model parameters b̃, and SssF , which is a covariance ma-          amined in Wood et al. (2015) as
trix describing uncertainties due to other assumptions in the
calculation of Zess .                                                   Sss         T
                                                                         B = Kb Sb Kb ,                                               (16)

Atmos. Meas. Tech., 14, 869–888, 2021                                                      https://doi.org/10.5194/amt-14-869-2021
N. B. Wood and T. S. L’Ecuyer: What millimeter-wavelength radar reflectivity reveals about snowfall 875
Figure 4. Actual rms errors and the fitted model for uncertainty due
Figure 3. Estimated measurement uncertainty, based on 1 standard to the assumed exponential size distribution.
deviation of noise for the CloudSat CPR.
where Kb is the Jacobian of the forward model reflectivi-
ties with respect to the parameters b̃ and Sb is the covari-
ance matrix for the parameters. The Jacobian Kb depends
on the estimated state x̂ and is computed at each iterative
step. At each step, the forward model is used to calculate re-
flectivity perturbations that result from perturbations of the
parameters α, β, γ , and σ . The ratio of each reflectivity per-
turbation to its parameter perturbation gives an element of
the Jacobian. The parameter perturbation affects the reflec-
Figure 5. Errors in reflectivity for the Ep and B8pr-45 shapes com-
tivity via changes to the corresponding particle scattering
pared to the B8pr-30 shape. Errors shown are total (bias + variance)
properties. The perturbed scattering properties are precom- and variance only.
puted with DDSCAT (Draine and Flatau, 1994) by using the
perturbed parameter to generate discrete dipole models fol-
lowing the process described in Wood et al. (2015). Wood et son against those from the discrete distributions. Errors are
al. (2015) found the resulting forward model uncertainties to negligible at high reflectivities but increase as reflectivity de-
be near 5 dB, increasing to as high as 15 dB for very broad creases (Fig. 4). Bias is negligible, and the total uncertainty
distributions. is modeled as
Sss
F quantifies uncertainties due to other assumptions and 2
sF2 (dB) = exp (− (dBZe + 14) /16) ,
limitations in the forward model reflectivity calculation. (17)
Wood et al. (2015) looked at uncertainties due to the ran-
dom component of dipole placement within discrete dipole reaching a maximum of 1 dB of uncertainty at −15 dBZe .
approximation (DDA) models for a particular particle shape Uncertainties due to shape were evaluated using the same
and found them negligible. Other sources include the as- SVI dataset to which the alternate particle shapes Ep (ellip-
sumption of the shape of the distribution as exponential, the soidal) and B8pr-45 (branched spatial particle with a larger
choice of particle shape, and the discretization and truncation aspect ratio than B8pr-30) from Wood et al. (2015) were
of the integrations over size distribution. applied to simulate reflectivities. These alternate shapes are
Errors due to the assumed exponential shape were evalu- constrained to have the same mass-dimension relationship as
ated using a dataset of 4080 SVI-measured, discrete, 5 min- used for the B8pr-30 particle model used in this work, so dif-
long snow PSDs from C3VP. Simulated reflectivities and ferences are due only to particle shape. Figure 5 shows total
snowfall rates were calculated using the B8pr-30 particle and variance-only rms errors. From these results we estimate
model and the Mitchell and Heymsfield (2005) terminal ve- the shape uncertainty to be 2 dB.
locity model. Exponential distributions were fit to the ob- Finally, truncation and discretization errors were evaluated
served discrete PSDs using orthogonal distance regression using the same SVI PSD dataset. These are errors that result
(Boggs et al., 1992; Jones et al., 2001) with uncertainty es- from the discrete treatment of the integrations over size dis-
timates per Wood et al. (2013). The fitted distributions were tribution, errors due to both the limited maximum DM in the
scaled in number concentration to match the snowfall rates particle model and in the limited resolution of the particle
simulated from the discrete distributions. The fitted distribu- model. Truncation errors were evaluated using analytic expo-
tions were then used to simulate reflectivities for compari- nential PSDs fitted to the SVI PSD dataset as described pre-
https://doi.org/10.5194/amt-14-869-2021 Atmos. Meas. Tech., 14, 869–888, 2021876 N. B. Wood and T. S. L’Ecuyer: What millimeter-wavelength radar reflectivity reveals about snowfall
viously. The particle model backscatter properties were aug- Fall-speed contributions are handled following Wood et al.
mented to DM = 40 mm by linearly extrapolating backscat- (2014). Snowfall rate uncertainties due to the assumed ex-
ter efficiencies, and then reflectivities were calculated using ponential form of the size distribution are determined using
integrations to both the standard (maximum DM = 18 mm) the SVI PSD dataset in an approach analogous to that for
and augmented size ranges. The bias and scatter of the trun- Eq. (17). In this approach, number concentrations for the fit-
cation errors were −0.1 and 0.42 dB. To evaluate discretiza- ted exponential distributions were scaled so that reflectivities
tion errors, a high-resolution version of the particle model were matched, and then snowfall rate errors were evaluated.
backscatter properties was created by interpolating backscat- The fractional uncertainty in snowfall rate was found to be
ter efficiencies so that the particle size resolution of the par-
ticle model was increased by a factor of 2. Reflectivities fP = −0.06 log (P ) + 0.05, (21)
were then calculated and compared against those from the
standard-resolution particle model. The bias and scatter of from which the necessary variance can be determined. Un-
the discretization errors were 0.00 and 0.02 dB. certainties from each of the four sources are treated as uncor-
related.
3.2 Snowfall rate and uncertainties
The snowfall rate P in units of liquid water depth per unit 4 Retrieval performance tests with ground-based radar
time is observations
DZ
M,max During C3VP, a vertically pointing W-band radar (the Jet
1 Propulsion Laboratory’s Airborne Cloud Radar, ACR) was
P (R) = N(DM , R)m (DM , R) V (DM , R) dDM , (18)
ρliq deployed on the ground at CARE. In all, about 28 h of ACR
DM,min
radar profiles of snowfall were recorded at approximately
where m(DM , R) is particle mass, V (DM , R) is fall speed, 2.8 s intervals. These observations represent 17 distinct snow
and ρliq is the density of liquid water. Particle mass is pro- events that occurred over 18 d between 3 November 2006 and
vided by Eq. (7). Fall speed is assumed to equal terminal 2 March 2007; however, most of the accumulations were con-
velocity, which is calculated from the model of Mitchell and centrated during nine of the events (Table 1). These observa-
Heymsfield (2005) using particle mass, the horizontally pro- tions include portions of three of the cases that were used
jected area from Eq. (8), and environmental pressure and to develop the snow particle microphysical models (cases
temperature from collocated observations. Uncertainties for SYN1, LES1, and LES2, Wood et al., 2015). Of the nearly
the estimated snowfall rate are determined in a manner simi- 36 000 ACR profiles in these observations, approximately
lar to that used for the forward model uncertainties. The total 7300 are from cases SYN1, LES1, and LES2. Further, as de-
variance SP is decomposed as scribed in Wood et al. (2015), ACR reflectivities from 12 of
the events between 2 December 2006 and 26 February 2007
SP = Sx̂,P + Sb̃,P + Sv,P + Sexp,P , (19) were used to constrain the snow particle models’ scattering
properties to give unbiased reflectivities. This overlap should
where the terms on the right represent the variances result- be kept in mind when evaluating the retrieved snowfall rates
ing from (1) retrieved state uncertainties, (2) particle model and estimated accumulation, but it should not substantially
parameter uncertainties, (3) uncertainties in the fall-speed affect the assessments of retrieval uncertainties, uncertainty
model and its parameters, and (4) assuming an exponential sources, and information content metrics that follow.
form for the PSD, respectively. The retrieval was applied to the ACR reflectivities ob-
Contributions from uncertainties in the retrieved state and served in the single range bin nearest the surface, at 197 m
in the particle model parameters are determined using lin- above ground level (AGL). Temperatures and pressures
earized error propagation (e.g., following a form like Eq. 16). needed by the retrieval to perform snow detection, calculate
For Sb̃,P , which gives the snowfall rate variance that re- fall speeds, and establish the a priori states were obtained
sults from uncertainties in the particle model parameters, this from nearby surface meteorology observations. Because of
means that the Jacobian Kb̃,P is calculated for the snowfall the short distance to the target range bin, attenuation along
rate with respect to the particle model parameters α, β, γ , the path was neglected. The retrieved snowfall rates produce
and σ , following the process described for the reflectivity Ja- a Z–S relationship that is most similar to that developed by
cobian in Sect. 3.1.2. Then Kulie and Bennartz (2009) for an aggregate particle model
denoted as the Hong (2007) aggregate (HA) (Fig. 7). For
Sb̃,P = Kb̃,P Sb KTb̃,P , (20) warmer temperatures and mid-range reflectivities, the Z–S
relationship becomes more similar to that of Liu (2008) and
where Sb is the covariance matrix for the particle model pa- the LR3 relationship of Kulie and Bennartz.
rameters as determined in Wood et al. (2015).
Atmos. Meas. Tech., 14, 869–888, 2021 https://doi.org/10.5194/amt-14-869-2021N. B. Wood and T. S. L’Ecuyer: What millimeter-wavelength radar reflectivity reveals about snowfall 877 Figure 6. Histograms of errors for truncation and discretization. Figure 7. Z–S values as a function of temperature for this retrieval compared against those from M07, Matrosov (2007); L08, Liu (2008); and KB09_LR3, KB09_HA, and KB09_SS, Kulie and Bennartz (2009). For comparisons, snowfall rate observations were obtained made note of the heavy snowfall, suggesting that both the at 1 min intervals from the Vaisala FD12P (Vaisala Oyj, FD12P and the ACR observed similar snowfall rates. Based 2002) and scaled to provide unbiased accumulations rela- on soundings, Environment Canada forecasts, and ACR op- tive to the nearby Dual Fence Intercomparison Reference, or erator observations, these anomalies appear to correspond to DFIR (Goodison et al., 1998). The retrieved ACR snowfall melting aloft, ice pellets, and freezing rain (Wood, 2011). rates, PACR , were matched to the nearest-in-time observed These conditions could also have been favorable for forma- snowfall rate, PFD12P . tion of large, heavy aggregates. It seems likely that the con- Time series of PACR and PFD12P show a high degree of ditions produced snowfall whose properties were strongly agreement over most of the observing period (Fig. 8a). This inconsistent with the particle properties assumed in the re- is not extraordinary given the dependence of the retrieval’s trieval, although reflectivities did not change substantially. particle microphysical and scattering properties on portions Accumulations were calculated from both PACR and of the C3VP data. Two notable exceptions occur near time in- PFD12P with and without the two anomalies described above dices 25 000 and 32 500, however, when the FD12P recorded (Fig. 9). Accumulations agree substantially during the first snowfall rates above 1 mm LWE h−1 , while the retrieved val- 16 h but diverge somewhat beyond that, again noting the de- ues are substantially smaller. Examining the time series of pendence of the retrieval’s assumed microphysical and scat- ACR reflectivities shows that the ACR did not observe high tering properties on portions of the C3VP data. With the reflectivities during these periods (Fig. 8b). The first of these anomalies included the final difference between the accumu- anomalies occurred on 22 February 2007 from 11:20 to lations is 2 mm. With the anomalies removed that difference 12:05 UTC, while the second occurred on 1 March 2007 be- is reduced to 0.7 mm. For individual events, absolute frac- tween 22:15 and 22:50 UTC. For both, the ACR operator tional differences between the ACR and FD12P accumula- https://doi.org/10.5194/amt-14-869-2021 Atmos. Meas. Tech., 14, 869–888, 2021
878                  N. B. Wood and T. S. L’Ecuyer: What millimeter-wavelength radar reflectivity reveals about snowfall

Table 1. Accumulations by event for the ACR retrievals. Duration shows the elapsed time of ACR observations for which retrievals were
performed. Fractional differences are relative to FD12P accumulations.

                                                                                         Accumulations
                                     Date                 Duration             ACR    FD12P                    Fractional
                                                             h                    mm LWE                   difference, %
                                     3 Nov 2006              0.98            0.065             0.11             −40.9 %
                                     2 Dec 2006              0.16            0.007             0.00                   –
                                     6 Dec 2006              4.00             0.86             0.80               7.5 %
                                     7 Dec 2006              1.08            0.038            0.093             −59.1 %
                                     8 Dec 2006              0.34            0.018             0.00                   –
                                     17 Jan 2007             0.09        9.3e − 04             0.00                   –
                                     19 Jan 2007             0.46            0.061             0.13             −53.1 %
                                     20 Jan 2007a            0.32            0.004        2.8e − 04              1329 %
                                     20 Jan 2007b            0.59            0.079               0.0                  –
                                     22 Jan 2007             4.29             0.89             0.87               2.2 %
                                     23 Jan 2007             0.76            0.017             0.00                   –
                                     26 Jan 2007             0.93            0.045            0.085             −47.1 %
                                     27 Jan 2007             3.36             0.57             1.06             −46.2 %
                                     19 Feb 2007             0.97             0.26             0.18              44.4 %
                                     22 Feb 2007             2.72            0.40c            0.23c              73.9 %
                                     26 Feb 2007             2.41             0.58             0.64               9.4 %
                                     1 Mar 2007              4.23            1.14c            1.57c             −27.4 %
                                     Season                  26.3            5.04c            5.77c             −12.6 %

                                   Two distinct events, indicated as a and b , occurred on 20 January 2007. c Accumulations
                                   adjusted to remove anomalies indicated in Fig. 8.

Figure 8. (a) Time series of snowfall rates retrieved from ACR reflectivities and observed. (b) Corresponding time series of ACR reflectivities.
Each time index indicates a 2.8 s observation by the ACR. Snowfall rates retrieved for the ACR used the reflectivity in the range bin nearest
the surface, at 197 m AGL.

Atmos. Meas. Tech., 14, 869–888, 2021                                                                        https://doi.org/10.5194/amt-14-869-2021
N. B. Wood and T. S. L’Ecuyer: What millimeter-wavelength radar reflectivity reveals about snowfall 879
Figure 10. Instantaneous fractional uncertainties in snowfall rate.
The central line shows mean fractional uncertainties and the error
bars show ±1 standard deviation.
extends from about 145 % to 190 % (Fig. 10). The frac-
tional uncertainties generally increase with increasing snow-
Figure 9. Snow accumulations computed from PACR and PFD12P . fall rate, but above 0.5 mm LWE h−1 the means and stan-
The accumulations are for 17 snow events observed by the ACR on dard deviations diminish and result from only a small num-
18 d between 3 November 2006 and 2 March 2007, but accumula- ber of samples in each bin. For comparison, uncertainties
tions are principally from nine events (Table 1). The events were for FD12P precipitation rates at 5 min resolution were esti-
concatenated sequentially in time, and the time axis indicates the mated at 0.03 mm h−1 for rates less than 0.05 mm h−1 , 50 %
cumulative time over all events. (a) Accumulations from all obser- for rates up to 0.5 mm h−1 , and 30 % for rates larger than
vations and corresponding retrieval results, (b) accumulations with 0.5 mm h−1 by Wood et al. (2014) based on comparisons
two anomalous periods identified in Fig. 8 removed, and (c) frac- against the Precipitation Occurrence Sensor System.
tional differences in accumulations shown in (b), with distinct col- To evaluate the importance of each source of uncertainty,
ors indicating individual events.
variances from each of the sources from Eq. (19) (retrieved
state, microphysical parameters, fall-speed parameterization,
or exponential distribution) were extracted separately, and
tions can range to 50 % and upwards (Table 1), but these large then fractions of total variance were calculated. To allow the
values are associated mainly with events with small accumu- trends in each source to be shown as a function of snowfall
lations. For events with larger accumulations, the absolute rate (Fig. 11), the fractions were binned by snowfall rate and
fractional differences are mostly below 30 %. At seasonal averaged. As snowfall rates increase up to 0.5 mm h−1 , the
timescales, the random components in event-total accumu- variance due to the retrieved state becomes a more signifi-
lations are likely uncorrelated, leading to offsetting errors cant contributor to the total variance, while the contributions
when calculating seasonal accumulations. The time series from the other sources diminish. The contribution due to the
of absolute fractional differences between the ACR-derived assumed exponential PSD shape is not significant.
and FD12P accumulations begins with large fractional differ- The instantaneous uncertainties for snowfall rate include
ences. Within 5 h and over the initial three events, the frac- uncertainties due to random errors and biases in the retrieval
tional differences reduce to less than 5 % and then remain components and observations. For accumulations or mean
below 20 % for the remainder of the season. rates evaluated over longer time periods, errors due to ran-
dom sources may be reduced and remaining errors can be
4.1 Snowfall rate uncertainties more representative of biases in the retrieval. The reduc-
tions in random errors depend on their correlations in time,
Uncertainties in instantaneous snowfall rate estimates, taken however (e.g., Taylor, 1997). When random errors within
to be the square root of the total variance evaluated as shown events are assumed perfectly positively correlated, end-of-
in Eq. (19), were evaluated by binning the fractional uncer- event PACR accumulations have fractional uncertainties from
tainties by snowfall rate and then averaging and taking stan- 1.5 % to 52.4 % (Fig. 12). In actuality, the random error
dard deviations. Mean fractional uncertainties range from sources likely decorrelate with increasing separation in time.
150 % to 185 %, and the range for ±1 standard deviation While the scales for these decorrelations are not known, with
https://doi.org/10.5194/amt-14-869-2021 Atmos. Meas. Tech., 14, 869–888, 2021880 N. B. Wood and T. S. L’Ecuyer: What millimeter-wavelength radar reflectivity reveals about snowfall
larger accumulations and durations (Fig.12). Of the seven
events with accumulations larger than 0.2 mm and dura-
tions of 1 h and longer, the PFD12P accumulations for six
fall within or near the uncertainty bounds of the PACR ac-
cumulations with perfectly correlated errors, while four out
of seven are within or near the much narrower bounds for
errors with decorrelations. This result is also true for the
season as a whole. For the duration of 26.3 h and accumu-
lation of 5.05 mm from PACR , the difference compared to the
PFD12P seasonal accumulation of 5.77 mm is −12.6 %. The
difference is similar to the PACR accumulation uncertainty of
11.7 % for decorrelated errors.
4.2 Information content
The optimal estimation results allow easy calculation of a
Figure 11. Instantaneous fractional variances for snowfall rate re- number of metrics that quantify retrieval performance in
solved by source. terms of information content (Rodgers, 2000; Shannon and
Weaver, 1949). These include the averaging kernel matrix
−1
A = K̂T S−1 K̂ + S−1
a K̂T S−1
K̂, (22)
the Shannon information content
1
H = log2 Sa Ŝ−1
x , (23)
2
and the degrees of freedom for signal
dS = Tr (A) . (24)
Briefly, the diagonal values of A indicate the degree to which
the corresponding retrieved state variables are determined by
the observations (values nearer 1) versus by the a priori (val-
ues nearer 0). H measures how well the observations serve
to narrow the possible retrieved states in comparison to the
Figure 12. End-of-event accumulations and uncertainties. The a priori state. Its value can be interpreted as describing the
PACR accumulation uncertainties are estimated assuming intra- binary bits of resolution of the observing system (L’Ecuyer
event errors are perfectly correlated (orange) and decorrelated us-
et al., 2006). dS quantifies the number of independent quan-
ing a negative exponential model with a decorrelation scale of 0.5 h
(purple). PFD12P accumulations (blue-green) are shown for com-
tities that are determined by the observations. See Rodgers
parison except for those equal to zero, which are omitted. For clar- (2000) for a more complete discussion in the context of re-
ity, the PACR accumulations are plotted at ±0.02 h (purple/orange) trieval theory.
of their actual durations. For the ACR retrievals, values for H vary between 0.4 and
1.2 (Fig. 13), indicating that the measurements resolve be-
tween 1.3 and 2.3 distinct states. Values for ds show that the
even a modest amount of decorrelation in the errors the un- retrieval produces somewhat less than one independent piece
certainties are reduced substantially. After applying a neg- of information that is significant compared to the measure-
ative exponential decorrelation model with a decorrelation ment and forward model uncertainties. Figure 13c, d show
scale of 0.5 h to intra-event errors, the fractional uncertain- the diagonal
elements of A. While the element relevant to
ties at the ends of individual events are 1.3 % to 18.8 %. The λ, A log (λ) , is consistently positive, the element for No ,
most significant reductions due to decorrelation occur with A log (N0 ) , is near zero and is at times negative. These re-
the longer-duration events. The end-of-season PACR accu- sults show that log (λ) is moderately to strongly constrained
mulation uncertainties, calculated assuming inter-event un- by the reflectivity observation, while log (N0 ) is largely de-
certainties are uncorrelated, are reduced from 64.9 % for per- pendent on the a priori constraint.
fectly correlated to 11.8 % for decorrelated intra-event errors. The size distribution plays a significant role in determin-
Agreement between observed PFD12P event accumulations ing the values of these metrics. Information content H in-
and those from PACR generally improves for events with creases as the distribution narrows (Fig. 14a). The increase
Atmos. Meas. Tech., 14, 869–888, 2021 https://doi.org/10.5194/amt-14-869-2021N. B. Wood and T. S. L’Ecuyer: What millimeter-wavelength radar reflectivity reveals about snowfall 881
in H accompanies a substantial increase in the magnitude of
the sensitivity of the forward model to log (λ) (Fig. 14b). In
contrast, the sensitivity to log (N0 ) has a constant value of
10 owing to the reflectivity in dBZe being a linear function
of log (N0 ) (and so is not shown in Fig. 14). This increased
sensitivity to log (λ) allows the observed reflectivity to better
constrain the retrieved
state, particularly the value of log (λ).
As a result, A log (λ) increases from 0.4 to 0.95 as λ in-
creases (Fig. 14c). The behavior of A log (N0 ) (Fig. 14d) is
quite different. The values are small and are positive for small
values of λ but become negative as λ increases. This be-
havior results from the positive a priori correlation between
log (λ) and log (N0 ) and the opposing signs of the sensitivi-
ties of dBZe to these two variables. While the forward model
is strongly sensitive to log (λ), its sensitivity to log (N0 ) is
3–4 times smaller in magnitude. Consequently, the retrieved
value of log (λ) is influenced more strongly by the observa-
tions, while the retrieved value of log (N0 ) is influenced more
by the a priori estimate of the state. This difference is re-
flected in panels (c) and (d) of Fig. 14.
5 Discussion and conclusions
While millimeter-wavelength, single-frequency radar reflec-
tivity observations alone would seem to have limited utility
for retrieving snowfall properties, the results herein demon-
strate capabilities for quantifying snowfall rate, accumula-
tion, and aspects of the snow PSD. The results were obtained
by applying the radar observations to constrain a priori in-
formation appropriate to a broad range of snowfall regimes.
The results indicate that the approach would provide use-
ful information when applied to observations such as those Figure 13. Distributions of information content metrics for the ACR
from satellite-borne radars, which observe a range of snow- retrieval.
fall regimes and for which radar observables are limited to
reflectivity.
The results demonstrate the ability of the retrieval to pro-
duce reliable estimates of snow accumulation, particularly
over timescales involving multiple events and more than
several hours of snowfall duration, in spite of large uncer-
tainties in retrieved instantaneous snowfall rates. For the
C3VP season, the retrieval reproduced the observed accumu-
lation within 13 % at the end of the season. These results
were achieved by omitting two particular time periods dur-
ing which the retrieval’s particle property assumptions were
likely very inconsistent with the observed snowfall. Without
this adjustment, the end-of-season absolute difference was
18.9 %, illustrating the need for adequate discrimination of
the precipitation phase in the retrieval process. Keeping in
mind that certain a priori assumptions of the retrieval were
also sourced from the C3VP observations, these results are
probably best viewed as indicating proper function of the re-
trieval. The time series of seasonal accumulation shows that Figure 14. Information content metrics and the forward model Ja-
cobian as functions of λ.
while the initial fractional differences reach almost 80 %, the
differences diminish with time and increasing accumulation,
https://doi.org/10.5194/amt-14-869-2021 Atmos. Meas. Tech., 14, 869–888, 2021882 N. B. Wood and T. S. L’Ecuyer: What millimeter-wavelength radar reflectivity reveals about snowfall reaching values of less than 5 % within 5 h. These results are Table 2. Contributions to uncertainties in forward-modeled and ob- partly due to offsetting errors between events; however, for served reflectivity. individual events, best agreement between the observed and retrieved snow accumulations were achieved for events that Source Reflectivity, dB were longer in duration and produced more substantial ac- Observed reflectivity
N. B. Wood and T. S. L’Ecuyer: What millimeter-wavelength radar reflectivity reveals about snowfall                                      883

Appendix A: Retrieval interpretation

To interpret the behavior of the retrieval, we refer to the dis-
cussion of the information
                              content metrics (Sect. 4.2). The
small values for A log (N0 ) indicate its value is determined
primarily by the a priori information and the negative signs
do not fit the normal paradigm used to explain the A matrix.
Their explanation reveals details of the significant behavior
of this retrieval. In the application
                                    of the retrieval to a single
radar bin, the value of A log (N0 ) is given by
                 "
                         ∂dBZ 2
                                           e
A log (N0 ) = s 2 log N̂0

                                                 +
                                   ∂ log (N0 )
                                                             #
                                ∂dBZ   ∂dBZ
                                               e          e
             s log N̂0 , log λ̂
                                       ∂ log (N0 ) ∂ log (λ)
            h             i−1
              sy2 (dBZe )     ,                                (A1)
where the carets indicate retrieved values. In the first set of        Figure A1. Schematic illustration of the retrieval process. The solid
brackets on the right side, the sign of the first term is clearly      line represents the initial state of the retrieval, while the dashed
positive, while that of the second term depends on the signs           line shows the adjusted state assuming the initial state overestimates
                                                                       the observed reflectivity. The arrows labeled δ log (λ) and δ log (N0 )
of the covariance and the two partial derivatives, which are
                                                                       show the expected responses of the retrieval based on the sensitiv-
the elements of the Jacobian of the forward model. As was
                                                                       ities of the forward model. The arrow labeled s (log (No ) , log(λ))
shown earlier (Fig. 14), ∂ ∂dBZ    e                      ∂dBZe
                              log(N0 ) is positive while ∂ log(λ) is   shows the response due to positive covariance between λ and N0 .
negative. The covariance for the retrieved state changes very
little from the a priori covariance, which is positive and repre-
sents a substantial correlation between log (λ) and log (N0 ).            For small λ (broad distributions), the magnitude of ∂∂dBZ    e
                                                                                                                                   log(λ)
This second term, then, is negative       and as the magnitude of     is relatively small, so the covariance-driven adjustment is
 ∂dBZe
∂ log(λ)  increases, the sign of A   log (N 0 ) changes from pos-      small and does not overcome the initial reduction in log (N0 ).
itive to negative.                                                     In these cases, log (N0 ) decreases in response to a positive
    These terms represent competing influences on the re-              error in the modeled reflectivity. This net response is consis-
trieved value of log (N0 ). These competing influences arise           tent
                                                                           with the sensitivity of the forward model to log (N0 ) and
from the a priori covariance and from the Jacobian of the for-         A log (N0 ) is positive. For large λ (narrower distributions),
ward model. The positive covariance requires that a positive           the magnitude of ∂∂dBZ    e
                                                                                             log(λ) is larger. The covariance-driven ad-
adjustment in log (λ) be accompanied by a positive adjust-             justment is larger also and does overcome the initial reduc-
ment in log (N0 ). In contrast, the Jacobian terms have differ-        tion in log (N0 ). As a result, log (N0 ) increases in response
ing signs. If the difference between the observed and forward          to the positive error in the modeled reflectivity. Since this
model reflectivity calls for a positive adjustment to log (λ),         net response
the corresponding adjustment to log (N0 ) would be negative.                         opposes the sensitivity of the forward model,
                                                                       A log (N0 ) is negative.
    Figure A1 shows this process schematically. The size dis-             The combination of the strong positive covariance be-
tribution that represents the initial state is shown by the soid       tween log (N0 ) and log (λ) and the comparatively weak sen-
line. Assuming that the forward modeled reflectivity for this          sitivity of the reflectivity to log (N0 ) limits the behavior of
state overestimates the observed reflectivity (a positive er-          the retrieval. For narrower distributions, the retrieval is pre-
ror), two responses are possible: log (λ) could be increased,          vented from simultaneously increasing log (λ) and decreas-
narrowing the distribution; and log (N0 ) could be decreased,          ing log (N0 ) in response to a positive error in reflectivity.
reducing the amplitude of the distribution. Absent the covari-         The opposing behavior, decreasing log (λ) and increasing
ance between log (λ) and log (N0 ), the retrieval would ap-            log (N0 ) in response to a negative error in reflectivity, is
ply both adjustments, likely giving more weight to the ad-             also restricted. While correct in a climatological sense since
justment of log (λ) because of the stronger sensitivity of the         log (λ) and log (N0 ) are positively correlated, in nature there
forward model to that variable. These adjustments are repre-           are likely scenes for which such responses would give a more
sented by the heavy arrows labeled δ log (N0 ) and δ log (λ).          accurate retrieval. This reasoning demonstrates how other
Because of the positive covariance between log (N0 ) and               measurements, specifically those with better sensitivity to
log (λ), however, an increase in log (λ) produces an oppos-            log (N0 ), would benefit the retrieval.
ing response that increases log (N0 ), shown by the upward-
pointing heavy arrow. The resulting size distribution is shown
by the dashed line.

https://doi.org/10.5194/amt-14-869-2021                                                       Atmos. Meas. Tech., 14, 869–888, 2021
You can also read