Making sense of recommendations - Michael Yeomans
←
→
Page content transcription
If your browser does not render page correctly, please read the page content below
Received: 22 March 2018      Revised: 8 January 2019   Accepted: 8 January 2019
DOI: 10.1002/bdm.2118

RESEARCH ARTICLE

Making sense of recommendations

Michael Yeomans1                     |   Anuj Shah2       |   Sendhil Mullainathan2              |   Jon Kleinberg3

1
 Negotiations, Organizations, and Markets,
Harvard Business School, Boston, MA, USA          Abstract
2
 Behavioral Science, University of Chicago        Computer algorithms are increasingly being used to predict people's preferences and
Booth School of Business, Chicago, IL, USA
                                                  make recommendations. Although people frequently encounter these algorithms
3
 Department of Computer Science, Cornell
University, Ithaca, NY, USA
                                                  because they are cheap to scale, we do not know how they compare to human judg-
Correspondence                                    ment. Here, we compare computer recommender systems to human recommenders in
Michael Yeomans, Negotiations,                    a domain that affords humans many advantages: predicting which jokes people will
Organizations, and Markets, Harvard Business
School, Boston, MA.                               find funny. We find that recommender systems outperform humans, whether
Email: myeomans@hbs.edu                           strangers, friends, or family. Yet people are averse to relying on these recommender
                                                  systems. This aversion partly stems from the fact that people believe the human rec-
                                                  ommendation process is easier to understand. It is not enough for recommender sys-
                                                  tems to be accurate, they must also be understood.

                                                  KEY W ORDS

                                                  algorithms, decision‐making, machine learning, recommendations

1   |   I N T RO D U CT I O N                                                  people to provide good recommendations—83% of people trust
                                                                               recommendations from friends and family; 66% trust online opinions
Computer algorithms can make all manner of predictions. And over               of strangers (Nielsen Company, 2015). But given that algorithmic
the past two decades, the scope of these predictions has broadened             recommendations now play a larger role in curating our experiences,
significantly. Most notably, algorithms now predict people's prefer-           it seems natural to ask how well recommender systems perform.
ences across a variety of domains. They make recommendations about             Specifically, how do recommender systems compare to human
which movies and books people will like, which products they should            recommenders?
buy, and which restaurants they should visit (Adomavicius & Tuzhilin,               Simple recommender systems, such as “collaborative filtering”
2005; Resnick & Varian, 1997). These recommender systems help                  algorithms, do not need any information about the content of what
people in many markets find the items they want by reducing search             they are recommending (systems can incorporate content, but do
costs (Ansari, Essegaier, & Kohli, 2000; Brynjolfsson, Hu, & Simester,         not need to; Lops, De Gemmis, & Semeraro, 2011; Gomez‐Uribe &
2011). And recommender systems can have a significant impact on                Hunt, 2016). Instead, they learn which experiences are statistically
individual decision‐making (Adomavicius, Bockstedt, Curley, & Zhang,           similar (Breese, Heckerman, & Kadie, 1998; Koren & Bell, 2011). For
2018) and firm revenues (Bodapati, 2008; De, Hu, & Rahman, 2010).              example, to recommend a movie, these systems would start with a
In some cases, a company will even tie its reputation to the strength          database of movies that have been rated by multiple people. Movies
of its recommendations, as with the Netflix Prize for building a               are said to be “similar”if they have correlated ratings (the simplest
better recommender system (Bell & Koren, 2007; Gomez‐Uribe &                   similarity score would be to compute the Pearson correlation of rat-
Hunt, 2016).                                                                   ings for two movies across all people who rated both movies). The sys-
    Of course, people have long relied on recommendations to                   tem would then collect some ratings for each new users and
inform their choices, but these recommendations have typically                 recommend a movie whose ratings correlate strongly with the movies
come from other people (Berger, 2014; Bonaccio & Dalal, 2006).                 that user rated highly. The same algorithm could make recommenda-
Whether deciding where to eat, what movie to watch, or even                    tions for any similar data set, regardless of the domain (e.g., restau-
whom to date, we seek out the opinions of other people: friends,               rants, books, and cars). Clearly, such general‐purpose algorithms are
family, and even strangers on the internet. And people trust other             convenient. But are they accurate?

J Behav Dec Making. 2019;1–12.                         wileyonlinelibrary.com/journal/bdm                       © 2019 John Wiley & Sons, Ltd.      1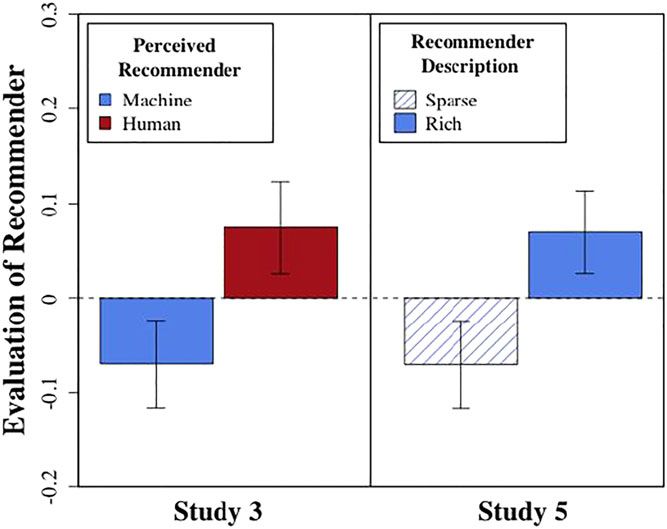
2                                                                                                                                      YEOMANS    ET AL.

    Recommender systems share some clear advantages over human                does not use this kind of content‐based input—it does not draw on
recommenders. These algorithms have perfect memory and execute                humans' domain expertise (it is also worth noting that none of the
consistent computation. However, people also seem to have many                authors have special expertise in being funny). The algorithm has no
advantages, particularly for predicting subjective preferences. They          model of what features make a joke funny, nor does it parse the lan-
often have rich information about their recipients—we often seek              guage of the jokes. It relies only on correlations between ratings of
and receive recommendations from the people closest to us. Further-           jokes. Our first finding (Studies 1A‐1B) shows that, despite their disad-
more, people have direct experience with the content of the items             vantages, recommender systems outperform human recommenders,
(e.g., they know the plot of a movie or the melody of a song). By con-        even in a domain that might be uniquely human. They are better than
trast, recommender systems operate in the dark. They have limited             humans at picking jokes that people find funny. This is true regardless
information about the unique tastes of the recipient and little under-        of whether the human recommenders are strangers, friends, family, or
standing of what they are recommending.                                       significant others.
    In this paper, we present the first rigorous test of whether recom-           However, our second result highlights a familiar tension: People
mender systems or humans more accurately predict preferences. In              are averse to using recommender systems. We find that when people
our studies, we collect recommendations from humans and algorithms,           are making recommendations for others, they are reluctant to use
both trying to predict which jokes a given person will like. We then          input from a recommender system that would have improved their
compare these recommendations to the jokes those people actually              recommendations (Study 2). Moreover, we find that people would
liked. Initial research in this area has not provided a definitive answer     rather receive recommendations from a human than from a recom-
on which recommender is superior because no study has measured                mender system (Study 3). This echoes decades of research showing
whether people actually prefer the recommended items (Krishnan,               that people are averse to relying on algorithms, in which the primary
Narayanashetty, Nathan, Davies, & Konstan, 2008; Sharma & Cosley,             driver of aversion is algorithmic errors (for a review, see Dietvorst,
2015; Sinha & Swearingen, 2001).                                              Simmons, & Massey, 2015). This might also explain some of the aver-
    We chose joke recommendations as our test domain for several              sion to recommender systems, but our final two studies suggest that
reasons. First, humor shares many distinctive features of other prefer-       there is an additional factor that affects trust, even when the error is
ence domains. As with other matters of taste, humor is highly subjec-         held constant.
tive. As in other domains, there are genres of humor and                          Prior research suggests that people want recommender systems
heterogeneity in people's preferences for those genres (some people           to provide recommendations that they can make sense of (Herlocker,
appreciate political humor, others find ribald jokes funny, etc.). More-      Konstan, Terveen, & Riedl, 2004; McNee, Riedl, & Konstan, 2006). But
over, it is a domain with which most people have significant experi-          simple collaborative filtering recommender systems might be particu-
ence. Humor plays a role in many social interactions in our personal          larly difficult to understand because they do not rely on content or
(Bressler, Martin, & Balshine, 2006; Curry & Dunbar, 2013; Martin,            on a human to articulate a model of what features guide preferences
Puhlik‐Doris, Larsen, Gray, & Weir, 2003) and professional lives (Bit-        within a domain. Indeed, we find that people think recommendations
terly, Brooks, & Schweitzer, 2017; Romero & Cruthirds, 2006; Warren,          are easier to understand when they come from a human instead of
Barsky, Mcgraw, & MacInnis, 2018; Warren & McGraw, 2016). The                 an algorithm (Study 4). However, these feelings of subjective under-
demands of these interactions will often require people to predict            standing are often quite malleable, even when people know something
their listeners' reactions to jokes. In that sense, this domain is a famil-   is a machine (Fernbach, Sloman, Louis, & Shube, 2012; Keil, 2003;
iar perspective‐taking task, where common human intuition may be at           Rozenblit & Keil, 2002; Tintarev & Masthoff, 2011). Accordingly, we
an advantage.                                                                 find that people are less averse to recommender systems when you
    A practical reason for choosing this domain is that it is easy to         simply explain how they work (Study 5). Thus, it is not enough for
read and respond to several jokes in one sitting. Doing so with other         algorithms to be more accurate, they also need to be understood.
preference domains (e.g., movies, books, restaurants, and dating part-            This paper therefore makes three contributions. First, we test how
ners) is less practical—instead, previous research in this domain has         human and algorithmic judgment compare when predicting prefer-
relied on proxy measures of recommender performance—predicted                 ences, which prior research has overlooked, but which is a dominant
liking of novel items, or else remembered liking of past items (Krishnan      application of algorithms today. Second, the algorithms that we study
et al., 2008; Sharma & Cosley, 2015; Sinha & Swearingen, 2001). Jokes         here do not rely on content or human experts to identify the features
are an ideal domain for having people experience a common set of              that are relevant for making predictions. Finally, we show that aver-
novel instances and make several ratings and recommendations in a             sion to algorithms does not merely stem from the content of the rec-
relatively short time frame.                                                  ommendations. Instead, it also depends on whether people feel like
    For our studies, we created a simple recommender system solely            they can understand the algorithms.
on the most basic principles of collaborative filtering— that is, by only         For all studies, sample sizes were set in advance, and analyses
using people's preference ratings for individual items. More sophisti-        were not conducted until all data were collected. A priori, we also
cated systems could combine this kind of data with other inputs that          determined five reasons for excluding participants: (1) They did not
capture humans' domain knowledge. For example, a more complex                 pass the initial attention check (see Appendix S1), (2) they did not
model could use human‐generated labels of the items' features (e.g.,          complete the study, (3) they did not follow instructions, (4) they failed
genre, author, and year) along with the ratings data (Gomez‐Uribe &           a manipulation check (see Appendix S2), or (5) they rated all jokes as
Hunt, 2016; Lops et al., 2011). But as a conservative test, our system        equally funny. The full set of all measures from every study (including
YEOMANS        ET AL.                                                                                                                                 3

exclusion criteria) is described in Supporting Information, and all data           The algorithm was trained on a dataset of joke ratings from 454
and analysis code in R (R Core Team, 2018) are posted on https://            participants culled from this and other studies we had run using this
osf.io/8nbr2/.                                                               set of 12 jokes. Of course, in forming the predictions for a particular
                                                                             person, we would not want to use the person's own data in these
                                                                             regressions. To avoid this problem, we use “leave‐one‐out cross‐
2     |       STUDY 1                                                        validation”: When forming predictions for a particular user, the model
                                                                             is trained on data from all other users. This ensures that we are not
2.1       |   Study 1A Methods                                               making predictions for users who were used to train the model. Thus,
                                                                             the data are recycled so that every subject is used for both testing and
One hundred fifty participants (75 pairs) were recruited from the            training. Both human and machine recommenders made predictions
Museum of Science and Industry in Hyde Park, Chicago. Twenty‐eight           using the same −10 to +10 scale that participants used to rate the
participants (14 pairs) were dropped due to incomplete responses or          jokes (and when the algorithm predicted a value outside this range,
not following instructions, leaving 122 participants (61 pairs). All pairs   the prediction was coerced to the closest boundary). Prediction error
had come to the museum together, and we confirmed that most pairs            was defined as the squared difference between each prediction and
knew each other very well. Thirty‐six percent of pairs were married to       its true value (i.e., the target's actual rating of the joke), where larger
one another, another 18% were unmarried couples, and another 30%             errors indicate less accurate predictions. We compared the accuracy
were immediate family. By another measure of familiarity, 71% of par-        of predictions from human recommenders and our recommender sys-
ticipants had known each other for longer than 5 years and 84% lon-          tem. Additionally, our results are substantively identical if we define
ger than 2 years.                                                            prediction error as mean absolute deviation (i.e., L1‐distance rather
      Every participant both received recommendations (i.e., was a “tar-     than L2‐distance), though we omit those analyses here for brevity.
get”) and made recommendations (i.e., was a “recommender”). Partici-
pants were seated at separate computer terminals where they could
not see or hear each other. First, participants completed the ratings        2.2    |   Study 1A Results
phase of the experiment. They saw 12 jokes (taken from Goldberg,
Roeder, Gupta, & Perkins, 2001) presented in a random order; all par-        Our recommender system made predictions that were “yoked” to
ticipants saw the same jokes. Participants rated each joke on a slider       human recommenders' predictions. That is, for a given target, human
scale from −10 (not funny at all) to +10 (extremely funny). The slider       recommenders made eight predictions based on the four sample joke
was centered at 0 to begin, but participants were required to make a         ratings. Our recommender system did this as well. We then computed
response for each question to advance.                                       the average error across these eight predictions and compared the
      Next, participants completed the recommendation phase of the           average error for human recommendations to the average error for
experiment (see Appendix S3 for stimuli). Participants switched com-         machine recommendations. The recommender system was more accu-
puter terminals, where they saw four of the jokes (the “sample set”),        rate (RMSE = 4.281, bootstrapped 95% CI [4.095, 4.481]) than human
randomly selected from the full set. They were also shown their part-        recommenders (RMSE = 5.586, bootstrapped 95% CI [5.314, 5.890]),
ner's ratings for those sample jokes. They then predicted their part-        t(121) = 6.90, P < 0.001. This was even true when we limited our com-
ner's ratings for the remaining eight jokes (the “test set”), using the      parisons to focus specifically on people who were married to their
exact same slider scale as their partner. Thus, we had targets' actual       partner (human RMSE = 5.982, bootstrapped 95% CI [5.517, 6.518];
ratings of the test jokes and recommenders' predictions about the tar-       machine RMSE = 4.515, bootstrapped 95% CI [4.192, 4.872]),
gets' ratings of the test jokes (note that recommenders never saw tar-       t(43) = 4.29, P < 0.001. And it was true for people who had known
gets' ratings of the test jokes). Finally, we asked participants some        their partner for more than five years (human RMSE = 5.850,
basic demographic questions (including how they knew one another)            bootstrapped 95% CI [5.517, 6.222]; machine RMSE = 4.493,
and some exploratory measures concerning their lay beliefs about             bootstrapped 95% CI [4.271, 4.740]), t(86) = 5.21, P < 0.001.
algorithms.                                                                        One concern might be that the human recommenders simply
      Our algorithm runs a series of ordinary least squares regressions      were not trying very hard at the task. But we do see evidence that
to determine which sample jokes are most similar to each test joke           human recommenders were trying to be accurate. For instance, prior
(Sarwar, Karypis, Konstan, & Riedl, 2001). For each of the eight test        research    (Eggleston,   Wilson,   Lee,   &   Gilbert,   2015;    Gilbert,
jokes, it runs a separate linear regression where the dependent vari-        Killingsworth, Eyre, & Wilson, 2009; Hoch, 1987) suggests that people
able is a user's rating of the test joke and the independent variables       can make accurate recommendations simply by acting as “surrogates”
are their ratings of the four sample jokes. This regression assigns          for the target (i.e., the person receiving the recommendation). In this
weights to each of the four sample jokes. The sample joke ratings            case, surrogation would mean that recommenders predict that the tar-
can then be used to predict the user's ratings for the test joke. This       get would give a joke the same rating as themselves. In our study,
simple, easy‐to‐implement linear regression model will be used as            human recommenders outperformed mere surrogation (RMSE = 6.495,
the main comparison against human recommenders throughout our                bootstrapped 95% CI [6.256, 6.749]), t(121) = 5.81, P < 0.001. The fact
experiments in this paper. However, we will also discuss how other           that our participants outperformed this easy benchmark suggests that
types of collaborative filtering algorithms might perform in the robust-     they were invested in the task. But they could not match the perfor-
ness section below.                                                          mance of the recommender system.
4 YEOMANS ET AL.
To our knowledge, this is the first experiment that compares peo- (RMSE = 4.645, bootstrapped 95% CI [4.562, 4.728]) than humans
ple's preference ratings of novel items recommended by machines and within the “no information”condition (RMSE = 6.087, bootstrapped
humans. We find that recommender systems are more accurate pre- 95% CI [5.901, 6.282]), within‐subjects t(247) = 15.22, P < 0.001, as
dictors. In this design, our recommender system even outperformed well as within the “base rate”condition (RMSE = 5.873, bootstrapped
people who know each other well. But perhaps knowing each other 95% CI [5.710, 6.044]), within‐subjects t(271) = 12.87, P < 0.001.
is what interfered with participants' accuracy. Prior work has found Moreover, in a between‐subjects comparison across the two condi-
that predictions of other people's preferences can sometimes be tions, humans recommenders were only slightly more accurate when
clouded by knowing each other well, if that extra knowledge distracts they were given base rate information t(518) = 1.39, P = 0.166. This
judges from the most diagnostic features (Davis, Hoch, & Ragsdale, suggests that the recommender system outperforms humans even
1986; Hall, Ariss, & Todorov, 2007; Lerouge & Warlop, 2006). If so, when they have some extra information about how people use the
then a fairer test may be to have humans make recommendations scale. It is possible that this was not the most useful information—
for strangers. Participants were also disadvantaged because the rec- we could have given participants the raw distribution, or summary sta-
ommender system “sees”more ratings in the database. As a result, tistics about the variation for each joke. In Study 2, we give partici-
the recommender system can calibrate its use of the scale better than pants even more information—the machine prediction itself.
human recommenders can. The next study addresses both of these
issues.
2.5 | Robustness and discussion
2.3 | Study 1B Methods Taken together, Studies 1A and 1B clearly suggest that recommender
systems can outperform human recommenders, even for a highly sub-
Five hundred eighty‐one participants from Amazon.com's Mechanical
jective domain, and regardless of whether the recommendations are
Turk (MTurk) platform completed our study. Thirty‐four failed the
made for strangers or for close others.
attention check, and three gave the same rating to every joke, leaving
However, there may be three lingering concerns about this find-
544 participants for the analyses. Participants served only as recom-
ing. First, did we select an appropriate domain for comparing human
menders, not targets. The targets were instead drawn from a pool of
recommenders and recommender systems? One worry might be that
100 previous participants who had rated the same 30 jokes in other
people simply do not have very heterogeneous preferences for jokes.
experiments.
If people had homogenous preferences in this domain, then our result
Each participant in our study made recommendations for five tar-
would be little more than a repackaged wisdom‐of‐crowds effect
gets randomly drawn from the pool. For each target, participants were
(Clemen, 1989; Galton, 1907). Humans might excel at detecting idio-
shown the text of four sample jokes, along with the target's ratings of
syncratic preferences, but this domain would prevent them from being
those jokes. Then, for each target, participants predicted the ratings of
able to do so. Meanwhile, our recommender system would excel
two test jokes (10 total predictions). Thus, participants saw all 30 jokes
because of the statistical advantages of averaging, but not necessarily
exactly once, but the order of the jokes (and whether a joke was given
because collaborative filtering allowed it to tailor its recommendations
as a sample or test joke) was randomly determined for each partici-
to people's idiosyncratic preferences (Hoch, 1987). Put simply, if we
pant. Accuracy was incentivized by giving a $20 bonus to the most
selected a domain with insufficient heterogeneity, then our results
accurate participant. At the end of the study, participants rated each
would not tell us whether collaborative filtering outperformed
joke.
humans, and it would not have given humans a chance to excel.
There were two conditions in this study. Half of the participants
To test this possibility, we compared the recommender systems'
were assigned to the “base rate”condition, where they were told
predictions to a benchmark of simple averaging. Specifically, each time
the mean rating for each test joke. That is, when predicting a target's
the recommender system predicted a target's rating for a joke, we
rating for a joke, they were shown the average rating for that joke
compared that predicted rating to the average rating for the joke
across all other targets in the database. This would give a basic sense
across all participants (except the target) in the database. In Study
to participants of how to calibrate their use of the scale. The other half
1A, the recommender system (RMSE = 4.281, bootstrapped 95% CI
of participants were assigned to the “no information”condition, which
[4.095, 4.481]) outperformed the simple average (RMSE = 4.606,
was essentially identical to the paradigm used in Study 1A. Machine
bootstrapped 95% CI [4.438, 4.786]), t(121) = 3.39, P < 0.001. This
recommendations were produced using the same method as in Study
was also true for Study 1B (machine: RMSE = 4.645, bootstrapped
1A (i.e., a linear regression recommender system with leave‐one‐out
95% CI [4.562, 4.728]; average: RMSE = 4.966, bootstrapped 95%
cross‐validation), and the training set for the algorithm was a dataset
CI [4.918, 5.016]), t(519) = 10.2, P < 0.001. These results suggest that
that included ratings for all 30 jokes from 929 participants in previous
there is reasonable heterogeneity across people's preferences in this
studies.
domain, and the recommender system is able to perform well by
detecting these idiosyncrasies.
2.4 | Study 1B Results A second concern might be that our results are specific to our
choice of algorithm. Indeed, there are many approaches to collaborative
Once again, machine recommenders outperformed human recom- filtering, which can be broadly grouped in terms of two approaches.
menders. Specifically, the recommender system was more accurate Item‐based collaborative filtering (“IBCF”) uses regression‐likeYEOMANS ET AL. 5
approaches to predict the ratings of the target item based on the ratings recommenders. And they do so without having a model of which fea-
of the sample items (Sarwar et al., 2001). The OLS algorithm used tures of jokes are most predictive of how funny they will be. Put
throughout this paper was an example of this. More often these models another way, the exact same statistical procedure could be applied
include some kind of regularization to bias the model away from to any database of ratings, whether they are of restaurants, books,
overfitting, like LASSO (Tibshirani, 1996). Sophisticated models also or cars. The recommender system could make recommendations in
can include more complex features calculated from the sample ratings, any of these domains without knowing what made a restaurant, book,
such as nonlinear terms and interactions, or latent factor models. By or car enjoyable. But because these recommender systems lack a
contrast, user‐based collaborative filtering (“UBCF”) algorithms gather model of why jokes are funny, people might be reluctant to use these
users from the dataset that have similar preferences on the sample rat- machine recommendations as decision aids. In our remaining studies,
ings and make predictions by taking a weighted average of these users' we continue to develop evidence that recommender systems outper-
ratings on the target item (Breese et al., 1998). form human recommenders, but our focus now shifts to a related
In Appendix S4, we report accuracy estimates for these algorithms question: Are people reluctant to substitute machine recommenda-
across the datasets from Studies 1A and 1B. In general, we found that tions for human judgment? And if so, why? Figure 1.
although there are some subtle differences between approaches, they
all are comfortably more accurate than human recommenders. And in
keeping with more sophisticated recommender systems, the most
accurate was an ensemble model that combined the predictions from 3 | STUDY 2
a variety of simpler models (Study 1A: RMSE = 4.266, bootstrapped
95% CI [4.077, 4.472]; Study 1B: RMSE = 4.638, bootstrapped 95%
3.1 | Methods
CI [4.556, 4.722]). Therefore, our results appear to be robust to the
choice of algorithm.
We recruited 232 participants (116 pairs) from the Museum of Sci-
A final concern might be that we disadvantaged humans by asking
ence and Industry; 22 participants (11 pairs) were dropped due to
them to predict absolute ratings instead of making comparative judg-
incomplete responses or not following directions, leaving 210 partici-
ments. Perhaps it is difficult for people to identify the “funniness”of
pants (105 pairs).
a joke on a scale, whereas it would be easier for people to simply state
The procedure closely paralleled Study 1A, with a few differences.
which of two jokes someone would like more. We can re‐analyze our
Participants were assigned to one of four conditions in a 2 × 2 between‐
data from Studies 1A and 1B using a non‐parametric measure of per-
subjects design. The first factor was whether participants were given
formance to test this possibility.
machine recommendations to guide their own recommendations. In
For Study 1A, each recommender made eight recommendations.
the “with machine”condition, participants were told about the database
This allows us to compute 28 pairwise comparisons: For each pair, we
of joke ratings and were given an explanation of collaborative filtering.
would know which joke the target actually rated higher and which joke
During the recommendation phase of the experiment, these partici-
the recommenders predicted to be rated higher. If a recommender gave
pants were shown the machine's predicted rating for each test joke.
a higher rating to the item in the pair that the target actually rated
Participants were told that these predicted ratings could be used to
higher, then this was scored as a correct response (ties were counted
inform their own predictions, or they could ignore them if they wished.
as half‐correct). Each recommender's accuracy was calculated as their
In the “without machine”condition, participants were not given the
average over all 28 pairwise comparisons. This pairwise analysis
machine's predicted rating (or told about collaborative filtering).
ensures that humans are not punished for miscalibrated absolute judg-
ments of funniness. Once again, the recommender system
outperformed (M = 61.1%, 95% CI [58.7%, 63.4%]) human recom-
menders (M = 56.8%, 95% CI [54.2%, 59.5%]), t(121) = 2.65,
P = 0.009. For Study 1B, each recommender made two recommenda-
tions for each of five targets. This allows us to compute five pairwise
comparisons per recommender. Once again, the recommender system
(M = 60.4%, 95% CI [58.5%, 62.3%]) was more accurate than the human
judges (M = 54.8%, 95% CI [52.8%, 56.7%]), t(519) = 4.91, P < 0.001.
Finally, in another study (reported in full in Appendix S5), we
asked participants to directly make pairwise comparisons when pro-
ducing their recommendations. Even then, machine recommenders
(M = 62.9%, 95% CI [59.8%, 66.1%]) were more accurate than human
recommenders (M = 56.6%, 95% CI [53.6%, 59.7%]), t(196) = 3.15,
P = 0.002. These results provide further evidence that machines did
not outperform humans merely due to an artifact of the recommenda-
FIGURE 1 Accuracy results from Studies 1 and 2 comparing human
tion procedure.
recommendations and machine recommendations (error bars
These initial studies provide the first rigorous evidence that col- represent standard error of the mean) [Colour figure can be viewed at
laborative filtering recommender systems can outperform human wileyonlinelibrary.com]6 YEOMANS ET AL.
To generate just‐in‐time predictions from the machine during the Of course, people rarely use recommender systems to help them
current study, we needed to build the recommender system prior to make recommendations for other people. Instead, people most often
conducting the study. This recommender system was developed using interact with recommender systems when they are receiving recom-
the exact same training data and estimation algorithm from Study 1A. mendations for themselves, and in those cases, they will have better
It was implemented as a web service in Python to provide personal- information about the whether a recommender system matched their
ized recommendations based on people's sample joke ratings. Unlike own preferences. Are people averse to receiving machine recommen-
Study 1A, we did not need to use cross‐validation to estimate held‐ dations? We address this question in the following studies Figure 2.
out accuracy, because the predictions in this study were being made
for participants whose data we did not have yet.
We were unsure whether people would rely on the machine pre- 4 | STUDY 3
dictions more when making recommendations for strangers or people
If people are averse to machine recommendations, then this could be
they know. Accordingly, the second factor in our experiment manipu-
due to two factors. First, machine recommenders select different con-
lated the target of the recommendation. Participants in the “known”
tents (i.e., which jokes they recommend). Second, machine recom-
condition made recommendations for the other person in the pair.
menders use a different recommendation process than do humans
Participants in the “stranger”condition made recommendations for a
(or, at least, people believe that the recommender systems follow a dif-
museum goer selected at random, whom they did not know (i.e., they
ferent process). We expect that the second factor more strongly
were shown sample ratings for a stranger whose data we already had
shapes people's aversion to relying on recommender systems. In this
and were told they were predicting that stranger's ratings). Both fac-
study, we disentangle these two factors by manipulating the actual
tors were randomized at the pair level (i.e., people recruited together
source of recommendations (which changes the content and process)
were always in the same condition).
and the perceived source (which holds content constant).
3.2 | Results 4.1 | Methods
Regarding accuracy, recommender systems (RMSE = 4.273, All participants in this study were targets, not recommenders. They
bootstrapped 95% CI [4.128, 4.291]) once again outperformed received recommendations from either another person or from our
humans (RMSE = 5.387, bootstrapped 95% CI [5.199, 5.583], recommender system, based on how participants rated three sample
t(209) = 10.06, P < 0.001). And the humans did not perform any better jokes.
for close others (RMSE = 5.386, bootstrapped 95% CI [5.126, 5.673])
or for strangers (RMSE = 5.387, bootstrapped 95% CI [5.134, 5.663]), 4.1.1 | Developing human and machine
t(208) = 0.25, P = 0.802. recommendations
Despite the fact that machines were more accurate than humans,
people did not entirely rely on machine recommendations to guide their Because it would be difficult to acquire human recommendations in
judgments. People did improve somewhat when given the machine pre- real time, we developed a method to collect the recommendations in
dictions (RMSE = 5.056, bootstrapped 95% CI [4.820, 5.314]) compared
with those without it (RMSE = 5.692, bootstrapped 95% CI [5.420,
5.991]), t(208) = 2.42, P = 0.017. But the humans with the recommender
system still performed worse than the recommender system on its own
(RMSE = 4.110, bootstrapped 95% CI [3.912, 4.323]), t(103) = 6.61,
P < 0.001. These data suggest that people did not ignore the machine rec-
ommendation. But they also did not perform as well as they could have,
had they been willing to put more trust in the recommender system.
These results echo prior research, which has shown that people
are reluctant to use many kinds of judgment or decision aids (Bar‐Hil-
lel, 1980; Dietvorst et al., 2015; Larrick & Soll, 2006; Mannes, 2009;
Yaniv, 2004). The results above suggest that people may be similarly
reluctant to rely on recommender systems. It is worth noting that this
reluctance may be quite rational. Given that people have more experi-
ence with their own recommendation process (and that of other peo-
ple), some initial reluctance to embrace a new recommendation
technology seems reasonable. People might have wanted more infor-
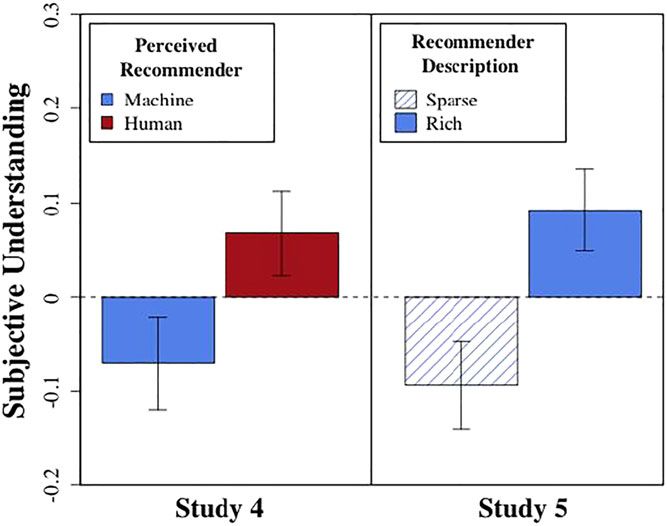
FIGURE 2 Recipients' evaluations of the recommenders' ability from
mation about the algorithm (such as feedback on whether its predic-
Studies 3 and 5, based on perceived recommendation source and
tions were accurate). However, our findings do suggest that human recommender description, respectively (error bars represent standard
judgment could be improved if people more fully incorporated the rec- error of the mean) [Colour figure can be viewed at wileyonlinelibrary.
ommender system's predictions into their own. com]YEOMANS ET AL. 7
advance and match them to our participants ex post based on partic- 4.2 | Results
ipants' ratings of the three sample jokes. We rounded participants'
sample ratings to the nearest 2.5‐point marking on the scale, which 4.2.1 | Accuracy
meant that each joke rating would be rounded to one of nine scores
(−10, −7.5, −5, −2.5, 0, 2.5, 5, 7.5, and 10). With three jokes in the For each participant, we can compare the participant's average rating
3
sample set, there were 9 = 729 possible permutations of sample joke of the three jokes from the test set that a human recommender
ratings. selected to the participant's average rating of the three jokes that
A separate sample of 253 MTurk participants provided the human the recommender system selected. This within‐subjects comparison
recommendations. These recommenders were shown these ratings once again shows that the recommender system picked jokes that par-
profiles along with the sample jokes (e.g., Sample Joke 1: 2.5, Sample ticipants found funnier (M = 3.03, 95% CI [2.79, 3.27]) than did human
Joke 2: −5.0, and Sample Joke 3: 7.5). Recommenders then picked recommenders (M = 2.74, 95% CI [2.50, 2.98]), t(885) = 3.01,
three test jokes (from a menu of 10) that they thought someone with P = 0.003.
those ratings would like most. Each recommender made three sets of
recommendations. All recommendations were pooled together into a 4.2.2 | Aversion to recommender systems
database. This database made it possible to have a human recommen-
dation ready for every participant, because it contained recommenda- Next, we compared how participants rated the recommenders. As
tions for the 729 possible permutations of sample ratings that planned, there was high internal consistency among the three evalua-
participants could produce. tion questions (Cronbach's α = 0.95), so we standardized and com-
Of course, recommender systems would have an unfair advantage bined responses into a single “preference index”(and all our results
if they used participants' precise ratings while human recommenda- are substantively identical if we compute a simple average of these
tions were based on rounded ratings. To address this concern, the scales instead, or analyze scales individually). A 2 × 2 ANOVA revealed
algorithm also used the same rounded ratings as inputs. To make pre- a significant main effect of perceived recommender on these evalua-
dictions, the algorithm used the same linear regression approach as in tions. Participants rated the recommender more highly when they
the studies above, and the ratings data were the same as in Study 1B— believed it was human (M = 0.07, SD = 1.01) than when they believed
929 participants who had rated all 13 jokes used in the current study. it was a machine (M = −0.07, SD = 0.98), F (1, 882) = 4.6, P = .032.
However, there was not a significant effect of the actual recom-
mender (human: M = −0.03, SD = 1.02, machine: M = 0.02, SD = 0.99;
4.1.2 | Current study F (1, 882) = 0.6, P = .432), nor a significant interaction, F (1, 882) = 1.8,
P = 0.178.
Nine hundred ninety‐six participants from MTurk completed our These results demonstrate another dimension of aversion to rec-
study; 104 participants failed the manipulation check and 6 partici- ommender systems. In Study 2, people did not make full use of recom-
pants predicted the same rating for every joke, leaving 886 partici- mender systems when recommending for others, and here, we see
pants for the analyses. they are also reluctant to receiving recommendations from recom-
Participants were randomly assigned to one of four conditions in a mender systems. Importantly, this aversion does not stem from the
2 × 2 between‐subjects design. The first factor was the actual recom- different content of what the machines recommend. Instead, people
mender (human or recommender system), and the second factor was were averse to recommendations that simply seemed to come from
the perceived recommender. Participants in the perceived‐human rec- recommender systems.
ommender conditions were told that they were paired with another Interestingly, people do prefer more accurate recommendations.
user online, although this was not true because the recommendations Accuracy—the average funniness of the three jokes they saw—was
were collected in advance, as described above. Participants in the meaningfully correlated with the preference index, r = 0.59,
machine condition were told that the recommender system would t(884) = 22.0, P < 0.001. Accordingly, we conducted a robustness
use a “database of thousands of people”to find others with a “similar check using a multiple linear regression, which included both variables
sense of humor”based on the sample jokes, though we did not explain as predictors. When controlling for the effect of recommender accu-
the exact calculations of the algorithms involved. racy, the regression model estimated a larger effect of perceived
Participants first rated three sample jokes and 10 test jokes. They source, β = 0.183, SE = 0.054, t(883) = 3.4, P < 0.001. This model also
then waited 20 s and were shown the three jokes from the test set benchmarked the relative effect sizes of actual accuracy and perceived
that the recommender thought they would like most. After seeing recommendation source—we estimate that the implicit penalty against
these jokes, participants evaluated their recommender across three the machine was equivalent to a difference in accuracy of 0.31 stan-
questions: (1) “How good do you think the recommender was at dard deviations.
choosing jokes you would enjoy?”(2) “How well do you think the rec- These findings reveal an interesting pattern—although people like
ommender knew your sense of humor?”and (3) “How much would the machine's recommendations more, they like human recommenders
you want to read more jokes that the recommender chose for you?” more than the recommender system. Why might this be? Perhaps it
All responses were on a 7‐point scale. is due to differences in how people perceive the human versus
Finally, as a comprehension check, participants were asked who machine recommendation process. It is hard for people to understand
made the recommendations in a multiple choice question. how recommender systems operate (Herlocker, Konstan, & Riedl,8 YEOMANS ET AL.
2000; Tintarev & Masthoff, 2011), and perhaps people are averse to last, after the understanding questions, and the order of the two
recommender systems because it seems harder to understand how options was counterbalanced.
machines make recommendations than how humans make recommen-
dations. In the next study, we test whether (a lack of) subjective
understanding of the recommendation process predicts aversion to 5.2 | Results
using recommender systems Figure 3.
Accuracy was calculated as in Study 3. Recommender systems were
once again more accurate (M = 3.13, 95% CI [2.90, 3.36]) than human
recommenders (M = 2.71, 95% CI [2.46, 2.95]), t(898) = 4.15,
5 | STUDY 4
P < 0.001.
To assess the relationship between aversion and subjective
5.1 | Methods understanding, we collapse our analyses across the actual recom-
mender, to focus on the effective of the perceived recommender. This
One thousand ten participants from MTurk completed our study; 107
way, the actual jokes being recommended are held constant, and the
failed the manipulation check and four gave the same rating to every
only thing that varies is the perceived process by which recommenda-
joke, leaving 899 participants for the analyses.
tions are made.
The study was identical to Study 3, with two exceptions. First, as
When participants were asked which recommender they would
a measure of our proposed mediator, participants were asked to rate
choose, most participants (74.1%) wanted to switch recommenders.
how easy it was to understand the recommendation process. They
This is an interesting artifact of our experimental design, perhaps a
did this by reporting their agreement with two statements: “I could
result of novelty seeking. But more relevant to our hypotheses, we
understand why the recommender thought I would like those jokes”
found that more participants chose to switch when they started with
and “It is hard for me to explain how the recommender chose those
a machine recommender (M = 79.5%, 95% CI [75.8%, 83.3%]) than
jokes” (reverse‐coded). For both questions, participants responded
when they started with a human recommender (M = 68.8%, 95% CI
on a scale ranging from −3 to +3, anchored at strongly agree to strongly
[64.6%, 73.1%]), χ2(1, N = 899) = 12.84, P < 0.001. Put simply, a major-
disagree, with the 0 point labelled “neutral.”The order of these two
ity of participants preferred human recommenders (M = 54.8%, 95%
questions was counterbalanced.
CI [51.6%, 58.1%]), χ2(1, N = 899) = 8.42, P = 0.004.
Second, to assess aversion, participants indicated whether they
The subjective understanding ratings were combined in a single
would rather receive additional recommendations from humans or
index (Cronbach's α = 0.82), and we again confirm our results are con-
from the recommender system. Participants imagined that they would
sistent if we instead compute a simple average or analyze individual
receive additional recommendations from either “an algorithm [that]
items. Participants rated human recommenders as easier to under-
would search through a database of thousands of people to find jokes
stand (M = 0.07, 95% CI [−0.02, 0.16]) than machine recommenders
liked by those who had the most similar sense of humor to your own”
(M = −0.07, 95% CI [−0.17, 0.03]), t(897) = 2.07, P = 0.038. And these
or from “another person [that] would then choose some jokes that
beliefs were strongly related to participants' preferences for recom-
they thought you would like.”This choice question was always asked
menders. Across all conditions, participants were more likely to stick
with their assigned recommender if they thought the recommender
was easier to understand (logistic regression, β = 0.60, SE = 0.09),
z(897) = 7.01, P < 0.001. And this relationship was attenuated when
participants thought their recommender was human, β = 0.43,
SE = 0.11, z(457) = 3.83, P < 0.001; interaction term: β = −0.39,
SE = 0.18, z(895) = 2.19, P = 0.028. Like in Study 3, this estimated
relationship is stronger when we control for the accuracy of the rec-
ommender itself (interaction term: β = −0.57, SE = 0.20),
z(893) = 2.86, P = 0.004. Furthermore, this effect was significantly
mediated by subjective understanding (bootstrapped indirect effect:
M = 0.015, 95% CI [0.030, 0.00], P = 0.039; Tingley, Yamamoto,
Hirose, Keele, & Imai, 2014). In other words, this suggests that people
are averse to using recommender systems in part because it seems
harder to understand how machines make predictions than how
humans do.
These results put our earlier findings into clearer focus. When par-
ticipants thought the recommendations had come from a human, they
FIGURE 3 Recipients' rated understanding of the recommenders
were able to make sense of why someone might have chosen them.
from Studies 4 and 5, based on perceived recommendation source
and recommender description, respectively (error bars represent But when they thought the recommendations had been generated
standard error of the mean) [Colour figure can be viewed at by a machine, those very same recommendations were perceived as
wileyonlinelibrary.com] inscrutable. These results suggest that people are less willing to acceptYEOMANS ET AL. 9
recommenders when they do not feel like they understand how they were true, then we might expect to find that people rated the recom-
make recommendations. And this subjective understanding seems to mended jokes more favorably in the rich explanation condition. How-
be malleable, independent of the performance of the recommender ever, there was no difference in the average ratings of the three
itself. Would making machine recommendations easier to understand chosen jokes in the sparse condition (M = 3.52, 95% CI [3.18, 3.86])
increase how much people like those recommenders? The final study and the rich condition (M = 3.55, 95% CI [3.23, 3.87]), t(984) = 0.13,
addresses this possibility. P = 0.898. This suggests that our manipulation affected subjective
understanding, but not necessarily subjective accuracy.
Turning to the preference questions, participants in the rich condi-
6 | STUDY 5 tion showed greater preference for the recommender system
(M = 0.07, 95% CI [−0.02, 0.16]) than participants in the sparse condi-
6.1 | Methods tion (M = −0.07, 95% CI [−0.16, 0.02]), t(984) = 2.20, P = 0.028. As in
previous studies, this effect was stronger when we controlled for
One thousand and fourteen participants from MTurk completed our accuracy of the recommender (β = 0.13, SE = 0.04), z(983) = 3.09,
study. Twenty‐four participants failed the manipulation check and four P = 0.002. Furthermore, this effect was significantly mediated by sub-
participants gave the same rating to every joke, leaving 986 partici- jective understanding (bootstrapped indirect effect: M = 0.104, 95% CI
pants for the analyses. [0.035, 0.18], P = 0.003). In other words, rich explanations of the rec-
The study was identical to Study 4, with four changes. First, par- ommender system increased participants' understanding of the recom-
ticipants only rated three sample jokes and then rated the three rec- mendation process, and this in turn improved their beliefs about the
ommended jokes chosen by the recommender system. Because the quality of the recommender system's performance.
chosen jokes were rated after the manipulation, this allowed us to test
whether our manipulation affected the subjective quality of the rec-
ommended items themselves. Second, all recommendations were gen-
erated by a recommender system that used the exact (i.e., unrounded)
7 | GENERAL DISCUSSION
sample joke ratings from each participant as inputs, as in Study 2.
Third, the dependent measures consisted of the subjective under- The ubiquity of recommender systems raises a familiar question: How
standing questions from Study 4, and the preference questions from do algorithmic predictions compare to human judgment? How do algo-
Study 3. The order of these two sets of questions was rithmic predictions compare to human judgment? Here, we find a
counterbalanced across participants. familiar answer—recommender systems can outperform human rec-
Finally, the most substantive change was a manipulation of how ommenders, even when those humans are making recommendations
the recommender system was explained. Some participants received for friends and family.
a sparse explanation. During the introduction to the study, participants These results build on a large body of work comparing human and
were told, “… we are going to feed your ratings into a computer algo- algorithmic judgment. Early research discovered that algorithms could
rithm, which will recommend some other jokes that you might also produce more accurate judgments than humans could, when they are
like.”Other participants received a rich explanation, where they were given the same features or cues for making judgments (Dawes, 1979;
also told to “Think of the algorithm as a tool that can poll thousands Dawes, Faust, & Meehl, 1989; Grove, Zald, Lebow, Snitz, & Nelson,
of people and ask them how much they like different jokes. This 2000; Meehl, 1954). Those algorithms often improved on human judg-
way, the algorithm can learn which jokes are the most popular overall, ment by making it more consistent. That seminal work posits a key
and which jokes appeal to people with a certain sense of humor. Using role for humans in constructing machine intelligence: In each domain
the database ratings, the algorithm will search for new jokes that are (e.g., predicting academic performance or medical outcomes), humans
similar to the ones you liked, and dissimilar to the ones you did not identify the relevant features (e.g., student's GPA and patient's age) for
like.”The rich condition also repeated these details after the partici- algorithms to use. As Dawes noted, “The linear model cannot replace
pants rated the sample jokes when they were waiting for their recom- the expert in deciding such things as ‘what to look for’, but it is pre-
mendations and again when the recommended jokes were shown (see cisely this knowledge … that is the special expertise people have”
Appendix S6 for exact stimuli). (1979, p. 573). By contrast, collaborative filtering is designed to per-
form well even when this expertise is not used to curate the available
6.2 | Results features. Recommender systems can excel even with limited informa-
tion about the unique tastes of the recipient, and no direct knowledge
Participants in the rich explanation condition rated the recommender of what they are recommending (e.g., they do not consider the plot of
system as easier to understand (M = 0.09, 95% CI [0.01, 0.18]) than a movie or the text of a book). They only know what people like, not
participants in the sparse condition (M = −0.09, 95% CI [−0.18, why people like it. To be sure, there are many commonalities between
0.00]), t(984) = 2.93, P = 0.003. This confirmed that our manipulation these two kinds of models—both succeed by consistently applying
had its intended effect. One concern might be that our manipulation prediction algorithms to a database—and in practice, these approaches
not only affected subjective understanding but also affected people's are often intricately combined. But our results add another datapoint
perceptions of recommender accuracy. That is, perhaps the rich expla- suggesting that perhaps algorithms do not require the special exper-
nation made it seem like the algorithm had chosen better jokes. If this tise of humans to outperform them10 YEOMANS ET AL.
It is possible that humans might still outperform recommender might provide further encouragement for people to engage with algo-
systems in other domains. Our results suggest that even for something rithms. For instance, recommender systems may seem more under-
like humor, which seems uniquely human, recommender systems can standable if they are given human characteristics (Waytz, Gray,
excel. But it is still worthwhile for future research to conduct similar Epley, & Wegner, 2010; Waytz, Heafner, & Epley, 2014), and this
tests in other preference domains. Recommender systems also suffer might reduce aversion to recommender systems. Or aversion could
from start‐up problems in new applications, when the database of pre- be reduced if algorithms pause, as if “thinking,”before making a rec-
vious ratings is small, or sparse. In practice, the accuracy of recom- ommendation (Buell & Norton, 2011). And allowing people to exert
mender systems may also be bounded by their strategies to collect some control over an algorithm's judgment could also enable better
user ratings, suggesting questions for future work on the behavioral sensemaking (Dietvorst, Simmons, & Massey, 2016). In some cases,
aspects of review elicitation (Avery, Resnick, & Zeckhauser, 1999; it may also be that simply allowing people more experience with rec-
Berger, 2014; Burtch, Hong, Bapna, & Griskevicius, 2017; Yeomans, ommender systems will increase feelings of understanding over time.
2018). A more thorough account of the factors that increase subjective
Our findings also highlight a familiar theme from prior work com- understanding could ultimately foster greater trust in algorithmic deci-
paring algorithmic judgment to human judgment. People are averse to sions and recommendations.
relying on recommender systems. People do not sufficiently use input It is clear that people judge a recommender system not just by
from these systems and they prefer to receive recommendations from what it recommends, but how it recommends. Our work suggests that
humans. For recommendation recipients, this is not irrational. For one, algorithms can be highly accurate even without the special expertise
it can take time (and a rich track record of success) for new technology of a human. But accuracy alone cannot reduce aversion to algo-
to earn a reputation for performance in the public mind. More broadly, rithms—they need to be understood as well.
people can have a direct preference for process, for example, by
privileging predictions made with domain‐specific content rather than CONFLIC T OF INT E RE ST
mere ratings data (Gilbert et al., 2009). And preferences for algorithmic None of the authors have any potential conflicts of interest to disclose
and human judgment also vary across domains. In particular, domains in relation to this research. For each study, we report how we deter-
that are more subjective—like jokes—may be the most likely to elicit mined our sample size, all data exclusions, all manipulations, and all
algorithmic aversion (Castelo, Lehmann, & Bos, 2019; Logg, 2018). measures. The exact data and code from each study are available as
But despite these reservations, we still think that people may be miss- Online Supplemental Material, stored anonymously on the Open Sci-
ing opportunities to get more accurate recommendations because of ence Framework at https://osf.io/8nbr2/.
their reluctance to rely on recommender systems.
Previous research identifies one reason why people are averse to ORCID
using algorithms, namely, that people are concerned about algorithmic
Michael Yeomans https://orcid.org/0000-0001-5651-5087
errors (Dietvorst et al., 2015). But the aversion to recommender sys-
tems does seem to draw from other factors that can be independent
RE FE RE NC ES
of accuracy. In particular, we find that one reason people seem averse
Adomavicius, G., Bockstedt, J. C., Curley, S. P., & Zhang, J. (2018). Effects
to recommender systems is because they do not understand the rec- of online recommendations on consumers' willingness to pay. Informa-
ommendation process, and they believe that human recommenders tion Systems Research In press, 29, 84–102. https://doi.org/10.1287/
are easier to understand. isre.2017.0703
We should emphasize that our studies only tell us that people sub- Adomavicius, G., & Tuzhilin, A. (2005). Toward the next generation of rec-
jectively feel like they understand human recommendations better ommender systems: A survey of the state‐of‐the‐art and possible
extensions. IEEE Transactions on Knowledge and Data Engineering,
than machine recommendations. Of course, these subjective impres-
17(6), 734–749. https://doi.org/10.1109/TKDE.2005.99
sions need not align with reality. People might be overconfident in
Ansari, A., Essegaier, S., & Kohli, R. (2000). Internet Recommendation Sys-
their understanding of how humans make recommendations. And they tems. Journal of Marketing Research, 3 7(3), 363–375. https://doi.org/
may not truly understand the factors that influence these subjective 10.1509/jmkr.37.3.363.18779
impressions (Fernbach et al., 2012; Nisbett & Wilson, 1977; Rozenblit Avery, C., Resnick, P., & Zeckhauser, R. (1999). The market for evaluations.
& Keil, 2002). Nevertheless, people seem more comfortable with American Economic Review, 89(3), 564–584. https://doi.org/10.1257/
human recommenders, in part, because of these subjective feelings aer.89.3.564
of understanding. Bar‐Hillel, M. (1980). The base‐rate fallacy in probability judgments. Acta
This then raises a pressing question for future research. What fac- Psychologica, 44(3), 211–233. https://doi.org/10.1016/0001‐
6918(80)90046‐3
tors influence algorithmic sensemaking? This has typically been a sec-
ondary question (and our work does not offer a final answer to this Bell, R. M., & Koren, Y. (2007). Lessons from the Netflix prize challenge.
ACM SIGKDD Explorations Newsletter, 9(2), 75–79. https://doi.org/
question either). Instead, researchers often focus on how to engineer
10.1145/1345448.1345465
more accurate algorithms. The “Netflix Challenge,” for example,
Berger, J. (2014). Word of mouth and interpersonal communication: A
offered $1 million to researchers who could improve prediction accu- review and directions for future research. Journal of Consumer Psychol-
racy by just 10% (Bell & Koren, 2007). But accuracy is not the sole ogy, 24(4), 586–607. https://doi.org/10.1016/j.jcps.2014.05.002
determinant of subjective preferences. In some sense, if the next Bitterly, T. B., Brooks, A. W., & Schweitzer, M. E. (2017). Risky business:
“Netflix Challenge”focused on facilitating algorithmic sensemaking, it When humor increases and decreases status. Journal of PersonalityYou can also read