Severe Californian wildfires in November 2018 observed from space: the carbon monoxide perspective - atmos-chem-phys.net
←
→
Page content transcription
If your browser does not render page correctly, please read the page content below
Atmos. Chem. Phys., 20, 3317–3332, 2020
https://doi.org/10.5194/acp-20-3317-2020
© Author(s) 2020. This work is distributed under
the Creative Commons Attribution 4.0 License.

Severe Californian wildfires in November 2018 observed
from space: the carbon monoxide perspective
Oliver Schneising, Michael Buchwitz, Maximilian Reuter, Heinrich Bovensmann, and John P. Burrows
Institute of Environmental Physics (IUP), University of Bremen FB1, Bremen, Germany

Correspondence: O. Schneising (oliver.schneising@iup.physik.uni-bremen.de)

Received: 4 January 2019 – Discussion started: 22 January 2019
Revised: 5 February 2020 – Accepted: 19 February 2020 – Published: 20 March 2020

Abstract. Due to proceeding climate change, some regions           1   Introduction
such as California face rising weather extremes with dry peri-
ods becoming warmer and drier, entailing the risk that wild-       As a consequence of climate change, precipitation and
fires and associated air pollution episodes will continue to       temperature extremes in California during the cool season
increase. November 2018 turned into one of the most severe         (October–May) are occurring more frequently with dry peri-
wildfire episodes on record in California, with two partic-        ods becoming warmer and drier (Swain et al., 2016), which
ularly destructive wildfires spreading concurrently through        is associated with an increased fire risk. The increasing num-
the north and the south of the state. Both fires ignited at        ber of people living in the wildland–urban interface paired
the wildland–urban interface, causing many civilian fatalities     with proceeding climate change, entailing longer-lasting and
and forcing the total evacuation of several cities and commu-      more intense fire seasons, affect the outlook for the future
nities.                                                            (Radeloff et al., 2018).
   Here we demonstrate that the inherent carbon monoxide              The wildfire season of 2018 was the most destructive on
(CO) emissions of the wildfires and subsequent transport can       record with respect to burned land area, destroyed buildings,
be observed from space by analysing radiance measurements          and fatalities (California Department of Forestry and Fire
of the TROPOspheric Monitoring Instrument (TROPOMI)                Protection, 2019). After a series of extensive fires in July–
onboard the Sentinel-5 Precursor satellite in the shortwave        August including the Mendocino Complex, the largest wild-
infrared spectral range. From the determined CO distribu-          fire in California since the beginning of recording, another
tion we assess the corresponding air quality burden in major       round of large wildfires erupted in November, most promi-
Californian cities caused by the fires and discuss the associ-     nently the Camp Fire and the Woolsey Fire. The Camp Fire
ated uncertainties. As a result of the prevailing wind condi-      started in the morning of 8 November in Butte County in the
tions, the largest CO load during the first days of the fires is   north of the state and grew rapidly. It became California’s
found in Sacramento and San Francisco, with city area av-          most destructive and deadliest wildfire since records began.
erages reaching boundary layer concentration anomalies of          The Woolsey Fire ignited on the same day as the Camp Fire
about 2.5 mg CO m−3 . Even the most polluted city scenes           in the early afternoon near the boundary between Los An-
likely comply with the national ambient air quality standards      geles and Ventura counties and burnt all the way to Malibu.
(10 mg CO m−3 with 8 h averaging time). This finding based         Both fires forced the total evacuation of several cities and
on dense daily recurrent satellite monitoring is consistent        communities.
with isolated ground-based air quality measurements.                  Smoke from the fires also reached the major cities of the
                                                                   state, prompting health warnings and the advice to remain
                                                                   indoors or wear face masks in certain areas (Sacramento
                                                                   Metropolitan Air Quality Management District, 2018; Bay
                                                                   Area Air Quality Management District, 2018). The air qual-
                                                                   ity was affected by particulate matter and carbon monox-
                                                                   ide (CO), which results from the incomplete combustion of

Published by Copernicus Publications on behalf of the European Geosciences Union.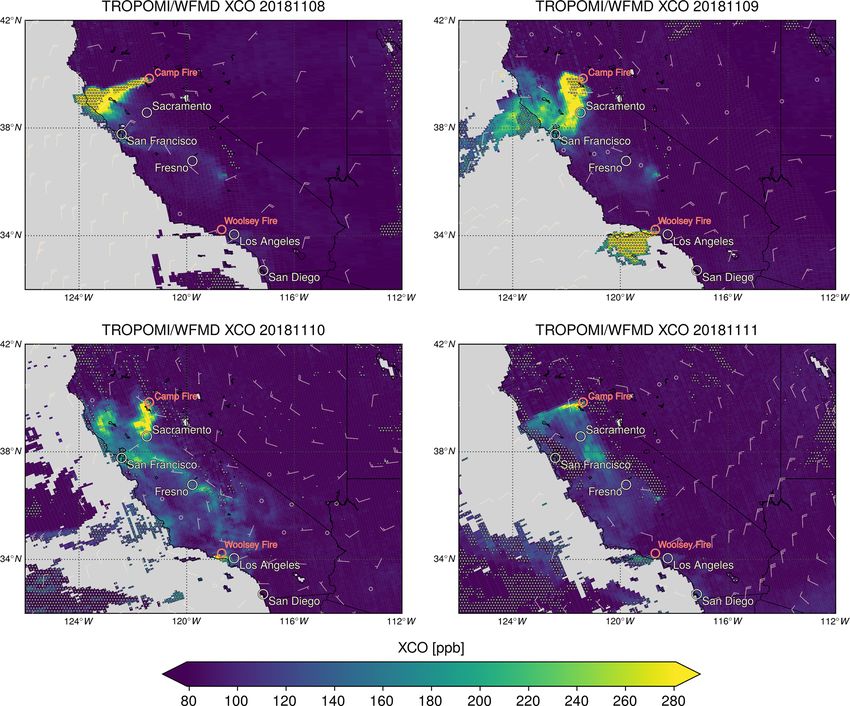
3318                                     O. Schneising et al.: Californian wildfires in November 2018: the CO perspective

biomass during wildfires (Yurganov et al., 2005). CO is a         2   Data and methods
colourless, odourless, and tasteless gas that is toxic in large
concentrations because it combines with hemoglobin to form        In this study, we derive and analyse atmospheric carbon
carboxyhemoglobin, which can no longer effectively trans-         monoxide from the radiance measurements of the TRO-
port oxygen. As a consequence, it has the ability to cause        POspheric Monitoring Instrument (TROPOMI) onboard the
severe health problems (Omaye, 2002). CO also plays an im-        Sentinel-5 Precursor (Sentinel-5P) satellite (Veefkind et al.,
portant role in tropospheric chemistry, being the leading sink    2012) using the latest version of the Weighting Function
of the hydroxyl radical (OH) and acting as a precursor to tro-    Modified DOAS (WFM-DOAS) algorithm (Buchwitz et al.,
pospheric ozone (The Royal Society, 2008).                        2006; Schneising et al., 2011) optimised to retrieve vertical
   The Environmental Protection Agency (EPA) is required          columns of carbon monoxide and methane simultaneously
to set National Ambient Air Quality Standards (NAAQS) for         (TROPOMI/WFMD v1.2) (Schneising et al., 2019).
six pollutants considered harmful to public health and the           Sentinel-5P was launched in October 2017 into a sun-
environment, including carbon monoxide, by the Clean Air          synchronous orbit with an Equator crossing time of 13:30.
Act. The CO standards are fixed at 9 ppm (corresponding to        TROPOMI is a spaceborne nadir-viewing imaging spectrom-
10 mg m−3 for normal temperature and pressure) with an 8 h        eter measuring solar radiation reflected by the Earth in a
averaging time and 35 ppm (40 mg m−3 ) with a 1 h averaging       push-broom configuration. It has a swath width of 2600 km
time, neither to be exceeded more than once per year (U.S.        on the Earth’s surface and covers wavelength bands between
Environmental Protection Agency, 2011).                           the ultraviolet (UV) and the shortwave infrared (SWIR),
   Several spaceborne instruments have been measuring CO          combining a high spatial resolution with daily global cover-
on a global scale including the Atmospheric Infrared Sounder      age. The horizontal resolution of the TROPOMI nadir mea-
(AIRS) (McMillan et al., 2005), the Tropospheric Emission         surements, which depends on the orbital position and spec-
Spectrometer (TES) (Luo et al., 2015), and the Infrared At-       tral interval, is typically 7 × 7 km2 for the SWIR bands used
mospheric Sounding Interferometer (IASI) (Clerbaux et al.,        in this study. Due to its wide swath in conjunction with
2009), which observe emissions in the thermal infrared (TIR)      high spatial and temporal resolution, the observations of
and are mainly sensitive to mid- to upper-tropospheric abun-      TROPOMI yield CO amounts and distributions with an un-
dances. The sensitivity of TIR satellite sounders to near-        precedented level of detail on a global scale (Borsdorff et al.,
surface CO concentrations varies with the thermal contrast        2018a).
conditions (Deeter et al., 2007; Bauduin et al., 2017). The          As a result of the observation of reflected solar radiation
Measurement of Pollution in the Troposphere (MOPITT) in-          in the SWIR part of the solar spectrum, TROPOMI yields
strument (Drummond et al., 2010) combines observations of         atmospheric carbon monoxide measurements with high sen-
spectral features in the TIR and in the shortwave infrared        sitivity to all altitude levels including the planetary bound-
(SWIR) to increase surface-level sensitivity in some scenes       ary layer and is thus well-suited to study emissions from
(Worden et al., 2010). Nearly equal sensitivity to all altitude   fires. In order to convert the retrieved columns into mole
levels including the boundary layer can be achieved from ra-      fractions, they are divided by the corresponding dry air
diance measurements of reflected solar radiation in the SWIR      columns obtained from the European Centre for Medium-
part of the spectrum. This was first demonstrated by CO re-       Range Weather Forecasts (ECMWF) analysis. Thereby, the
trievals from the SCanning Imaging Absorption spectroMe-          ECMWF dry columns are corrected for the actual surface
ter for Atmospheric CHartographY (SCIAMACHY) instru-              elevation of the individual TROPOMI measurements as de-
ment (Burrows et al., 1995; Bovensmann et al., 1999) on-          termined from the Global Multi-resolution Terrain Elevation
board ENVISAT (Buchwitz et al., 2004; de Laat et al., 2010)       Data 2010 (GMTED2010; United States Geological Survey,
in the 2.3 µm spectral range.                                     2018), inheriting the high spatial resolution of the satellite
   Until now, the satellite-based analysis of CO emissions        data. The resulting column-averaged dry air mole fractions
from fires has been utilising profile or column information       are denoted by XCO.
from e.g. AIRS (Fu et al., 2018), IASI (Turquety et al.,             The retrieval error sources can be grouped into systematic
2009), the Microwave Limb Sounder (MLS) (Field et al.,            and random error components. Systematic errors typically
2016), MOPITT (Deeter et al., 2018), and SCIAMACHY                occur when the analysed scenes are not well-characterised
(Buchwitz et al., 2007; Borsdorff et al., 2018b). The recent      by the forward model, particularly in the presence of strong
TROPOMI offers a unique combination of high precision,            scatterers under challenging conditions concerning measure-
accuracy, spatiotemporal resolution, boundary layer sensitiv-     ment geometry and albedo. The random component is domi-
ity, and global coverage, fostering the monitoring of near-       nated by detector noise and pseudo-noise determined by spe-
ground CO sources (Borsdorff et al., 2018a; Schneising et al.,    cific atmospheric parameters or instrumental features. Based
2019).                                                            on a validation with ground-based Fourier transform spec-
                                                                  trometer (FTS) measurements of the Total Carbon Column
                                                                  Observing Network (TCCON) (Wunch et al., 2011), the
                                                                  TROPOMI/WFMD XCO data set is characterised by a ran-

Atmos. Chem. Phys., 20, 3317–3332, 2020                                            www.atmos-chem-phys.net/20/3317/2020/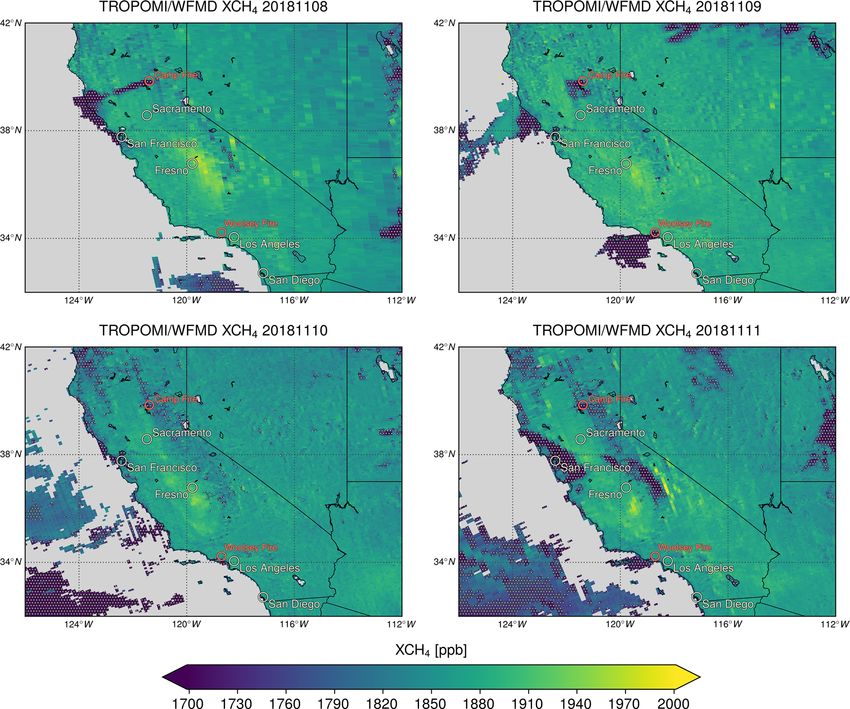
O. Schneising et al.: Californian wildfires in November 2018: the CO perspective                                            3319

dom error (precision) of 5.1 ppb and a systematic error (rel-      entangle the near-surface abundances from the total column
ative accuracy) of 1.9 ppb after quality filtering (Schneising     measurements. To this end, the total column enhancement is
et al., 2019).                                                     divided by the boundary layer height hbl obtained from the
    Among others, the standard quality filter typically removes    hourly ECMWF ERA5 reanalysis product (Hersbach et al.,
cloudy scenes and was chosen to be rather strict to meet the       2018) to get the boundary layer concentration anomaly 1ρbl
demanding requirements for the precision and accuracy of si-       due to the fires (in units of mass per volume):
multaneously retrieved XCH4 globally. For example, quality-                  ECO   1vCO · MCO
filtered ocean retrievals are mainly limited to sun glint or       1ρbl =        =                ,                           (1)
                                                                             hbl   NA · ACO · hbl
glitter scenes as a consequence of the otherwise weak sig-
nal above water surfaces. However, a local comparison with         where 1vCO is the enhancement (in units of molecules per
the cloud product from the Visible Infrared Imaging Ra-            area) relative to the prefire background. The molar mass
diometer Suite (VIIRS) instrument (Hutchison and Crack-            of carbon monoxide MCO = 28 g mol−1 and the Avogadro
nell, 2005) onboard the joint NASA–NOAA Suomi National             constant NA = 6.022 × 10²³ molec mol−1 are used to convert
Polar-orbiting Partnership (Suomi-NPP) satellite for days be-      molecules per area to mass per area; ACO = 0.95±0.05 is the
fore fire ignition has indicated that the filter can be somewhat   dimensionless near-surface CO averaging kernel characteris-
relaxed for the present study to maximise the number of util-      ing the boundary layer sensitivity of the retrieval determined
isable scenes. The implemented alternative quality screening       for appropriate conditions (solar zenith angle ∈ [50◦ , 60◦ ],
algorithm is based on simultaneously measured methane and          albedo ∈ [0.1, 0.2]). The boundary layer height determines
filters scenes in which the retrieved XCH4 is more than 3          the available volume for pollution dispersion and is thus
times the random error ≈ 50 ppb smaller than an assumed            a critical parameter for air quality assessment. The ERA5
reference (averaged cloud-free abundances of 5–7 Novem-            boundary layer height is defined as the lowest height at
ber). The threshold was chosen to distinguish systematic           which the bulk Richardson number, which interrelates sta-
from random deviations. Over weakly reflecting ocean or in-        bility with vertical wind shear, reaches the critical value of
land water scenes the filter is augmented by additionally flag-    0.25 (ECMWF, 2018). The corresponding uncertainty es-
ging scenes with large estimated CO fit error (> 10 %). The        timates are based on a 10-member 4D-Var ensemble. Fur-
rationale behind the use of simultaneously measured XCH4           thermore, an additional uncertainty associated with the es-
as a quality criterion is the following. To begin with, XCH4       timation method of the boundary layer height is introduced,
is far less variable than XCO in the presence of wildfires.        which is derived from a comparison of ERA5 boundary layer
Furthermore, both gases typically exhibit similar error char-      heights to lidar measurements (Wang et al., 2019). The areal
acteristics regarding the sign and percentage magnitude of         variation of this anomaly is determined from the standard de-
systematic errors (Schneising et al., 2019). Hence, potential      viations of the CO columns measuring the inhomogeneity of
issues of the XCO data, for example due to reduced near-           the boundary layer concentrations within the respective city
surface sensitivity in the presence of clouds or smoke, are        area.
clearly detected in the corresponding XCH4 data and filtered          The error analysis includes uncertainties arising from
out.                                                               boundary layer height, the vertical distribution of emissions
    To get a visual impression of the smoke distribution origi-    near the source, and smoke aerosol. Thereby, gridded Inte-
nating from the fires, so-called true colour images (red: band     grated Monitoring and Modelling System for Wildland Fires
I1, green: band M4, blue: band M3) from the VIIRS instru-          (IS4FIRES) injection heights (Sofiev et al., 2012) (corre-
ment are used, which show land surface, oceanic, and atmo-         sponding to the top of the plume) as obtained from the
spheric features like the human eye would see them (Hillger        CAMS GFAS and CAMS CO vertical profiles are used to es-
et al., 2014). The TROPOMI CO retrievals are also compared         timate how much of the pyrogenic CO may leave the bound-
to the analysis of the ECMWF Integrated Forecasting Sys-           ary layer.
tem (IFS) provided by the Copernicus Atmosphere Monitor-
ing Service (CAMS) (Inness et al., 2015), which assimilates        3     Results and discussion
MOPITT and IASI CO observations and biomass burning
emissions from the CAMS Global Fire Assimilation System            3.1    Quality filtered XCO and comparison to CAMS
(GFAS) (Kaiser et al., 2012).
    To assess the CO burden in major Californian cities we         As a result of the Camp and Woolsey fires ignited on
compute the average total column enhancement ECO (within           8 November, associated smoke overcast large parts of the
a 20 km radius around midtown, in units of mass per area)          state for nearly 2 weeks. This can clearly be seen on the
for the first days of the fire relative to 7 November, which is    VIIRS true colour images in Fig. 1 for the first days of the
considered background. It is assumed that the additional CO        fires. Sentinel-5 Precursor and Suomi-NPP fly in loose for-
from the fires is located in the well-mixed boundary layer,        mation, with Sentinel-5P trailing behind by 3.5 min, ensuring
while the remaining upper part of the contaminated profile         that both satellites observe (almost) the same scene. Thus, the
closely resembles the background profile, allowing us to dis-      corresponding images can be compared directly.

www.atmos-chem-phys.net/20/3317/2020/                                               Atmos. Chem. Phys., 20, 3317–3332, 2020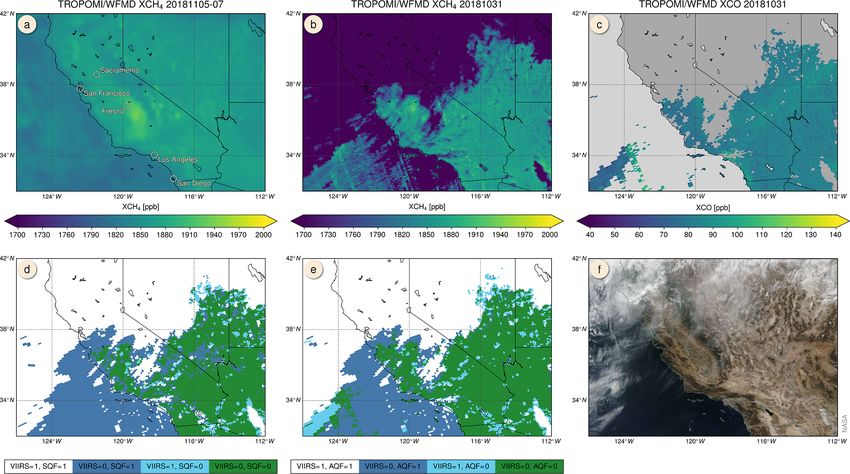
3320                                        O. Schneising et al.: Californian wildfires in November 2018: the CO perspective

Figure 1. True colour reflectances from the Visible Infrared Imaging Radiometer Suite (VIIRS) for the first days of the fires taken from the
NASA Worldview application.

   The performance of the quality filter based on simultane-            is the particle size distribution of the wildfire smoke. While
ously measured methane is demonstrated in Fig. 2 for an                 clouds typically consist of water droplets with an effective
example day before the start of the analysed fires. In line             radius of the order of 10 µm, smoke is dominated by con-
with the error analysis based on synthetic data presented in            siderably smaller particles. The mass distribution of smoke
Schneising et al. (2019), there is typically a considerable             plumes shows a prominent peak at about 0.3 µm (Stith et al.,
underestimation of XCH4 in the presence of clouds due to                1981) but is nevertheless dominated by a small number of
shielding of the underlying partial columns. After application          supermicron-sized particles, including some very large par-
of the alternative quality filter, there are no obvious issues          ticles (Radke et al., 1990). As a consequence of the differ-
with the XCO data. The relaxed quality screening algorithm              ent size distributions, clouds have a typical Ångström ex-
provides similar results as the standard filter concerning the          ponent α = 0 and thus no wavelength dependence of the
overall agreement rate with the VIIRS cloud product but ac-             aerosol optical depth, while biomass burning aerosols have
tually yields more scenes passing the filter (about 20 % for            a distinct wavelength dependence with typical α ranging be-
the analysed example day).                                              tween 1 and 2 depending on the fire (Eck et al., 2009). The
   Figure 3 shows the daily XCH4 distribution over Cali-                submicron particles reduce visibility and lead to extended
fornia, which is used for quality screening. For each day,              smoke plumes over large distances in the VIIRS true colour
XCH4 resembles the prefire background abundances shown                  reflectances shown in Fig. 1. However, the 2.3 µm spectral
in Fig. 2a with the exception of considerable underestima-              range, in which the satellite measurements are taken, is sub-
tions here and there mainly due to reduced near-surface sen-            ject to little scattering at these small particles. The satellite
sitivity in the presence of clouds or smoke near the origin             retrievals close to the source of the fire are rather affected
of the fires. However, at a sufficient distance from the seat of        by the large supermicron-sized particles, which have a short
the fire the XCH4 abundances are not affected and a quantita-           atmospheric lifetime, tend to fall out rapidly (World Health
tive analysis is still possible, even in cases in which efficient       Organization, 2006), and thus become more and more negli-
scattering in the visible spectral range is indicated by exten-         gible when departing from the seat of the fire. Thus, a reliable
sive plumes in the VIIRS images. The explanation for this               XCO retrieval is possible in smoke plumes in the far field

Atmos. Chem. Phys., 20, 3317–3332, 2020                                                    www.atmos-chem-phys.net/20/3317/2020/
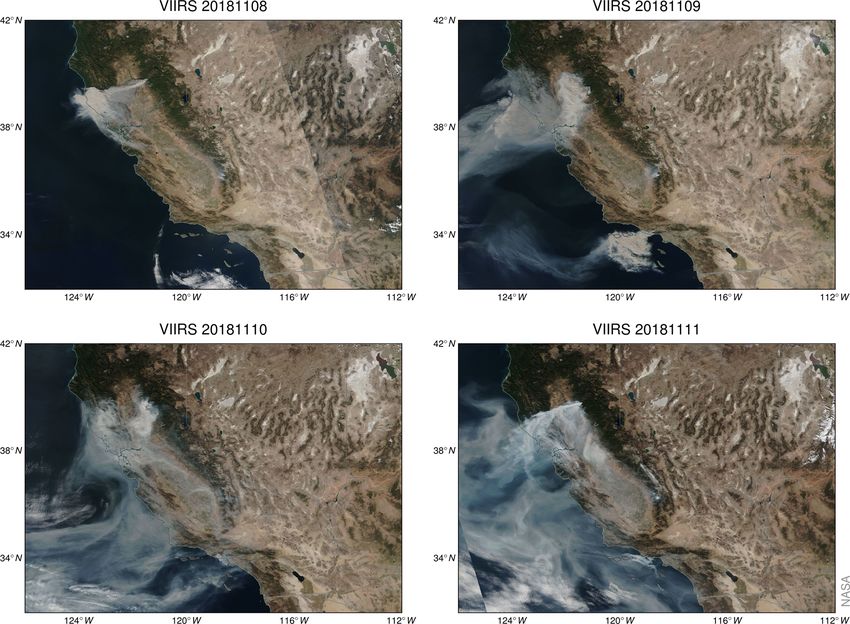
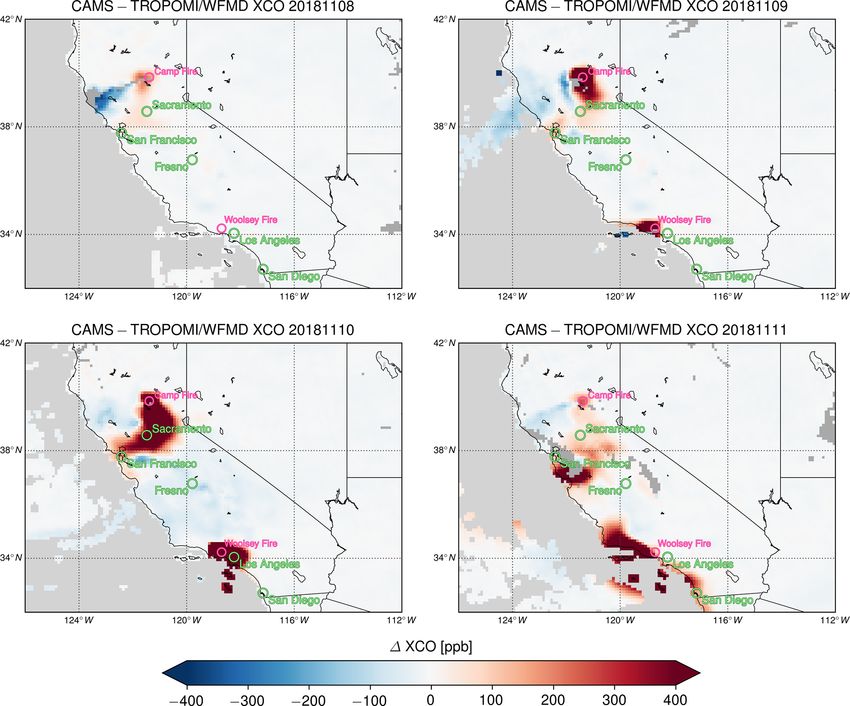
O. Schneising et al.: Californian wildfires in November 2018: the CO perspective                                                        3321

Figure 2. Performance of the implemented quality filter for the example day 31 October. (a) Cloud-free reference XCH4 abundances (5–
7 November). (b) Unfiltered XCH4 data. (c) XCO after application of the filter removing scenes with unrealistic low XCH4 . (d) Comparison
of the standard quality filter (SQF, 1: excluded) with the VIIRS cloud classification (1: cloudy). Matching classifications are shown in white
and green (agreement with VIIRS: 78 %, passing SQF: 32 %). (e) As before but for the alternative quality filter (AQF) used in the presented
analysis (agreement with VIIRS: 81 %, passing AQF: 39 %). (f) VIIRS true colour image.

of the fire origin for scenes passing the quality filter. Cor-           ferent. While the patterns are broadly consistent for 9 and
responding simulations with a realistic aerosol optical depth            10 November, the modelled wind fields close to the fires
and Ångström exponent are included in the error analysis in              seem to deviate on 8 and 11 November, which results in a
the next subsection to quantify the impact of scattering at              longer continuance of the plume over land, while the VI-
smoke aerosols.                                                          IRS images and the TROPOMI data suggest a faster transport
   Figure 4 shows the XCO distribution over California,                  westwards to the sea. This can also be seen in Fig. 6, show-
which matches the smoke emission and transport patterns de-              ing departures of the CAMS analysis from the TROPOMI
tected by VIIRS unambiguously. This substantiates the fact               XCO after averaging the satellite data on the CAMS resolu-
that the observed CO enhancements are actually originating               tion. Apart from the partially different transport patterns, the
from the wildfires. It can be seen that the abundances over the          intensity distribution close to the fire sources is also differ-
major cities we want to analyse are typically not filtered out           ent, with CAMS abundances being considerably higher for
and are thus suitable for a quantitative analysis. However, the          the most part and deviations reaching several hundred parts
quantitative interpretation of scenes right above or too close           per billion (ppb). This may be due to overestimated wild-
to the origin of the fire is limited by reduced vertical retrieval       fire fluxes, underestimated initial horizontal transport in the
sensitivity near the surface, and they are consequently filtered         vicinity of the fire sources, or a combination of both.
out.
   For comparison, Fig. 5 shows the CAMS near-real-time                  3.2    Boundary layer concentration anomalies and
CO analysis on a 0.1◦ × 0.1◦ grid for the same days shown                       associated uncertainties
in the previous figures and the closest available time to
the TROPOMI overpass at 13:30 local time. As CAMS is                     To assess the CO burden in Californian cities, the boundary
available in time steps of 6 h, the analysis corresponding               layer CO concentration anomaly is computed according to
to 16:00 local time is used for the comparison. Although                 Eq. (1). The diurnal variation of the ECMWF ERA5 bound-
CO emissions from the fires are obviously included in the                ary layer heights and their inherent uncertainties are illus-
CAMS data, the transport patterns seem to be somewhat dif-               trated in Fig. 7. There is a strong diurnal cycle, with low val-

www.atmos-chem-phys.net/20/3317/2020/                                                       Atmos. Chem. Phys., 20, 3317–3332, 2020
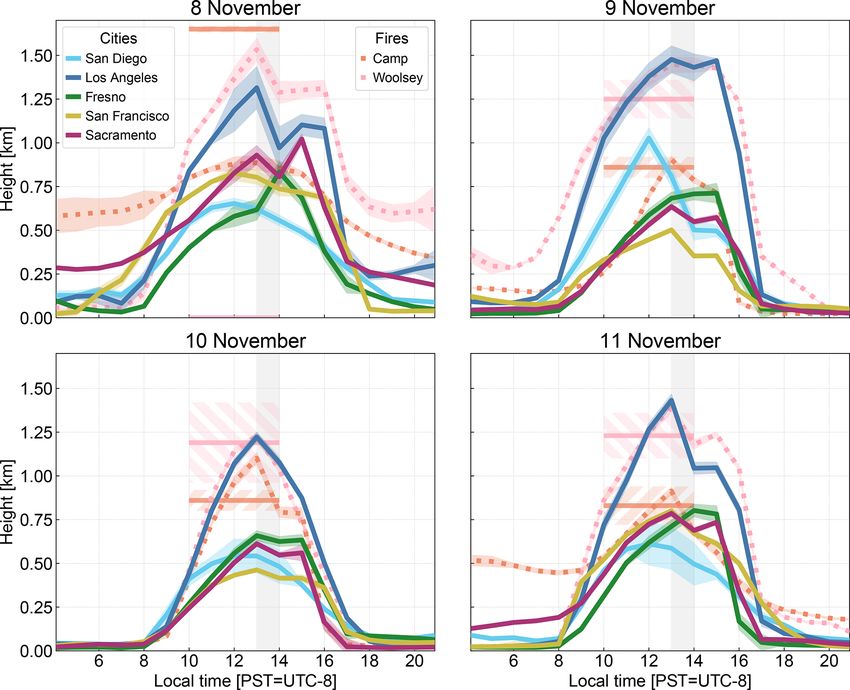
3322                                        O. Schneising et al.: Californian wildfires in November 2018: the CO perspective

Figure 3. Retrieved methane column-averaged mole fractions from TROPOMI for the same days as in Fig. 1. XCH4 is used to filter out
scenes with significant underestimation (dotted scenes), mainly due to reduced near-surface sensitivity in the presence of clouds or smoke
due to shielding of the subjacent partial columns. The Central Valley exhibits combined anthropogenic methane emissions from oil fields
and agriculture (Schneising et al., 2019).

ues at night and maximal values around local noon close to             sphere. The vertical distribution of emissions near the source
the time of the TROPOMI overpass at 13:30. The boundary                is driven by the fire radiative power and the local ambient at-
layer concentration uncertainty arising from boundary layer            mospheric conditions such as stability and humidity. Three
height σ (hbl ) is determined from the maximal ERA5 en-                types of wildfire plumes are distinguished by the amount
semble uncertainty between 13:00 and 14:00 local time and              of condensed water vapour during plume formation (Fromm
the variation within this hour in each case. Typical values of         et al., 2010): (1) dry smoke plumes, which contain water
σ (hbl ) range between 10 % and 25 %. The ERA5 boundary                vapour and usually stay within the boundary layer, (2) py-
layer height around the satellite overpass time is about 300 m         rocumulus containing water droplets either staying in the
smaller than the boundary layer height derived from aerosol            boundary layer or reaching the free troposphere depending
and turbulence detection lidar measurements by different re-           on atmospheric conditions, and extreme (3) pyrocumulonim-
trieval methods (Wang et al., 2019). This uncertainty asso-            bus scenarios containing ice particles and potentially reach-
ciated with the estimation method is additionally taken into           ing the stratosphere. Typically, most of the biomass burning
account in the error budget by an extra term σm (hbl ) quanti-         emissions stay within the mixing layer, and cases with pyro-
fying the percentage impact on the smaller end of 1ρbl .               convection or direct injection to the free troposphere or even
   The potentially largest source of uncertainty in the calcu-         higher are rare (Labonne et al., 2007; Mazzoni et al., 2007;
lation of the boundary layer CO burden is plume dynamics               Tosca et al., 2011).
and the question of whether all CO remains in the bound-                  As can be seen in Fig. 7, the IS4FIRES injection heights
ary layer or if a certain proportion reaches the free tropo-           corresponding to the top of the plume are equal to or smaller

Atmos. Chem. Phys., 20, 3317–3332, 2020                                                  www.atmos-chem-phys.net/20/3317/2020/
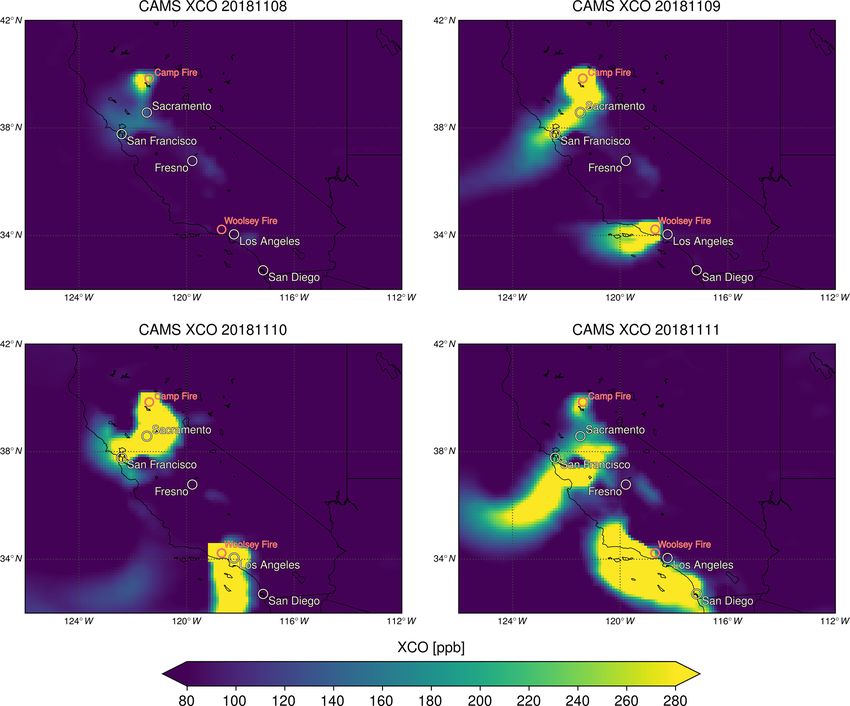
O. Schneising et al.: Californian wildfires in November 2018: the CO perspective                                                 3323

Figure 4. Retrieved carbon monoxide column-averaged mole fractions from TROPOMI for the same days as in Fig. 1. Dotted scenes are
excluded by the quality filter based on simultaneously retrieved XCH4 . Also shown is the mean wind in the boundary layer obtained from
ECMWF data.

than the respective maximum boundary layer height at the              rendering later deep moist convection with transport to the
location of the fires (all the more when considering the addi-        free troposphere during the first days of the fire at another
tional uncertainty associated with the estimation method of           location unlikely. Finally, there is also no indication for py-
the boundary layer height, which is not shown in the figure),         rocumulus or pyrocumulonimbus in the VIIRS true colour
with the exception of the first day of the Camp Fire. This            images as there is no obvious cloud formation over the fires
sole discrepancy may be linked to overestimated fire radia-           (see Fig. 1).
tive power for the Camp Fire on the day of ignition, which is            Nevertheless, partial venting to the free troposphere can-
also suggested by the comparison of the CAMS XCO analy-               not be entirely excluded and we therefore introduce an uncer-
sis to the TROPOMI retrievals, showing considerably higher            tainty σ (hinj ) arising from unknown plume dynamics, which
abundances for CAMS in the vicinity of the fire source. In            is only applied to the smaller end of the boundary layer con-
summary, the IS4FIRES injection height analysis indicates             centration anomaly because lost CO of this type can only
that most of the CO load stays within the boundary layer.             lead to an overestimation of the near-surface concentrations.
Furthermore, the entire state of California was at least ab-          σ (hinj ) for the analysed cities is estimated by the CO mass
normally dry within the analysed time period, with a moder-           fraction fa above the upper bound of the ERA5 boundary
ate drought at the Camp Fire origin and a severe drought at           layer height uncertainty range as determined from the CAMS
the seat of the Woolsey Fire according to the United States           model CO vertical profiles (see Fig. 8). As there is no in-
Drought Monitor (https://droughtmonitor.unl.edu/, last ac-            dication that the CO fraction in the free troposphere grows
cess: 20 January 2020). These are favourable conditions for           significantly during the analysed period over the cities con-
dry smoke plumes being trapped in the boundary layer, also            sidered, mean CAMS profiles for days with substantial CO

www.atmos-chem-phys.net/20/3317/2020/                                                  Atmos. Chem. Phys., 20, 3317–3332, 2020
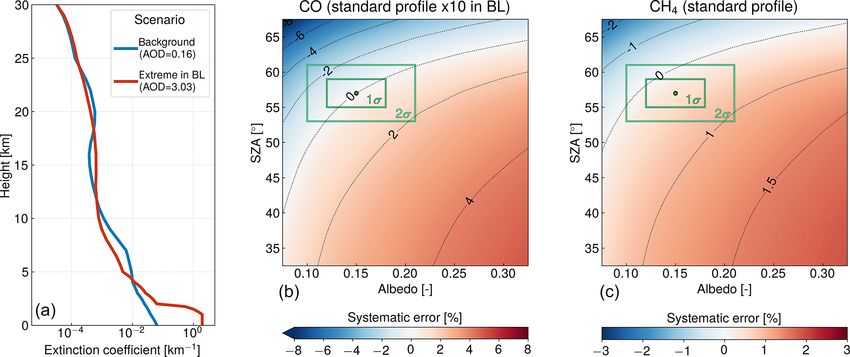
3324                                        O. Schneising et al.: Californian wildfires in November 2018: the CO perspective

Figure 5. CAMS near-real-time CO analysis for the first days of the fires at 24:00 UTC, corresponding to 16:00 local time (Pacific Standard
Time).

enhancement are examined. The CAMS CO profile analysis                  sun-normalised radiances for an assumed smoke scenario are
further reinforces the assumption that most of the emitted CO           calculated with the radiative transfer model, which are sub-
stays within the boundary layer even 4 d after ignition and at          sequently used as measurement input in the retrieval. The er-
a greater distance from the fire sources. fa is below 10 % with         rors are then defined as the deviation of the retrieved columns
the exception of San Diego. Thus, the uncertainty σ (hinj ) is          for the smoke scenario from the corresponding columns for
set to 30 % for San Diego and 10 % for the other cities.                the background scenario also used to calculate the forward
   Another potential error source associated with fires is              model lookup table. To model wildfire conditions at a suffi-
smoke aerosol. Scenes with reduced near-surface sensitivity             cient distance from the seat of the fire with low visibility but
due to clouds and smoke with large particles near the seat of           decreasing scattering issues at larger wavelengths (consistent
the fires are automatically filtered out using simultaneously           with Figs. 1 and 3) we use the extreme in BL aerosol sce-
measured methane. Figure 3 also demonstrates that methane               nario originally introduced in Schneising et al. (2008), con-
is not considerably increased compared to the prefire back-             taining urban aerosol with a significant soot fraction (Shettle
ground abundances (Fig. 2a) and that the XCO enhancement                and Fenn, 1979), combined with an extreme CO profile with
patterns are not resembled in XCH4 . Thus, it can be excluded           a 10-fold enhancement in the boundary layer compared to
that the detected XCO enhancement is only an artefact as a              the standard profile. The aerosol scenario used (aerosol opti-
result of light path lengthening because of aerosol scattering          cal depth τ550 nm ≈ 3 and Ångström exponent α ≈ 1) is con-
at the particulate matter of the smoke because such system-             sidered a realistic worst-case scenario for the analysed fires
atic errors would affect both retrieved gases similarly.                because it is at the upper end of optical depths and at the
   To assess the potential impact of smoke aerosol quanti-              lower end of Ångström exponents for typical fire aerosols
tatively, simulated measurements are used. This means that              (Eck et al., 2009). Furthermore, the corresponding aerosol

Atmos. Chem. Phys., 20, 3317–3332, 2020                                                   www.atmos-chem-phys.net/20/3317/2020/
O. Schneising et al.: Californian wildfires in November 2018: the CO perspective                                                  3325

Figure 6. Difference of CAMS XCO analysis to TROPOMI/WFMD satellite measurements.

profile is consistent with the previous results for the vertical        on 9 and 10 November due to the prevailing wind condi-
distribution of the emitted species during the first 4 d of the         tions, with boundary layer concentration anomalies of about
fires. Thus, the Camp Fire and the Woolsey Fire very likely             2.5 mg CO m−3 , which is well below the national CO air
exhibit less scattering in the 2.3 µm spectral range than our           quality standard of 10 mg m−3 even after adding a typical
model scenario assumes, at least during the period analysed.            background concentration of about 0.5–1.0 mg CO m−3 . The
The corresponding results are summarised in Fig. 9. Typical             cities in the southern part of the state are less affected owing
systematic CO errors for Californian cities on the analysed             to more favourable weather conditions.
days range between about −3 % and 2 % for the assumed                      Although the Sacramento and San Francisco city averages
aerosol type and CO profile. Therefore, the uncertainty due to          are compliant with air quality standards, the large associated
smoke aerosol σ (asmo ) is set to 5 %, adding an extra amount           areal variations indicate an uneven CO distribution within
due to the uncertainty of the actual aerosol type.                      both towns, in particular for Sacramento. This interpretation
   The total uncertainty of the boundary layer concentration            is supported by the CO distribution depicted in Fig. 4, show-
anomaly σ (1ρbl ) is determined by                                      ing that the plume’s edge of the Camp Fire is located near
                                                                        Sacramento, leading to a larger burden in the northwest com-
σ 2 (1ρbl ) =σ 2 (ACO ) + σ 2 (hbl ) + σm2 (hbl ) + σ 2 (hinj )         pared to the rest of the city.
              + σ 2 (asmo ).                                      (2)      The largest burden with respect to CO within all city
                                                                        radii is actually found on 10 November about 10 km to the
Averaged boundary layer concentration anomalies of CO                   east of Sacramento International Airport, where one finds
(relative to 7 November) in major Californian cities during             a considerable column enhancement of 3.14 g m−2 . Given
the first days of the Camp and Woolsey fires are presented              the ECMWF ERA5 boundary layer height of 580 m, this
in Fig. 10 together with the total uncertainty of Eq. (2) and           corresponds to a boundary layer concentration anomaly of
an estimate of the areal variation measuring the inhomo-                5.42 mg CO m−3 [3.41–6.00; 1σ ]. The largest enhancement
geneity of the CO concentrations within the city area. The              on 9 November is also located in the vicinity of Sacra-
largest values are found for Sacramento and San Francisco

www.atmos-chem-phys.net/20/3317/2020/                                                    Atmos. Chem. Phys., 20, 3317–3332, 2020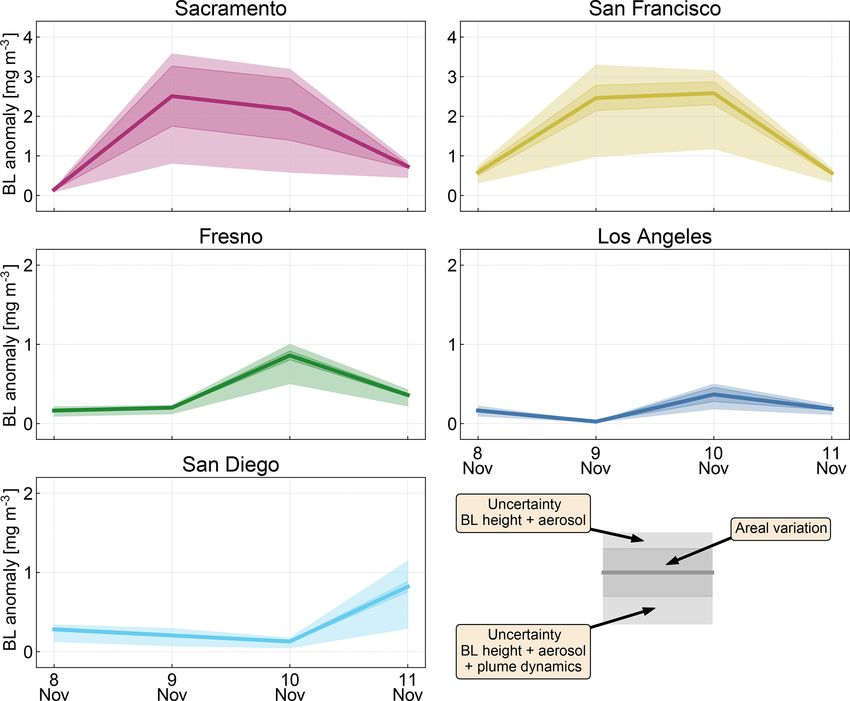
3326                                        O. Schneising et al.: Californian wildfires in November 2018: the CO perspective

Figure 7. Diurnal variations of the boundary layer heights obtained from the ECMWF ERA5 reanalysis for major Californian cities (solid)
and fires (dotted). The uncertainty estimates are based on a 10-member 4D-Var ensemble; the additional uncertainty associated with the
estimation method of the boundary layer height is not shown here. Also shown are mean IS4FIRES smoke injection heights and their
variation for both analysed fires as horizontal bars and hatched areas. The grey-shaded area illustrates the TROPOMI overpass time. On
8 November the injection height of the Woolsey Fire is zero because it started later in the day.

Figure 8. Mean CAMS CO profile enhancement relative to the prefire background (7 November). Fresno is not shown because there is no
significant enhancement during 8–11 November in the CAMS model. The upper edges of the grey areas represent the surface pressure, the
black vertical lines illustrate the upper bound of the uncertainty range of the estimated mean ERA5 boundary layer height, and fa is the CO
mass fraction above the boundary layer.

mento Airport (about 10 km to the southwest) and amounts to             most polluted city scenes and after adding a typical back-
3.13 g m−2 , with a boundary layer height of 592 m leading to           ground of about 0.5–1.0 mg CO m−3 .
a boundary layer concentration anomaly of 5.28 mg CO m−3                   To further assess the described area with significantly
[3.32–5.93; 1σ ]. Thus, the national ambient air quality stan-          increased boundary layer concentrations, we revisit the
dard of 10 mg CO m−3 was likely not exceeded even for the               discussed contaminated scene near Sacramento Interna-

Atmos. Chem. Phys., 20, 3317–3332, 2020                                                   www.atmos-chem-phys.net/20/3317/2020/
O. Schneising et al.: Californian wildfires in November 2018: the CO perspective                                                        3327

Figure 9. Panel (a) shows the aerosol extinction profiles used in the analysis of smoke aerosol errors. Also given are the corresponding
aerosol optical depths at 550 nm. The other panels show the systematic errors of CO and CH4 as a function of solar zenith angle and albedo
when using the extreme instead of the background aerosol scenario. The green boxes highlight the typical conditions for the Californian
cities on the analysed days using percentiles corresponding to 1σ (68 % of data) and 2σ (95 % of data). The green circle is the pair of median
albedo and median solar zenith angle.

Figure 10. Averaged boundary layer concentration anomalies of CO (relative to 7 November) and associated areal variations and uncertainties
(1σ ) in major Californian cities during the first days of the Camp and Woolsey fires.

tional Airport on 10 November and analyse associated re-                 of 5.93 g m−2 , corresponding to a boundary layer concentra-
sults from CAMS and ground-based air quality monitor-                    tion anomaly of 10.23 mg CO m−3 [6.51–11.04; 1σ ] using
ing data provided by the California Air Resources Board.                 the ERA5 boundary layer height and the associated uncer-
For the grid box comprising the mentioned satellite scene,               tainties. Although this is almost twice as high as the satellite-
CAMS predicts a considerably larger column enhancement                   derived concentration anomaly and potentially exceeds the

www.atmos-chem-phys.net/20/3317/2020/                                                       Atmos. Chem. Phys., 20, 3317–3332, 2020
3328 O. Schneising et al.: Californian wildfires in November 2018: the CO perspective
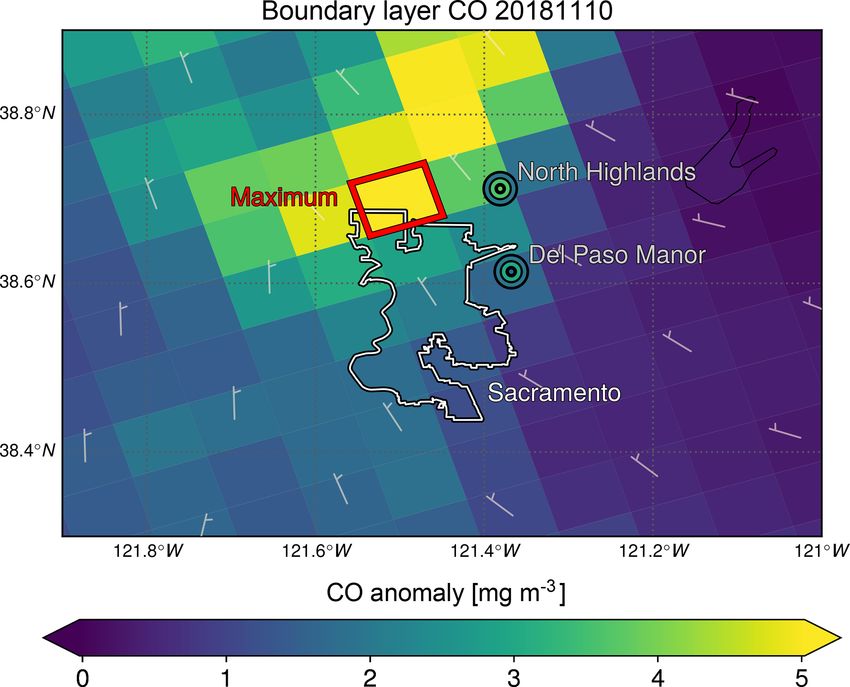
Figure 11 shows the boundary layer concentration anoma-
lies in Sacramento and its surrounding districts, allowing for
an overview of the situation by highlighting the locations of
the different measurements. As can be seen, the AQMIS sites
are located east of the satellite scene with the maximal city
area CO value, where concentrations are beginning to decline
steeply. The corresponding satellite averages at both anal-
ysed AQMIS sites are broadly consistent with the ground-
based measurements, taking into account the potential vari-
ability within a satellite scene indicated by the scene-to-scene
gradient of the satellite data and the fact that the sites are lo-
cated at the edge of satellite scenes. While the ground-based
anomaly based on the maximum values in North Highlands
matches well with the value of the associated satellite scene,
the ground-based anomaly based on the daily averages rather
resembles the values of adjacent satellite scenes to the east
or to the south. At Del Paso Manor the opposite is true: the
Figure 11. Boundary layer concentration anomalies of Sacramento ground-based anomaly based on the daily averages fits the
and its environs determined from TROPOMI CO total column mea- surrounding satellite scene well, while the anomaly based
surements and boundary layer heights from the ECMWF ERA5 on the maximum values rather matches the adjacent satellite
reanalysis. Highlighted are the satellite scene with the maximal scene to the north.
city area value (5.42 mg CO m−3 [3.41–6.00; 1σ ], red) and the lo-
cation of the AQMIS sites in North Highlands and at Del Paso
Manor (black). The anomalies based on the maximum values of the 4 Conclusions
ground-based sites (3.60 and 3.00 mg CO m−3 ) are colour-coded in
the inner circle at the site location; the anomalies based on the daily
We have performed an analysis of atmospheric carbon
averages (1.93 mg CO m−3 each) are colour-coded in the outer cir-
monoxide (CO) concentration changes introduced by emis-
cle.
sions of fires using measurements in the shortwave infrared
spectral range of TROPOMI onboard the Sentinel-5 Precur-
national ambient air quality standards, the error bars of the sor satellite. The local CO emissions of Californian wildfires
CAMS and satellite-derived concentration anomalies almost and subsequent transport can be clearly observed from space.
overlap due to the relatively large uncertainties arising from Due to its unique features, CO retrievals from TROPOMI
boundary layer height estimation and unknown plume dy- have the potential to trigger model improvement and a better
namics. quantification of fire emissions through the assimilation of
Ground-based measurements are available from the Air satellite-derived XCO in integrated systems such as CAMS.
Quality and Meteorological Information System (AQMIS) Furthermore, new fields of application are enabled, in par-
network (California Air Resources Board, 2018), provid- ticular the detection of emission hot spots or air quality mon-
ing daily maximum and daily average values. There are itoring tasks, because large sources are readily detected in a
three CO measurement sites in Sacramento County. For the single overpass. The evaluation of TROPOMI’s capabilities
site at Bercut Drive in Sacramento the data set is incom- for dense air quality monitoring has shown that the quantita-
plete during the first days of the fire and therefore excluded tive assessment of the CO burden in major Californian cities
from the comparison. The second site at Blackfoot Way is possible on a daily recurrent basis using the example of
in North Highlands is located farther north and closer to the first days of the Camp Fire and Woolsey Fire in Novem-
the analysed contaminated satellite scene. The maximum ber 2018.
value during the first 4 d of the fire is stated to be 4.1 ppm However, the accurate determination of boundary layer
(4.8 mg CO m−3 ) on 10 November. Relative to the maxi- concentrations depends on reliable external mixing layer
mum value of 7 November this corresponds to a concen- height information. In the case of fires, the feasibility is also
tration anomaly of 3.60 mg CO m−3 . The third site is at subject to specific favourable circumstances affecting the
Del Paso Manor in Sacramento with a maximum value of vertical distribution of emissions. The local ambient atmo-
3.8 ppm (4.4 mg CO m−3 ) on 10 November corresponding to spheric conditions such as stability and humidity have to en-
a concentration anomaly of 3.00 mg CO m−3 . When using the sure that most of the fire emissions stay within the boundary
daily averages instead of the maximum values, the concentra- layer and that pyro-convection or direct injection to the free
tion anomalies amount to 1.93 mg CO m−3 for both sites. troposphere is unlikely. As a consequence, unknown plume
dynamics generally remain the largest source of uncertainty
in the calculation of the boundary layer CO burden caused
Atmos. Chem. Phys., 20, 3317–3332, 2020 www.atmos-chem-phys.net/20/3317/2020/O. Schneising et al.: Californian wildfires in November 2018: the CO perspective 3329
by wildfires. The case study presented here benefits from the projects GHG-CCI, GHG-CCI+, and S5L2PP, the Federal Ministry
fact that most of the emitted CO remains in the boundary of Education and Research project AIRSPACE, and by the State and
layer during the analysed period, which considerably reduces the University of Bremen.
the associated uncertainties. We acknowledge the use of VIIRS imagery from the NASA
The quantitative analysis has shown that even intense Worldview application (https://worldview.earthdata.nasa.gov/, last
access: 20 January 2020) operated by the NASA/Goddard Space
wildfire events are not necessarily associated with the ex-
Flight Center Earth Science Data and Information System (ESDIS)
ceedance of national ambient air quality standards in the far project as well as the use of data from the California Department
field of the fires because all major city scenes for the anal- of Forestry and Fire Protection and the U.S. Environmental Pro-
ysed days comply with the regulatory limits. This finding is tection Agency. We also thank the European Centre for Medium-
also confirmed by isolated ground-based air quality measure- Range Weather Forecasts (ECMWF) for providing the meteoro-
ments near the most polluted city scenes. logical analysis, the ERA5 reanalysis, the Copernicus Atmosphere
Increasing unusual weather conditions with dryness of Monitoring Service (CAMS) carbon monoxide analysis, and the
vegetation on the rise may lead to longer-lasting and more Global Fire Assimilation System (GFAS) data. Neither the Euro-
intense fire seasons in the future. Therefore, it is getting more pean Commission nor the ECMWF is responsible for any use that
and more important to monitor and forecast the air quality de- may be made of the Copernicus information or data it contains.
cline associated with wildfires in a changing climate to eval- Ground-based CO data were obtained using the Air Quality Data
(PST) Query Tool (https://www.arb.ca.gov/aqmis2/aqmis2.php, last
uate whether the compliance with regulatory limits will last
access: 20 January 2020) of the Air Quality and Meteorological In-
or not. This can be achieved by an integrated monitoring sys- formation System (AQMIS).
tem combining modelling with complementary information
from accurate ground-based measurements and observations
from various satellites. Financial support. The article processing charges for this open-
access publication were covered by the University of Bremen.
Data availability. The carbon monoxide and methane data sets
presented in this publication can be accessed via http://www. Review statement. This paper was edited by Thomas Röckmann
iup.uni-bremen.de/carbon_ghg/products/tropomi_wfmd/ (Schneis- and reviewed by two anonymous referees.
ing, 2019).
Author contributions. OS designed and operated the
TROPOMI/WFMD satellite retrievals, performed the data References
analysis, interpreted the results, and wrote the paper. MB, MR, HB,
and JPB provided significant conceptual input to the design of the Bauduin, S., Clarisse, L., Theunissen, M., George, M., Hurtmans,
TROPOMI/WFMD satellite retrievals, the interpretation, and the D., Clerbaux, C., and Coheur, P.-F.: IASI’s sensitivity to near-
improvement of the paper. All authors discussed the results and surface carbon monoxide (CO): Theoretical analyses and re-
commented on the paper. trievals on test cases, J. Quant. Spectrosc. Ra., 189, 428–440,
https://doi.org/10.1016/j.jqsrt.2016.12.022, 2017.
Bay Area Air Quality Management District: A Winter Spare the
Air Alert is being called through Monday, November 12, due
Competing interests. The authors declare that they have no conflict
to smoke impacts from the Butte County fire, Press Release,
of interest.
November 9, available at: http://www.baaqmd.gov/~/media/
files/communications-and-outreach/publications/news-releases/
2018/wsta_181109_2018_092-pdf.pdf (last access: 20 January
Special issue statement. This article is part of the special is- 2020), 2018.
sue “TROPOMI on Sentinel-5 Precursor: first year in operation Borsdorff, T., aan de Brugh, J., Hu, H., Hasekamp, O., Sussmann,
(AMT/ACP inter-journal SI)”. It is not associated with a confer- R., Rettinger, M., Hase, F., Gross, J., Schneider, M., Garcia, O.,
ence. Stremme, W., Grutter, M., Feist, D. G., Arnold, S. G., De Maz-
ière, M., Kumar Sha, M., Pollard, D. F., Kiel, M., Roehl, C.,
Wennberg, P. O., Toon, G. C., and Landgraf, J.: Mapping car-
Acknowledgements. This publication contains modified Coperni- bon monoxide pollution from space down to city scales with
cus Sentinel data and modified Copernicus Climate Change Service daily global coverage, Atmos. Meas. Tech., 11, 5507–5518,
Information (2018). Sentinel-5 Precursor is an ESA mission imple- https://doi.org/10.5194/amt-11-5507-2018, 2018.
mented on behalf of the European Commission. The TROPOMI Borsdorff, T., Andrasec, J., aan de Brugh, J., Hu, H., Aben, I.,
payload is a joint development by the ESA and the Netherlands and Landgraf, J.: Detection of carbon monoxide pollution from
Space Office (NSO). The Sentinel-5 Precursor ground-segment de- cities and wildfires on regional and urban scales: the benefit of
velopment has been funded by the ESA and with national contribu- CO column retrievals from SCIAMACHY 2.3 µm measurements
tions from the Netherlands, Germany, and Belgium. The research under cloudy conditions, Atmos. Meas. Tech., 11, 2553–2565,
leading to the presented results has in part been funded by the ESA https://doi.org/10.5194/amt-11-2553-2018, 2018b.
www.atmos-chem-phys.net/20/3317/2020/ Atmos. Chem. Phys., 20, 3317–3332, 20203330 O. Schneising et al.: Californian wildfires in November 2018: the CO perspective Bovensmann, H., Burrows, J. P., Buchwitz, M., Frerick, J., Noël, depth at an Arctic coastal site, J. Geophys. Res., 114, D11201, S., Rozanov, V. V., Chance, K. V., and Goede, A. P. H.: https://doi.org/10.1029/2008JD010870, 2009. SCIAMACHY – Mission Objectives and Measurement Modes, ECMWF: Part IV: Physical processes, IFS Documentation J. Atmos. Sci., 56, 127–150, https://doi.org/10.1175/1520- CY45R1, available at: https://www.ecmwf.int/node/18714 (last 0469(1999)0562.0.CO;2, 1999. access: 20 January 2020), 2018. Buchwitz, M., de Beek, R., Bramstedt, K., Noël, S., Bovensmann, Field, R. D., van der Werf, G. R., Fanin, T., Fetzer, E. J., Fuller, H., and Burrows, J. P.: Global carbon monoxide as retrieved from R., Jethva, H., Levy, R., Livesey, N. J., Luo, M., Torres, O., SCIAMACHY by WFM-DOAS, Atmos. Chem. Phys., 4, 1945– and Worden, H. M.: Indonesian fire activity and smoke pollu- 1960, https://doi.org/10.5194/acp-4-1945-2004, 2004. tion in 2015 show persistent nonlinear sensitivity to El Niño- Buchwitz, M., de Beek, R., Noël, S., Burrows, J. P., Bovens- induced drought, P. Natl. Acad. Sci. USA, 113, 9204–9209, mann, H., Schneising, O., Khlystova, I., Bruns, M., Bremer, H., https://doi.org/10.1073/pnas.1524888113, 2016. Bergamaschi, P., Körner, S., and Heimann, M.: Atmospheric Fromm, M., Lindsey, D. T., Servranckx, R., Yue, G., Trickl, T., carbon gases retrieved from SCIAMACHY by WFM-DOAS: Sica, R., Doucet, P., and Godin-Beekmann, S.: The Untold Story version 0.5 CO and CH4 and impact of calibration improve- of Pyrocumulonimbus, B. Am. Meteorol. Soc., 91, 1193–1210, ments on CO2 retrieval, Atmos. Chem. Phys., 6, 2727–2751, https://doi.org/10.1175/2010BAMS3004.1, 2010. https://doi.org/10.5194/acp-6-2727-2006, 2006. Fu, Y., Li, R., Huang, J., Bergeron, Y., Fu, Y., Wang, Y., and Gao, Z.: Buchwitz, M., Khlystova, I., Bovensmann, H., and Burrows, J. P.: Satellite-Observed Impacts of Wildfires on Regional Atmosphere Three years of global carbon monoxide from SCIAMACHY: Composition and the Shortwave Radiative Forcing: A Multiple comparison with MOPITT and first results related to the detec- Case Study, J. Geophys. Res., 123, 8326–8343, 2018. tion of enhanced CO over cities, Atmos. Chem. Phys., 7, 2399– Hersbach, H., de Rosnay, P., Bell, B., Schepers, D., Simmons, 2411, https://doi.org/10.5194/acp-7-2399-2007, 2007. A., Soci, C., Abdalla, S., Alonso-Balmaseda, M., Balsamo, G., Burrows, J. P., Hölzle, E., Goede, A. P. H., Visser, H., and Fricke, Bechtold, P., Berrisford, P., Bidlot, J.-R., de Boisséson, E., W.: SCIAMACHY – Scanning Imaging Absorption Spectrome- Bonavita, M., Browne, P., Buizza, R., Dahlgren, P., Dee, D., ter for Atmospheric Chartography, Acta Astronaut., 35, 445–451, Dragani, R., Diamantakis, M., Flemming, J., Forbes, R., Geer, https://doi.org/10.1016/0094-5765(94)00278-T, 1995. A. J., Haiden, T., Hólm, E., Haimberger, L., Hogan, R., Horányi, California Air Resources Board: Air Quality and Meteorological In- A., Janiskova, M., Laloyaux, P., Lopez, P., Munoz-Sabater, J., formation System, available at: https://www.arb.ca.gov/aqmis2/ Peubey, C., Radu, R., Richardson, D., Thépaut, J.-N., Vitart, F., aqmis2.php (last access: 20 January 2020), 2018. Yang, X., Zsótér, E., and Zuo, H.: Operational global reanalysis: California Department of Forestry and Fire Protection: Statistics progress, future directions and synergies with NWP, ERA Report and Events, available at: https://www.fire.ca.gov/stats-events/ Series, https://doi.org/10.21957/tkic6g3wm, 2018. (last access: 20 January 2020), 2019. Hillger, D., Seaman, C., Liang, C., Miller, S., Lindsey, Clerbaux, C., Boynard, A., Clarisse, L., George, M., Hadji-Lazaro, D., and Kopp, T.: Suomi NPP VIIRS Imagery eval- J., Herbin, H., Hurtmans, D., Pommier, M., Razavi, A., Turquety, uation, J. Geophys. Res.-Atmos., 119, 6440–6455, S., Wespes, C., and Coheur, P.-F.: Monitoring of atmospheric https://doi.org/10.1002/2013JD021170, 2014. composition using the thermal infrared IASI/MetOp sounder, At- Hutchison, K. D. and Cracknell, A. P.: Visible Infrared Imager Ra- mos. Chem. Phys., 9, 6041–6054, https://doi.org/10.5194/acp-9- diometer Suite: A New Operational Cloud Imager, CRC Press of 6041-2009, 2009. Taylor and Francis, London, 2005. Deeter, M. N., Edwards, D. P., Gille, J. C., and Drum- Inness, A., Blechschmidt, A.-M., Bouarar, I., Chabrillat, S., Cre- mond, J. R.: Sensitivity of MOPITT observations to carbon pulja, M., Engelen, R. J., Eskes, H., Flemming, J., Gaudel, monoxide in the lower troposphere, J. Geophys. Res., 112, A., Hendrick, F., Huijnen, V., Jones, L., Kapsomenakis, J., https://doi.org/10.1029/2007JD008929, 2007. Katragkou, E., Keppens, A., Langerock, B., de Mazière, M., Deeter, M. N., Martinez-Alonso, S., Andreae, M. O., and Schlager, Melas, D., Parrington, M., Peuch, V. H., Razinger, M., Richter, H.: Satellite-Based Analysis of CO Seasonal and Interannual A., Schultz, M. G., Suttie, M., Thouret, V., Vrekoussis, M., Variability Over the Amazon Basin, J. Geophys. Res., 123, 5641– Wagner, A., and Zerefos, C.: Data assimilation of satellite- 5656, 2018. retrieved ozone, carbon monoxide and nitrogen dioxide with de Laat, A. T. J., Gloudemans, A. M. S., Aben, I., and Schrijver, ECMWF’s Composition-IFS, Atmos. Chem. Phys., 15, 5275– H.: Global evaluation of SCIAMACHY and MOPITT carbon 5303, https://doi.org/10.5194/acp-15-5275-2015, 2015. monoxide column differences for 2004–2005, J. Geophys. Res., Kaiser, J. W., Heil, A., Andreae, M. O., Benedetti, A., Chubarova, 115, https://doi.org/10.1029/2009JD012698, 2010. N., Jones, L., Morcrette, J.-J., Razinger, M., Schultz, M. G., Drummond, J. R., Zou, J., Nichitiu, F., Kar, J., Deschambaut, R., Suttie, M., and van der Werf, G. R.: Biomass burning emis- and Hackett, J.: A review of 9-year performance and opera- sions estimated with a global fire assimilation system based tion of the MOPITT instrument, Adv. Space Res., 45, 760–774, on observed fire radiative power, Biogeosciences, 9, 527–554, https://doi.org/10.1016/j.asr.2009.11.019, 2010. https://doi.org/10.5194/bg-9-527-2012, 2012. Eck, T. F., Holben, B. N., Reid, J. S., Sinyuk, A., Hyer, E. J., Labonne, M., Bréon, F.-M., and Chevallier, F.: Injec- O’Neill, N. T., Shaw, G. E., Vande Castle, J. R., Chapin, tion height of biomass burning aerosols as seen from F. S., Dubovik, O., Smirnov, A., Vermote, E., Schafer, J. S., a spaceborne lidar, Geophys. Res. Lett., 34, L11806, Giles, D., Slutsker, I., Sorokine, M., and Newcomb, W. W.: https://doi.org/10.1029/2007GL029311, 2007. Optical properties of boreal region biomass burning aerosols Luo, M., Shephard, M. W., Cady-Pereira, K. E., Henze, D. K., Zhu, in central Alaska and seasonal variation of aerosol optical L., Bash, J. O., Pinder, R. W., Capps, S. L., Walker, J. T., and Atmos. Chem. Phys., 20, 3317–3332, 2020 www.atmos-chem-phys.net/20/3317/2020/
O. Schneising et al.: Californian wildfires in November 2018: the CO perspective                                                      3331

  Jones, M. R.: Satellite observations of tropospheric ammonia and        cal properties, Environmental Research Papers, Optical Physics
  carbon monoxide: Global distributions, regional correlations and        Division, Air Force Geophysics Laboratory, MA, 1979.
  comparisons to model simulations, Atmos. Environ., 106, 262–         Sofiev, M., Ermakova, T., and Vankevich, R.: Evaluation
  277, https://doi.org/10.1016/j.atmosenv.2015.02.007, 2015.              of the smoke-injection height from wild-land fires using
Mazzoni, D., Logan, J. A., Diner, D., Kahn, R., Tong, L., and Li,         remote-sensing data, Atmos. Chem. Phys., 12, 1995–2006,
  Q.: A data-mining approach to associating MISR smoke plume              https://doi.org/10.5194/acp-12-1995-2012, 2012.
  heights with MODIS fire measurements, Remote Sensi. Enviro.,         Stith, J. L., Radke, L. F., and Hobbs, P. V.: Particle emis-
  107, 138–148, https://doi.org/10.1016/j.rse.2006.08.014, 2007.          sions and the production of ozone and nitrogen oxides from
McMillan, W. W., Barnet, C., Strow, L., Chahine, M. T., McCourt,          the burning of forest slash, Atmos. Environ., 15, 73–82,
  M. L., Warner, J. X., Novelli, P. C., Korontzi, S., Maddy, E. S.,       https://doi.org/10.1016/0004-6981(81)90127-X, 1981.
  and Datta, S.: Daily global maps of carbon monoxide from             Swain, D. L., Horton, D. E., Singh, D., and Diffenbaugh, N. S.:
  NASA’s Atmospheric Infrared Sounder, Geophys. Res. Lett., 32,           Trends in atmospheric patterns conducive to seasonal precip-
  L11801, https://doi.org/10.1029/2004GL021821, 2005.                     itation and temperature extremes in California, Sci. Adv., 2,
Omaye, S. T.: Metabolic modulation of carbon monoxide toxi-               e1501344, https://doi.org/10.1126/sciadv.1501344, 2016.
  city, Toxicology, 180, 139–150, https://doi.org/10.1016/S0300-       The Royal Society: Ground-level ozone in the 21st century: fu-
  483X(02)00387-6, 2002.                                                  ture trends, impacts and policy implications, Science Policy Re-
Radeloff, V. C., Helmers, D. P., Kramer, H. A., Mockrin,                  port 15/08, available at: https://royalsociety.org/~/media/Royal_
  M. H., Alexandre, P. M., Bar-Massada, A., Butsic, V., Haw-              Society_Content/policy/publications/2008/7925.pdf (last access:
  baker, T. J., Martinuzzi, S., Syphard, A. D., and Stewart,              20 January 2020), 2008.
  S. I.: Rapid growth of the US wildland-urban interface raises        Tosca, M. G., Randerson, J. T., Zender, C. S., Nelson,
  wildfire risk, P. Natl. Acad. Sci. USA, 115, 3314–3319,                 D. L., Diner, D. J., and Logan, J. A.: Dynamics of fire
  https://doi.org/10.1073/pnas.1718850115, 2018.                          plumes and smoke clouds associated with peat and defor-
Radke, L. F., Lyons, J. H., Hobbs, P. V., Hegg, D. A., Sandberg,          estation fires in Indonesia, J. Geophys. Res., 116, D08207,
  D. V., and Ward, D. E.: Airborne Monitoring and Smoke Charac-           https://doi.org/10.1029/2010JD015148, 2011.
  terization of Prescribed Fires on Forest Lands in Western Wash-      Turquety, S., Hurtmans, D., Hadji-Lazaro, J., Coheur, P.-F., Cler-
  ington and Oregon: Final Report, United States Department of            baux, C., Josset, D., and Tsamalis, C.: Tracking the emission
  Agriculture, Forest Service, General Technical Report PNW-              and transport of pollution from wildfires using the IASI CO re-
  GTR-251, available at: https://www.fs.fed.us/pnw/pubs/gtr251.           trievals: analysis of the summer 2007 Greek fires, Atmos. Chem.
  pdf (last access: 20 January 2020), 1990.                               Phys., 9, 4897–4913, https://doi.org/10.5194/acp-9-4897-2009,
Sacramento Metropolitan Air Quality Management District: Wild-            2009.
  fire Smoke Statement, Press Release, November 9, avail-              United States Geological Survey: Digital Elevation – Global
  able at: http://www.airquality.org/Communications/Documents/            Multi-resolution Terrain Elevation Data 2010 (GMTED2010),
  SmokeHealthStatement_CampFire_110918_2.docx.pdf (last ac-               https://doi.org/10.5066/F7J38R2N, 2018.
  cess: 20 January 2020), 2018.                                        U.S. Environmental Protection Agency: National Ambient Air
Schneising, O.: TROPOMI/WFMD XCH4 and XCO v1.2, avail-                    Quality Standards (NAAQS) for Carbon Monoxide (CO), Fed-
  able at: http://www.iup.uni-bremen.de/carbon_ghg/products/              eral Register: 76 FR 54293, available at: http://www.gpo.gov/
  tropomi_wfmd/ (last access: 20 January 2020), 2019.                     fdsys/pkg/FR-2011-08-31/pdf/2011-21359.pdf (last access: 20
Schneising, O., Buchwitz, M., Burrows, J. P., Bovensmann, H.,             January 2020), 2011.
  Reuter, M., Notholt, J., Macatangay, R., and Warneke, T.: Three      Veefkind, J. P., Aben, I., McMullan, K., Förster, H., de Vries,
  years of greenhouse gas column-averaged dry air mole fractions          J., Otter, G., Claas, J., Eskes, H. J., de Haan, J. F., Kleipool,
  retrieved from satellite – Part 1: Carbon dioxide, Atmos. Chem.         Q., van Weele, M., Hasekamp, O., Hoogeveen, R., Landgraf,
  Phys., 8, 3827–3853, https://doi.org/10.5194/acp-8-3827-2008,           J., Snel, R., Tol, P., Ingmann, P., Voors, R., Kruizinga, B.,
  2008.                                                                   Vink, R., Visser, H., and Levelt, P. F.: TROPOMI on the ESA
Schneising, O., Buchwitz, M., Reuter, M., Heymann, J., Bovens-            Sentinel-5 Precursor: A GMES mission for global observations
  mann, H., and Burrows, J. P.: Long-term analysis of car-                of the atmospheric composition for climate, air quality and
  bon dioxide and methane column-averaged mole fractions re-              ozone layer applications, Remote Sens. Environ., 120, 70–83,
  trieved from SCIAMACHY, Atmos. Chem. Phys., 11, 2863–                   https://doi.org/10.1016/j.rse.2011.09.027, 2012.
  2880, https://doi.org/10.5194/acp-11-2863-2011, 2011.                Wang, C., Jia, M., Xia, H., Wu, Y., Wei, T., Shang, X.,
Schneising, O., Buchwitz, M., Reuter, M., Bovensmann, H., Bur-            Yang, C., Xue, X., and Dou, X.: Relationship analysis of
  rows, J. P., Borsdorff, T., Deutscher, N. M., Feist, D. G., Grif-       PM2.5 and boundary layer height using an aerosol and tur-
  fith, D. W. T., Hase, F., Hermans, C., Iraci, L. T., Kivi, R.,          bulence detection lidar, Atmos. Meas. Tech., 12, 3303–3315,
  Landgraf, J., Morino, I., Notholt, J., Petri, C., Pollard, D. F.,       https://doi.org/10.5194/amt-12-3303-2019, 2019.
  Roche, S., Shiomi, K., Strong, K., Sussmann, R., Velazco, V. A.,     Worden, H. M., Deeter, M. N., Edwards, D. P., Gille,
  Warneke, T., and Wunch, D.: A scientific algorithm to simulta-          J. C., Drummond, J. R., and Nédélec, P.: Observations
  neously retrieve carbon monoxide and methane from TROPOMI               of near-surface carbon monoxide from space using MO-
  onboard Sentinel-5 Precursor, Atmos. Meas. Tech., 12, 6771–             PITT multispectral retrievals, J. Geophys. Res., 115, D18314,
  6802, https://doi.org/10.5194/amt-12-6771-2019, 2019.                   https://doi.org/10.1029/2010JD014242, 2010.
Shettle, E. P. and Fenn, R. W.: Models for the aerosols of the lower   World Health Organization: Air quality guidelines global update
  atmosphere and the effects of humidity variations on their opti-        2005: particulate matter, ozone, nitrogen dioxide and sulfur diox-

www.atmos-chem-phys.net/20/3317/2020/                                                    Atmos. Chem. Phys., 20, 3317–3332, 2020
You can also read