Aerosol above-cloud direct radiative effect and properties in the Namibian region during the AErosol, RadiatiOn, and CLOuds in southern Africa ...
←
→
Page content transcription
If your browser does not render page correctly, please read the page content below
Atmos. Chem. Phys., 21, 8233–8253, 2021
https://doi.org/10.5194/acp-21-8233-2021
© Author(s) 2021. This work is distributed under
the Creative Commons Attribution 4.0 License.

Aerosol above-cloud direct radiative effect and properties in the
Namibian region during the AErosol, RadiatiOn, and CLOuds in
southern Africa (AEROCLO-sA) field campaign – Multi-Viewing,
Multi-Channel, Multi-Polarization (3MI) airborne simulator and
sun photometer measurements
Aurélien Chauvigné1 , Fabien Waquet1 , Frédérique Auriol1 , Luc Blarel1 , Cyril Delegove1 , Oleg Dubovik1 ,
Cyrille Flamant2 , Marco Gaetani2,3,6 , Philippe Goloub1 , Rodrigue Loisil1 , Marc Mallet4 , Jean-Marc Nicolas1 ,
Frédéric Parol1 , Fanny Peers5 , Benjamin Torres1 , and Paola Formenti6
1 CNRS,   UMR 8518, Laboratoire d’Optique Atmosphérique (LOA), Université Lille, 59000 Lille, France
2 LATMOS,    UMR CNRS 8190, Sorbonne Université, Université Paris-Saclay, Institut Pierre Simon Laplace, Paris, France
3 Classe di Scienze Tecnologie e Società, Scuola Universitaria Superiore IUSS, Pavia, Italy.
4 CNRM, Université de Toulouse, Météo-France, CNRS, Toulouse, France
5 College of Engineering, Mathematics, and Physical Sciences (CEMPS), University of Exeter, Exeter, EX4 4QE, UK
6 LISA, UMR CNRS 7583, Université Paris-Est Créteil, Université de Paris, Institut Pierre Simon Laplace, Créteil, France

Correspondence: Aurélien Chauvigné (aurelien.chauvigne@univ-lille.fr)

Received: 24 September 2020 – Discussion started: 16 October 2020
Revised: 2 April 2021 – Accepted: 6 April 2021 – Published: 28 May 2021

Abstract. We analyse the airborne measurements of above-        surements. The variations in the aerosol properties are con-
cloud aerosols from the AErosol, RadiatiOn, and CLOuds in       sistent with the different atmospheric circulation regimes ob-
southern Africa (AEROCLO-sA) field campaign performed           served during the deployment. Airborne observations typi-
in Namibia during August and September 2017. The study          cally show strong aerosol optical depth (AOD; up to 1.2 at
aims to retrieve the aerosol above-cloud direct radiative ef-   550 nm) of fine-mode particles from biomass burning (ex-
fect (DRE) with well-defined uncertainties. To improve the      tinction Ångström exponent varying between 1.6 and 2.2),
retrieval of the aerosol and cloud properties, the airborne     transported above bright stratocumulus decks (mean cloud
demonstrator of the Multi-Viewing, Multi-Channel, Multi-        top around 1 km above mean sea level), with cloud optical
Polarization (3MI) satellite instrument, called the Observing   thickness (COT) up to 35 at 550 nm. The above-cloud vis-
System Including PolaRisation in the Solar Infrared Spec-       ible AOD retrieved with OSIRIS agrees within 10 % of the
trum (OSIRIS), was deployed on-board the SAFIRE (Service        PLASMA2 sun photometer measurements in the same envi-
des Avions Français Instrumentés pour la Rechercheen Envi-      ronment.
ronnement) Falcon 20 aircraft during 10 flights performed          The single scattering albedo (SSA) is one of the most influ-
over land, over the ocean, and along the Namibian coast. The    ential parameters on the AAC DRE calculation that remains
airborne instrument OSIRIS provides observations at high        largely uncertain in models. During the AEROCLO-sA cam-
temporal and spatial resolutions for aerosol above clouds       paign, the average SSA obtained by OSIRIS at 550 nm is
(AACs) and cloud properties. OSIRIS was supplemented            0.87, which is in agreement within 3 %, on average, with
with the Photomètre Léger Aéroporté pour la surveillance        previous polarimetric-based satellite and airborne retrievals.
des Masses d’Air version 2 (PLASMA2). The combined air-         The strong absorption of the biomass burning plumes in the
borne measurements allow, for the first time, the validation    visible range is generally consistent with the observations
of AAC algorithms previously developed for satellite mea-       from the Aerosol Robotic Network (AERONET) ground-

Published by Copernicus Publications on behalf of the European Geosciences Union.
8234               A. Chauvigné et al.: Aerosol above-cloud direct radiative effect and properties in the Namibian region

based sun photometers. This, however, shows a significant           ing to warming in this region. Indeed, aerosol above cloud
increase in the particles’ absorption at 440 nm in northern         (AAC) highly contributes to climate uncertainties, and very
Namibia and Angola, which indicates more absorbing or-              few methods currently allow the retrieval of a detailed model
ganic species within the observed smoke plumes. Biomass             of their properties (Waquet et al., 2013b; Knobelspiesse et
burning aerosols are also vertically collocated, with signifi-      al., 2011; Peers et al., 2015). Peers et al. (2016) reported
cant amounts of water content up to the top of the plume at         disagreements between five AeroCom models and satellite
around 6 km height in our measurements.                             observations of AAC from the Polarization and Directional-
   The detailed characterization of aerosol and cloud prop-         ity of the Earth’s Reflectances (POLDER) instrument. Most
erties, water vapour, and their uncertainties obtained from         models do not reproduce the large aerosol load measured
OSIRIS and PLASMA2 measurements allows us to study                  above the clouds by POLDER. This study also demonstrated
their impacts on the AAC DRE. The high-absorbing load               that large discrepancies exist between these climate models
of AAC, combined with high cloud albedo, leads to un-               in terms of AAC absorption and load. The authors explained
precedented DRE estimates, which are higher than previ-             these differences in the models by using different parameter-
ous satellite-based estimates. The average AAC DRE calcu-           izations for the aerosol injection heights, vertical transport,
lated from the airborne measurements in the visible range is        and absorption properties. De Graaf et al. (2014) demon-
+85 W m−2 (standard deviation of 26 W m−2 ), with instanta-         strated significant biases between the above-cloud DRE es-
neous values up to +190 W m−2 during intense events. These          timated from satellite observations and modelled DRE in
high DRE values, associated with their uncertainties, have to       the SEA region. The modelled instantaneous DRE was es-
be considered as new upper cases in order to evaluate the           timated to be 5 times lower than the ones calculated with the
ability of models to reproduce the radiative impact of the          measurements provided by the SCanning Imaging Absorp-
aerosols over the southeastern Atlantic region.                     tion SpectroMeter for Atmospheric CHartographY (SCIA-
                                                                    MACHY) sensor (i.e. 30–35 W m−2 for SCIAMACHY re-
                                                                    trievals versus 6 W m−2 for the DRE computed with a global
                                                                    model). The authors explained that these differences could
1   Introduction                                                    be partially explained by an underestimation of the aerosol
                                                                    absorption in the visible and UV part of the spectrum. Mallet
Aerosols from natural and anthropogenic sources impact the          et al. (2020) also studied the sensitivity of the DRE to the ab-
climate directly, by interacting with solar and terrestrial radi-   sorption property of biomass burning aerosols in the SEA re-
ations, and indirectly, through interactions with cloud prop-       gion using two regional climate models. Their work demon-
erties (IPCC, 2013). According to their origin and the atmo-        strated a low bias in the modelled above-cloud AOD of
spheric transport, aerosol particles are unequally distributed      about 40 % (in relative units) between modelled and observed
in the troposphere where they can reside for several days or        (Moderate Resolution Imaging Spectroradiometer, MODIS,
weeks. As a consequence, their chemical, optical, and micro-        and POLDER) above-cloud aerosol optical depth (AOD) in
physical properties also present a strong variability (Lagzi et     the region, which is necessarily reflected in an underestimate
al., 2014).                                                         of the modelled DRE.
   Aerosol particles significantly impact the radiative budget         In order to retrieve aerosol DRE above the clouds in the
of the Earth. However, due to the high variability in aerosol       SEA region with well-defined uncertainties which is needed
properties and their distributions in the atmosphere, the accu-     to evaluate climate models, one needs first to characterize
rate quantification of their direct radiative effects (DREs) re-    aerosols and cloud optical and microphysical properties. Be-
mains uncertain. Climate models require several assumptions         cause the simultaneous retrieval of aerosol and cloud proper-
to represent aerosols, clouds, and their interactions, resulting    ties is still challenging (Cochrane et al., 2019), the European
in a large diversity of aerosol DRE. The Aerosol Compar-            Space Agency (ESA) and the European Organisation for the
isons between Observations and Models (AeroCom) experi-             Exploitation of Meteorological Satellites (EUMETSAT) de-
ment shows biases between the most recent observations and          veloped a new spaceborne Multi-Viewing, Multi-Channel,
models (Myhre et al., 2013; Samset et al., 2014). Significant       Multi-Polarization imager (3MI) to be launched in 2022 on
biases are notably observed in particular in the southeast-         board the Meteorological Operational Satellite Second Gen-
ern Atlantic (SEA) region where highly absorbing particles          eration (MetOp-SG) satellite. To evaluate the next generation
coexist with low-level stratocumulus cloud (Zuidema et al.,         of retrieval algorithms, a 3MI airborne prototype, Observing
2016).                                                              System Including PolaRisation in the Solar Infrared Spec-
   The SEA region presents, therefore, a unique opportunity         trum (OSIRIS; Auriol et al., 2008), has been developed at
to study aerosol–cloud–radiation interactions and the impact        Laboratoire d’Optique Atmospheric (LOA; France). The to-
of highly absorbing particles from biomass burning in central       tal and polarized radiances sampled by OSIRIS are between
Africa, which are still debated (Bellouin and the Ringberg          440 and 2200 nm, and the new retrieval algorithms developed
2018 review team, 2020). The AeroCom study (Zuidema                 by Waquet et al. (2013a) and Peers et al. (2015), allow us to
et al., 2016) demonstrates a net aerosol DRE from cool-             simultaneously retrieve the aerosol and the cloud properties

Atmos. Chem. Phys., 21, 8233–8253, 2021                                               https://doi.org/10.5194/acp-21-8233-2021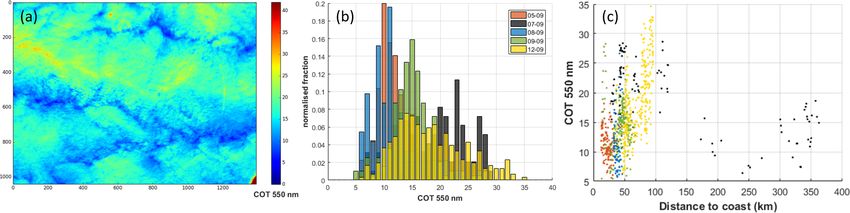
A. Chauvigné et al.: Aerosol above-cloud direct radiative effect and properties in the Namibian region 8235
in case of AACs. Additionally, polarimetric measurements 2 Flights patterns and general atmospheric circulation
constitute a promising opportunity for the simultaneous re- description.
trieval of the aerosol and the surface properties (Dubovik et
al., 2011, 2019).
In addition to the aerosol–cloud interaction, the SEA re- The AEROCLO-sA deployment comprised the measure-
gion also represents a unique opportunity to study the di- ments from the ground-based station of Henties Bay,
rect radiative effects of highly absorbing particles transported Namibia (22◦ 60 S, 14◦ 300 E; 20 m above sea level – a.s.l.)
above the clouds. In this region, smoke aerosol plumes can from 23 August to 12 September 2017 (Formenti et al.,
reach high altitudes (up to 6 km) and can be transported for 2019).
several days in the atmosphere (Samset et al., 2014; Marenco The airborne component was conducted by the SAFIRE
et al., 2016) and overlay low-level clouds which are persis- (Service des Avions Français Instrumentés pour la Recherche
tent over water. These considerations have motivated a sig- en Environnement) Falcon 20 aircraft from 5 to 12 Septem-
nificant number of intensive field campaigns between 1992 ber 2017. A total of 10 flights were performed over the ocean
and 2018 (Formenti et al., 2019). Pistone et al. (2019) ob- and land in the area from 7◦ 300 E to 20◦ E and from 17◦ S to
tain single scattering albedo (SSA) values for biomass burn- 22◦ 300 S (Fig. 1). There were also two pre-campaign flights
ing aerosols from both airborne in situ and remote sens- (not presented here) performed over the Mediterranean Sea
ing methods during the ObseRvations of Aerosols above during summer 2017. Those flights correspond to pristine
CLouds and their intEractionS (ORACLES) airborne cam- conditions over both clear and cloudy ocean scenes and were
paign performed close to the Namibian coast in August– used for instrumental calibration.
September 2016. From a sweeping-view-mode imager (the The locations of the OSIRIS observations used in the
Airborne Multiangle SpectroPolarimetric Imager, AirMSPI), present study are shown in Fig. 1a. Several filters are ap-
mean SSA values at 550 nm were observed between 0.83 plied to the OSIRIS measurements to ensure optimum condi-
and 0.89 in August–September 2016. Mean SSAs ranging tions for the retrieval (i.e. homogeneous cloud fields and sta-
between 0.82 and 0.92 (from June to October 2006) were ble flight conditions). As a first quality assurance, only stable
also retrieved at 550 nm over a large region centred on the flight conditions at a high altitude (higher than 8 km a.s.l.) are
southeastern Atlantic Ocean using POLDER (Peers et al., selected. In addition, high-altitude clouds and heterogeneous
2016). A previous study based on Aerosol Robotic Network cloud scenes are rejected. The selected cases for OSIRIS in-
(AERONET) retrievals (Eck et al., 2013) has shown similar versions for AAC represent 76 % of cloudy measurements
SSA values during the fire season. The latter study demon- at high altitude (> 7 km). In these conditions, a total of 2 h
strated that the seasonal trend of SSA in this region was and 15 min of OSIRIS measurements were processed. Fig-
mainly due to a change in aerosol composition and, partic- ure 1b also represents the PLASMA2 measurements, used in
ularly, in the black carbon fraction. the present study, which correspond to low flight levels and
Therefore, the new observation capabilities proposed by stable flight conditions.
the airborne instrument OSIRIS give an interesting opportu- Data from the Copernicus Atmospheric Monitoring Sys-
nity to characterize both cloud and absorbing particles in or- tem (CAMS) reanalysis (Flemming et al., 2017) allow us to
der to retrieve the aerosol DRE with high accuracy. Results obtain the biomass burning plume trajectory at 6 h resolu-
are beneficial for constraining climate models and satellite tion at a 0.75◦ × 0.75◦ spatial resolution. In Fig. 2, the atmo-
retrievals in a climate-sensitive region (Mallet et al., 2019). spheric circulation and the associated biomass burning plume
In this paper, we present aerosol and cloud retrievals per- during the field campaign are represented by the geopotential
formed over the SEA region essential for the calculation height and wind at 700 hPa and the biomass burning Aerosol
of the aerosol DRE. Measurements are performed by the optical depth (AOD) at 550 nm. The plume path is displayed
OSIRIS and the PLASMA2 airborne instruments deployed by highlighting the wind vectors at grid points with AOD
during the AErosol, RadiatiOn, and CLOuds in southern higher than the 90th percentile of the AOD in the region (red
Africa (AEROCLO-sA) field campaign in Namibia during arrows).
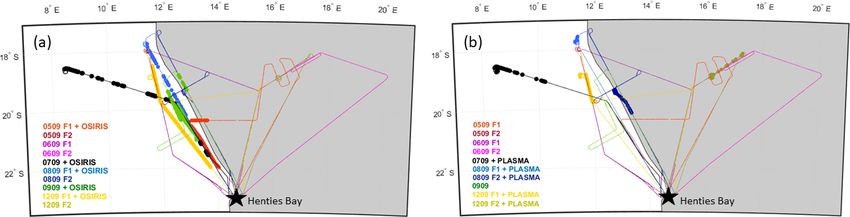
the biomass burning period in 2017 (Formenti et al., 2019). The regional atmospheric circulation on 8 September
Section 2 describes the flight trajectories and the main mete- (Fig. 2a) represents the mean circulation during this period,
orological conditions encountered during the campaign. In with air masses coming from tropical Africa, moving west-
Sect. 3, the OSIRIS, airborne and ground-based sun pho- ward until Ascension Island, which are then deflected to
tometer, and airborne lidar Leandre New Generation (LNG) the southeast due to the anticyclone centred over southern
retrieval methods are described. Section 4 reports the mean Africa. These conditions were observed during most of the
aerosol and cloud properties retrieved in the Namibian re- AEROCLO-sA campaign, except on 5 September (Fig. 2b)
gion essential for aerosol DRE retrievals. Finally, the results when the anticyclone was centred over the Indian Ocean
are summarized and discussed in Sect. 5. between the South African coast and Madagascar. During
this specific day, air masses were mostly transported over
the continent, and dust emissions were reported from both
https://doi.org/10.5194/acp-21-8233-2021 Atmos. Chem. Phys., 21, 8233–8253, 2021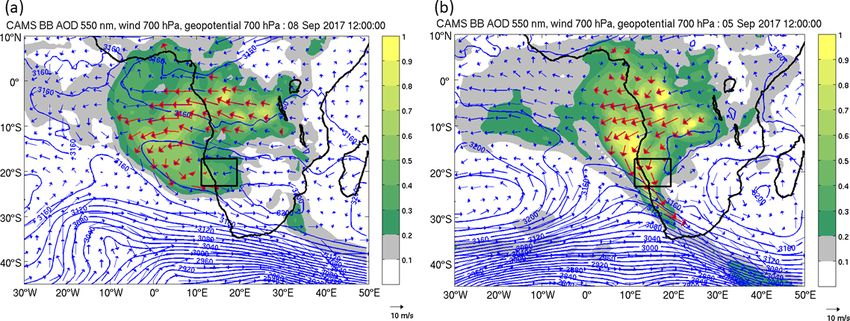
8236              A. Chauvigné et al.: Aerosol above-cloud direct radiative effect and properties in the Namibian region

Figure 1. Flight tracks of the 10 flights of the AEROCLO-sA campaign over the Namibian coast in September 2017. Circles indicate the
(a) OSIRIS inversion locations and (b) PLASMA-2 measurement locations at low flight altitudes.

Figure 2. Regional atmospheric circulation and aerosol for (a) 8 September 2017 and (b) 5 September 2017 at 12:00 UTC. Geopotential
height (contours) and wind (arrows) at 700 hPa and biomass burning AOD at 550 nm (shading) from CAMS reanalysis are displayed. Red
arrows highlight wind vectors at grid points where the AOD is higher than the 90th percentile of the regional AOD. The AEROCLO-sA
campaign region is shown with a black rectangle in the Namibian region.

the climate model and the airborne lidar measurements (For-         tor and around 60 m for the SWIR one at a height of 10 km.
menti et al., 2019).                                                This high resolution allows us to record the same scene up
                                                                    to 16 times (at 10 km height) from different viewing angles.
                                                                    Polarized measurements are available at 440, 490, 670, 870,
3     Instrumentation                                               1020, 1600, and 2200 nm. Measurements without polariza-
                                                                    tion capabilities are also performed in molecular absorption
3.1    The 3MI airborne prototype – OSIRIS                          bands (763, 765, 910, 940, and 1365 nm), and for a channel
                                                                    centred at 1240 nm, in addition to the channels previously
The OSIRIS imager provides both total and polarized ra-             listed.
diances measurements. The airborne instrument is charac-               The aerosol and cloud retrievals are performed using the
terized by two optical systems, i.e. one for the visible and        OSIRIS measurements at 670 and 870 nm. A moving aver-
near-infrared range (VIS-NIR; from 440 to 940 nm) with a            age is applied on measurements over a few pixels before the
wide field of view of 114◦ and one for the shortwave in-            retrieval is achieved. The related radiometric noise is then
frared range (SWIR; from 940 to 2200 nm) with a field of            estimated to be lower than 5 × 10⁻⁴ and 5 × 10⁻³ for the
view of 105◦ . The 2D detectors, which are respectively a           total and polarized normalized radiances, respectively. After
charge-coupled device (CCD) matrix of 1392 × 1040 pixels            all radiometric and geometric treatments are applied to the
and a mercury cadmium telluride (MCT) focal plane array of          data (Auriol et al., 2008), the errors due to absolute calibra-
320 × 256 pixels, allow us to obtain very high-resolution im-       tion are expected to be lower than 3 % for these channels.
ages with a spatial resolution of 20 m for the VIS-NIR detec-

Atmos. Chem. Phys., 21, 8233–8253, 2021                                               https://doi.org/10.5194/acp-21-8233-2021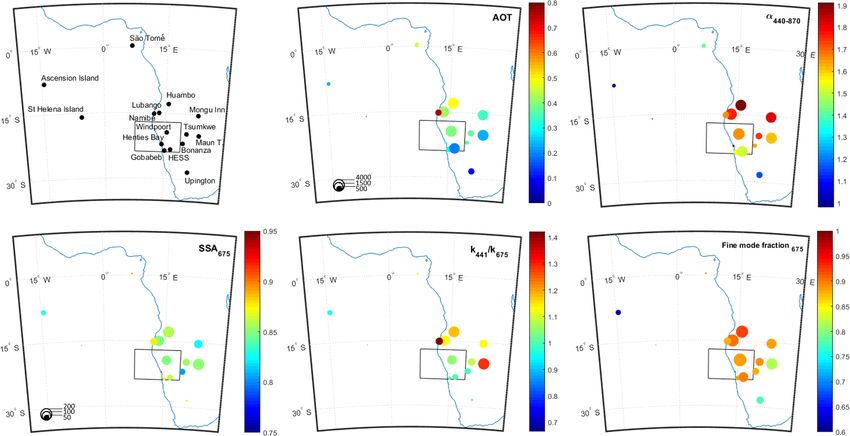
A. Chauvigné et al.: Aerosol above-cloud direct radiative effect and properties in the Namibian region 8237
The absolute calibration accuracy was improved for the vis- during the AEROCLO-sA campaign. The AOD of the at-
ible radiances using in-flight calibration technics (Hagolle et mospheric column above the aircraft is retrieved at nine
al., 1999) applied to OSIRIS measurements acquired over the wavelengths (340, 379, 440, 500, 532, 674, 871, 1020, and
Mediterranean Sea. 1641 nm) from the PLASMA2 measurements. PLASMA
The algorithm used to retrieve the AAC properties with (versions 1 and 2) observations have been validated against
OSIRIS is based on an optimal estimation method (OEM) de- in situ AERONET and satellite measurements (Mallet et al.,
veloped for the POLDER instrument (Waquet et al., 2013a). 2016; Rivellini et al., 2017; Torres et al., 2017; Formenti et
This method allows us to simultaneously retrieve the aerosol al., 2018; Hu et al., 2019), indicating that the accuracy of
and the cloud properties (Waquet et al., 2013b; Peers et al., the AOD retrievals is of the order of 0.01, regardless of the
2015). Here, the aerosol retrieval is performed using the mea- wavelength. During AEROCLO-sA, several low-level flights
surements in the solar plane of each image. The aerosol prop- were performed, typically near the cloud top, when measure-
erties are then assumed to be spatially homogenous over the ments were performed over the ocean, and near the ground
entire OSIRIS visible image (of about 20 × 20 km2 ). Finally, under clear sky conditions, when the low-level flights were
the cloud properties are retrieved pixel by pixel over the en- performed over desert sites. PLASMA2 measurements per-
tire image. As demonstrated in Waquet et al. (2013a), this formed at high altitudes allowed us to characterize the resid-
procedure increases the sensitivity of the algorithm to the ual columnar AOD above the aircraft. This quantity was sub-
aerosol properties. tracted from PLASMA2 AODs measurements performed at
The algorithm mainly provides AOD, SSA, extinction low altitude for the sake of comparison with OSIRIS re-
Ångström exponent (α), and the cloud optical thickness trievals. Because PLASMA2 does not allow us to perform
(COT). SSA is defined as the ratio of the scattering to the almucantar measurements as AERONET sun photometers,
extinction coefficient and primarily depends on the aerosol the fractions of fine- and coarse-mode AOD were derived
absorption (i.e. the imaginary part of the complex refractive from the PLASMA2 spectral AOD measurements using the
index) and also the particle size (Dubovik et al., 1998; Rede- Generalized Retrieval of Atmosphere and Surface Properties
mann et al., 2001). The Ångström exponent is indicative of (GRASP) algorithm (Dubovik et al., 2014). GRASP also al-
the particle size (Reid et al., 1999; Schuster et al., 2006). The lows us to retrieve the volume size distribution from spectral
retrieved quantities are used to compute the instantaneous AODs (Torres et al., 2017), assuming a complex refractive
DRE over the solar spectrum, considering the following two index (i.e. 1.50 + 0.025) and a bimodal log-normal particle
main assumptions on the aerosol microphysics: (1) the com- size distribution with fixed modal widths.
plex refractive index of aerosols is assumed to be spectrally
invariant, i.e. the imaginary part is retrieved and the real part 3.3 Airborne lidar LNG
value is fixed to 1.51, which is a reasonable average value for
biomass burning aerosols, (Dubovik et al., 2000) and (2) the The vertical structure of the aerosol and cloud layers be-
particle size is retrieved only for the fine mode (particle di- low the aircraft was obtained from the nadir pointing air-
ameters below 1 µm). Moreover, the polarized measurements borne lidar LNG. The signal backscattered to the LNG sys-
acquired for scattering angles larger than 130◦ are sensitive tem telescope at 1064 nm is range square corrected to pro-
to the 3D cloud geometry effects on radiative transfer (Cornet duce atmospheric reflectivity. The total attenuated backscat-
et al., 2018). Since clouds are assumed to be plane parallel in ter coefficient (ABC) profiles are derived from atmospheric
the simulations, the method is simply applied to observations reflectivity profiles by normalizing the atmospheric reflec-
acquired for scattering angles smaller than 130◦ . tivity above the aerosol layers to the molecular backscatter
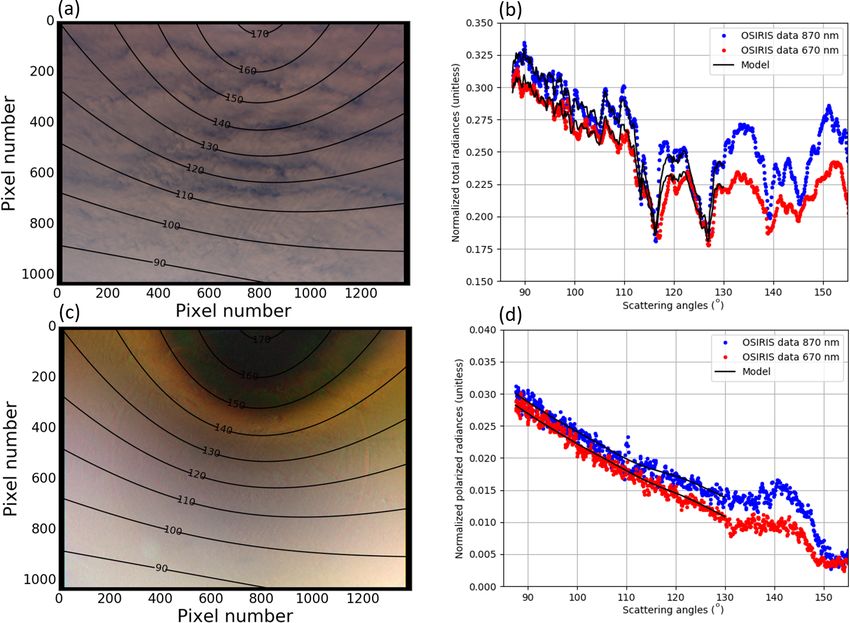
Figure 3 shows an example of the measured and modelled coefficient profiles. Hence, the slope of the lidar reflectivity
radiances after the convergence is reached. It shows that the above 6.5 km a.s.l. matched that of the molecular backscatter
method allows us to robustly model the selected data within derived from dropsonde measurements of pressure and tem-
the measurement noise. For these values of scattering angles, perature. The vertical resolution of the ABC profiles is 30 m,
the sensitivity of polarization to cloud microphysics is mini- and profiles are averaged over 5 s, yielding a horizontal reso-
mized and the cloud droplet effective radius is assumed to be lution of 1 km for an aircraft flying at 200 m s−1 on average.
equal to 10 µm, which is the mean value for the stratocumu- It is worth noting that ABC as observed with LNG is sensi-
lus clouds observed over the domain of interest (Deaconu et tive to both aerosol concentration and aerosol hygroscopicity.
al., 2019). Indeed, relative humidity in excess of 60 % modifies the size
and the complex refractive index of aerosol and, hence, their
3.2 The airborne sun photometer – PLASMA2 optical properties, enhancing the ABC (e.g. Randriamiarisoa
et al., 2006).
PLASMA 2 (Photomètre Léger Aéroporté pour la surveil-
lance des Masses d’Air version 2; Karol et al., 2013) is an
airborne sun tracking photometer (referred to no. 950 on
AERONET) which was on board the SAFIRE Falcon 20
https://doi.org/10.5194/acp-21-8233-2021 Atmos. Chem. Phys., 21, 8233–8253, 2021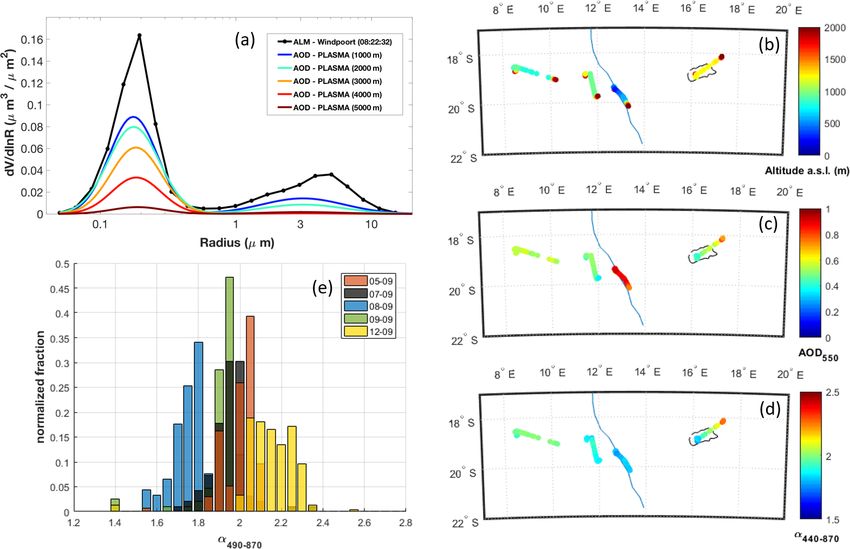
8238                A. Chauvigné et al.: Aerosol above-cloud direct radiative effect and properties in the Namibian region

Figure 3. Total and polarized radiances measured by OSIRIS during 8 September 2017. Panels (a) and (c) represent the total, on the top, and
the polarized, on the bottom, recomposed RGB radiances for the full OSIRIS image. Panels (b) and (d) represent the corresponding principle
planes at 670 (red) and 870 nm (blue), respectively. OEM simulations, according Waquet et al. (2013a), of the total and polarized radiances
for scattering angles below 130◦ are represented with black lines in the panels (b) and (d). The main aerosol properties retrieved for this case
are AOD equal to 0.74 at 670 nm, α490−870 = 1.82, and SSA equal to 0.87 at 670 nm.

3.4    Ground-based AERONET sun photometer                                the aerosol evolution during the campaign. Additional inter-
       measurements                                                       esting comparison data are provided by the Namibe station,
                                                                          located in the northern part of the AEROCLO-sA region, and
To put the aircraft observations into context, we analysed ob-            more influenced by biomass burning emissions from central
servations from 15 August to 15 September 2017 from the 15                Africa than the Windpoort site (therefore exhibiting higher
AERONET stations located in the southeastern Atlantic re-                 AODs). Outside the AEROCLO-sA domain, and as shown
gion. The full column-integrated properties (i.e. AOD, com-               by the atmospheric circulation patterns in Fig. 2, biomass
plex refractive index, extinction Ångström exponent, SSA,                 burning plumes were often transported towards Ascension
and AOD fine-mode fraction) have been averaged for each                   Island. This remote location (i.e. 3000 km offshore of the An-
site and are shown in Fig. 4. A total of four AERONET sta-                gola coast) gives an opportunity to study the evolution of the
tions are located in the AEROCLO-sA flight domain, namely                 biomass burning aerosols during their transport and ageing
Windpoort, Henties Bay, Gobabeb, and HESS, located in                     (Zuidema et al., 2016; Mallet et al., 2019).
the southern part of the domain, 200 km southeast of Hen-
ties Bay, and outside of the flight tracks. During the cam-
paign, and due to the persistent cloud cover, the measure-
ments available at Henties Bay and Gobabeb were sparse.
Therefore, the Windpoort station, located at 250 km from the
Namibian Coast, is a more suitable station for monitoring

Atmos. Chem. Phys., 21, 8233–8253, 2021                                                       https://doi.org/10.5194/acp-21-8233-2021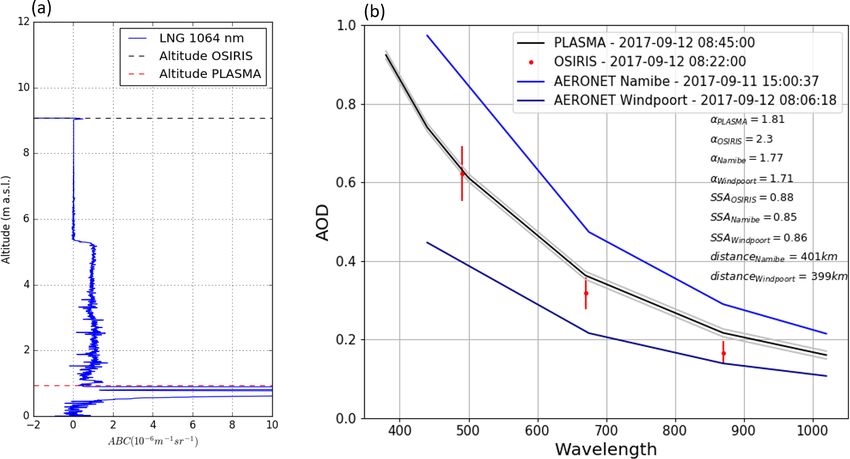
A. Chauvigné et al.: Aerosol above-cloud direct radiative effect and properties in the Namibian region                            8239

Figure 4. Mean values of AOD at 550 nm, α440−870 , SSA at 675 nm, ratio of the imaginary part of the refractive index (k) between 441
and 675 nm, and the fine- to coarse-mode fraction of the aerosol volume concentration from 15 AERONET sites in the southeastern Atlantic
region. The selected period is from 15 August to 15 September 2017. The black box corresponds to the AEROCLO-sA flight domain. Circle
size is linked to the availability of the data in the number of measurements.

4     Results

4.1    Aerosol extinction optical thickness

The primary parameter influencing the AAC DRE is the
aerosol optical depth (AOD) of the aerosol layer lofted above
the clouds. Above-cloud AODs were measured directly with
the sun photometer PLASMA2 during specific parts of the
AEROCLO-sA flights. These highly accurate AOD mea-
surements allow for the validation of OSIRIS above-clouds
AODs as a first step of the study. AERONET measurements
are also used in this section to depict the general AOD vari-
ability observed during the field campaign.                           Figure 5. AOD time series measured at 550 nm at Namibe, Wind-
   Figure 5 reports the AERONET AODs measured at the                  poort, Ascension Island, and São Tomé AERONET sites from
Namibe, Windpoort, Ascension Island, and São Tomé sites               13 August to 16 September 2017. The grey zone represents the
during the biomass burning period (from 15 August to                  flight period of the AEROCLO-sA campaign.
15 September 2017). A moderate aerosol loading is observed
at the São Tomé and Namibe sites at the beginning of the se-
lected period, with mean AOD of 0.76 and 0.48 at 550 nm,              poort sites (AOD up to 1.45 and 0.84 at 550 nm, respec-
respectively, whereas the Windpoort and Ascension Island              tively). During the AEROCLO-sA flight period, the strongest
sites record mean AOD of 0.10 and 0.19 at 550 nm, respec-             aerosol loadings in the AEROCLO-sA region were observed
tively. A first increase in the aerosol loading is observed be-       on 5 September and the lowest on 12 September from the
tween 27 August and 1 September 2017 at the Namibe and                AERONET data set. This variation in the aerosol loading is
Windpoort sites (AOD up to 0.88 and 0.73 at 550 nm, re-               mainly explained by the changes in the atmospheric circula-
spectively), a second increase between 3 and 8 September              tion as demonstrated in Sect. 2.
at the Namibe, Windpoort, and São Tomé sites (AOD up to                  The aerosol backscatter coefficient (ABC) at 1064 nm on
1.80, 1.54 and 1.72 at 550 nm, respectively), and a third in-         12 September 2017 obtained from the airborne lidar is shown
crease starting on 13 September at the Namibe and Wind-               in Fig. 6a. The aerosol signal is mainly concentrated between

https://doi.org/10.5194/acp-21-8233-2021                                                Atmos. Chem. Phys., 21, 8233–8253, 2021
8240              A. Chauvigné et al.: Aerosol above-cloud direct radiative effect and properties in the Namibian region

Figure 6. (a) Vertical profile of the aerosol backscatter coefficient (ABC) measured at 1064 nm by the airborne lidar LNG before a loop
descent performed on 12 September 2017. (b) Wavelength dependences of AOD measured at Namibe and Windpoort AERONET ground-
based stations, compared to OSIRIS and PLASMA2 above-cloud AODs, estimated before and after the descent in the loop. Estimated error
bars for AODs are also reported for OSIRIS (red bars) and PLASMA (grey zone).

the stratocumulus top at around 1 and 6 km height. This ver-          gorithm, which only considers fine-mode particles for mod-
tical distribution represents the general condition during the        elling the radiative properties of the aerosol biomass burning
AEROCLO-sA campaign well (Chazette et al., 2019). For                 aerosols lofted above the clouds. Indeed, for the 12 Septem-
this same day, Fig. 6b shows the spectral AOD measured by             ber measurements, PLASMA2 inversion of the particle size
OSIRIS, PLASMA2, and the ground-based Windpoort and                   distribution shows higher coarse-mode particle concentra-
Namibe AERONET stations. The OSIRIS above-cloud re-                   tions (not shown) than for other flight measurements. This is
trievals were performed using measurements at an altitude             probably due to some increase in the wind speed at the sur-
of about 9 km a.s.l., corresponding to the top of the descent         face that uplifted some dust for this day and also because the
in the loop. Contrary to the configuration of OSIRIS on the           concerned flight was performed straight along the Namib-
SAFIRE Falcon 20 aircraft, PLASMA2 is an upward-looking               ian coast. Thanks to PLASMA retrievals, we estimated the
instrument. Therefore, the AAC properties from PLASMA2                AAC coarse-mode AOT to be equal to 0.04 at 670 nm dur-
were obtained from the measurements at the bottom of the              ing the loop performed above the clouds on 12 September.
descent in the loop, above the cloud top. AOD retrieved from          For the flights performed on 7 and 8 September, the de-
OSIRIS and PLASMA2 measurements agree within ±10 %                    partures observed between OSIRIS and PLASMA for the
at 670 nm (Fig. 6b; Table 1), and are in between the mea-             AOT at 670 nm are of about 0.01 (see Table 1), which is
surements of the two AERONET stations. Bias between-                  the sun photometer measurement’s accuracy. So, there is
PLASMA2 and AERONET AODs are around 70 % for ev-                      no systematic bias in the OSIRIS AOT retrievals. Based on
ery wavelength, whereas OSIRIS measurements agree with                the PLASMA and AERONET retrievals, we can affirm that
AERONET AODs from 20 % with Windpoort measurements                    the AAC coarse-mode AOT can be safely neglected for the
at 870 nm to 67 % with Namibe measurements at 670 nm.                 DRE calculations for all the flights of AEROCLO-sA, ex-
   Table 1 shows this same comparison from four loops, with           cept on 12 September. The coarse-mode AOD measured on
a very good agreement between OSIRIS and PLASMA2 for                  12 September limits the relative accuracy of our OSIRIS
moderate to high aerosol loading (AODs from 0.36 and 0.74             AOT retrievals at 670 nm to 10 %. For the calculation of the
at 670 nm). Note that, on 5 September, the aircraft did not           DRE uncertainties, we increased our AOT retrieval error to
reach the cloud top level at the end of the loop, which caused        account for this observation (see Appendix B).
a higher bias (30 %) between the AOD from PLASMA2 and                    Figure 7a shows a time series of the OSIRIS above-cloud
OSIRIS. OSIRIS AOD is slightly lower than the PLASMA                  AOD at 490, 670, and 870 nm on 12 September 2017. The
one on 12 September by 0.04 for the aerosol optical thick-            grey zones correspond to the OSIRIS retrieval uncertainty
ness (AOT) at 670 nm. This low bias can mainly be attributed          (as described in Appendices A and B). The 40 min slot rep-
to the neglect of coarse-mode particles in the OSIRIS al-             resents a transect of about 400 km along the coastline (in yel-

Atmos. Chem. Phys., 21, 8233–8253, 2021                                                 https://doi.org/10.5194/acp-21-8233-2021
A. Chauvigné et al.: Aerosol above-cloud direct radiative effect and properties in the Namibian region 8241
Table 1. Aerosol optical properties from AERONET, OSIRIS, and PLASMA2 measurements for four different descents in a loop during the
AEROCLO-sA campaign.
Date Altitude a.s.l. AOD670 AOD670 AOD670 AERONETWindpoort α490−870 α440−870 α440−870
(m) min/max OSIRIS PLASMA and distance to Falcon 20 OSIRIS PLASMA AERONETWindpoort
5 Sep 2017 1244/9650 0.54 0.43 0.55 (373 km) 2.06 1.82 1.76
7 Sep 2017 900/8680 0.44 0.45 0.75 (745 km) 1.80 1.81 1.66
8 Sep 2017 686/9050 0.73 0.74 0.50 (464 km) 1.80 1.69 1.66
12 Sep 2017 940/9080 0.32 0.36 0.22 (399 km) 2.27 1.81 1.71
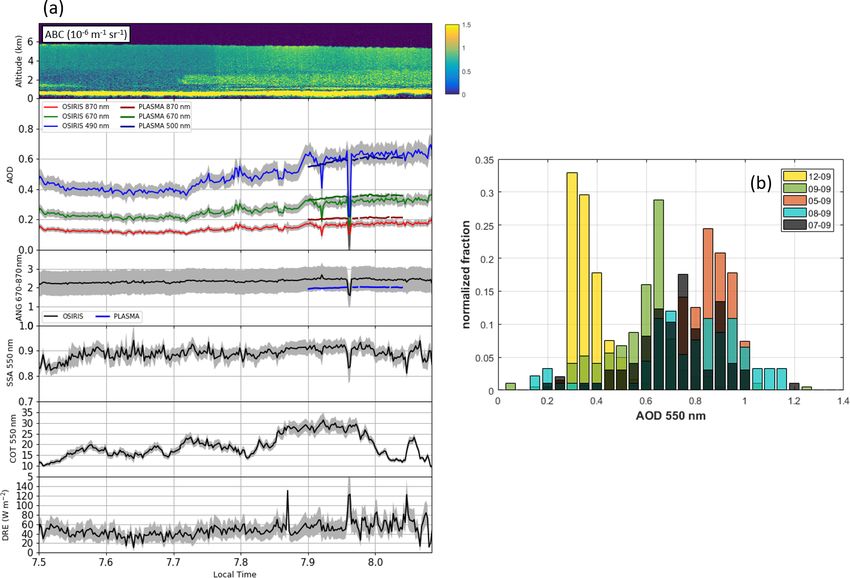
Figure 7. (a) Time series of the ABC profiles measured at 1064 nm by the lidar LNG, above-cloud AODs, Ångström exponents (670–
870 nm), aerosol SSA, cloud optical depth and direct radiative effect estimated on 12 September 2017, and associated errors. (b) AOD
histograms from OSIRIS measurements for the five selected flights.
low Fig. 1a) with a northbound heading. A slight variability with the homogeneous distribution of aerosols in the tropo-
is observed in the AOD with a south–north gradient. A total sphere and low aerosol signal for the region and the season.
of 30 min after the segment at high altitude, the collocated Figure 7b shows a histogram of the above-cloud AOD
observations from PLASMA2 at low altitude are consistent from OSIRIS at 550 nm for each flight of the campaign. The
with OSIRIS, with the AOD from PLASMA2 being larger retrieved AODs range from 0.2 to 1.2. The mean AOD de-
by 10 % compared to OSIRIS. Again, the low bias in the pends on the flight, with a maximum of 0.94 on 8 Septem-
OSIRIS AOD retrievals (at 870 nm) is likely due to the pres- ber and a minimum of 0.39 on 12 September. The 5, 7, and
ence of a few coarse-mode particles, as previously discussed. 9 September have a mean AOD values of 0.86, 0.73, and
Parallel measurements of the airborne lidar LNG demon- 0.60, respectively. These high AODs are consistent with the
strate the small spatial variability observed on 12 September, large values typically observed close to the coast by satellites
(0.6 at 550 nm; Peers et al., 2016) and aircraft polarimeter
https://doi.org/10.5194/acp-21-8233-2021 Atmos. Chem. Phys., 21, 8233–8253, 2021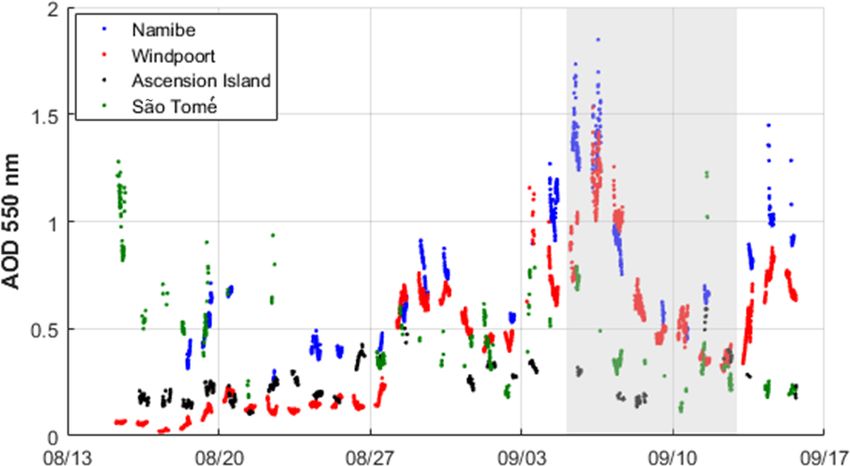
8242              A. Chauvigné et al.: Aerosol above-cloud direct radiative effect and properties in the Namibian region

measurements in the southeastern Atlantic (around 0.75 at           togram shown in Fig. 8e indicates different aerosol types.
550 nm; Pistone et al., 2019).                                      The maximum α490−870 is observed on 12 September (me-
                                                                    dian of 2.15) and the minimum on 8 September (median of
4.2    Ångström exponent and particle size distribution             1.75). α670−870 values are generally constant during every
                                                                    flight, as in the case on 12 September (Fig. 7a). The low-
Aerosol size can have a significant impact on DRE cal-              est α490−870 values, around 1.7, are found less than 50 km
culation since it mainly controls the spectral dependency           away from the Namibian coast and were observed during the
of the aerosol optical thickness. The Ångström exponent             flight on 8 September. This behaviour might be explained
is a parameter primarily indicative of the particles size.          by the influence of dust particles generated on the continent
The Ångström exponent retrieved with OSIRIS is evaluated            with higher coarse-mode particle fraction. The hygroscopic
against PLASMA measurements and particles size retrievals           growth of biomass burning particles potentially occurring
in this section.                                                    during their transport over the ocean might also explain the
   Figure 8a describes the volume particle size distributions       differences observed in the aerosol optical properties from
retrieved from PLASMA2 measurements at different alti-              one flight to another. The aerosols observed on 5 Septem-
tudes during the descent in the loop on 7 September 2017.           ber were directly transported from central Africa without a
The AERONET particle size retrievals from the Windpoort             long transport over the Atlantic Ocean (Fig. 2b). This spe-
station are also shown. The size distribution is generally char-    cific circulation might explain the higher α490−870 (mean of
acterized by a dominant fine mode between 500 and 5000 m.           2.00) observed above the clouds during this flight, which in-
This is consistent with the dominant fine mode typically ob-        dicates smaller particles than the ones observed, for instance,
served in previous studies at an altitude of 1 to 6 km in this      on 8 September. These changes in the fine-mode size are also
region (Toledano et al., 2007; Russell et al., 2010; Kumar et       suggested from the analysis of the volume of fine-mode prop-
al., 2013). Measurements show a rather constant fine–coarse-        erties obtained from PLASMA2 inversions. Lower values of
mode ratio within the aerosol plume. For the descent in the         the volume mean radius of the fine-mode particles are re-
loop over cloud on 7 September 2017, fine-mode particles            trieved on 5 and 12 September (rv = 0.18 and 0.15 µm, re-
contributed to 97 % of the total AOD at 670 nm between 1000         spectively) rather than on 8 September (rv = 0.20 µm).
and 4000 m. The mean Ångström exponent value obtained                  AERONET Ångström exponents are around 5 % lower
from PLASMA2 measurements is about 1.9, with an accu-               than PLASMA2 measurements and between 8 % and 25 %
racy of 0.1. According to AERONET measurements, during              lower than OSIRIS inversions (Table 1). The bias between
the campaign period, the number of coarse-mode particles is         AERONET and OSIRIS Ångström exponents can mainly be
also extremely weak and does not exceed 5 % of the colum-           explained by the presence of coarse-mode particles that are
nar AOD (Fig. 4). The smallest particles (Ångström exponent         not explicitly considered in the POLDER algorithm when
larger than 2) are generally observed in the northern part of       biomass burning layers are detected above the clouds (Wa-
the Namibian region (Fig. 4).                                       quet et al., 2013a). This is particularly observed for the flight
   Figure 8b, c, and d show the altitude, the AOD, and the          on 12 September due to a slightly less dominant fine mode
extinction Ångström exponent measured by PLASMA2 for                compared to other flights (i.e. mean fine-mode fraction of
straight levelled runs below 2000 m a.s.l. The second flight,       90 % on 12 September instead of 95 % on average for the
on 12 September, over the Etosha Pan (black line) presents          field campaign). This neglected coarse mode could also ex-
a strong AOD gradient between 0.30 and 0.82 and a strong            plain why OSIRIS slightly underestimated AOD compared
Ångström exponent gradient between 1.55 and 2.27, which             to PLASMA 2 on 12 September (Fig. 7a).
is not correlated to altitude variations. During this specific
flight, the measurements over the Etosha Pan were performed         4.3   Complex refractive index and single scattering
at around 1300 m a.s.l. The Etosha Pan is the main source of              albedo
dust emissions in this region, and it is characterized by an ex-
tremely dry surface at this time of year. In these conditions,      The SSA is one of the three most important parameters influ-
the particle size distribution retrieved by PLASMA2 over            encing aerosol DRE calculation with the above-cloud AOD
the southwestern part of the flight path over the Etosha Pan        and the cloud albedo (Peers et al., 2015). The retrieval of
is characterized by a significant additional contribution of        this parameter is still subject to large uncertainties in this re-
coarse-mode particles (α440−870 = 1.55). Toward the north-          gion (Peers et al., 2016; Pistone et al., 2019). The retrieval
eastern part of the flight path, the aerosol properties retrieved   of the SSA from passive remote sensing techniques depends
by PLASMA2 are less influenced by the dust emissions from           on the microphysical assumption. This parameter is primar-
the pan and are more representative of the properties of fine-      ily driven by the aerosol absorption (i.e. imaginary part of the
mode particles from biomass burning (α440−870 = 2.27).              complex refractive index) and, to a lesser extent, by the par-
   The values of Ångström exponents retrieved above the             ticles size. The analysis of AERONET measurements over
clouds from OSIRIS and PLASMA2 are around 2.0 ± 0.2.                the biomass burning period also provides us with a spatially
In agreement with the PLASMA2 analysis, the α490−870 his-           distributed view of the aerosol complex refractive index and

Atmos. Chem. Phys., 21, 8233–8253, 2021                                               https://doi.org/10.5194/acp-21-8233-2021
A. Chauvigné et al.: Aerosol above-cloud direct radiative effect and properties in the Namibian region 8243
Figure 8. (a) Retrieved volume particle size distributions at different altitudes from PLASMA2 measurements and from the AERONET
station at Windpoort, Namibia, for the descent in the loop on 7 September 2017. Flight altitude (b), AOD (c), and Ångström exponent (d)
measured by PLASMA2 during AEROCLO-sA. The black line corresponds to the Etosha Pan. Only low-altitude flights are presented.
(e) Extinction Ångström exponent from OSIRIS measurements histograms for the five selected flights.
SSA. Values of SSA at 675 nm (hereafter SSA675 ) are gen- the Namibe station, with k441 higher than k675 by more than
erally spatially homogeneous over land, with a mean value 40 %.
of 0.85 (25th and 75th percentiles of 0.84 and 0.86, respec- The SSA of AAC can also be observed from OSIRIS inver-
tively). The highest SSA675 is observed at the Namibe station sions for the entire AEROCLO-sA flight campaign. Figure 9a
(Fig. 4), with a mean value of 0.87, while the lowest values shows the SSA box plots of each analysed AEROCLO-sA
are observed at the Bonanza and Mongu Inn stations (mean flight. Results show the absorbing property in this region,
SSA675 of 0.82). In correspondence, a mean refractive index with a mean SSA of 0.87 at 550 nm for the full campaign.
of 1.51 + 0.027i at 675 nm is retrieved. The real part of the SSA values below 0.82 at 550 nm can be considered as out-
refractive index at 675 nm ranges from 1.41 at Henties Bay liers in our study. The highest and lowest absorption (and
to 1.54 at Bonanza, and the imaginary part at 675 nm ranges conversely the lowest and highest SSA) are retrieved, respec-
from 0.008 at Henties Bay to 0.032 at Bonanza. The known tively, on 9 September (mean SSA of 0.86 at 550 nm) and on
environmental characteristics of Henties Bay, a coastal site 5 September (mean SSA of 0.89 at 550 nm). This low varia-
with high content of sea salt and sulfate aerosols, frequent tion in the measured particles absorption suggests rather uni-
fog, and a persistent and elevated relative humidity (Formenti form sources of biomass burning aerosol (BBA) emissions
et al., 2019; Klopper et al., 2020), support the low values of during the AEROCLO-sA campaign timescale.
the real and imaginary refractive indices. Figure 4 also shows Figure 9b compares the spectral variation in the SSA
different behaviours of the spectral variation in the imaginary from OSIRIS during the full campaign to various comple-
part of the refractive index k in the southeastern region. k441 mentary measurements, namely the concurrent ground-based
is higher than k675 (up to 43 %) on the northern part of the AERONET at the Windpoort and Namibe sites, the retrievals
region and lower (up to 10 %) on the southern part of the re- of the airborne imager AirMSPI during ORACLES 2016 (Pi-
gion. The largest ratio between k441 and k675 is observed at stone et al., 2019), and the mean POLDER retrievals above
the clouds for the southeastern region from 2005 to 2009 dur-
https://doi.org/10.5194/acp-21-8233-2021 Atmos. Chem. Phys., 21, 8233–8253, 20218244 A. Chauvigné et al.: Aerosol above-cloud direct radiative effect and properties in the Namibian region
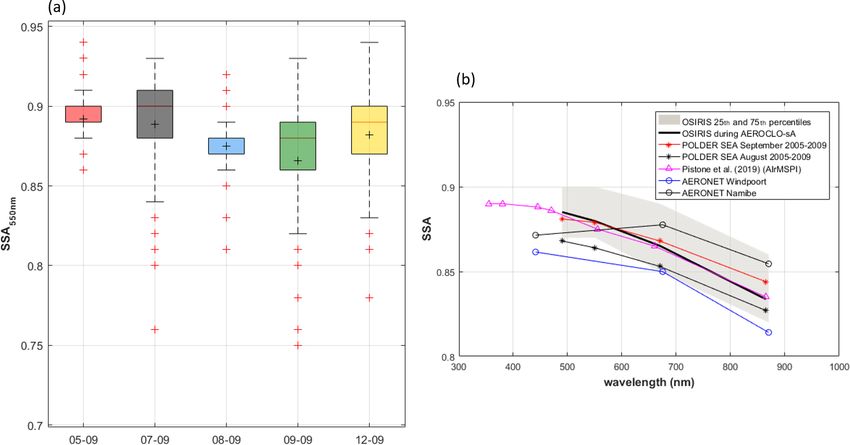
Figure 9. Box plot of the SSA from OSIRIS measurements at 550 nm for the five selected flights and mean wavelength dependency retrieved
from OSIRIS, Windpoort, and Namibe AERONET sites during the AEROCLO-sA campaign and AirMSPI during the ORACLES campaign
in 2016 and POLDER between 2005 and 2009 during the fire season.
ing the fire season (Peers et al., 2016). The SSA from OSIRIS
is less than 1 % different from the ORACLES 2016 AirM-
SPI observations. Both measurements are consistent with the
multi-year average SSA from POLDER during the biomass
burning period (less than 2 % difference), as expected, as
these estimates are all based on polarimetric measurements.
A higher bias (about 3 %) compared to OSIRIS inversion
is observed with AERONET retrievals at Windpoort, where
the SSA is lower, irrespective of the wavelength. On the
other hand, the measurements at the Namibe AERONET sta-
tion are consistent with our retrievals at 670 nm but not at
440 nm, where the SSA is significantly lower. This trend
does not appear in the ORACLES measurements from AirM-
SPI, which were performed farther from the coast over the
ocean. According to Kirchstetter et al. (2004), a decrease i
the SSA at 440 nm can be partly explained by the presence
of light-absorbing organic carbon (brown carbon). Unlike at
Figure 10. Column water vapour in a function of AOD at 550 nm,
the Namibe site, the SSA at Windpoort, located farther from
both measured by the PLASMA2 sun photometer during the
the fire sources, was generally found to decrease from 440 to
AEROCLO-sA campaign.
875 nm.
4.4 Integrated water content an accurate estimate of the aerosol DRE and related uncer-
tainties. The integrated water vapour can be derived from
The biomass burning aerosol layers transported in the stud- the PLASMA extinction measurements performed at 940 nm
ied region are typically accompanied by water vapour, with (Halthore et al., 1997). In Fig. 10, one can note, in gen-
potential significant effects on the radiative budget (Deaconu eral, a linear relationship between the water vapour content
et al., 2019). It is, therefore, necessary to consider the con- and the AOD at 550 nm from PLASMA2, especially for the
tribution of water vapour in our study in order to establish higher range of water vapour concentration. The highest col-
Atmos. Chem. Phys., 21, 8233–8253, 2021 https://doi.org/10.5194/acp-21-8233-2021A. Chauvigné et al.: Aerosol above-cloud direct radiative effect and properties in the Namibian region 8245
umn concentrations of water vapour (up to 2.4 g cm−2 ) are from the Namibian coast up to 100 km off the coast. On
observed for the two flights of 8 September. This correla- 7 September, measurements were performed up to 350 km
tion could be explained by the meteorological conditions, away from the coastline. For this flight, a maximum value of
which would be responsible for the simultaneous transport COT is observed around 100 km away from the coast, and
of aerosols and water vapour, as suggested by previous stud- then the COT decreases down to 10 at around 250 km. It was
ies (Adebiyi et al., 2015; Deaconu et al., 2019). This corre- noted, during the field campaign, that the clouds were gener-
lation might also be the result of the direct emissions of wa- ally optically less thick in the vicinity of the Namibian coast
ter vapour due to the fires themselves (Betts and Silva Dias, and more difficult to forecast.
2010; Sena et al., 2013). The water vapour amount is quite
variable from one flight to another and varies between 0.7
4.6 Direct radiative effect
and 2.7 g cm−2 . We estimated the mean water vapour amount
to be equal to 1.7 g cm−2 for the AAC scenes sampled dur-
ing AEROCLO-sA. Note that dropsonde measurements were The direct radiative effect (DRE) calculations are performed
used to supplement the PLASMA2 data in order to estimate over the solar spectrum (0.2–4 µm) with the radiative trans-
the amount of water vapour within the cloud layer. Finally, fer code GAME (Global Atmospheric Model; Dubuisson et
one can note that there is no correlation, for the second flight al., 1996). The DRE calculations are performed online and
of 12 September, between AODs and water vapour measure- are based on OSIRIS retrievals performed in the visible and
ments. A low water vapour amount (below 1 g cm−2 ) and near-infrared spectral bands. The DRE for AACs is primar-
high AOD values (> 0.7) were observed together for this ily driven by the (spectral) AOT, SSA, and cloud albedo, with
flight. We do not have a full explanation for this contradictory this latter parameter being mainly controlled by the COT. The
observation. These observations were obtained for an in-land AAC DRE increases with increasing AOT and COT and de-
location (Etosha Pan), and we assume that this area could creasing SSA (or increasing aerosol absorption). To a lesser
be associated with drier air masses than the ones sampled extent, the AAC DRE also depends on the water vapour and
over the oceanic regions. Based on aircraft measurements cloud droplet size. Increasing the amount of water vapour in
and model simulations in the southeastern Atlantic region, the atmosphere tends to reduce the upwelling fluxes com-
a recent study demonstrates that the water vapour concentra- puted at the top of the atmosphere and, consequently, the
tion, which is linearly correlated with CO concentration, may DRE. Reducing the cloud droplets effective radius increases
not originate from biomass burning (BB) emissions (Pistone the cloud albedo, which increases the DRE. Our DRE un-
et al., 2021). Hence, the meteorology seems to mainly drive certainty budget is based on the observational uncertainty
the amount of water vapour in the atmosphere in this region. previously determined for each aerosol parameter. Based on
the comparisons made between OSIRIS and PLASMA, we
4.5 Cloud properties estimated the uncertainties on the AOT and Ångström ex-
ponent for the BBAs lofted above the clouds to be, respec-
The OSIRIS measurements also provide us with the optical tively, equal to 10 % of the AOT at 550 nm and 0.2 (for an
properties of clouds with a high spatial resolution. For each Ångström exponent computed between 670 and 865 nm). For
pixel of the OSIRIS CCD matrix, the COT can be retrieved at the spectral SSA of the BBA, we considered a relative uncer-
a spatial resolution reaching 20 m for a flight altitude around tainty of 5 %, which encompasses the departures observed
10 000 m a.s.l. Figure 11a shows a retrieved field of COT on between the different airborne and spaceborne retrievals of
7 September, at 09:37 UTC, at the top of the first ascent of the this parameter (see Fig. 9). Considering the time period and
flight close to the coast. COT values at 550 nm range from 5 location, a midlatitude summer model was assumed to model
to 30, with a mean value of 16. the vertical profiles of the thermodynamical quantities (Mc-
To analyse the full AEROCLO-sA data set, we chose to se- Clatchey, 1972). The total amount of columnar water vapour
lect the central pixel of every OSIRIS CCD matrix. This se- was fixed to a value of 1.7 g cm−2 . We assume an error of
lection allows us to remove the scene details of each OSIRIS ±1 g cm−2 in accordance with the PLASMA observations
measurement and is well representative of the COT distribu- for this quantity. We assumed a cloud droplets effective ra-
tion in the region. As all the flights were performed between dius of 10 µm and perturbated this quantity by 2 µm in the
08:00 and 11:00 local time, measurements refer to similar at- calculations for the DRE uncertainty (see Appendix B).
mospheric thermodynamics and sun conditions. Figure 11b The distribution of the observation-based, instantaneous,
shows the distribution of COT values at 550 nm for the whole and 1D AAC DRE in the solar spectrum from OSIRIS
campaign. The COT at 550 nm ranges from 5 to 35. On 5 and measurements is shown in Fig. 12 for every flight during
8 September, a mean COT of 12 is obtained while the mean AEROCLO-sA. Calculations show positive DRE, which is
COT is 15 on 9 September and 19 on 7 and 12 September. in agreement with above-cloud observations from Zhang et
Particularly high values are observed on 7 and 12 Septem- al. (2016) in regions influenced by biomass burning emis-
ber. As shown in Fig. 11c, COT can be related to the distance sions. Keil and Haywood (2003) also estimated a mean value
from the coastline. An increase from 10 to 30 is observed of above-cloud DRE of +11.5 W m−2 above the clouds and
https://doi.org/10.5194/acp-21-8233-2021 Atmos. Chem. Phys., 21, 8233–8253, 20218246 A. Chauvigné et al.: Aerosol above-cloud direct radiative effect and properties in the Namibian region
Figure 11. (a) Full OSIRIS image cloud optical depth at 550 nm retrieved on 7 September at 09:37 UTC from OSIRIS measurements.
(b) COT histogram for the five selected flights. (c) Relation between COT and the distance from the measurement to the coastline.
These differences can be also explained by sampling is-
sues due to the differences in the spatial resolution of the
satellite and airborne sensors. Spatial resolution used by ob-
servations also have significant impacts on the retrievals of
cloud properties and, consequently, the estimate of the AAC
DRE (de Graaf et al., 2020). The so-called plane parallel
bias arises due to cloud subpixel heterogeneities and to the
nonlinear relationship of the radiance on the cloud optical
thickness. For a coarse satellite data resolution (> 1 km2 ),
the known result is a low bias in the cloud optical thickness
that increases as the spatial resolution of the sensor increases
(Davis et al., 1997). This effect is necessarily reflected in
an underestimation of the AAC DRE. For the spaceborne
radiometers POLDER and SCIAMACHY, the resolutions
are, respectively, 6 × 6 km2 and 60 × 30 km2 . This likely ex-
plains why the POLDER DRE was estimated as being higher
than the ones retrieved from SCIAMACHY (de Graaf et
Figure 12. DRE histogram retrieved from OSIRIS’s aerosol and
al., 2020). The cloud fraction can also be overestimated for
cloud retrievals for the five selected flights. Circles and error bars
correspond to mean DRE and calculated DRE uncertainties follow-
coarse-resolution satellite data, since the subpixel variability
ing the description in Appendix B. in the cloud properties cannot be sampled (Loeb and Davies,
1996; Di Girolamo and Davies, 1997). This effect also leads
to lower estimates of cloud albedo and AAC DRE. We re-
call that the cloud optical thicknesses retrieved with OSIRIS
of −13 W m−2 in clear-sky conditions (mean SSA of 0.90 at were performed at a high spatial resolution (20 × 20 m2 ) and
550 nm). often associated with full cloudy scenes at the scale of the
The above-cloud instantaneous DRE obtained from OSIRIS image (20 × 20 km2 ). Altogether, these differences
OSIRIS measurements ranges from +10 to +190 W m−2 , in the data sampling explain why the OSIRIS AAC DRE are
with mean values between +65 W m−2 on 12 September and larger than previous satellite-based estimates performed for
+106 W m−2 on 7 September. The mean DRE for the full this region.
campaign is +85 W m−2 , with a mean DRE uncertainty of The exceptional atmospheric conditions sampled during
24 W m−2 . These mean DRE are higher than previous re- the flights also largely explain why these retrieved high
trievals in the region. De Graaf et al. (2019, 2020) and Peers DRE values. The high local DRE values observed during
et al. (2015) retrieved a mean DRE around +40 W m−2 from AEROCLO-sA are linked to the strong absorption properties
combined estimates made from satellite retrievals based on and high aerosol loading typically measured during the field
POLDER and SCIAMACHY sensors. In these previous stud- campaign. As demonstrated by Cochrane et al. (2019), based
ies, the region of interest was larger (10◦ N–20◦ S, 10◦ W– on the ORACLES campaigns in 2016 and 2017, the DRE
20◦ E) than the one covered during the AEROCLO-sA air- also strongly depends on the cloud scene, particularly on the
craft campaign, and these previous works may have included cloud albedo and cloud fraction. The stratocumulus cloud ob-
lower local values of DRE observed in the western part of the served during AEROCLO-sA were generally optically thick
region. (5 < COT < 30 at 550 nm) and associated with a geometri-
Atmos. Chem. Phys., 21, 8233–8253, 2021 https://doi.org/10.5194/acp-21-8233-2021You can also read