Well-Being Assessment in Hawaii Creating community-level composite indices in paradise - UHERO
←
→
Page content transcription
If your browser does not render page correctly, please read the page content below
Well-Being Assessment in Hawaii
                                         Creating community-level composite
                                                              indices in par adise
                                                                                  by

                                                                     Jonathan Page

                                   Working Paper No. 2018-5
                                        June 18, 2018

                            U N I V E R S I T Y O F H AWA I ‘ I AT M A N OA
              2424 M A I L E WAY, R O O M 5 4 0 • H O N O LU LU, H AWA I ‘ I 9 6 82 2
                                   W W W.U H E R O. H AWA I I . E D U

WO R K I N G PA P E R S A R E P R E L I M I N A RY M AT E R I A L S C I R C U L AT E D TO S T I M U L AT E
D I S C U S S I O N A N D C R I T I C A L CO M M E N T. T H E V I E WS E X P R E S S E D A R E T H O S E O F
                                       T H E I N D I V I D UA L AU T H O R S .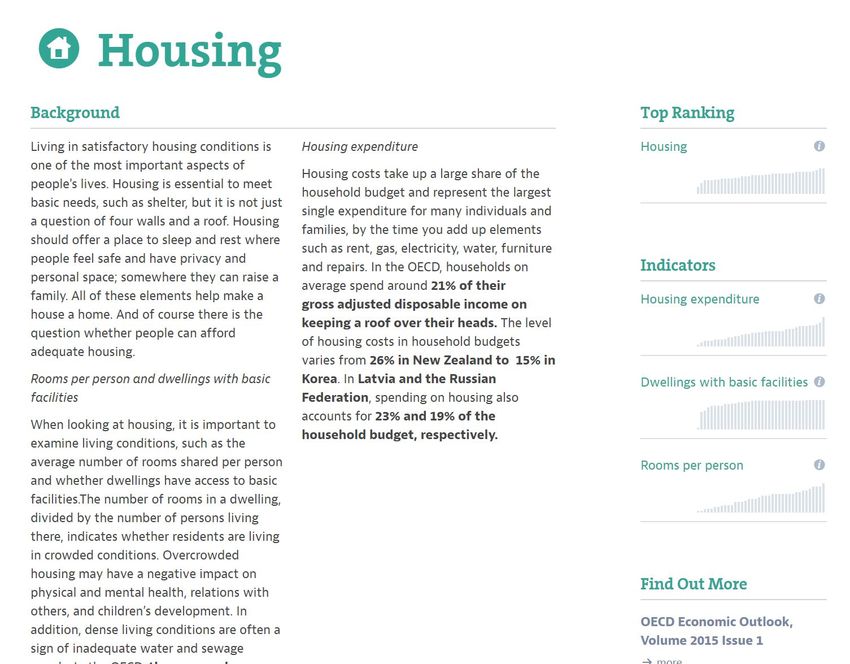
Well-Being Assessment in Hawaii
Creating community-level composite indices in paradise

June 18, 2018

Jonathan Page, PhD

Research assistance:
Aida Arik
Thuy Doan

Acknowledgements:
This report was created with support from the Hawaii Leadership Forum.

WORKING PAPERS ARE PRELIMINARY MATERIALS CIRCULATED TO STIMULATE DISCUSSION
AND CRITICAL COMMENT. THE VIEWS EXPRESSED ARE THOSE OF THE INDIVIDUAL AUTHORS.
Executive Summary
The purpose of this report is to provide the necessary foundation for the construction of a
comparative well-being index for communities in Hawaii. We begin by comparing the composite
index and dashboard approaches to describing well-being. We provide guidance on the
selection of indicators, their normalization, the weighting of indicators to form a composite index,
and the comparison of indices and indicator values across regions. Existing indices are
compared to provide context. Available data sources are listed and opportunities to augment
current data collection are identified. Specific recommendations are provided regarding the
well-being model, data sources, indicator selection, interactive visualization, and
communication.

Well-being can be explored through a composite index or as a dashboard of indicators. A
comparative analysis of well-being in Hawaii should include both. The composite indices provide
a high-level overview. The dashboard of indicators allows details to be examined on demand.

There is no consensus on what determines the best domains (i.e., dimensions of well-being) or
indicators. Domains included in our analysis are economic opportunity, health, community
security, education, institutions (governance), social capital, and housing. The selection of
indicators and domains presented in this report should be viewed as tentative. To remain
relevant they will need to be adapted to address questions of policy and general interest. The
index methodology should be subject to biennial reviews.

A general framework for creating composite indices and an overall well-being index follows:

    1) For each domain, identify a key indicator1
    2) Predict the key indicator using indicators within this domain and those believed to affect
       the key indicator, the predicted values are a composite indicator
    3) Predict overall well-being as a function of the domain-level composite indices

1
  If the desired indicator is not observed, the key indicator should be the observed variable closest to the
latent desired indicator.
                                                                   Well-Being Assessment in Hawaii - 2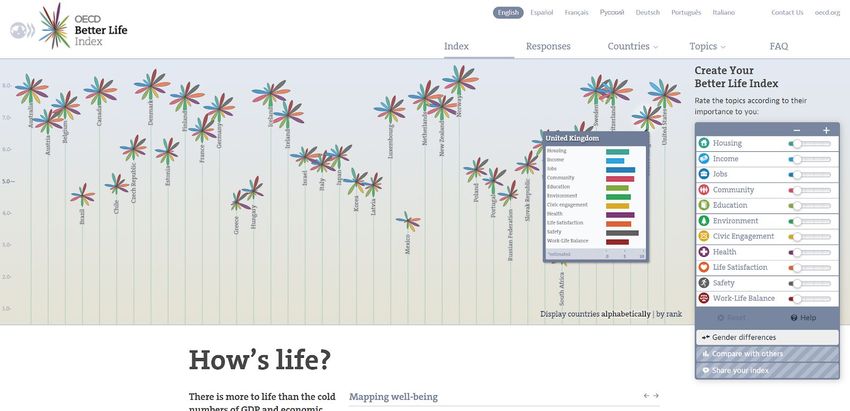
Table of Contents
Executive Summary                                                                          2

Table of Contents                                                                          3

1 Background                                                                               5
   1.1 Comparative Assessment of Well-Being                                                5
      1.1.1 Well-being indices vs. indicators                                              5
      1.1.2 Well-being composite indices                                                   5
      1.1.3 Well-being indicators                                                          8
      1.1.4 Other approaches                                                              10
   1.2 Common Well-Being Indicators by Domain                                             10
   1.3 Building an Index                                                                  13
      1.3.1 Indicator selection                                                           13
      1.3.2 Indicator normalization                                                       14
      1.3.3 Weighting methods                                                             15
      1.3.4 Comparing communities                                                         16
      1.3.5 Micro Indicators                                                              17
   1.4 Well-Being Index Communication                                                     18
      1.4.1 Selecting communication media                                                 18
      1.4.2. Interactive examples                                                         18
      1.4.3 Measuring impact                                                              25
   1.5 The Current State of Well-Being Indices                                            26
   1.6 Opportunities for Measuring Well-Being in Hawaii                                   26

2 Opportunities                                                                           27
   2.1 Existing data                                                                      27
      2.1.1 The well-being model                                                          27
      2.1.2 Cross-cutting datasets                                                        28
      2.1.3 Economic Opportunity                                                          28
      2.1.4 Health                                                                        30
      2.1.5 Community Security                                                            30
      2.1.6 Education                                                                     31
      2.1.7 Institutions (Governance)                                                     32
      2.1.8 Social capital                                                                32
      2.1.9 Housing                                                                       32
   2.2 Suggestions for Existing Data Collection Efforts                                   33
   2.3 Indirect and Inferential Measures                                                  33

                                                          Well-Being Assessment in Hawaii - 3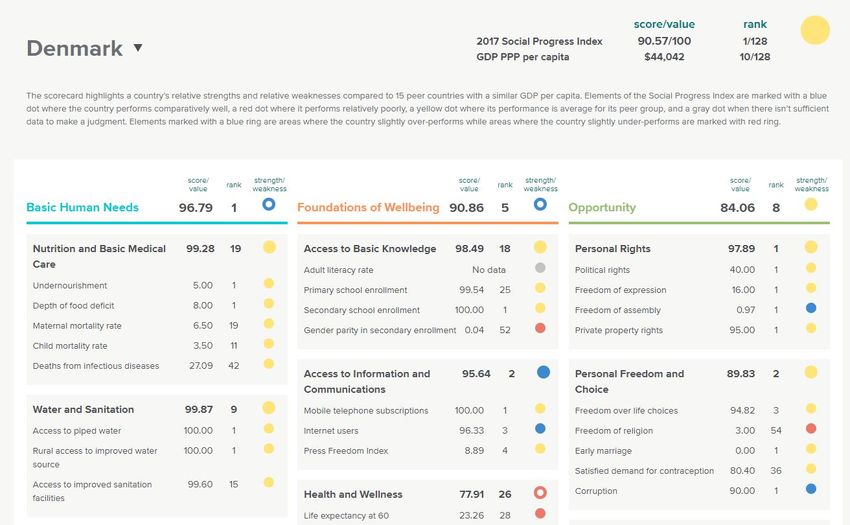
2.4 Opportunities for Improving Community-Level Comparisons                        35
   2.5 Tableau Visualizations                                                         36

3 Discussion                                                                          37

References                                                                            39

                                                      Well-Being Assessment in Hawaii - 4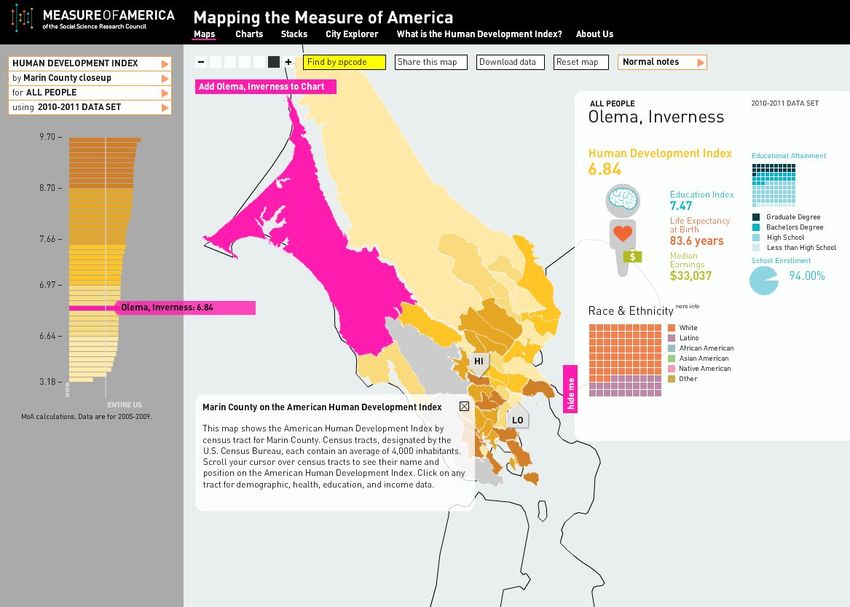
1 Background
1.1 Comparative Assessment of Well-Being
1.1.1 Well-being indices vs. indicators
Comparative assessments of well-being seek to compare the condition of people across
locations (and perhaps time). Before comparing well-being we must first define it. Unfortunately,
defining well-being is far from easy.
When asking a friend how they are doing, the response may cover a variety of topics. This
multivalent nature of well-being has inspired the dashboard approach to comparing well-being.
In the dashboard approach, those different topics (also called domains, dimensions or
components) are all given their chance to shine. The strength of this approach is in the absolute
respect for the multidimensional nature of the human experience. A core weakness in the
dashboard approach is the difficulty of communicating a cohesive message around a large
number of topics.
An alternative technique is to construct a composite index that combines the data we have on
these different domains of well-being into a single number. Composite indices may also be
made for the domains of our abstract notion of overall well-being. The goal of these composite
indices is to be a digestible, tractable, efficient, policy-relevant measure of the condition of a
population. It is easier to compare regions using a single measure than a multitude. If the index
is well constructed it should facilitate policy discussions and decisions. These indices need to
avoid the extremes of generality (i.e., not capturing policy relevant aspects of well-being) and
specificity (e.g., applicable to only one particular policy question).
Providing both a set of composite indices and allowing users to explore the underlying domains
and component indicators blends the best of both techniques.
1.1.2 Well-being composite indices
There are many examples of well-being assessment projects focused on providing a composite
index to give an overall sense of well-being within a region. The UN’s 2016 Human
Development Report2 presents and excellent survey of common methodologies for constructing
well-being indices. This section discusses several of these well-being index projects and lists
others we reviewed.
2
http://hdr.undp.org/sites/default/files/hdr2016_technical_notes.pdf
Well-Being Assessment in Hawaii - 5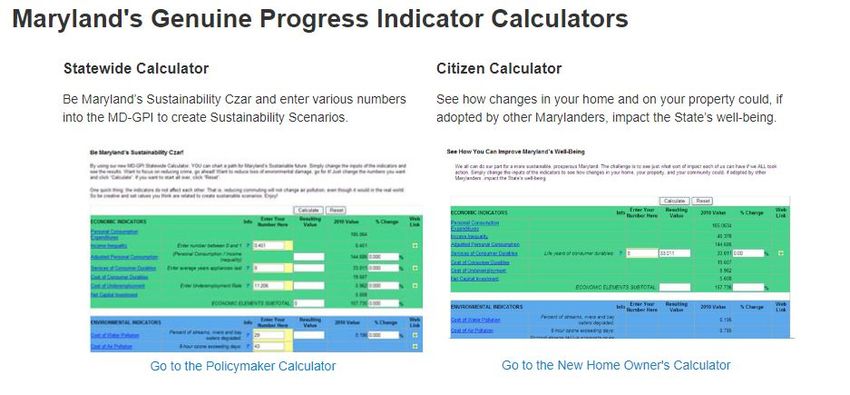
The Social Science Research Council’s Measure of America project3 produced an American
Human Development Index, which closely follows the methods of the UN’s Human Development
Index. The Measure of America project stands out for their wealth of interactive tools and for
applying the index creation techniques to create a complementary Opportunity Index. This
provides a model for creating new indices to address new or unmet concerns. Their county
profiles compare census tracts within a county.
The Legatum UK Prosperity Index is a good example of a comparative index covering local
areas with many domains and component indicators.4 Some weaknesses are the ad hoc
weighting of indicators to form a single index composite. Their approach is to begin with equal
weighting across indicators, but allow the weights to be doubled or halved based on expert
guidance on the relative importance of indicators. In the absence of sensitivity analysis, it is
unclear how reliable this subjective approach will be.
The AARP Livability index stands out for its consideration of policies.5 Each domain initially
receives a score based on indicators available across all regions. Then each region can score
extra points by having policies that, in theory, target a core domain.
Other examples of well-being indices reviewed for this report that create composite indices
include:
● OECD Regional Well-Being
https://www.oecdregionalwellbeing.org/assets/downloads/Regional-Well-Being-User-Gui
de.pdf
● Happy Planet Index
http://happyplanetindex.org/about#how
● Maryland Genuine Progress Indicator
http://dnr.maryland.gov/mdgpi/Pages/what-is-the-GPI.aspx
● Human Development Index
http://hdr.undp.org/sites/default/files/hdr2016_technical_notes_0.pdf
● Child and Youth Well-Being Index
http://www.soc.duke.edu/~cwi/
● Child Development Index
http://www.crin.org/en/docs/child-development-index.pdf
● Human Poverty Index
http://hdr.undp.org/sites/default/files/hdr2016_technical_notes.pdf
● Index of Social Health
http://iisp.vassar.edu/ish.html
● Social Progress Index
https://www.socialprogressindex.com/assets/downloads/resources/en/English-2017-Soci
al-Progress-Index-Methodology-Report_embargo-until-June-21-2017.pdf
3
http://www.measureofamerica.org/
4
http://uk.prosperity.com/docs/2016/2016UKProsperityIndexMethodology.pdf
5
https://livabilityindex.aarp.org/how-are-livability-scores-determined
Well-Being Assessment in Hawaii - 6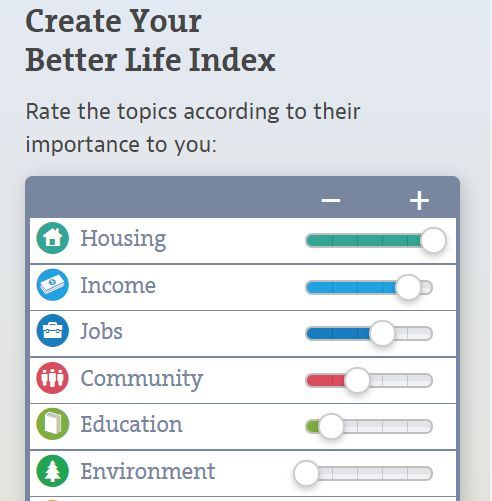
●   National Accounts of Well-Being
    http://www.nationalaccountsofwellbeing.org/
●   Opportunity Index
    http://opportunityindex.org/wp-content/uploads/2017/12/Opportunity-Index-2017-Technic
    al-Supplement.pdf
●   Applied Geographic Solutions: Quality of Life Index
    https://www.appliedgeographic.com/files/Snapsite2017A_Documents/AGS%20Quality%
    20of%20Life%20Indexes%20Methodology%202017.pdf
●   USDA Healthy Eating Index
    https://www.cnpp.usda.gov/sites/default/files/healthy_eating_index/HEI2010-UpdatePap
    er.pdf
●   Index of Sustainable Economic Welfare
    http://repec.deps.unisi.it/quaderni/449.pdf
●   National Welfare Index
    http://www.fest-nwi.de/index.php/en/index
●   Environmental Performance Index
    https://epi.envirocenter.yale.edu/2018-epi-report/methodology
●   Gross National Happiness
    http://www.grossnationalhappiness.com/wp-content/uploads/2012/04/Short-GNH-Index-
    edited.pdf
●   Australian Unity Wellbeing Index
    https://www.australianunity.com.au/media-centre/news-and-media/australian-unity-wellb
    eing-index-2016
●   US Best States
    https://www.usnews.com/news/best-states/articles/methodology
●   Child Opportunity Index
    http://www.diversitydatakids.org/files/CHILDOI/DOCS/DDK_KIRWAN_CHILDOI_METH
    ODS.pdf
●   Subjective Wellbeing Index
    (Dolan et al. 2011; Benjamin et al. 2014)
●   The Economist Intelligence Unit’s Liveability
    https://www.smh.com.au/cqstatic/gxx1l4/LiveabilityReport2017.pdf
●   KIDS COUNT National Indicators
    http://www.aecf.org/m/resourcedoc/AECF-KIDSCOUNTIndex-2012.pdf
●   The Healthy Eating Index
    https://www.cnpp.usda.gov/sites/default/files/healthy_eating_index/HEI2010-UpdatePap
    er.pdf
    https://www.cnpp.usda.gov/sites/default/files/healthy_eating_index/HEI-2005TechnicalR
    eport.pdf
●   WHO-5 Well-Being Index
    https://www.corc.uk.net/outcome-experience-measures/the-world-health-organisation-fiv
    e-well-being-index-who-5/

                                                     Well-Being Assessment in Hawaii - 7
● Worcester Economic Index
http://www1.assumption.edu/worcester-economic-indicators-project/methods-details/
● Anholt-GfK Nation Brands Index
https://beta.gov.scot/publications/anholt-gfk-roper-nation-brands-index-sm-2016-report-s
cotland/
● Global Liveable Cities Index
(Giap et al. 2014)
https://www.pecc.org/resources/infrastructure-1/2134-research-framework-on-global-live
able-cities-index-a-sustainable-humanitarian-a-socially-inclusive-approach/file
● Mercer Quality of Living Survey
https://www.mercer.com/newsroom/2018-quality-of-living-survey.html
● Canadian Index of Well Being
https://uwaterloo.ca/canadian-index-wellbeing/reports/2016-canadian-index-wellbeing-na
tional-report/appendix-b-ciw-methods
● Health Equity Index
https://www.sdoh.org/about/hei
1.1.3 Well-being indicators
The alternative approach of providing a dashboard of indicators allows a well-being project to
focus more on collecting meaningful indicators than on the methodological minefield of creating
a composite index. This approach gives a good sense of the breadth of data on well-being, but
can be overwhelming. New users of indicator dashboards need a guide to help retrieve
actionable information. Effective dashboards are paired with reports/visualizations highlighting
interesting contrasts.
The Pasadena Quality of Life Index 2012 provides a dashboard of indicators and at times
compares Pasadena to its neighbors.6 It stands out for its use of inferential measures of
well-being.
The Long Island Index 2018 Indicators report7 is another example of the dashboard method.
They group indicators within goals underneath their core domains of well-being. For example,
within the Economy domain, they list the following goals: Growth and Prosperity, Supportive
Business Environment, and Innovative Economy. Indicators within Growth and Prosperity are
GDP, employment trends, growth in wages, industry clusters, and household income
distribution.
6
https://ww5.cityofpasadena.net/public-health/wp-content/uploads/sites/51/2017/02/Quality-of-Life-2012-Fi
nal-with-Links.pdf
7
http://www.longislandindex.org/wp-content/uploads/2018/04/2018_Index_report_full_040518.pdf
Well-Being Assessment in Hawaii - 8Other examples of well-being indices reviewed for this report that use the dashboard approach
include:
● Calvert-Henderson Quality of Life Indicators
http://ethicalmarketsqualityoflife.com/backgrond-method/
● Stiglitz, Sen, Fitoussi report
http://ec.europa.eu/eurostat/documents/118025/118123/Fitoussi+Commission+report
● System of Environmental Economic Accounts
https://seea.un.org/content/about-seea
● Sustainability Development Goals
https://unstats.un.org/sdgs/indicators/indicators-list/
● National Neighborhood Indicators Partnership
https://www.neighborhoodindicators.org/activities/issues
● Boston Indicator
http://www.bostonindicators.org/indicators
● Community Indicators Victoria
http://www.communityindicators.net.au/indicator_metadata
● The National Citizen Survey (HNL, 2017)
http://www.honolulu.gov/rep/site/oca/oca_docs/1-FY2017_The_NCS_Community_Livabil
ity_Report_Honolulu_2017.pdf
● The Social Health of the Nation
(Miringoff and Miringoff 1999)
● Older Americans: Key indicators of Well Being
https://agingstats.gov/docs/LatestReport/Older-Americans-2016-Key-Indicators-of-WellB
eing.pdf
● America’s Children: Key National Indicators of Well-Being
https://www.childstats.gov/americaschildren/index.asp
● Baltimore Neighborhood Indicators Alliance
https://bniajfi.org/indicators/all
● Eastern Tennessee Index
http://etindex.org
● Quality of Life in Jacksonville: Indicators for Progress
https://issuu.com/jcci/docs/2012_qol_summary_document
● Greater Portland Pulse
http://communityindicators.net/wp-content/uploads/2018/02/path_economic_prosperity.p
df
● Sustainable Seatle’s Indicator (Indicators of Sustainable Community)
http://communityindicators.net/wp-content/uploads/2018/01/SustainableSeattleSustainab
ilityReport2006.pdf
● Oregon Progress Board
https://www.oregoncf.org/Templates/media/files/reports/2014/top_indicators_oregon_20
14.pdf
● Buncombe county (Asheville, NC) - Sustainability Plan
https://www.buncombecounty.org/common/planning/sustainability-plan-update.pdf
Well-Being Assessment in Hawaii - 9● Tasmania Together
https://cities.infrastructure.gov.au/28435/documents/59652
● Community Needs Assessment
http://newarkchange.org/projects/2012-community-needs-assessment/
● Ecosystem and Human Well-being (The Millennium Ecosystem Assessment)
http://www.millenniumassessment.org/documents/document.356.aspx.pdf
1.1.4 Other approaches
There are many more alternative conceptions of well-being and methods for assessing
well-being than are presented within this report. Coyle et al. (2017) is a recent discussion of the
alternatives to GDP, Jones and Klenow (2016) use equivalent compensation to compare
well-being, and Benjamin et al. (2014) create a survey-based individual well-being index built on
stated preference. The focus of this report is on a pragmatic approach to well-being assessment
that builds on the dominant approaches in research and practice with a focus on Hawaii.
Maslow’s hierarchy of needs, the matrix of fundamental human needs, and Sen and
Nussbaum’s capabilities approach, among other important contributions to understanding
well-being are not detailed in this report.
1.2 Common Well-Being Indicators by Domain
This section presents some common indicators of well-being in listed table 1 below. We briefly
discuss several of these to indicate typical issues of measurement and interpretation. This list
should not be considered exhaustive. The average well-being indicator project we surveyed
included hundreds of indicators. A comprehensive analysis is beyond the scope of this report.
Additional indicators are covered in section 2.1 on existing data.
Income per capita
Income per capita is frequently used as a general measure of well-being. This measure has
many drawbacks. The per capita measure allows the aggregate (sum) of income to be
compared across regions, but the per capita value may not be reflective of any one individual’s
or household’s experience. Median income/earnings at least identifies a notion of the typical
individual/household. Unfortunately, income/earnings itself misses the overall buying power of
the household. Keeping income constant, households’ consumption is still constrained by
overall wealth (i.e., their full list of assets and liabilities). Beyond consumption many other
factors affect well-being. As noted by Deaton (2008), in his analysis of the Gallup World Poll, an
individual cannot always pay for better health, and health affects an individual’s ability to enjoy
their wealth.
Self-reported well-being
Self-reported well-being provides a window into how individuals see themselves, often in
comparison to their community or to global norms. This measure typically falls within evaluative
Well-Being Assessment in Hawaii - 10well-being that has a longer time horizon than what we can observe from point-in-time
observations of individuals’ conditions. The Cantril ladder, used in the Gallup World Poll, is a
common measurement and is discussed thoroughly by Deaton (2008) where he finds it has a
consistent positive relationship with GDP per capita. As a survey measurement, self-reported
well-being is expensive to collect and is often supplemented by other measures for small-area
studies.8
Unemployment rate
The unemployment rate measures the proportion of the individuals in the labor force that are
unemployed. This excludes the working-age population that has given up looking for work and
the institutionalized population. This measure misses those that are stuck in part time work
(underemployed). In general, there is a broad assumption that being employed is good, where
job satisfaction varies greatly and employment does not always have a consistent effect on
overall well-being.
Long-term unemployment
The OECD defines long-term unemployment as unemployment lasting at least one year.9
Long-term unemployment is self-reinforcing. Being without a job for an extended period makes
the job-seeker less attractive to potential employers. Primary data on long-term unemployment
for the US comes from the Bureau of Labor Statistics Current Population Survey. Estimates
exist of the national and state level.
Median annual earnings
Median annual earnings identifies the amount where 50% of individuals/households make more
and 50% make less. This avoids bias in a per capita measure when the top of the distribution
sees growing income while the rest of the distribution stagnates. This measure is still limited and
many other features of earnings are important to consider. What is the state of other sections of
the income distribution (the bottom 20%, 10%, etc.)? What is the state of earnings inequality?
Are earnings growing (and whose earnings are growing)? What are earnings expectations of
new grads? What are earnings expectations in real terms for those on fixed incomes? This
variable is estimated at low geographic aggregation making it attractive for inclusion.
Broadband speed/availability
Percent of households with broadband internet subscription is available from the ACS.
Unfortunately there are no ready measures of speed/quality. The FCC has a map of broadband
offerings that is useful for estimating speeds at the census tract level.10
8
See (Brezzi and Ramirez 2016) for a more recent look at well-being assessment at the subnational level
using the Gallup World Poll.
9
https://data.oecd.org/unemp/long-term-unemployment-rate.htm
10
https://broadbandmap.fcc.gov/
Well-Being Assessment in Hawaii - 11Table 1. Common Well-Being Indicators by Domain
Indicator Source for HI Level of aggregation
Income per capita ACS Census tract
Self-reported SMS Survey, SMS survey area,
well-being Gallup-Healthways State
Well-Being Index
Unemployment rate ACS Census tract
Long-term CPS Metro area, State
unemployment rate
Median annual ACS Census tract
earnings
Broadband FCC Any
speed/availability
Life expectancy at IHME Estimates11 County
birth
Obesity rate 500 Cities Census tract
Self-reported health 500 Cities Census tract
Violent (and property) HPD City-block/beat level
crimes per capita
Years of schooling ACS Census tract
Educational ACS Census tract
attainment (% with
college degree)
Voter turnout HI Office of Elections State legislative district
Housing burden ACS Census tract
Can rely on
friends/family?
Housing affordability ACS Census tract
11
The Institute for Health Metrics and Evaluation (IHME) “used small area estimation methods to produce
annual life tables and calculate age-specific mortality risk at the county level for the United States.
De-identified death records from the National Center for Health Statistics (NCHS) and population counts
from the census bureau, NCHS, and the Human Mortality Database were used in the analysis.”
http://ghdx.healthdata.org/record/united-states-life-expectancy-and-age-specific-mortality-risk-county-198
0-2014
Well-Being Assessment in Hawaii - 121.3 Building an Index
The OECD has developed a Handbook on Constructing Composite Indicators: Methodology and
User Guide12 that provides a comprehensive overview of how to build composite indices. This
report will not attempt to recreate that tome, but will highlight core insights applicable to the
creation of a well-being index for Hawaii.
1.3.1 Indicator selection
Indicator selection is driven by expert advice, policy targets, and data availability. Indicators
should be selected because they give valuable information on substantive questions.
Convenient indicators should be avoided when they have high potential for bias. For example, in
the goal to reduce hunger, survey estimates on food security should be preferred to the count of
school lunch provision. Using survey responses from the Current Population Survey,
researchers at the US Department of Agriculture found 38% of food insecure households were
not using the three largest Federal food and nutritional assistance programs (Coleman-Jensen
et al. 2014). These households would be undercounted and their distribution untracked if we
were simply relying on provision of public nutrition services.
A pragmatic approach is to start with common indicators that have well-defined connections to
the well-being domains. The Legatum Institute uses a two-year methodological review cycle,
freeing them to evolve their stable of indicators to meet policy and theoretical demands.
There are two basic approaches for selecting indicators for cross-community comparisons.
Indicators can be selected directly by domain experts or selected by a data-driven process.
These two approaches are often combined. It is easier to refine a shorter list, so either method
may be used as an input to the other.13
Data-driven approach
Exploratory factor analysis can be used to reduce the dimensionality of the collected data on
well-being. The resulting factors are either selected from among the initial indicators or
constructed by combining existing indicators. (Shahumyan et al. 2017) use exploratory factor
analysis to identify key indicators in order to cluster neighborhoods in Baltimore and Dublin.
12
https://read.oecd-ilibrary.org/economics/handbook-on-constructing-composite-indicators-methodology-an
d-user-guide_9789264043466-en
13
(Decancq and Lugo 2013) list three core categories which house distinct approaches to setting
composite weights: data-driven (frequency, statistical, most-favorable), normative (equal or arbitrary,
expert opinion, price based), and hybrid (self-stated, hedonic).
Well-Being Assessment in Hawaii - 131.3.2 Indicator normalization
Since indicator values are often incomparable (e.g., proportions and dollar amounts), indicators
are normalized to either allow direct comparison or as a preparation step in the formation of a
composite index. In each case the direction of well-being must be considered, since, for
example, lower unemployment and higher income are both desirable.
Min-max normalization
One of the most common normalization techniques is min-max normalization. This normalization
subtracts the minimum value and divides by the difference between the min and the max. Take
life expectancy as an example, if the minimum life expectancy value is 50 and the maximum is
90, then a region with a life expectancy of 70 would have a score of 0.5 = (70 - 50)/40. The
Legatum Prosperity Index uses this procedure where it is called a distance-to-frontier score14.
Z-score normalization
The Child Opportunity Index,15 among others, uses z-score normalization to allow regions to be
compared in terms of typical variation in each indicator. For normally distributed data, a z-score
of 1 means the value is one standard deviation larger than the mean, a z-score of -1 indicates
the value is one standard deviation smaller than the mean, and a z-score of 0 indicates the
value is the mean value. The nice interpretability of z-score normalization only applies for
normally distributed data. For many of the indicator values of interest, this is not the case.
Percentile normalization
The Applied Geographic Systems Quality of Life Index assigns for each indicator a rank to each
census block group. That rank is then scaled to range from 0 to 1000. This normalization has
the advantage of presenting distributional information without the need for distributional
assumptions. Using the percentile rank directly, a region with an unemployment percentile rank
of 50 would have unemployment lower than 50% of regions. In contrast, the same conclusion
only applies to z-score normalization (for a z-score value of 0) when the underlying data is
normally distributed.
This normalization focuses attention on relative performance vs. absolute performance. In a
society where everyone has a high level of well-being, the individual with the lowest levels
would still look poor when using a percentile normalization.
14
See
http://prosperitysite.s3-accelerate.amazonaws.com/9615/1186/6075/Legatum_Prosperity_Index_2017_M
ethodology_Report.pdf. Min-max normalization is also used by the OCED Regional Well-Being index
(https://www.oecdregionalwellbeing.org/assets/downloads/Regional-Well-Being-User-Guide.pdf), the
Social Progress Index
(https://www.socialprogressindex.com/assets/downloads/resources/en/English-2017-Social-Progress-Ind
ex-Methodology-Report_embargo-until-June-21-2017.pdf), the UN’s Human Development Index
(http://hdr.undp.org/sites/default/files/hdr2016_technical_notes_0.pdf) and many others.
15
http://www.diversitydatakids.org/files/CHILDOI/DOCS/DDK_KIRWAN_CHILDOI_METHODS.pdf
Well-Being Assessment in Hawaii - 14Rate-of-change normalization
The Canadian Index Wellbeing uses a common base year for each indicator and sets the value
in the base year to 100.16 So, in the current year if the value of the health indicator is 120, we
know the current health measurement is 20% higher than the measurement in the base year.
Headcount normalization
Continuous variables, like income, can be transformed into a headcount measure by counting
the number of individuals or households with income above a designated threshold. This is a
particularly important normalization, since thresholds are common policy levers (e.g.,
determining eligibility for Section 8 housing, free and reduced lunch, etc.). This normalization
has the ability to focus on absolute levels of well-being. If the threshold is set based on a
percentile (like for Section 8 housing), the headcount normalization gives a relative measure. If
the threshold is determined outside of the observed values, it can be considered an absolute
measure of well-being. The proportion of households with at least one person unemployed is an
example of an absolute measure of economic opportunity.
1.3.3 Weighting methods
Within a composite index, understanding the weighting of the components is fundamental to
understanding what can explain differences across areas. Simple equal weighting will bias the
index towards any correlated components. If the components are orthogonal (i.e., not
correlated), equal weighting implies that each component is equally important. The key here is
to note that even a seemingly fair weighting makes an assumption about relative importance.
Weighting also interacts with choice of indicator normalization. With equal weighting, z-score
normalization assumes that the standard deviation across indicators has the same importance
in determining the composite index. With percentile normalization, relative position is what is
compared and each step in percentile rank would be considered equal across indicators with
equal weighting.
When a subjective (or an objective) measure of well-being is available, using regression
methods to predict well-being can produce weights consistent with the chosen well-being
measure. In the absence of a well-defined objective function, the weighting will imply a latent
well-being variable that may or may not reflect actual notions of well-being.
The OECD Better Life Index web application allows users to manually adjust the weights across
domains.17 This approach is honest with the fact that in the absence of an objective function,
16
https://uwaterloo.ca/canadian-index-wellbeing/reports/2016-canadian-index-wellbeing-national-report/app
endix-b-ciw-methods
17
http://www.oecdbetterlifeindex.org/
Well-Being Assessment in Hawaii - 15there are no known optimal weights. In practice, simple equal weighting across domains is the
most common approach.
1.3.4 Comparing communities
There are many different ways in which communities can be established and defined.
Communities are established through common association. Individuals associate themselves
with others based on location, race, gender, age, employment, education, interests, etc. For
administrative convenience communities are often defined geographically within discrete
boundaries, however, communities with which individuals identify may not be geographically
bound. It is therefore important to consider the appropriate pairing of community unit with index.
As an example, Shelton et al. (2015) use Twitter geotagged data to find that the locations of
individuals identifying with a certain geographic community do not fit neatly, or consistently,
within that community’s historical boundaries. The fuzzy, overlapping nature of notions of
community and neighborhood mean that any fixed boundaries imposed are fixed for
convenience. Ideally, a well-being comparison application could allow for user-defined
boundaries. Microsimulation approaches built on available micro data (discussed in section
1.3.5 below) can facilitate generating estimates for these ad hoc boundaries.
Census tracts are designed to be stable to facilitate comparisons over time. They typically
contain between 1,200 and 8,000 people.18 Because of the wealth of demographic information
available in the ACS and the wealth of general statistics available at the census tract, it is a
natural target geography for a small-area well-being index. We recommend creating estimates
at the census-tract level and providing a geographic crosswalk to translate the estimates to
other desirable geographies (e.g., school district, legislative district, island, county, etc.).
Estimates at higher levels of geographic aggregation can also be estimated directly as an
additional project output.
When data is not available at the census-tract level, care must be taken in estimating
disaggregated indicator values. ESRI’s approach takes these household-level observations and
assigns households in a census tract a value based on their demographic and socioeconomic
characteristics.19 This approach implies that the only way to change the indicator values is to
change the demographic/socioeconomic characteristics of the census tract. When a census
tract is poor and unhealthy, the policy answer can’t be to reduce the number of individuals
outside of prime working age. As a result, the focus should be on statistics that are measured at
a sufficiently small level of aggregation while using broader household surveys to help flesh-out
our understanding of well-being, intersectionality, and the complexity of experiences.
For each well-being domain, inequalities across non-geographic communities are important to
consider. In Hawaii, Marshallese have civilian unemployment rates more than twice the state
18
https://www.census.gov/geo/reference/gtc/gtc_ct.html
19
See Tarozzi and Deaton (2009) for a critique of this approach focusing on small-area estimation of
poverty levels.
Well-Being Assessment in Hawaii - 16average rate.20 Identifying disparities in well-being can create natural policy targets (e.g.,
improving the state of Marshallese employment). In general, highlighting inequalities and
recognizing the intersectionality of well-being will lead to a more nuanced index that has
flexibility to address a wide array of issues. Further, tracking these inequalities across time will
help identify systemic barriers to mobility for disadvantaged communities.
1.3.5 Micro Indicators
Public use (and restricted use) micro samples of large surveys present additional opportunities
for understanding the multidimensional nature of well-being and its complement, deprivation.
While the ACS provides useful breakdowns, like income summaries by sex, household
characteristics, race, etc., this is a limited view of multidimensionality/intersectionality. Using
household-level responses we can identify how many households have met well-being
thresholds across a number of domains (this is a version of the Alkire-Foster Multidimensional
Poverty Index (Alkire et al. 2015)). This measurement is also referred to as a double-cutoff,
since we would first specify the number of domains in which households need to meet the
domain-level threshold in order to be considered multidimensionally well (or deprived).
In order to get a more granular picture of well-being, microsimulation can complement existing
micro data to take, for example, the relatively large Public Use Micro Areas (PUMAs) to
generate census tract estimates.21 One caveat with microsimulation methods is their reliance on
the factors used to match individual/household draws to census tracts. These methods will
typically calibrate their microsimulation using certain demographic features like gender, race,
age, and family size.22 This approach implicitly ties any subsequent analysis to these
demographic features. An example implication is that well-being depends on race, which is
perhaps a result, but may not get to the root of inequalities. These demographic features are
also not feasible or desirable as policy levers.
20
See DBEDT (2018), “Demographic, Social, Economic, and Housing Characteristics for Selected Race
Groups in Hawaii.”
21
See Choupani and Mamdoohi (2016) for a review of population synthesis and other microsimulation
approaches.
22
As an example, Dwyer-Lindgren et al. (2017) use small area estimation to create life expectancy
estimates at the county level where estimates are driven by “7 covariates (the proportion of the adult
population who graduated high school; the proportion of the population that is Hispanic; the proportion of
the population that is black; the proportion of the population that is a race other than black or white; the
proportion of a county that is contained within a state or federal Native American reservation; the median
household income; and the population density).”
Well-Being Assessment in Hawaii - 171.4 Well-Being Index Communication
1.4.1 Selecting communication media
A successful well-being index will have a high penetration rate with its intended audience. To
reach the general public, infographics, interactive visualizations, and blog posts will be more
effective than an isolated white paper. Creating content designed for social media consumption
and sharing will help increase the spread of information.
1.4.2. Interactive examples
There are many examples of interactive applications as communication tools for well-being
indices. This section discusses a handful of the best examples. Table 2 below lists other
interactive applications for well-being indices reviewed for this report.
Well-Being Assessment in Hawaii - 18Table 2. List of Interactive Well-Being Index Applications
Well-Being Index Interactive Application Link
OECD Regional Well-Being https://www.oecdregionalwellbeing.org/
Happy Planet Index http://happyplanetindex.org/
Genuine Progress Indicator http://dnr.maryland.gov/mdgpi/Pages/Calculator.aspx
Measure of America http://www.measureofamerica.org/maps/
Human Development Index https://ourworldindata.org/grapher/human-development-i
ndex?year=2014&country=USA
Social Progress Index https://www.socialprogressindex.com/
Long Island Index http://www.longislandindexmaps.org/
Prosperity in the UK (Legatum) http://uk.prosperity.com/
AARP Livability Scores https://livabilityindex.aarp.org/
Opportunity Index https://opportunityindex.org/
National Welfare Index http://www.fest-nwi.de/index.php/en/home
Sustainability Development Goals https://sustainabledevelopment.un.org/?menu=1300
Environmental Performance Index https://epi.envirocenter.yale.edu/results-overview
Community Indicators Victoria http://www.communityindicators.net.au/lga_profiles
Australian Unity Wellbeing Index https://australianunity.au1.qualtrics.com/jfe/form/SV_3Wr
r9BX1iBvSJfL
US Best States https://www.usnews.com/news/best-states/data-explorer
Child Opportunity Index http://www.diversitydatakids.org/
KIDS COUNT National Indicators https://datacenter.kidscount.org/
Baltimore Neighborhood Indicators Alliance https://bniajfi.org/vital_signs/
Oregon Progress Board http://oe.oregonexplorer.info/rural/CommunitiesReporter/
TopIndicators
Well-Being Assessment in Hawaii - 19The Measure of America project offers a suite of interactive tools.23 They feature an interactive
map allowing the direct selection of census tracts for some metro areas (see figure 1).
Unfortunately, these rely on Flash. Tools that rely on plugins are unlikely to work on mobile
devices and consumers may feel uncomfortable installing these plugins. Users without Flash
receive the disappointing “Alternative content” (see figure 2).
Figure 1. Mapping the Measure of America: http://www.measureofamerica.org/maps/
Figure 2. Mapping the Measure of America (without Flash)
23
http://www.measureofamerica.org/tools/
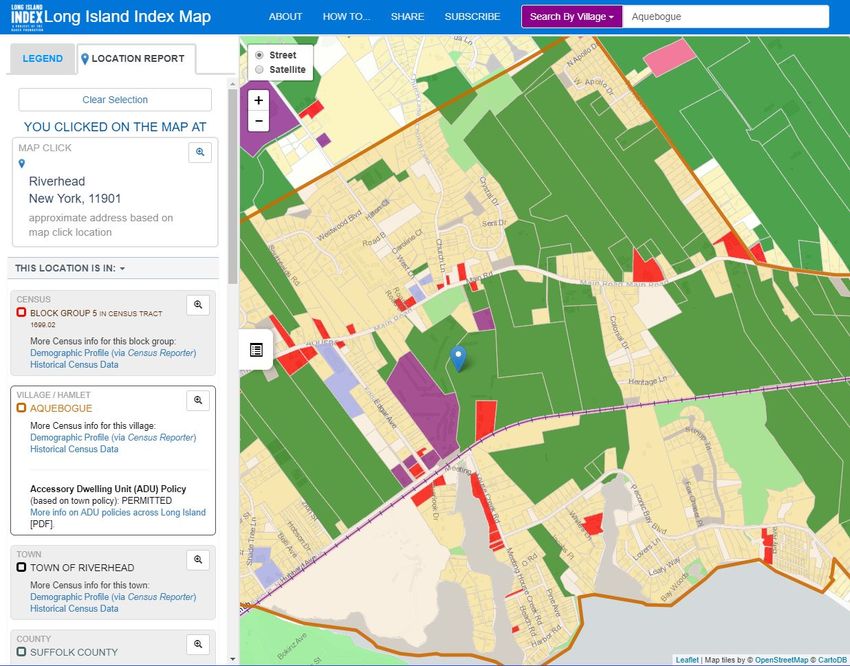
Well-Being Assessment in Hawaii - 20The OECD Better Life Index24 does a fantastic job making it easy for users to adjust the weights
combining domain indices into one composite index of well-being (see figure 3). This ability to
adjust the weights is honest with the fact that no choice of weights will best answer every policy
question. Another standout feature of their website, is displaying distributions of each
component indicator on the domain pages (see figure 4). The combination of a narrative
describing the connection between each component indicator within each domain provides extra
details to those that want to know more.
Figure 3. OECD Better Life Index (weights inset)
Figure 4. OECD Better Life Index. Domain details
24
http://www.oecdbetterlifeindex.org/topics/housing/
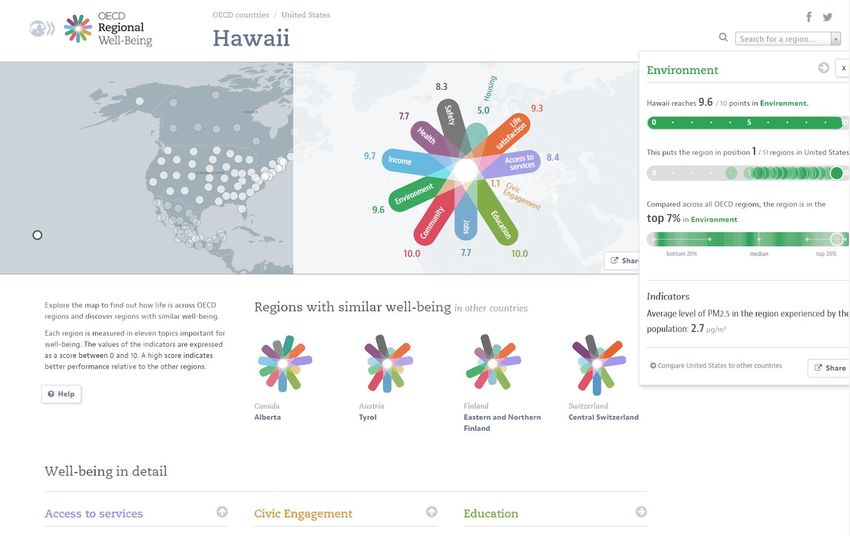
Well-Being Assessment in Hawaii - 21The OECD Regional Well-Being interactive25 allows users to select an area and see areas that
have well-being domain scores that are similar. The region selector requires the user to know
the name of the region to compare, which would not be effective for census tracts. Allowing
users to input an address/ZIP-code or click an area on a map would be a more effective
mechanism allowing users to select specific census tracts. Each domain is displayed as a petal
in a visual symbol similar to a flower (see figure 5). Clicking on an individual petal displays
where the currently selected region falls in the distribution of the clicked domain.
Figure 5. OECD Regional Well-Being
25
https://www.oecdregionalwellbeing.org/
Well-Being Assessment in Hawaii - 22The Maryland Genuine Progress Indicator Calculators are a pair of web forms that allow users
to change the observed values for Maryland to estimate new index values for their economic,
environmental, and social domains (see figure 6). The idea of letting users play around with
indicator values to get a better sense of how changes to underlying indicators (like income
inequality) affect the overall index values is attractive. Unfortunately, without knowing
reasonable values to enter, this calculator can convey very little meaning. Further the calculator
has an outdated UI both in design and functionality.
Figure 6. Maryland’s Genuine Progress Indicator Calculators.
Well-Being Assessment in Hawaii - 23The Social Progress Index26 presents county level indicators in a scorecard that helps users
visually identify strong/weak domains (see figure 7).
Figure 7. Social Progress Index Scorecard
26
https://www.socialprogressindex.com/
Well-Being Assessment in Hawaii - 24The Long Island Index Map allows users to search by village or address. For a selected address
users see a list on the left of all the containing geographic boundaries: census block group,
village/hamlet, town, county, county legislative district, state assembly district, state senate
district and US congressional district. In addition to standard political boundaries, their map
includes service provider districts for fire, ambulance, garbage, library, police, school, and water.
They make use of CartoDB, which has an impressive suite for geographic visualization.27
Figure 8. Long Island Index Map
1.4.3 Measuring impact
To measure the impact of the well-being index, attention should be paid to both unique visitors
and social shares. Using the Facebook Pixel and Google Analytics will streamline the
measurement of site visitors and identifying demographic patterns. Facebook can be leveraged
to retarget Hawaii residents that have viewed the index and to survey them for feedback on the
index. Retargeting can be used to drive overall engagement, but should be used with caution as
27
https://carto.com/builder/
Well-Being Assessment in Hawaii - 25consumers become either desensitized to advertising personalization or offended by the
perceived invasion of privacy.
1.5 The Current State of Well-Being Indices
Well-being measurement is a complex and evolving area of active research. The Social
Indicators Research journal is dedicated to the study of the quality of life and should be
periodically reviewed in coordination with any methodological update to this project.28 For
example, a recent article, analyzed the OECD Better Life Index using PCA and k-means
clustering to provide another view into the patterns revealed by the multidimensional approach
(do Carvalhal Monteiro et al. 2018). Using this approach we could show, for example, that the
financial district and Kakaako are multidimensionally similar and belong to a group of census
tracts with multidimensional well-being values that distinguish them from other census tracts.
Across the indices we surveyed most left out important details of indicator selection,
normalization, and weighting to form composite indices. Among those that detailed their
approach, min-max normalization was the most popular normalization of individual indicators.
To combine normalized indicators into a composite index most projects used simple averaging
(i.e., equal weighting).
In terms of communication, while we can observe the output from many of these projects it is
not feasible to measure their effect on the policy landscape. To maximize the impact of an
interactive display of a well-being index it is important to use web technologies that are mobile
friendly and as future proof as possible (e.g., Measure of America’s reliance on Flash)
1.6 Opportunities for Measuring Well-Being in Hawaii
Including subjective indicators helps to reflect community concerns not naturally covered by the
more standard objective measures.29 In general, these subjective measures can help point to
issues with objective measures of well-being and with the weighting of composite indices.
The AARP Livability Score30 includes policies as factors that can increase the livability score of
a region. While it is not clear how to effectively quantify the impact of policies in general, the
inclusion of relevant/related policies alongside the presentation of objectively measured
well-being factors is a powerful tool for policy advocacy.
28
https://link.springer.com/journal/11205
29
Examples: The Australian Unity Wellbeing Index
(https://www.australianunity.com.au/media-centre/news-and-media/australian-unity-wellbeing-index-2016)
and Bhutan’s Gross National Happiness
(http://www.grossnationalhappiness.com/wp-content/uploads/2012/04/Short-GNH-Index-edited.pdf).
30
https://livabilityindex.aarp.org/how-are-livability-scores-determined
Well-Being Assessment in Hawaii - 26Among the well-being indices we surveyed the OECD Regional Well-Being,31 the Genuine
Progress Indicator (Maryland),32 the Happy Planet Index,33 the Child Opportunity Index,34 and
the AARP Livability Scores stood out for their comprehensive coverage of many factors that
impact the quality of life. These indices also feature well-documented methodology sections or
white papers.
2 Opportunities
2.1 Existing data
2.1.1 The well-being model
The well-being domains identified in this report overlap closely with those in the Legatum
Institute Indices, the OECD Better Life Index, and others:
Hawaii Well-Being Index Domains
● Economic Opportunity
● Health
● Community Security
● Education
● Institutions (Governance)
● Social Capital
● Housing
Comparison of these domains to those in a recent index of multiple of deprivation provides a
useful framework for discussing the advantages and drawbacks of the current approach. Exeter
et al. (2017) describe the New Zealand Indices of Multiple Deprivation (NZIMD). Phillips et al.
(2016) survey indices of multiple deprivation since Townsend (1987) and argue for their use in
the US. This list of domains is reflective of indices of multiple deprivation in other countries:35
Indices of Multiple Deprivation Domains
● Employment
○ HWB: Economic Opportunity
31
https://www.oecdregionalwellbeing.org/assets/downloads/Regional-Well-Being-User-Guide.pdf
32
http://dnr.maryland.gov/mdgpi/Pages/what-is-the-GPI.aspx
33
http://happyplanetindex.org/about#how
34
http://www.diversitydatakids.org/files/CHILDOI/DOCS/DDK_KIRWAN_CHILDOI_METHODS.pdf
35
English Indices of Multiple Deprivation:
https://www.gov.uk/government/statistics/english-indices-of-deprivation-2015; review of indices of multiple
deprivation and recommendations for the US (Phillips et al. 2016); Area Deprivation Index for the US:
https://www.hipxchange.org/ADI;
Well-Being Assessment in Hawaii - 27● Income
○ HWB: Economic Opportunity
● Crime
○ HWB: Community Security
● Housing
○ HWB: Housing
● Health
○ HWB: Health
● Education
○ HWB: Education
● Access
○ HWB: Institutions (Governance)
Compared to the NZIMD, the Hawaii Well-Being domains add social capital as a primary
concern and collapse employment and income into economic opportunity.
The lack of a domain focused on environment means that the Institutions (Governance) and
Community Security domains will have to cover the base of differential access to public
parks/environmental amenities. Likelihood of impact by floods, wind damage are other
examples of local factors that could fit within Community Security, but are distinct from crime
and could be considered part of an Environment domain.
2.1.2 Cross-cutting datasets
American Community Survey
https://factfinder.census.gov/
The US Census Bureau’s American Community Survey provides detailed estimates of
population and housing characteristics at the census tract-level
2.1.3 Economic Opportunity
HI DOTAX
State of Hawaii Department of Taxation is able to create aggregate measures of income and
income inequality as reported on tax returns, similar to those generated by the IRS at the zip
code level:
https://www.irs.gov/statistics/soi-tax-stats-individual-income-tax-statistics-zip-code-data-soi
DOTAX could generate these statistics at the census tract level to provide an administrative
validation of the estimates from the ACS. DOTAX could also help create measures of income
growth at the census-tract level.
Well-Being Assessment in Hawaii - 28ACS
https://factfinder.census.gov/
The American Community Survey provides an array of survey estimates at the census-tract
level including Income, income inequality, labor market status, business income, commute time
to work, WIC, SNAP, and other social services utilization.
BEST Index
http://www.basiceconomicsecurity.org/best/families.aspx
The Institute for Women’s Policy Research and the National Council on Aging have developed
the Basic Economic Security Tables (BEST) index to measure the income a working adult would
need to meet their basic needs in select cities, counties, and states. The earnings needed are
calculated for a wide variety of family compositions. These benchmarks could be used to get a
headcount of households with sufficient earnings based on public use microdata from the ACS.
Microsimulation approaches could be used to derive estimates of the headcount for regions
smaller than the US Census Public Use Micro Areas (PUMAs).
HI DOE Hawaii Child Nutrition Programs
http://hcnp.hawaii.gov/overview/nslp/
Fiscal reports indicate the count of children in each school eligible for free/reduced lunch.
Consumer Expenditure Survey
https://www.bls.gov/cex/
This household survey provides valuable data on household consumption patterns. Used by
Maryland's Genuine Progress Indicator36 to get a sense of how consumption relates to other
household features.
ESRI
https://doc.arcgis.com/en/esri-demographics/data/us-intro.htm
Household Budget Expenditures, Household Investments, Defensive Expenditures [These data
are household expenditures classified as defensive expenditures taken from the ESRI
consumer database. Categories of defensive expenditures are costs of medical care, costs of
legal services, costs of food and energy waste, household pollution abatement, insurance,
welfare neutral goods (tobacco and 25% of alcohol), household security and costs of family
changes (alimony and child support).].
LEHD Employment Statistics
https://lehd.ces.census.gov/data/#lodes
LEHD Origin-Destination Employment Statistics (LODES) Data is currently available for the
years 2002-2015 at the census block level. It covers basic statistics on employee counts by
place of work and/or home census block. See Graham et al. (2014) for a comparison of
commuting statistics in the ACS and LODES.
36
http://dnr.maryland.gov/mdgpi/Pages/default.aspx
Well-Being Assessment in Hawaii - 292.1.4 Health
CDC 500 Cities Project
The CDC’s 500 Cities project includes Honolulu with estimates for various health indicators at
the census tract level. This includes a self-rated health measure: “14 or more days when
physical (or mental) health was not good in the past 30 days.”
https://www.cdc.gov/500Cities/
Hawaii Health Data Warehouse
http://ibis.hhdw.org/ibisph-view/query/builder/brfss/HealthStat2Lvl/HealthStat2LvlCrude11_.html
Behavioral Risk Factor Surveillance System, including self-reported health status by
community/school complex. This is at a higher level of aggregation, but is useful for modeling
the nature of health in Hawaii. It includes the Pregnancy Risk Assessment Monitoring System,
the Youth Risk Behavior Survey, and a proposed section on Vital Statistics,
UH Pacific Health Informatics Data Center (PHIDC)
http://ssri.manoa.hawaii.edu/tasi-phidc/
PHIDC administers the Hawaiʻi All-Payer Claims Database, which holds the promise of detailed
geographic and demographic insights into healthcare provision in Hawaii.
Hawaii GIS
http://planning.hawaii.gov/gis/download-gis-data/
Provides locations of hospitals
2.1.5 Community Security
Honolulu Police Department (HPD) Offenses by Beat
http://www.honolulupd.org/information/index.php?page=statistics
http://honolulupd.org/downloads/HPD2016annualreport.pdf
HPD Crime Incidents
https://data.honolulu.gov/dataset/HPD-Crime-Incidents/f5dd-pqys
HPD Crime Mapper
https://www.crimemapping.com/map/agency/165
HPD Traffic Information
http://www4.honolulu.gov/hpdtraffic/
National Archive of Criminal Justice Data
https://www.icpsr.umich.edu/icpsrweb/content/NACJD/index.html
The NACJD provides access to the FBI’s Uniform Crime Reporting data for counties and cities.
This data can augment that which is available from the local law enforcement statistics.
Well-Being Assessment in Hawaii - 30Adverse Childhood Experiences (ACE) BRFSS Module
https://www.cdc.gov/violenceprevention/acestudy/ace_brfss.html
The Hawaii BRFSS includes the ACE module for some years, which can be used to model
at-risk homes. The module asks questions of respondents intended to cover their first 18 years
of life.
Housing with Flood Risk
http://gis.hawaiinfip.org/FHAT/, http://dlnreng.hawaii.gov/nfip/floodmaps/
Evapotranspiration of Hawai‘i
(Giambelluca et al. 2014) provide raster GIS data available at 250 m resolution, which can be
aggregated up to the census-tract level (http://solar.geography.hawaii.edu/downloads.html).
Layers include solar radiation, leaf area index, and air temperature.
2.1.6 Education
Hawaii State Department of Education
http://www.hawaiipublicschools.org/VisionForSuccess/SchoolDataAndReports/HawaiiEdData/P
ages/HI-Data.aspx
School enrollment and performance data.
Hawaii State Office of Planning: School Areas
http://geoportal.hawaii.gov/datasets/high-school-areas
http://geoportal.hawaii.gov/datasets/middle-school-areas
http://geoportal.hawaii.gov/datasets/elementary-school-areas
The school-level areas are rolled up into associated school-complex areas:
http://geoportal.hawaii.gov/datasets/school-complex-areas
Which are then rolled up into school districts:
http://geoportal.hawaii.gov/datasets/school-complex-areas
The low-level school boundaries give finer detail on community affiliation based on school
assignment.
ACS
The ACS provides measures of education level as well as average earnings by education level.
This provides insight into both the level of education and how highly valued the education of a
region is.
Hawaii State Public Library System
The annual reports of the Hawaii State Public Library System reports allocations to each
branch. The value of these allocations is inversely proportional to the distance of residents to
these locations. http://www.librarieshawaii.org/about-us/reports/annual-reports/
Well-Being Assessment in Hawaii - 31You can also read