Inversely modeling homogeneous H2SO4 H2O nucleation rate in exhaust-related conditions - atmos-chem-phys.net
←
→
Page content transcription
If your browser does not render page correctly, please read the page content below
Atmos. Chem. Phys., 19, 6367–6388, 2019
https://doi.org/10.5194/acp-19-6367-2019
© Author(s) 2019. This work is distributed under
the Creative Commons Attribution 4.0 License.

Inversely modeling homogeneous H2SO4−H2O nucleation rate
in exhaust-related conditions
Miska Olin1 , Jenni Alanen1,a , Marja R. T. Palmroth2 , Topi Rönkkö1 , and Miikka Dal Maso1
1 Aerosol Physics Laboratory, Physics Unit, Tampere University, P.O. Box 692, 33014 Tampere, Finland
2 Bioand Circular Economy, Faculty of Engineering and Natural Sciences, Tampere University,
P.O. Box 541, 33014 Tampere, Finland
a now at: AGCO Power, Linnavuorentie 8–10, 37240 Linnavuori, Finland

Correspondence: Miska Olin (miska.olin@tuni.fi)

Received: 5 July 2018 – Discussion started: 3 September 2018
Revised: 15 April 2019 – Accepted: 29 April 2019 – Published: 15 May 2019

Abstract. The homogeneous sulfuric acid–water nucleation         1   Introduction
rate in conditions related to vehicle exhaust was measured
and modeled. The measurements were performed by evap-            Airborne particles are related to adverse health effects
orating sulfuric acid and water liquids and by diluting and      (Dockery et al., 1993; Pope et al., 2002; Beelen et al., 2014;
cooling the sample vapor with a sampling system mimick-          Lelieveld et al., 2015) and various effects on climate (Ar-
ing the dilution process occurring in a real-world driving       neth et al., 2009; Boucher et al., 2013). In particular, adverse
situation. The nucleation rate inside the measurement sys-       health effects are caused by the exposure to vehicle emis-
tem was modeled inversely using CFD (computational fluid         sions which increase ultrafine particle concentration in urban
dynamics) and the aerosol dynamics code, CFD-TUTMAM              air (Virtanen et al., 2006; Johansson et al., 2007; Pey et al.,
(Tampere University of Technology Modal Aerosol Model            2009) in the size range with high probability of lung deposi-
for CFD). The nucleation exponents for the concentrations of     tion (Alföldy et al., 2009; Rissler et al., 2012).
sulfuric acid and water and for the saturation vapor pressure       Vehicles equipped with internal combustion engines gen-
of sulfuric acid were found to be 1.9 ± 0.1, 0.50 ± 0.05, and    erate nonvolatile particles (Rönkkö et al., 2007, 2014; Sgro
0.75±0.05, respectively. These exponents can be used to ex-      et al., 2008; Maricq et al., 2012; Chen et al., 2017); however,
amine the nucleation mechanisms occurring in exhaust from        volatile particles are also formed after the combustion pro-
different combustion sources (internal combustion engines,       cess during exhaust cooling (Kittelson, 1998; Lähde et al.,
power plant boilers, etc.) or in the atmosphere. Additionally,   2009), i.e., when the exhaust is released from the tailpipe.
the nucleation rate can be expressed with the exponents as a     Thus, volatile particles are formed through the nucleation
function of the concentrations of sulfuric acid and water and    process; hence, they are called nucleation mode particles
of temperature. The obtained function can be used as a start-    here.
ing point for inverse modeling studies of more complex nu-          An important characteristic of fine particles is the particle
cleation mechanisms involving extra compounds in addition        size distribution, as it determines the behavior of particles
to sulfuric acid and water. More complex nucleation mech-        in the atmosphere and particle deposition to the respiratory
anisms, such as those involving hydrocarbons, are observed       system. Modeling studies provide information on the forma-
with real vehicle exhaust and are also supported by the re-      tion and evolution of exhaust-originated particles in the at-
sults obtained in this study. Furthermore, the function can be   mosphere (Jacobson et al., 2005; Stevens et al., 2012). To
used to improve air quality models by using it to model the      model the number concentration and the particle size of the
effect of sulfuric acid-emitting traffic and power generation    nucleation mode, the governing nucleation rate needs to be
on the particle concentration in urban air.                      known.
                                                                    The detailed nucleation mechanism controlling particle
                                                                 formation in cooling and diluting vehicle exhaust is cur-

Published by Copernicus Publications on behalf of the European Geosciences Union.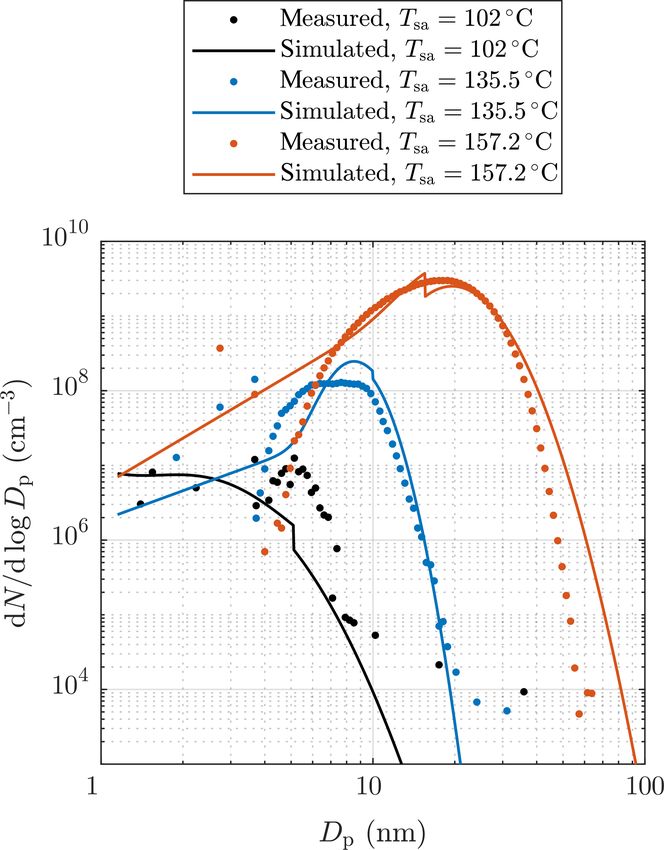
6368                                             M. Olin et al.: H2 SO4 −H2 O nucleation rate in exhaust-related conditions

rently unknown (Keskinen and Rönkkö, 2010). The nucle-            uncertain (Vehkamäki and Riipinen, 2012). The largest un-
ation mode particles contain at least water, sulfuric acid        certainty rises from the capillarity approximation; i.e., the
(H2 SO4 ), and hydrocarbons (Kittelson, 1998; Tobias et al.,      physical properties of small newly formed critical clusters
2001; Sakurai et al., 2003; Schneider et al., 2005). There-       can be expressed as the properties of bulk liquid (Wyslouzil
fore, it is likely that these compounds are involved in the nu-   and Wölk, 2016). Comparing experimental and theoretical
cleation process, but, on the other hand, some of them can        nucleation rates, the CNT underestimates the temperature de-
end up in the nucleation mode through the initial growth          pendency (Hung et al., 1989) and overestimates the sensitiv-
of the newly formed clusters. The most promising candi-           ity of J to [H2 SO4 ] (Weber et al., 1996; Olin et al., 2014).
date for the main nucleating component in the particle for-       These discrepancies entail that theoretically derived nucle-
mation process occurring in diesel exhaust is H2 SO4 , as it      ation rates need to be corrected with a factor, ranging in sev-
has been shown that the H2 SO4 vapor concentration in ve-         eral orders of magnitude, to agree with experimental nucle-
hicle exhaust (Rönkkö et al., 2013; Karjalainen et al., 2014),    ation rates.
fuel sulfur content (Maricq et al., 2002; Vogt et al., 2003;         Conversely, the nucleation rates of the other nucleation
Vaaraslahti et al., 2005; Kittelson et al., 2008), lubricating    mechanisms are typically modeled as (Zhang et al., 2012)
oil sulfur content (Vaaraslahti et al., 2005; Kittelson et al.,
2008), and the exhaust after-treatment system (Maricq et al.,     J = k[H2 SO4 ]n ,                                          (1)
2002; Vogt et al., 2003) correlate with nucleation mode num-
ber concentration, at least in the cases when the test vehicle    where k is an experimentally derived coefficient and n
has been equipped with an oxidative exhaust after-treatment       is the nucleation exponent presenting the sensitivity of
system. The sulfur contents of fuel and lubricating oil are       J to [H2 SO4 ]. According to the first nucleation theorem
connected to the H2 SO4 vapor concentration in the exhaust        (Kashchiev, 1982), n is also connected to the number of
because the combustion of sulfur-containing compounds pro-        molecules in a critical cluster; however, due to assump-
duces sulfur dioxide (SO2 ) that is further oxidized to sulfur    tions included in the theorem, n is not exactly the num-
trioxide (SO3 ) in an oxidative exhaust after-treatment sys-      ber of molecules in a critical cluster in realistic conditions
tem (Kittelson et al., 2008), and SO3 finally produces H2 SO4     (Kupiainen-Määttä et al., 2014). The value for k is typically
when coming into contact with water (H2 O) vapor (Boulaud         a constant that includes the effect of T and [H2 O], i.e., rel-
et al., 1977).                                                    ative humidity (RH; Sihto et al., 2009; Stevens and Pierce,
   Particle formation due to H2 SO4 in real vehicle exhaust       2014). A constant coefficient can be a satisfactory approxi-
plumes and in laboratory sampling systems has been pre-           mation in atmospheric nucleation experiments, where T and
viously simulated by several authors (Uhrner et al., 2007;        RH nearly remain constants. However, T and RH in cool-
Lemmetty et al., 2008; Albriet et al., 2010; Liu et al., 2011;    ing and diluting exhaust are highly variable; thus, a constant
Arnold et al., 2012; Li and Huang, 2012; Wang and Zhang,          coefficient cannot be used. The nucleation exponents, n, for
2012; Huang et al., 2014), but all of them have modeled nu-       H2 SO4 obtained from the atmospheric nucleation measure-
cleation as binary homogeneous nucleation (BHN) of H2 SO4         ments (Sihto et al., 2006; Riipinen et al., 2007) and from the
and water. Other possible nucleation mechanisms include           atmospherically relevant laboratory experiments (Brus et al.,
activation-type (Kulmala et al., 2006), barrierless kinetic       2011; Riccobono et al., 2014) usually lie between 1 and 2;
(McMurry and Friedlander, 1979), hydrocarbon-involving            these are much lower than the theoretical exponents (n&5,
(Vaaraslahti et al., 2004; Paasonen et al., 2010), ternary        Vehkamäki et al., 2003).
H2 SO4 –H2 O–ammonia (Meyer and Ristovski, 2007), and                The first step in examining nucleation mechanisms, other
ion-induced nucleation (Raes et al., 1986) mechanisms. The        than the CNT, in vehicle exhaust using experimental data was
choice of binary homogeneous H2 SO4 –H2 O nucleation in           performed by Vouitsis et al. (2005). They concluded that nu-
studies involving vehicle exhaust is mainly made because it       cleation mechanisms with n = 2, including the barrierless ki-
has been the only nucleation mechanism for which an ex-           netic nucleation mechanism, can predict nucleation rates in
plicitly defined formula for the nucleation rate (J ) can be      vehicle exhaust. Later, Olin et al. (2015) and Pirjola et al.
presented (Keskinen and Rönkkö, 2010). An explicit defini-        (2015) focused on obtaining nucleation rates inversely; i.e.,
tion is required when the nucleation rate in cooling exhaust      an initial function for J acts as an input to the model and is
is modeled, as the nucleation rate has a steep temperature        altered until the simulated particle concentration and distri-
dependency, according to theory (Hale, 2005) and experi-          bution correspond with the measured ones. These modeling
ments (Wölk and Strey, 2001). The nucleation rate of BHN          studies are based on the experiments (Vouitsis et al., 2005;
is derived from classical thermodynamics; thus, the theory        Arnold et al., 2012; Rönkkö et al., 2013) where the exhaust
is called the classical nucleation theory (CNT). The nucle-       of a diesel engine was sampled using a laboratory setup con-
ation rate according to the CNT is explicitly defined as a        taining an engine dynamometer and a diluting sampling sys-
function of H2 SO4 and H2 O vapor concentrations ([H2 SO4 ]       tem (Ntziachristos et al., 2004).
and [H2 O]) and temperature (T ). The derivation of the CNT          Inverse modeling is a preferable method in obtaining nu-
contains, however, a lot of assumptions, and it is thus quite     cleation rates in a diluting domain over the method based

Atmos. Chem. Phys., 19, 6367–6388, 2019                                            www.atmos-chem-phys.net/19/6367/2019/
M. Olin et al.: H2 SO4 −H2 O nucleation rate in exhaust-related conditions                                                      6369

on calculating J by dividing the measured number concen-              nucleation instead of nucleation associated with some un-
tration with an estimated volume of a nucleation region be-           known compounds existing in real vehicle exhaust. Although
cause the volume of a nucleation region also depends on n.            the pure binary nucleation seems not to be the principal
In the case of inverse modeling, there is no need to estimate         nucleation mechanism in real exhaust (Saito et al., 2002;
the nucleation region because the model simulates J at every          Vaaraslahti et al., 2004; Meyer and Ristovski, 2007; Pirjola
time step, in a model using temporal coordinates, or in every         et al., 2015), neglecting the unknown compounds is reason-
computational cell, in a model using spatial coordinates. Pir-        able at this stage of nucleation studies because the knowledge
jola et al. (2015) modeled the dilution system with an aerosol        of the nucleation mechanism of the pure binary nucleation
dynamics model using temporal coordinates and concluded               is still at a very low level, and it should be examined more
that hydrocarbons could be involved in the nucleation mech-           to better understand the nucleation process in real exhaust.
anism, and n lies between 1 and 2. However, because particle          Adding only one additional compound to nucleation exper-
formation in diluting vehicle exhaust involves strong gradi-          iments would cause one additional dimension to the mea-
ents in temperature and the concentrations of the compounds           surement matrix of all changeable parameters considered and
involved, information in spatial dimensions is also required          would thus increase the complexity of the experiments. Sim-
to fully understand the particle formation process. For this          ilarly, adding the concentration of an additional compound
reason, Olin et al. (2015) simulated aerosol dynamics using           to inverse modeling, the complexity and the computational
computational fluid dynamics (CFD) and concluded that n is            cost of the simulations would increase significantly. There-
0.25 or 1, depending on whether solid particles acting as an          fore, it is reasonable to begin the inverse modeling studies
condensation sink for sulfuric acid are emitted or not, respec-       using only the pure binary nucleation mechanism. Addition-
tively. These values are very low compared to other studies           ally, although there are studies suggesting that other com-
and to the first nucleation theorem that restricts n to at least 1.   pounds are involved in the nucleation process in real vehicle
Values below unity imply that there can be other compounds            exhaust, it has not yet been directly shown that the nucleation
involved in the nucleation mechanism in addition to H2 SO4 .          rate would be lower or higher with the absence of those com-
   Ammonia (NH3 ) involved in H2 SO4 –H2 O nucleation                 pounds. Comparing the experiments with pure H2 SO4 –H2 O
(ternary H2 SO4 –H2 O–NH3 nucleation) has a notable effect            nucleation to the experiments with real exhaust can provide
if the H2 SO4 concentration is low and the NH3 concentra-             information on that.
tion is high (Lemmetty et al., 2007; Kirkby et al., 2011). The           The pure H2 SO4 –H2 O nucleation was generated by evapo-
H2 SO4 concentration in the atmosphere is low enough for              rating H2 SO4 and H2 O liquids and using the dilution system
the effect of NH3 to be relevant (Kirkby et al., 2011), but in        that mimics a real-world dilution process of a driving vehicle
vehicle exhaust, higher H2 SO4 concentrations make the ef-            (Ntziachristos et al., 2004). A similar principle of generating
fect of NH3 probably negligible. However, more recent vehi-           H2 SO4 by evaporating it from a saturator has been used in
cles are equipped with the selective catalytic reduction (SCR)        the study of Neitola et al. (2015), where the concentrations
system which decreases nitrogen oxide emissions but, on the           of H2 SO4 and H2 O and temperatures were kept in an atmo-
other hand, increases NH3 emissions. Therefore, NH3 can be            spherically relevant range. In this study, they were kept in a
involved in the nucleation process occurring in vehicle ex-           vehicle exhaust-relevant range; thus, the output is an explic-
haust of vehicles equipped with the SCR system (Lemmetty              itly defined formula for the H2 SO4 –H2 O nucleation rate in
et al., 2007). The SCR system was not included in the ex-             exhaust-related conditions. The formula is in the form of
periments of Arnold et al. (2012) and Rönkkö et al. (2013)                                            [H2 SO4 ]nsa [H2 O]nw
mentioned earlier; thus, other compounds involved in the nu-          J ([H2 SO4 ], [H2 O], T ) = k                         ,    (2)
                                                                                                           psa ◦ (T )msa
cleation process in those experiments are more likely to be
hydrocarbons than NH3 .                                               which is based on the formula hypothesized by Olin et al.
   In this paper, an improved aerosol dynamics model,                 (2015), but with an additional exponent msa for the satura-
CFD-TUTMAM (Tampere University of Technology Modal                    tion vapor pressure of sulfuric acid (psa ◦ ) to also take tem-
Aerosol Model for CFD), based on our previous model,                  perature into account. In Eq. (2), nsa and nw represent the
CFD-TUTEAM (Tampere University of Technology Exhaust                  nucleation exponents for [H2 SO4 ] and [H2 O], respectively.
Aerosol Model for CFD), which is described in Olin et al.             The exponents may also depend on the concentration levels,
(2015), is presented. The main improvement in the model               but due to the unknown dependency, only constant values are
is its capability to model the initial growth of the newly            considered in this study.
formed clusters modally using our novel representation of the            The formulation obtained from this study helps in finding
particle size distribution, the PL+LN (combined power law             the nucleation mechanisms occurring in real vehicle exhaust
and log-normal distribution) model described in Olin et al.           or in the atmosphere. Similarly, it can be used to examine
(2016).                                                               particle formation in coal-fired power plant exhaust, which is
   Laboratory experiments designed for nucleation rate mod-           also known to contain H2 SO4 (Stevens et al., 2012). For ex-
eling purposes are presented in which the examination of              ample, the values of the nucleation exponents obtained in this
the nucleation rate was aimed towards pure H2 SO4 –H2 O               study can provide information on the nucleation mechanisms

www.atmos-chem-phys.net/19/6367/2019/                                                  Atmos. Chem. Phys., 19, 6367–6388, 2019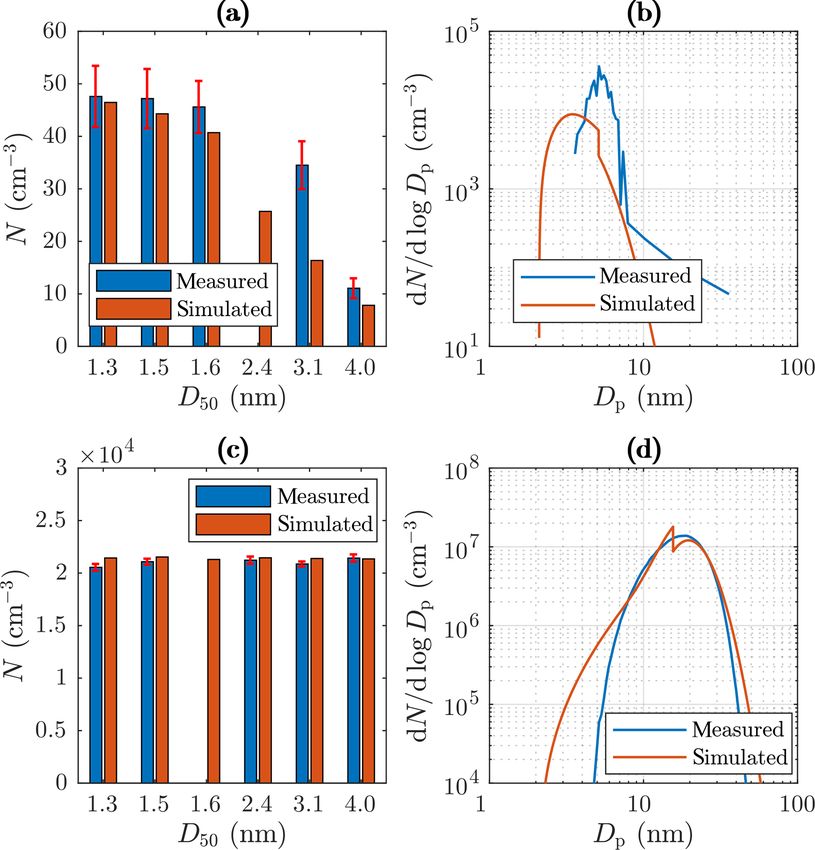
6370                                                 M. Olin et al.: H2 SO4 −H2 O nucleation rate in exhaust-related conditions

                                                                       Milli-Q water. H2 SO4 was held in a PTFE container, and wa-
                                                                       ter was held in a glass bottle. The liquids were heated to tem-
                                                                       peratures Tsa and 43 ◦ C, respectively, which determine the
                                                                       concentrations in the gas phase theoretically through the sat-
                                                                       uration vapor pressure. Dry and filtered compressed air was
                                                                       flown through the evaporators and mixed before heating to
                                                                       350 ◦ C; 2.7 % of carbon dioxide (CO2 ) was also mixed with
                                                                       a sample to act as a tracer to determine the dilution ratio of
                                                                       the diluters. CO2 was selected because it has no effect on
                                                                       the particle formation process and because it exists in real
                                                                       exhaust as well.
                                                                          The computational domain in the CFD simulation shown
                                                                       in the bottom part of Fig. 1 begins before the sample en-
                                                                       ters the porous tube diluter (PTD); thus, the concentrations
                                                                       of H2 SO4 and H2 O, temperature, pressure (p), and flow rate
                                                                       need to be known at that point due to the requirement of the
                                                                       boundary conditions in the CFD simulation. T and p were
                                                                       measured at that point, [H2 O] was calculated from the mea-
                                                                       sured RH, and the flow rate was calculated from the dilution
                                                                       ratio of the PTD with the aid of measured CO2 concentra-
                                                                       tions.
                                                                          The temperature of the raw sample was 243 ◦ C and the
                                                                       mole fraction of H2 O (xw ) was 0.036, on average. The tem-
                                                                       perature before the PTD was lower than the heater tem-
                                                                       perature, 350 ◦ C, because the sample cooled in the sam-
                                                                       pling lines, but the temperature of 243 ◦ C corresponds
                                                                       well with the temperature of real exhaust when released
                                                                       from the tailpipe. In NTP (normal temperature and pres-
                                                                       sure) conditions, xw = 0.036 corresponds with [H2 O] =
Figure 1. The experimental setup used to generate artificial exhaust   9.0×1017 cm−3 . The mole fractions in real diesel or gasoline
and sample it with a diluting sampling system. The top part of the
                                                                       exhaust range between 0.06 and 0.14, but the values higher
figure represents the artificial raw exhaust generation, which con-
tains mixing and heating H2 SO4 and H2 O vapors evaporated from
                                                                       than 0.036 with this experimental setup were not used be-
liquids. The bottom part of the figure represents the raw exhaust      cause a more humid sample caused the water vapor to con-
sampling system, which consists of a porous tube diluter (PTD), an     dense as liquid water in the sampling lines.
aging chamber, and an ejector diluter. The computational domain of        The temperature of the H2 SO4 evaporator, Tsa , was var-
the CFD simulation is also shown in the figure.                        ied between 85 and 164.5 ◦ C which correspond with the
                                                                       mole fractions (xsa ) between 2.2 × 10⁻⁷ and 1.1 × 10⁻⁵ in
                                                                       the raw sample. In NTP conditions, this range corresponds
because the values differ with respect to different nucleation         with the [H2 SO4 ] values between 5.7 × 1012 cm−3 and 2.8 ×
mechanisms. Another use of the formulation is in improving             1014 cm−3 . These concentrations are higher than concen-
air quality models by using it to model the effect of sulfu-           trations in real vehicle exhaust (typically between 108 and
ric acid-emitting traffic and power generation on the particle         1014 cm−3 ) because particle formation was not observed with
concentration in urban air.                                            the concentrations below 5.7 × 1012 cm−3 . However, with
                                                                       real vehicle exhaust, in the same sampling system used here,
                                                                       particle formation has been observed even with the concen-
2     Laboratory experiments
                                                                       tration of 2.5×109 cm−3 (Arnold et al., 2012), indicating that
Laboratory experiments were designed to enable the exam-               other compounds are involved in the nucleation process.
ination of the effects of three parameters ([H2 SO4 ], [H2 O],            The determination of [H2 SO4 ] in the raw sample in our
and T ) on the H2 SO4 –H2 O nucleation rate. The experimen-            experiment was not straightforward due to the uncertain-
tal setup is presented in Fig. 1.                                      ties involved in the measurement of [H2 SO4 ]. The de-
                                                                       tailed information on measuring it, using a nitrate-ion-based
2.1    Artificial raw exhaust generation                               (NO− 3 -based) chemical ionization atmospheric pressure in-
                                                                       terface time-of-flight mass spectrometer (CI-APi-TOF; Joki-
The artificial raw exhaust sample was generated (the top part          nen et al., 2012) and ion chromatography (IC; Sulonen et al.,
of Fig. 1) by evaporating 98 % H2 SO4 liquid and deionized             2015), is described in the Supplement. Estimating [H2 SO4 ]

Atmos. Chem. Phys., 19, 6367–6388, 2019                                                 www.atmos-chem-phys.net/19/6367/2019/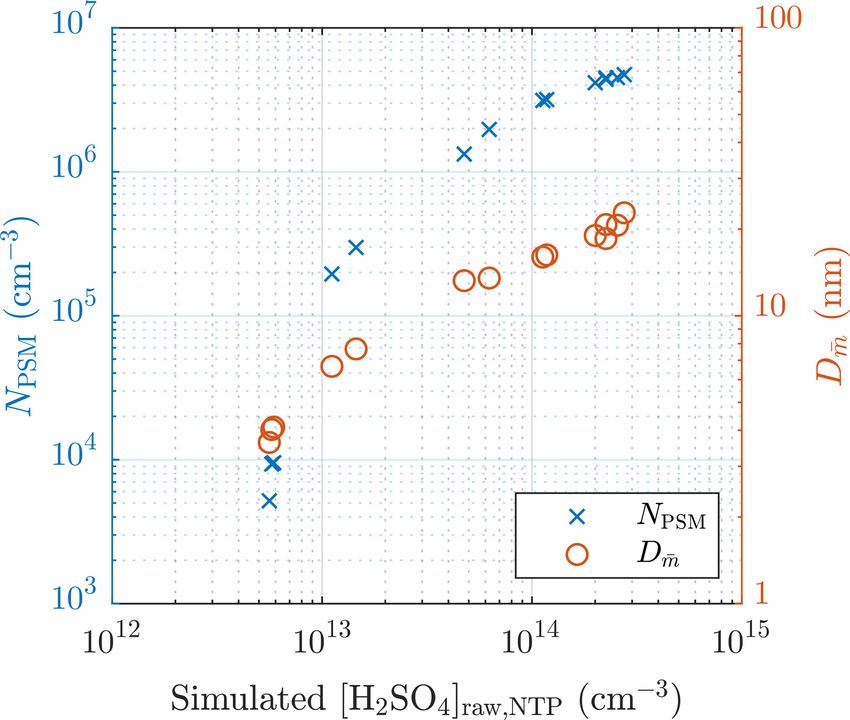
M. Olin et al.: H2 SO4 −H2 O nucleation rate in exhaust-related conditions                                                 6371

theoretically through the saturation vapor pressure in the        the conditions of the outdoor air acting in a dilution process
temperature of Tsa provides some information on the depen-        in a real-world driving situation. The range of TPTD repre-
dency of [H2 SO4 ] on Tsa in the raw sample. However, the         sents higher temperatures compared to the temperature of the
absolute concentrations cannot be satisfactorily estimated,       outdoor air, but lower temperatures were not used because
firstly because diffusional losses of H2 SO4 onto the sam-        27.5 ◦ C was the coldest temperature available with the labo-
pling lines between the H2 SO4 evaporator and the PTD are         ratory setup with no cooling device.
high and uncertain and secondly because measuring H2 SO4             In this experiment, the residence time in the aging cham-
is generally a challenging task due to high diffusional losses    ber was made adjustable by a movable sampling probe inside
onto the walls of the sampling lines between the measure-         the aging chamber. The sampling probe was connected to the
ment point and the measurement device. High diffusional           ejector diluter with a flexible Tygon hose. The residence time
losses are caused by a high diffusion coefficient of H2 SO4 .     from before the PTD to after the ejector diluter was altered
Additionally, a low flow rate from the H2 SO4 evaporator          within a range of 1.4–2.8 s. Using a movable probe to alter
(0.5 slpm) increases the diffusional losses before the mea-       the residence time has only a minor effect on the flow and
surement point. The diffusional losses before the measure-        temperature fields compared to altering the residence time
ment point, according to the equations reported by Gormley        with changing the flow rate in the aging chamber. Maintain-
and Kennedy (1948) and to the humidity-dependent diffusion        ing constant flow and temperature fields when studying the
coefficient of H2 SO4 reported by Hanson and Eisele (2000),       effect of the residence time is important because variable
are 98 % if the walls of the sampling lines are assumed to        fields would alter the turbulence level and temperatures in
be fully condensing. However, some parts in the sampling          the aging chamber, both having effects on the measured par-
lines have high concentrations of H2 SO4 with high tempera-       ticle concentration and thus causing difficulties in separating
tures, especially with high Tsa values. Therefore, these lines    the effect of the residence time from the effect of turbulence
are probably partially saturated with H2 SO4 , which can act      or temperature on measured particle concentrations.
to prevent H2 SO4 condensation onto the walls. Thus, the ac-         The dilution ratio of the PTD was controlled by the ex-
tual diffusional losses are estimated to be between 0 % and       cess flow rate after the aging chamber and calculated by the
98 %, and they can also depend on Tsa and on the saturation       measured [CO2 ] before the PTD and after the aging chamber.
status of the sampling lines during a previous measurement        The dilution ratio was kept at around 20 in all measurements.
point. In conclusion, the determination of [H2 SO4 ] in the raw   The dilution ratio of the ejector diluter was controlled by the
sample was done through inverse modeling using measured           pressure of the dilution air used with the diluter and calcu-
particle diameter information (see Sect. 4.5). The output of      lated also using CO2 measurements. The calculated dilution
the concentrations from inverse modeling denotes the diffu-       ratio was around 10. Because the dilution ratios varied be-
sional losses of 43 %–95 % depending on Tsa .                     tween different measurement points, all the aerosol results
                                                                  are multiplied by the total dilution ratio, thus making the re-
2.2   Raw exhaust sampling system                                 sults comparable.

The sampling system used to dilute and cool the raw exhaust,      2.3   Particle measurement
presented in the bottom part of Fig. 1, was a modified partial
flow sampling system (Ntziachristos et al., 2004) mimicking       Particle number concentration and size distribution were
the dilution process occurring in a real-world driving situa-     measured after the ejector diluter using Airmodus PSM
tion. It consists of a PTD, an aging chamber, and an ejector      A11 (Airmodus Particle Size Magnifier A10 using Airmodus
diluter. The PTD dilutes and cools the sample rapidly, which      Condensation Particle Counter A20 as the particle counter),
leads to new particle formation. The aging chamber is used        TSI CPC 3775 (Ultrafine Condensation Particle Counter),
to grow the newly formed particles to detectable sizes and to     and TSI Nano-SMPS (Nano Scanning Mobility Particle Sizer
continue the nucleation process. The ejector diluter is used to   using TSI CPC 3776 as the particle counter). The PSM and
stop the particle formation and growth processes and to ob-       the CPC 3775 measure the particle number concentration
tain the conditions of the sample required for measurement        (NPSM and NCPC ) by counting particles with diameters larger
devices.                                                          than ∼ 1.15 nm (PSM) or ∼ 2.15 nm (CPC 3775). The D50 -
   Dilution air used with the PTD and the ejector diluter         cut size (the particle diameter having the detection efficiency
was filtered compressed air. The ejector diluter used only        of 50 %) of the PSM can be altered by adjusting its saturator
dry (RH ≈ 3.6 %) and unheated (T ≈ 20 ◦ C) dilution air, but      flow rate within the diameter range of 1.3–3.1 nm. Addition-
the dilution air for the PTD was humidified (RHPTD = 2 %–         ally, the CPC 3775 has the D50 -cut size of 4.0 nm, and the
100 %) and heated (TPTD = 27.5–70 ◦ C). Humidifying the           CPC 3776 has the D50 -cut size of 3.4 nm. The detection ef-
dilution air of the PTD was done by directing the compressed      ficiency curves of the particle counters used are presented in
air flow through a container filled with deionized Milli-Q wa-    Fig. 2. The Nano-SMPS measured, with the settings used in
ter. RHPTD and TPTD are the variable parameters used in ex-       this experiment, the particle size distribution within the di-
amining the effect of [H2 O] and T on J , which represent         ameter range of 2–65 nm; however, particles with diameters

www.atmos-chem-phys.net/19/6367/2019/                                              Atmos. Chem. Phys., 19, 6367–6388, 2019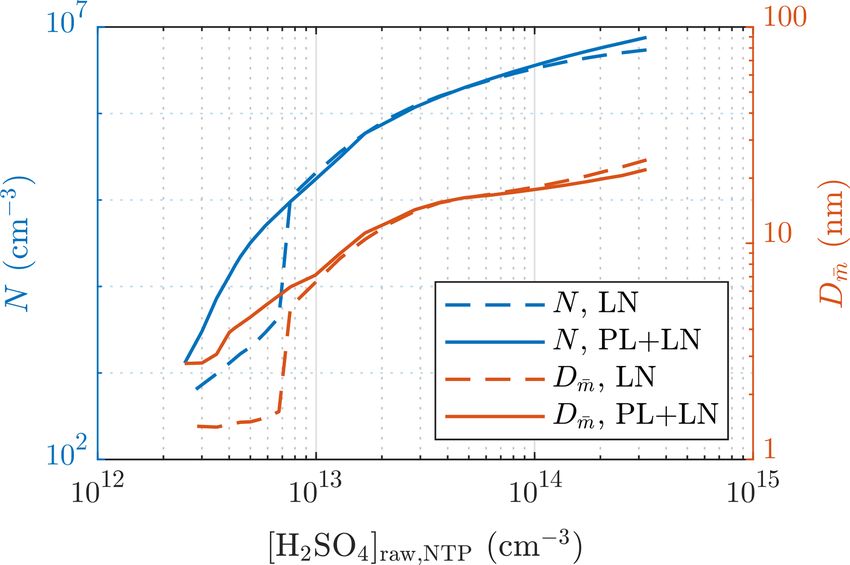
6372                                                 M. Olin et al.: H2 SO4 −H2 O nucleation rate in exhaust-related conditions

                                                                       Figure 3. The dilution ratio of the bridge diluter with different par-
Figure 2. The detection efficiencies of the PSM, with five different
                                                                       ticle diameters.
saturator flow rates used in this experiment, and of the condensa-
tion particle counters (CPCs). The curves are exponential fittings
based on the detection efficiencies reported by the manufacturers of
                                                                       was also varied to provide some validation for the obtained
the devices, excluding the CPC 3776 curve, which is based on the
efficiency measured by Mordas et al. (2008).
                                                                       exponents. [H2 O] and T of the dilution air were varied sim-
                                                                       ply by humidifying and heating the dilution air flowing to the
                                                                       PTD and measuring RH and T from the dilution air. Varying
                                                                       [H2 SO4 ] of the raw sample was done by varying Tsa , and the
smaller than ∼ 6 nm are weakly detectable due to very low
                                                                       values for [H2 SO4 ] in the raw sample were obtained through
charging efficiency of the radioactive charger, low detection
                                                                       inverse modeling.
efficiency of the particle counter, and high diffusional losses
                                                                          The varied conditions of the measurements are presented
inside the device for very small particles. Nevertheless, using
                                                                       in Table 1, where all the measurement points are divided ac-
the data from the different saturator flow rates of the PSM to-
                                                                       cording to the main outputs (nsa , nw , msa , and ∂J /∂t) that
gether with the data from the CPC 3775, information on the
                                                                       measurement sets were designed to provide. Examining the
particle size distribution around the range of 1.15–6 nm is
                                                                       effect of temperature (msa ) was performed with the measure-
also obtained.
                                                                       ments of two types: varying TPTD while keeping RHPTD as
   Due to particle number concentrations that are too high for
                                                                       a constant (set 3a) and varying TPTD while keeping the mole
the PSM, aerosol measured with the PSM and the CPC 3775
                                                                       fraction of H2 O in the dilution air of the PTD (xw,PTD ) as a
was diluted with a bridge diluter. It dilutes the concentration
                                                                       constant (set 3b). The time dependence of the nucleation rate
of larger particles (Dp > 10 nm) with the ratio of 250, but the
                                                                       (∂J /∂t) or, in the other words, the diminishment rate of J in
dilution ratio increases with decreasing particle size due to
                                                                       a diluting sampling system, is mainly the product of the ex-
diffusional losses to the ratio of 1200 (Dp = 1.15 nm) finally.
                                                                       ponents nsa and msa in the following way: [H2 SO4 ] decreases
The dilution ratio was measured with aerosol samples with
                                                                       steeply due to dilution, losses to walls, and condensation to
the count median diameters (CMDs) of 2–25 nm. The ratio
                                                                       particles, resulting in diminishing J with the power of nsa ; si-
of the sampling line length and the flow rate of the bridge
                                                                       multaneously, T decreases due to dilution and cooling of the
diluter, a partially unknown variable, used in the diffusional
                                                                       sampling lines, resulting in strengthening J with the power
losses function reported by Gormley and Kennedy (1948),
                                                                       of msa . Examining the diminishment rate provides validation
was fitted to correspond with the dilution ratio measurement
                                                                       for the relation of nsa and msa obtained from the simulations.
results; the obtained dilution ratios are presented in Fig. 3.
                                                                       We waited 2–40 min for the particle size distributions to sta-
2.4    Measurement sets                                                bilize after the conditions were changed between the mea-
                                                                       surement points. When the particle formation process was
By varying [H2 SO4 ] of the artificial raw exhaust sample and          satisfactorily stabilized, measurement data for each measure-
[H2 O] and T of the dilution air separately and measuring the          ment point were recorded for 5–40 min, depending on the
aerosol formed in the sampling system, the effects of the pa-          stability of the particle generation.
rameters on J can be examined. The effects of the parameters
are included in Eq. (2) simply, with the exponents nsa , nw ,
and msa . To obtain these three yet unknown values, at least
three parameters were required to be varied in the experi-
ments. Nevertheless, a fourth parameter, the residence time,

Atmos. Chem. Phys., 19, 6367–6388, 2019                                                   www.atmos-chem-phys.net/19/6367/2019/
M. Olin et al.: H2 SO4 −H2 O nucleation rate in exhaust-related conditions 6373
Table 1. The varied conditions of the measurement points.
Set Main output Tsa (◦ C) TPTD (◦ C) xw,PTD (10−3 ) RHPTD (%) Residence time (s)
1 nsa 85–164.5 27.5 7.7 22 2.8
2 nw 150 30 0.7–42 2–100 2.8
3a msa 150 30–70 9–65 22 2.8
3b msa 150 30–70 44 22–100 2.8
4 ∂J /∂t 135.5–164.5 27.5 7.7 22 1.4–2.8
3 Experimental results
Figure 4 represents examples of particle size distributions
measured with different H2 SO4 evaporator temperatures, Tsa .
The PSM+CPC data are calculated using the number con-
centrations measured with different saturator flow rates of
the PSM and with the CPC 3775, i.e., with different D50 -cut
sizes. To properly compare the data measured with different
dilution ratios and sampling line lengths, the comparison re-
quires backwards-corrected data; i.e., all data in the figure are
corrected with the dilution ratio of the bridge diluter and with
the diffusional losses caused by the sampling lines between
the ejector diluter and the measurement devices. However,
correcting the distributions backwards from the measured
data to the distributions after the ejector diluter is not sim-
ple because it requires the shapes of the distributions within
the whole diameter range to be known. The data of the PSM
and the CPC 3775 cannot always provide real size distribu-
tions because the cumulative nature of the method using par-
ticle counters as the size distribution measurement can suffer
from noise in the measured concentration. For example, the
PSM+CPC data with Tsa = 157.2 ◦ C shown in Fig. 4 imply
that the concentration could increase with decreasing particle
size, but the placing of the data points can be caused by the
noise in the measured concentrations. On the other hand, the
data imply that there are no particles smaller than ∼ 2.5 nm
in diameter, but the data of the smaller particles can be in- Figure 4. Examples of particle size distributions after the ejector
visible due to the noise in the measured concentrations (see diluter, measured with different H2 SO4 evaporator temperatures in
the Supplement for the detailed uncertainty estimation of the measurement set 1. The data are corrected with the dilution ratio
size distributions). Hence, the unknown concentration of the of the bridge diluter and with the diffusional losses in the sampling
particles smaller than ∼ 2.5 nm in diameter can have a signif- lines after the ejector diluter. The concentrations are multiplied by
icant effect on the total number concentration after the ejec- the total dilution ratio of the sampling system. See the Supplement
tor diluter calculated from the measured data because these for error bars.
particles play the major role in the effect of the diffusional
losses in the sampling lines and in the bridge diluter. Due
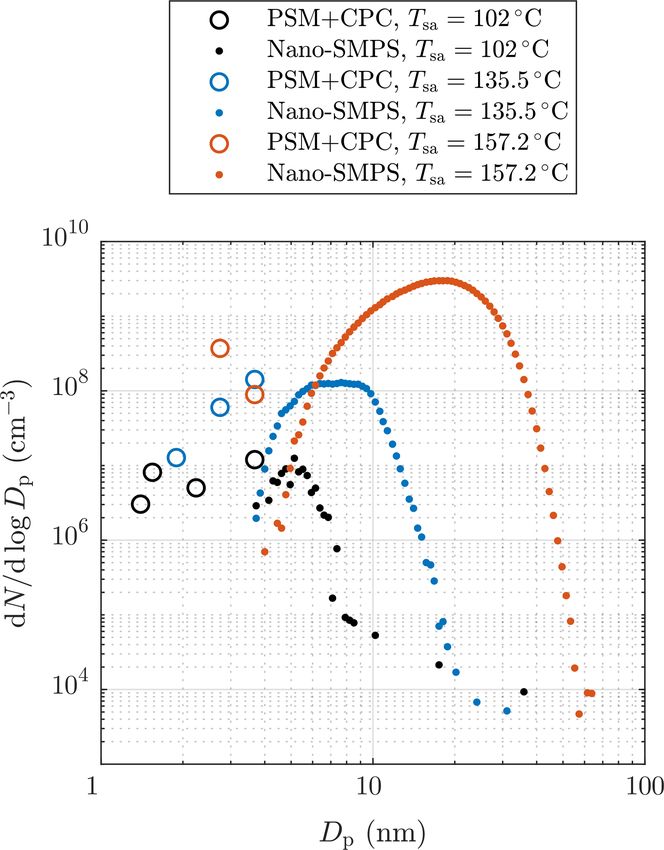
to these uncertainties, the backwards-corrected data (denot- It can be observed that, though the Nano-SMPS data are
ing the distributions right after the ejector diluter) are not in a nearly log-normal form, there are also size distributions
used when comparing the measured results with the simu- in the PSM+CPC diameter range. Particles generated with
lated results later in this paper. Nevertheless, the backwards- lower Tsa are lower in concentration and smaller than ones
corrected data are used when presenting the distributions with higher Tsa ; also a higher fraction of particles are in the
from all the aerosol devices together because the distribu- PSM+CPC diameter range with lower Tsa . The smaller diam-
tions cannot be presented without correcting them backwards eter edges of the log-normal size distributions measured by
due to different particle losses in the sampling lines of the the Nano-SMPS do not connect with the distributions mea-
different devices. sured by the PSM and the CPC 3775 due to the weak de-
tection efficiency of very small particles by the Nano-SMPS.
www.atmos-chem-phys.net/19/6367/2019/ Atmos. Chem. Phys., 19, 6367–6388, 20196374 M. Olin et al.: H2 SO4 −H2 O nucleation rate in exhaust-related conditions
Thus, the smaller diameter edges of the measured log-normal
size distributions are not accurate. Similar disagreements of
the data from these devices have also been observed else-
where, both in exhaust-related (Alanen et al., 2015; Rönkkö
et al., 2017) and in atmospherically related studies (Kulmala
et al., 2013). By examining the combination of the size dis-
tributions measured by the PSM and the CPC 3775 and the
size distributions measured by the Nano-SMPS, the real size
distributions are not in a log-normal form. The detailed un-
certainty estimation of the measured distributions and discus-
sion on this disagreement can be found in the Supplement.
The particle number concentrations measured with the
highest saturator flow rate of the PSM (NPSM ), i.e., the par-
ticles with diameters larger than ∼ 1.3 nm, and the diame-
ters with the average mass (Dm ) of measurement set 1 are
presented in Fig. 5. Dm values are calculated using the size
distributions measured with the combination of the PSM, the
CPC 3775, and the Nano-SMPS, which are corrected with
the diffusional losses in the sampling lines. Fig. 5 consists Figure 5. The measured number concentrations of the particles
of data measured on two different days. It can be observed larger than ∼ 1.3 nm and the diameters with the average mass of
that NPSM increases steeply with increasing [H2 SO4 ]raw with measurement set 1 as a function of the simulated H2 SO4 concen-
lower [H2 SO4 ]raw values, but the steepness decreases with an tration in the raw sample. The particle number concentrations are
increasing [H2 SO4 ]raw due to an increasing self-coagulation multiplied by the total dilution ratio of the sampling system. The
rate. With lower [H2 SO4 ]raw values, the slope of NPSM ver- error bars for these values are shown later, in Fig. 13. The H2 SO4
concentrations are presented as the concentrations in NTP (normal
sus [H2 SO4 ]raw in a log–log scale,
temperature and pressure) conditions rather than in a hot raw sam-
∂ ln NPSM ple.
nNPSM vs. [H2 SO4 ]raw = , (3)
∂ ln [H2 SO4 ]raw
is approximately 10 but decreases to approximately 0.4 with is roughly between 0.1 and 0.2. The slope nNPSM vs. RHPTD
decreasing [H2 SO4 ]raw . The slope of J versus [H2 SO4 ] is, nearly equals the slope of NPSM versus [H2 O]PTD
by the definition of J (Eq. 2), (nNPSM vs. [H2 O]PTD ) because TPTD is nearly a constant. The
slope nNPSM vs. [H2 O]PTD corresponds with the slope nw , with
∂ ln J the same uncertainties as those involved with the slopes
nJ vs. [H2 SO4 ] = = nsa , (4)
∂ ln [H2 SO4 ] nNPSM vs. [H2 SO4 ]raw and nsa . Nevertheless, the effect of de-
which is also the nucleation exponent for [H2 SO4 ]. The slope creased particle detection is not involved because, in this
nNPSM vs. [H2 SO4 ]raw can provide a rough estimate of the slope case, particle size has only a weak dependency on RHPTD .
nsa , but due to the other aerosol processes, especially co- Additional uncertainty in estimating nw arises from the ori-
agulation, having effects on the particle concentrations, the gin of H2 O vapor in the system, which is both the dilution air
estimated slope can differ a lot from the real nsa in the nu- and the raw sample. Because [H2 O] in the raw sample was
cleation rate function. The slope at higher [H2 SO4 ]raw val- kept constant, it has a higher effect on the total [H2 O] with
ues is usually decreased due to coagulation, and the slope at lower values of RHPTD ; thus, the estimated nw is lower than
lower [H2 SO4 ]raw values can be increased due to decreased the real nw in the nucleation rate function.
particle detection efficiency of smaller particles. Therefore, The effect of TPTD can be observed in Figs. 6 and 7. Lower
nsa is expected to be within the range of 0.4–10. Addition- temperatures result in higher concentrations of NPSM . How-
ally, the estimated slope can also differ from nsa because ever, the examination is problematic because keeping RHPTD
nNPSM vs. [H2 SO4 ]raw is based on [H2 SO4 ] in the raw sam- as a constant while increasing TPTD (set 3a) increases [H2 O],
ple rather than the value of [H2 SO4 ] in a specific location: which results in lower NPSM with lower temperatures. There-
[H2 SO4 ] decreases from the concentration in the raw sample fore, keeping xw,PTD as a constant (set 3b) is better for ex-
by several orders of magnitude during the dilution process. amining msa . One of the measurements with TPTD = 50 ◦ C
The effect of humidity on the particle concentration (set is, however, a significant outlier in set 3b. Estimating the ex-
2) is shown in Fig. 6. The slope of NPSM versus RHPTD in a ponent msa from the slope in Fig. 7 is not straightforward
log–log scale, because temperature is also included in the concentrations
with exponents that are still unknown.
∂ ln NPSM
nNPSM vs. RHPTD = , (5)
∂ ln RHPTD
Atmos. Chem. Phys., 19, 6367–6388, 2019 www.atmos-chem-phys.net/19/6367/2019/M. Olin et al.: H2 SO4 −H2 O nucleation rate in exhaust-related conditions 6375
Table 2. The ratios of the measured number concentrations and
mass concentrations with the residence times of 1.4 and 2.8 s, in
measurement set 4. The values are corrected with the dilution ratio
of the bridge diluter and with the diffusional losses in the sampling
lines after the ejector diluter; thus, the values correspond with the
distributions existing after the ejector diluter.
N(1.4 s) M(1.4 s)
Tsa (◦ C) N(2.8 s) M(2.8 s)
135.5 0.74 0.28
150 1.29 0.92
160 1.72 0.96
164.5 1.74 1.10
temperatures. The ratio below unity signifies that the nucle-
ation process is still not diminished at the time of 1.4 s; e.g.,
the ratio of 0.74 denoting 74 % of particles is formed within
Figure 6. The measured number concentrations of the particles the time range of 0–1.4 s, and the remaining 26 % is formed
larger than ∼ 1.3 nm of measurement set 2 as a function of the RH within the time range of 1.4–2.8 s. With higher temperatures,
of the PTD dilution air. The concentrations are multiplied by the to- the ratio is above unity because self-coagulation begins to de-
tal dilution ratio of the sampling system. The error bars representing crease the number concentration, especially at the later times
the standard uncertainties of the measured concentrations are within
where the number concentration is the highest. The nucle-
the marker sizes.
ation process may continue after 1.4 s, but it cannot be easily
seen with higher temperatures. Because coagulation has no
effect on the mass concentrations (M), the ratios of M mea-
sured with the combination of the PSM, the CPC 3775, and
the Nano-SMPS with the residence time of 1.4 s and with the
residence time of 2.8 s are near unity with higher tempera-
tures. The effects of particle growth and wall losses, however,
have effects on the ratios, too. The temperature with which
the coagulation process would eliminate the effect of the nu-
cleation process, resulting in the number concentration ratio
of unity, is near 142 ◦ C.
4 Simulations
Every measurement point presented in Table 1 was simu-
lated with the model consisting of four phases: (1) the CFD
simulations for solving the flow and the temperature field of
the sampling system, (2) the CFD-TUTMAM simulations for
solving the aerosol processes in the sampling system, (3) cor-
recting the particle sizes decreasing rapidly in the dry ejector
diluter, and (4) calculating the penetration of the particles due
Figure 7. The measured number concentrations of the particles
larger than ∼ 1.3 nm of measurement set 3 as a function of the T to diffusional losses in the sampling lines after the sampling
of the PTD dilution air. The concentrations are multiplied by the to- system and the detection efficiencies of the particle counting
tal dilution ratio of the sampling system. The error bars representing devices.
the standard uncertainties of the measured concentrations are within
the marker sizes. 4.1 CFD model
The CFD simulations to solve the flow and the temperature
The effect of the residence time on the particle concentra- fields for every simulation case were performed with a com-
tions is presented in Table 2. With Tsa = 135.5 ◦ C, the ratio mercially available software, ANSYS Fluent 17.2. It is based
of N with the residence times of 1.4 s and with the residence on a finite volume method in which the computational do-
time of 2.8 s is below unity, but it is above unity with higher main is divided into a finite amount of cells. Governing equa-
www.atmos-chem-phys.net/19/6367/2019/ Atmos. Chem. Phys., 19, 6367–6388, 20196376 M. Olin et al.: H2 SO4 −H2 O nucleation rate in exhaust-related conditions
tions of the flow are solved in every computational cell iter- 4.2 CFD-TUTMAM
atively until sufficient convergence is reached. In this study,
the governing equations in the first phase are continuity, mo- The main functionality of the CFD-TUTMAM based on the
mentum, energy, radiation, and turbulence transport equa- previous aerosol model, CFD-TUTEAM, is described by
tions. Olin et al. (2015). However, because the measured distri-
The computational domain in the CFD simulations is an butions are not in a log-normal form, the inclusion of the
axial symmetric geometry consisting of the PTD, the aging PL+LN model (Olin et al., 2016) was beneficial. The PL+LN
chamber, and the ejector diluter (Fig. 1). An axial symmet- model simulates the initial growth of newly formed very
ric geometry was selected over a three-dimensional geometry small particles by modeling the particle size distribution with
due to high computational demand of the model and a nearly the combination of a power law (PL) and a log-normal (LN)
axial symmetric profile of the real measurement setup. The distribution. Newly formed particles are first put to the PL
domain was divided into ∼ 8 × 10⁵ computational cells, of distribution, after which they are transferred to the LN distri-
which the major part was located inside the PTD, where the bution by particle growth.
smallest cells are needed due to the highest gradients. The The CFD-TUTMAM adds three governing equations per
smallest cells were 20 µm in side lengths and were located distribution (denoted by j ) to the CFD model using a modal
in the beginning of the porous section, where the hot exhaust representation of the particle size distribution; i.e., the distri-
and the cold dilution air meet. butions are modeled by three variables: number (Mj,0 = Nj ),
In contrast to our previous study (Olin et al., 2015), the surface-area-related (Mj,2/3 ), and mass (Mj,1 ) moment con-
ejector diluter was also included in the computational do- centrations. Mj,1 values are further divided into different
main, though it has only a minor effect on nucleation (Lyyrä- components in a multi-component system. Due to small par-
nen et al., 2004; Giechaskiel et al., 2009). Because the ejector ticle size and low particle loading, the aerosol phase has only
diluter has a high speed nozzle that cools the flow locally to a minor effect on the gas phase properties. Therefore, conti-
near −30 ◦ C, including it in the domain provides partial val- nuity, momentum, energy, radiation, and turbulence transport
idation for msa in the following way: if too high a value for equations can be excluded from the computation after the
msa were used, nucleation would be observed in the ejector flow and temperature fields are solved, and only gas species
diluter, in contrast to the former studies. The internal fluid equations and the aerosol model equations are solved. The
inside the sampling lines is modeled as a mixture of air, H2 O governing equation of the aerosol model for the concentra-
vapor, and H2 SO4 vapor. The sampling lines are modeled as tion of a kth moment of a distribution j is
solid zones of steel or Tygon, and 10 cm of the external fluid,
modeled as air, is also included in the domain to simulate
natural cooling of the sampling lines. ∂Mj,k Mj,k
= − ∇ · (Mj,k u) + ∇ · ρf D j,k,eff ∇
Flow rate and temperature boundary conditions for the ∂t ρf
simulated sampling system were set for the each simula- +nuclj,k + condj,k + coagj,k + transferj,k , (6)
tion case to the measured values. Due to steady-state con-
ditions and high computational demand, all governing equa-
tions were time averaged; thus, the simulations were per- where u, ρf , and D j,k,eff are the fluid velocity vector, the fluid
formed with a steady-state type. Turbulence was modeled us- density, and the kth-moment-weighted average of the particle
ing the SST-k-ω model, which is one of the turbulence mod- effective diffusion coefficient, respectively. The last terms in
els used with a steady-state simulation. It produced the most Eq. (6) represent source terms for nucleation, condensation,
reliable results of the available steady-state turbulence mod- coagulation, and intermodal particle transfer. In this study,
els based on the pressure drop in the porous section. Turbu- aerosol is modeled with two distributions: a PL distribution
lence, however, can play a significant role in the wall losses (j = PL) and an LN distribution (j = LN). In this study, two
of the vapors and the particles in the regions where the tur- gas species equations, which model the internal fluid mixture
bulence level is high. In this sampling system, the turbulence as the mass fractions of H2 O and H2 SO4 , are built in the
level is high in the upstream part of the aging chamber where CFD model, but the opposite numbers of the source terms of
the diameter of the sampling line increases steeply. Validat- nucleation and condensation are added to them to maintain
ing the suitability of the turbulence model for this geome- the mass closure of the species.
try would require a measurement of, for example, solid seed After each iteration step of the CFD-TUTMAM simula-
particle concentrations after and before the sampling system tion, the parameters of the distributions are calculated for
without any aerosol processes, such as nucleation, conden- every computational cell by using three moment concentra-
sation, and coagulation. However, that kind of measurement tions. The parameters for the PL distribution are the number
has not been performed yet. concentration (NPL ), the slope parameter (α), and the largest
diameter (D2 ). The smallest diameter (D1 ) has a fixed value
of 1.15 nm, which is the smallest detectable particle diam-
eter with the devices used. The density function for the PL
Atmos. Chem. Phys., 19, 6367–6388, 2019 www.atmos-chem-phys.net/19/6367/2019/M. Olin et al.: H2 SO4 −H2 O nucleation rate in exhaust-related conditions 6377
distribution is transfer factor γ of the PL+LN model described in Olin et al.
( α
D
(2016), a function of α, D1 /D2 , and k is used in the CFD-
dN NPL Dp2 β0 , D1 ≤ Dp ≤ D2 TUTMAM due to more complex particle growth modeling.
= , (7)
d ln Dp PL 0, otherwise The function used here is
where β0 is a function
α+l
(
, α 6 = −l D1 0.1α + 0.5, α ≥ 0
D1
1− D1 α+l
γ α, ,k =
βl α, =
D2
. (8) D2 0, α6378 M. Olin et al.: H2 SO4 −H2 O nucleation rate in exhaust-related conditions
4.3 Dry particle model
The main trend of the RH inside the sampling system is an
increasing trend due to decreasing temperature. This results
in an increasing water uptake rate during the particle growth
process, which can be modeled by the condensation rate of
H2 O that is simply the condensation rate of H2 SO4 multi-
plied by a suitable factor (the water equilibrium procedure
described by Olin et al., 2015). However, when the sam-
ple enters the ejector diluter, the RH decreases rapidly due
to dry dilution air, but the growth process by the conden-
sation of H2 SO4 still continues. This results in an increas-
ing H2 SO4 amount in the particles but a rapidly decreasing
H2 O amount, which cannot be modeled with the water up-
take model. Hence, the particles after the ejector diluter sim-
ulated by the CFD-TUTMAM contain incorrectly too much
water. Figure 8. Examples of particle diameters in different humidities in
All the simulated particle size distributions outputted by the temperature of 23 ◦ C. The lowest RH value represents the RH
of the dilution air of the ejector diluter.
the CFD-TUTMAM were corrected to correspond with the
water amount that would be in the conditions after the ejec-
tor diluter (T ≈ 23◦ C and RH ≈ 3.6 %). These conditions are
mainly caused by the conditions of compressed air directed 4.5 Inverse modeling
to the ejector diluter. Additionally, the particle size mea-
surement device (Nano-SMPS) used room air, having nearly The simulated number concentrations measurable by the
equal conditions as compressed air, as the sheath flow air. PSM with different saturator flow rates and by the CPC 3775
Dry sheath flow air also dries particles rapidly inside the de- and the simulated size distributions measurable by the Nano-
vice. The theory behind the dry particle model is the same SMPS were compared with the measured ones during inverse
as the theory behind the water uptake model in the CFD- modeling. The exponents nsa , nw , and msa were altered until
TUTMAM, but the drying process is significantly faster and the simulated and the measured variables corresponded sat-
in the opposite direction, in contrast to the water uptake isfactorily in all simulated cases. The proportionality coeffi-
connected to the condensation rate of H2 SO4 in the CFD- cient k in Eq. (2) is unknown and depends on the exponents.
TUTMAM. Figure 8 represents examples of particle diame- Because the value of k affects the nucleation rate magnitude
ters in different humidities; e.g., a particle with the diameter directly, it was obtained by fitting until the simulated and the
of 40 nm in the RH of 60 % shrinks to the diameter of 30 nm measured number concentrations corresponded.
when sampled with the ejector diluter. Due to the uncertainties involved in the measurement of
[H2 SO4 ]raw (see the Supplement), the boundary conditions
4.4 Penetration and detection efficiency model for [H2 SO4 ] in the CFD-TUTMAM simulations could not
be set initially. Hence, [H2 SO4 ]raw was also considered to
The particle size distributions outputted by the CFD-
be a fitting parameter. It was estimated by comparing the
TUTMAM and corrected with the dry particle model were
aerosol mass concentrations because it has a direct effect
also corrected according to the penetration and detection ef-
on the particle sizes but also affects J . Inverse modeling
ficiency model. Particle penetration in the sampling lines
of the vapor concentrations is possible due to the conden-
between the ejector diluter and the measurement devices
sational growth of particles. In conclusion, the inverse mod-
was calculated with the equations of Gormley and Kennedy
eling requires fitting all the five parameters (nsa , nw , msa ,
(1948). All the internal diameters of the used sampling lines
k, and [H2 SO4 ]raw ) to obtain the function for J . The first
were large enough to keep the flows laminar to minimize
four parameters were fitted in a way in which they have the
the diffusional losses. The penetration-corrected size distri-
same value for every simulation case, but the last parameter,
butions were multiplied by the detection efficiency curves
[H2 SO4 ]raw , was fitted in every simulation case separately.
presented in Fig. 2 to simulate the measured number con-
In the simulations related to the measurement sets 2–4, Tsa
centrations by the PSM and the CPC 3775 and the measured
was not altered between the measurement points; therefore,
size distribution by the Nano-SMPS.
the value of [H2 SO4 ]raw in the simulations was constant. Be-
cause only one parameter was fitted separately, only one of
the outputs, the aerosol number or mass concentration, could
correspond with the measured value exactly. In this study, the
number concentration was chosen as the main output, where
Atmos. Chem. Phys., 19, 6367–6388, 2019 www.atmos-chem-phys.net/19/6367/2019/M. Olin et al.: H2 SO4 −H2 O nucleation rate in exhaust-related conditions 6379
the correspondence of the number concentration is preferred
over the correspondence of the mass concentration because
the nucleation process is connected more directly to the num-
ber concentration.
The uncertainties involved in modeling turbulence and the
condensation of the vapors onto the walls affect the number
and mass concentrations in the measurement devices. Nev-
ertheless, these uncertainties become partially insignificant
because k and [H2 SO4 ]raw are considered to be fitting pa-
rameters, which partially neglect uncertainly modeled losses
of particles and vapors.
5 Simulation results
In this section, the outputs of the simulations performed us-
ing the nucleation rate function with the best correspondence
between the measured and the simulated data are described
firstly. Finally, the used nucleation rate function is presented.
5.1 Sulfuric acid concentrations Figure 9. Simulated sulfuric acid concentrations in the raw sample
compared to the theoretical concentrations with different sulfuric
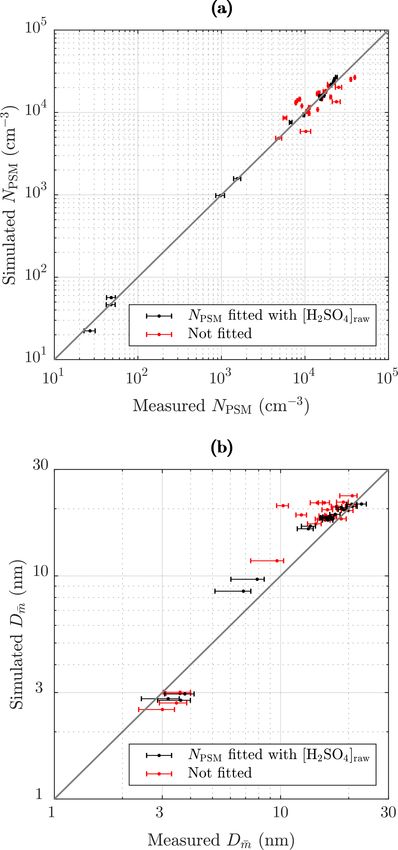
Figure 9 represents the comparison of the inversely modeled acid evaporator temperatures. The concentrations are presented as
[H2 SO4 ]raw with the theoretical concentrations. The simu- the concentrations in NTP (normal temperature and pressure) con-
lated concentrations vary between 0.05 and 0.57 times the ditions rather than in a hot raw sample.
theoretical concentrations, where the lowest values are ob-
served with lower Tsa values, probably due to the effect of
increasingly saturating H2 SO4 liquid onto the sampling lines Figure 10b and d represent examples of measured and
with higher temperatures that can decrease the diffusional simulated Nano-SMPS data. The case with Tsa = 102 ◦ C
losses onto the sampling lines. All values lie between the the- (Fig. 10b) represents an example of one of the worst agree-
oretical level assuming full diffusional losses and the lossless ments of measured and simulated size distributions. While
theoretical level. A weak agreement of the simulated con- the simulated total number concentration agrees with the
centrations with 0.15 times the theoretical curve can be seen, measured one in that case, the particle diameter is underes-
which implies the diffusional losses of 85 % onto the sam- timated with the factor of ∼ 1.6. The disagreement is dis-
pling lines between the H2 SO4 evaporator and the PTD. Re- cussed later in this section. Conversely, in the case with
sults and involved challenges of the additional [H2 SO4 ]raw Tsa = 157.2 ◦ C (Fig. 10d), the distributions agree well, ex-
measurements are presented in the Supplement. cept that the model predicts higher particle concentration in
the diameter range of 2.5–7 nm. This disagreement can be
5.2 Particle size distributions due to lower particle detection efficiency of the Nano-SMPS
than that included in the inversion algorithm of the device
Examples of measured and simulated particle concentrations (see the Supplement). This is not included in the penetra-
and size distributions of measurement set 1 are presented in tion and detection efficiency model and is thus not seen in
Fig. 10. Figure 10a and c represent the concentrations mea- the simulated distributions. Because the detection efficiency
sured or measurable with the PSM and the CPC 3775. Be- curve of the CPC 3776 is included in the model, the simu-
cause the concentrations decrease with an increasing cut di- lated size distributions measurable with the Nano-SMPS de-
ameter in the case with Tsa = 102◦ C (Fig. 10a), particle size crease steeply with a decreasing particle diameter near the
distribution exists within this diameter range, which is also particle diameter of D50 = 3.4 nm. The sharp peak at the di-
seen in the simulated data. However, the concentration mea- ameter of ∼ 20 nm in the simulated distribution in Fig. 10d is
sured with the cut diameter of 3.1 nm is twofold compared caused by the nature of the PL+LN model where the PL dis-
to the simulated one, implying that the real distribution is tribution ends at the diameter of D2 ≈ 20 nm. While Fig. 10
not a pure PL+LN distribution or that the shape of the dis- represents the data at the measurement devices, Fig. 11 repre-
tribution is modeled incorrectly near the diameter of 3.1 nm. sents the example distributions after the ejector diluter. From
Conversely, in the case with Tsa = 157.2◦ C (Fig. 10c), the the latter figure, the PL distribution is seen as a whole, start-
concentrations are in the same level, which implies no size ing from the diameter of D1 = 1.15 nm.
distribution within that diameter range.
www.atmos-chem-phys.net/19/6367/2019/ Atmos. Chem. Phys., 19, 6367–6388, 2019You can also read