Potential vorticity structure of embedded convection in a warm conveyor belt and its relevance for large-scale dynamics - WCD
←
→
Page content transcription
If your browser does not render page correctly, please read the page content below
Weather Clim. Dynam., 1, 127–153, 2020
https://doi.org/10.5194/wcd-1-127-2020
© Author(s) 2020. This work is distributed under
the Creative Commons Attribution 4.0 License.

Potential vorticity structure of embedded convection in a warm
conveyor belt and its relevance for large-scale dynamics
Annika Oertel, Maxi Boettcher, Hanna Joos, Michael Sprenger, and Heini Wernli
Institute for Atmospheric and Climate Science, ETH Zürich, Zurich, Switzerland

Correspondence: Annika Oertel (annika.oertel@env.ethz.ch)

Received: 28 August 2019 – Discussion started: 3 September 2019
Revised: 19 March 2020 – Accepted: 23 March 2020 – Published: 9 April 2020

Abstract. Warm conveyor belts (WCBs) are important                have weakly positive PV values) in the upper troposphere, in
airstreams in extratropical cyclones. They can influence          agreement with previous studies. In contrast, the convective
large-scale flow evolution by modifying the potential vortic-     WCB trajectories form mesoscale horizontal PV dipoles at
ity (PV) distribution during their cross-isentropic ascent. Al-   upper levels, with one pole reaching negative PV values. On
though WCBs are typically described as slantwise-ascending        a larger scale, these individual mesoscale PV anomalies can
and stratiform-cloud-producing airstreams, recent studies         aggregate to elongated PV dipole bands extending from the
identified convective activity embedded within the large-         convective updraft region, which are associated with coher-
scale WCB cloud band. However, the impacts of this WCB-           ent larger-scale circulation anomalies. An illustrative exam-
embedded convection have not been investigated in detail.         ple of such a convectively generated PV dipole band shows
In this study, we systematically analyze the influence of em-     that within around 10 h the negative PV pole is advected
bedded convection in an eastern North Atlantic WCB on the         closer to the upper-level waveguide, where it strengthens the
cloud and precipitation structure, on the PV distribution, and    isentropic PV gradient and contributes to the formation of
on larger-scale flow. For this reason, we apply online tra-       a jet streak. This suggests that the mesoscale PV anoma-
jectories in a high-resolution convection-permitting simula-      lies produced by embedded convection upstream organize
tion and perform a composite analysis to compare quasi-           and persist for several hours and therefore can influence the
vertically ascending convective WCB trajectories with typ-        synoptic-scale circulation. They thus can be dynamically rel-
ical slantwise-ascending WCB trajectories. We find that the       evant, influence the jet stream and (potentially) the down-
convective WCB ascent leads to substantially stronger sur-        stream flow evolution, which are highly relevant aspects for
face precipitation and the formation of graupel in the middle     medium-range weather forecast. Finally, our results imply
to upper troposphere, which is absent for the slantwise WCB       that a distinction between slantwise and convective WCB tra-
category, indicating the key role of WCB-embedded convec-         jectories is meaningful because the convective WCB trajec-
tion for precipitation extremes. Compared to the slantwise        tories are characterized by distinct properties.
WCB trajectories, the initial equivalent potential temperature
of the convective WCB trajectories is higher, and the con-
vective WCB trajectories originate from a region of larger
potential instability, which gives rise to more intense cloud     1     Introduction
diabatic heating and stronger cross-isentropic ascent. More-
over, the signature of embedded convection is distinctly im-      1.1    Warm conveyor belts and embedded convection
printed in the PV structure. The diabatically generated low-
level positive PV anomalies, associated with a cyclonic circu-    Moist diabatic processes are known to play an important role
lation anomaly, are substantially stronger for the convective     in the evolution of extratropical cyclones and are frequently
WCB trajectories. The slantwise WCB trajectories lead to          associated with rapid cyclogenesis (e.g., Anthes et al., 1983;
the formation of a widespread region of low-PV air (that still    Kuo et al., 1991; Stoelinga, 1996; Wernli et al., 2002) and in-
                                                                  creased forecast error growth (e.g., Davies and Didone, 2013;

Published by Copernicus Publications on behalf of the European Geosciences Union.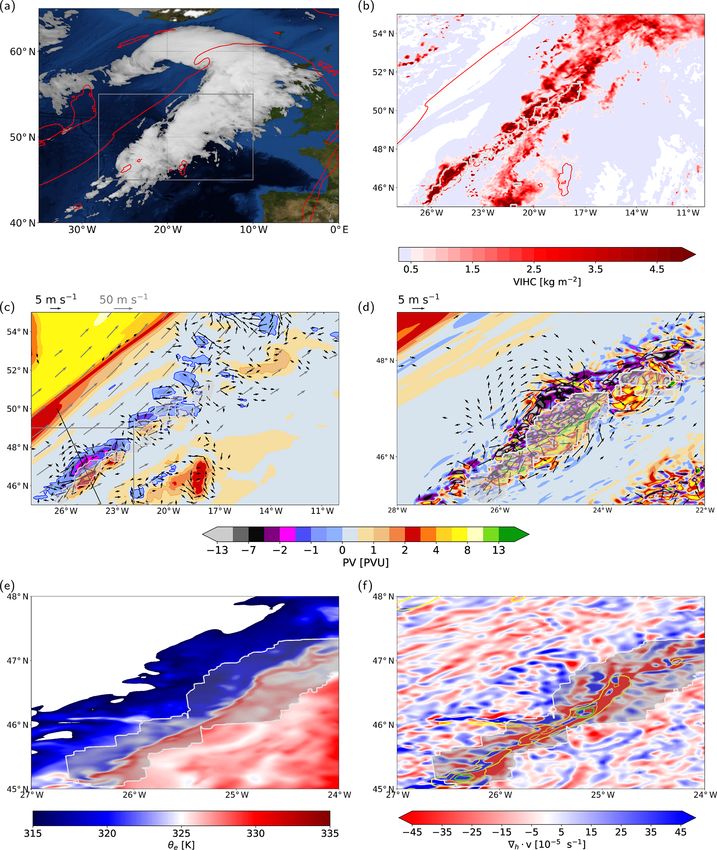
128                                         A. Oertel et al.: PV structure of embedded convection in a warm conveyor belt

Selz and Craig, 2015). Diabatic processes are particularly im-    where PV is defined as (Ertel, 1942)
portant in warm conveyor belts (WCBs), which are coherent,
typically poleward-ascending airstreams associated with ex-              1
                                                                  PV =     ω · ∇θ,                                           (2)
tratropical cyclones (Harrold, 1973; Browning, 1986, 1999;               ρ
Wernli and Davies, 1997). During their typically slantwise
cross-isentropic ascent from the boundary layer ahead of the      and ρ is density, θ is potential temperature, θ̇ represents di-
cold front to the upper troposphere, they form large-scale,       abatic heating or cooling, and ω is 3-D absolute vorticity
mostly stratiform cloud bands and play a key role in the dis-     (ω = ∇ × u + 2 = ξ i + ηj + (f + ζ )k, where u is the 3-D
tribution of surface precipitation (e.g., Browning, 1986; Eck-    wind vector,  is the vector of earth rotation, ξ and η are the
hardt et al., 2004; Madonna et al., 2014; Pfahl et al., 2014;     horizontal vorticity components in the x and y directions,
Flaounas et al., 2018).                                           f is the Coriolis parameter, and f + ζ is the absolute vertical
   Although WCBs are typically described as gradually as-         vorticity).
cending and mainly stratiform-cloud-producing airstreams             For large-scale and predominantly slantwise WCB ascent,
(e.g., Browning, 1986; Madonna et al., 2014), the concept of      it is frequently assumed that the first-order effect of la-
rapid convective motion embedded in the frontal cloud band        tent heating on PV is dominated by the vertical gradient of
of the WCB had already been proposed in 1993 (Neiman              diabatic heating (e.g., Wernli and Davies, 1997; Joos and
et al., 1993). Recent studies have suggested that the WCB         Wernli, 2012; Madonna et al., 2014) resulting in PV gen-
is, at least in some cases, not a homogeneously ascending         eration below and PV destruction above the diabatic heating
airstream: in contrast, the detailed ascent behavior of the       maximum according to Eq. (3):
individual WCB trajectories associated with one extratrop-
                                                                  D      1          ∂ θ̇
ical cyclone can vary substantially (e.g., Martínez-Alvarado         PV ≈ (f + ζ ) · .                                       (3)
et al., 2014; Rasp et al., 2016; Oertel et al., 2019), and con-   Dt     ρ          ∂z
vective activity can be frequently embedded in the large-            These diabatically produced low-level positive and upper-
scale baroclinic region of the WCB. This has been identified,     level negative PV anomalies can lead to cyclone intensifica-
e.g., with various remote-sensing data (Binder, 2016; Cre-        tion (Rossa et al., 2000; Binder et al., 2016) and modify the
spo and Posselt, 2016; Flaounas et al., 2016, 2018), with on-     upper-level flow evolution (e.g., Pomroy and Thorpe, 2000;
line trajectories in convection-permitting simulations (Rasp      Grams et al., 2011; Schäfler and Harnisch, 2015; Joos and
et al., 2016; Oertel et al., 2019), and in coarser simulations    Forbes, 2016; Martínez-Alvarado et al., 2016b).
with parameterized convection (Agustì-Panareda et al., 2005;         PV is frequently considered for synoptic-scale dynam-
Martínez-Alvarado and Plant, 2014).                               ics (e.g., Hoskins et al., 1985; Stoelinga, 1996) but is also
   The strong cloud diabatic processes in both WCBs and           suited for the analysis of mesoscale convective systems (e.g.,
convective systems modify the potential vorticity (PV) dis-       Conzemius and Montgomery, 2009; Shutts, 2017; Clarke
tribution in the lower and upper troposphere and thereby can      et al., 2019) and has already been applied at the scale of
affect the larger-scale dynamics (e.g., Pomroy and Thorpe,        individual convective cells (Chagnon and Gray, 2009; Wei-
2000; Grams et al., 2011; Clarke et al., 2019). Hence,            jenborg et al., 2015, 2017). While for PV modification in
WCBs can be associated with increased forecast uncertainty        synoptic-scale systems the horizontal gradient of diabatic
(Berman and Torn, 2019) and forecast errors (e.g., Martínez-      heating is frequently neglected (as in Eq. 3), this assump-
Alvarado et al., 2016a). Similarly, convective systems can        tion breaks down in the case of intense local diabatic heat-
introduce forecast errors (Clarke et al., 2019) and also en-      ing, such as embedded mesoscale convective updrafts on the
hance the forecast uncertainty (Baumgart et al., 2019). Oc-       scale of a few kilometers. On the mesoscale, the horizontal
casionally, convection and WCBs can be individually related       gradients of θ̇ become relevant and Eq. (3) generalizes to the
to forecast busts (Rodwell et al., 2013; Grams et al., 2018).     full form (Eq. 2), written here as
The specific PV signatures of (i) large-scale WCB ascent and
(ii) smaller-scale convective updrafts and their potential im-

                                                                   D         1           ∂ θ̇
plications for the flow evolution differ substantially and are        PV =       (f + ζ ) + ωh · ∇h θ̇ ,                     (4)
                                                                  Dt         ρ           ∂z
discussed in the following.
                                                                  where ωh denotes the horizontal vorticity (ωh = ξ i + ηj ).
1.2   PV modification by WCBs and convection                      Previous studies showed that the horizontal diabatic heating
                                                                  gradients play a major role in the PV modification in isolated
PV is materially conserved along the flow only in the absence     convective updrafts (e.g., Chagnon and Gray, 2009; Weijen-
of friction and diabatic processes (Hoskins et al., 1985). Ne-    borg et al., 2015, 2017) and in narrow smaller-scale heating
glecting frictional processes, the Lagrangian rate of change      regions embedded in a larger-scale flow (Harvey et al., 2020).
 D
Dt PV can be expressed as                                         The localized diabatic heating in a vertically sheared environ-
D      1                                                          ment generates upper-level horizontal PV dipoles centered
   PV = ω · ∇ θ̇,                                          (1)    around the convective updraft (Fig. 1) and aligned with the
Dt     ρ

Weather Clim. Dynam., 1, 127–153, 2020                                               www.weather-clim-dynam.net/1/127/2020/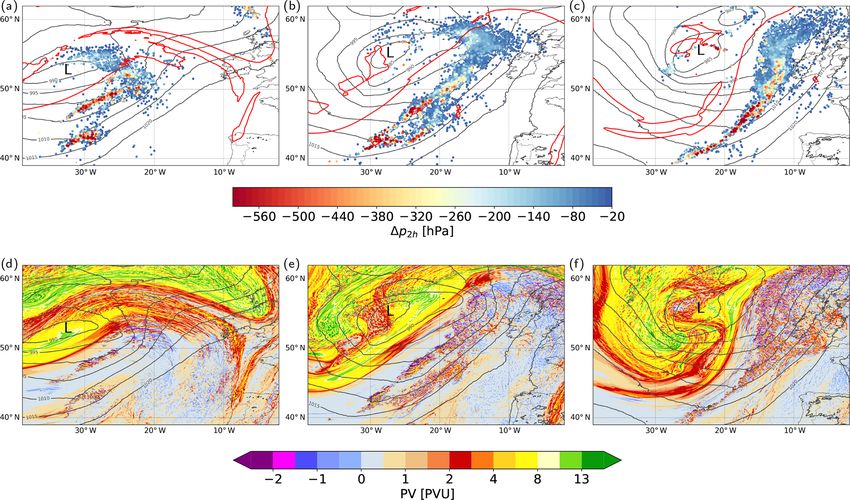
A. Oertel et al.: PV structure of embedded convection in a warm conveyor belt                                                         129

                                                                          tems (Davis and Weisman, 1994; Chagnon and Gray, 2009;
                                                                          Hitchman and Rowe, 2017; Clarke et al., 2019), and in mid-
                                                                          latitude convective updrafts with varying large-scale flow
                                                                          conditions (Weijenborg et al., 2015, 2017). The amplitude
                                                                          of the horizontal PV dipoles can strongly exceed the typi-
                                                                          cal amplitude of synoptic-scale PV. In strong convective up-
                                                                          drafts horizontal PV dipoles of ±10 PVU can be generated
                                                                          (Chagnon and Gray, 2009; Weijenborg et al., 2015, 2017),
                                                                          resulting in regions of absolute negative PV. These regions
                                                                          can be hydrostatically, inertially, or symmetrically unsta-
                                                                          ble (e.g., Hoskins, 2015) and can form mesoscale circula-
                                                                          tions associated with, e.g., frontal rainbands (Bennetts and
                                                                          Hoskins, 1979; Schultz and Schumacher, 1999; Siedersleben
Figure 1. Conceptual model of upper-level PV modification by a
                                                                          and Gohm, 2016), sting jets (Clark et al., 2005; Volonté
convective updraft (+) that is located in an environment with back-
ground horizontal vorticity. Variables are shown as follows: vertical     et al., 2018, 2019), enhanced stratosphere–troposphere ex-
wind shear vector (v z , black) with the cold air on the left, the hor-   change (Rowe and Hitchman, 2015), and local jet acceler-
izontal vorticity vector (ωh , green), the diabatic heating gradients     ations and northward displacements (Rowe and Hitchman,
pointing radially toward the convective updraft (∇h θ̇ , grey), and       2016). The adjustment timescales for the release of these
the regions where PV is destroyed (blue shading) and where PV is          instabilities range from minutes for hydrostatic instability
generated (red shading) because ∇h θ̇ k −ωh and ∇h θ̇ k ωh , respec-      to several hours for inertial instability (timescale is propor-
tively (see Eq. 4 and Schemm, 2013). The intensity of the blue and        tional to [−f (f + ζ )]−0.5 ) (Schultz and Schumacher, 1999;
red shading schematically represent the degree of PV change. See          Thompson et al., 2018). Thus, while hydrostatic instability is
text for details. Note that the orientation of the vertical wind shear    rapidly released and near-neutral conditions are established,
vector and the PV dipole schematically represents the synoptic sit-
                                                                          inertial instability can prevail for several hours and therefore
uation shown in Fig. 7c.
                                                                          synoptic-scale regions of inertial instability can be found, for
                                                                          instance at the anticyclonic shear side of midlatitude ridges
                                                                          (Thompson et al., 2018).
horizontal vorticity vector ωh (Eq. 4, Fig. 1, green arrow),                 Previous studies analyzed the PV modification by individ-
which is rotated 90◦ anticlockwise to the vertical wind shear             ual convective updrafts and mesoscale convective systems.
vector v z (Fig. 1, black arrow). Thereby, the positive PV pole           However, the PV modification by aggregated convection em-
(red shading in Fig. 1) occurs to the right of the vertical wind          bedded in the WCB ascent region, which is already subject
shear vector v z , since there ∇h θ̇ (Fig. 1, grey arrows) is par-        to strong diabatic PV modification from large-scale WCB
allel to ωh , and the negative pole (blue shading in Fig. 1) oc-          ascent, has not yet been investigated. Hence, the contribu-
curs to the left of v z , where ∇h θ̇ and ωh are antiparallel. The        tion of embedded convection in WCBs to the distribution
strongest PV production and destruction (Fig. 1, dark red and             of PV and the formation of mesoscale PV anomalies, which
dark blue shading, respectively) arise where the horizontal               may influence the development of extratropical cyclones, is
vorticity vector (Fig. 1, green arrow) and the horizontal dia-            still unknown. Moreover, the persistence and dynamical rel-
batic heating gradient, which points radially towards the cen-            evance of the convectively generated PV dipoles has not yet
ter of the convective updraft (Fig. 1, grey arrows), are quasi-           been analyzed. Weijenborg et al. (2017) hypothesized that
aligned, i.e., where the angle α between both vectors is small,           the convectively formed large-amplitude PV anomalies could
    D
as Dt  PV ≈ |ωh |·|∇h θ̇ |·cos α. The PV production and destruc-          be longer-lived than the relatively short-lived convective up-
tion is attenuated where the angle α between ωh and ∇h θ̇ in-             drafts and suggested that a more detailed investigation of
creases (Fig. 1, orange and light blue shading, respectively).            these PV anomalies might shed light on the dynamical rel-
Thus, for smaller-scale diabatic heating, as in convective up-            evance of convection. Related to this is the question whether
drafts, the horizontal components of PV become increasingly               the convectively generated PV dipoles aggregate to larger-
dominant and generate an upper-level horizontal PV dipole,                scale PV anomalies and, if so, whether they feedback onto
whereby one pole can reach negative PV values (Harvey                     the synoptic-scale flow (Chagnon and Gray, 2009).
et al., 2020).
   This quasi-horizontal PV dipole structure is a robust re-              1.3   Aim and outline
sponse of convective updrafts in the presence of vertical wind
shear (Chagnon and Gray, 2009; Weijenborg et al., 2015,                   In this study, we investigate convection embedded in a WCB
2017; Hitchman and Rowe, 2017). Such convectively gener-                  case study and systematically analyze the PV modification of
ated PV dipoles were previously identified in idealized simu-             this convective activity. Furthermore, we go beyond the iden-
lations of isolated cumulus-scale convection (Chagnon and                 tification of convectively produced PV anomalies and evalu-
Gray, 2009), in case studies of mesoscale convective sys-                 ate the effect of these mesoscale PV anomalies on the larger-

www.weather-clim-dynam.net/1/127/2020/                                                      Weather Clim. Dynam., 1, 127–153, 2020
130                                          A. Oertel et al.: PV structure of embedded convection in a warm conveyor belt

scale flow, thereby emphasizing the dynamical relevance            trajectories was the same as in Oertel et al. (2019). The sim-
of embedded convection. Therefore, online trajectories in a        ulation was initialized at 00:00 UTC, 22 September 2016,
high-resolution convection-permitting simulation are com-          in the early phase of the cyclogenesis of Cyclone Vladiana
puted to compare convective and slantwise WCB trajecto-            (see Sect. 2.2) and ran for 112 h (see Oertel et al., 2019).
ries and their impact on the cloud and precipitation structure,    Initial and lateral boundary conditions are taken from the
as well as on the mesoscale and larger-scale dynamics. To-         ECMWF analyses with a horizontal resolution of 0.1◦ ev-
gether, this study shows how WCB-embedded convection,              ery 6 h. The domain is centered in the eastern North Atlantic
on the one hand, influences the local mesoscale dynamics           and extends from about 50◦ W to 20◦ E and 30 to 70◦ N.
and, on the other hand, can modify the larger-scale flow evo-      We apply the standard COSMO setup of the Swiss National
lution – both relevant aspects for predictability. Moreover,       Weather Service, which employs a one-moment six-category
this study provides a refined perspective on the relevance of      cloud microphysics scheme including prognostic water va-
smaller-scale processes for the larger-scale WCB dynamics.         por (qv ), liquid (LWC) and ice (IWC) cloud water content,
Specifically, we address the following questions.                  rain (LWC), snow (SWC), and graupel (GWC). The graupel
                                                                   category is important for the explicit simulation of deep con-
    1. What is the impact of convective WCB ascent on cloud        vection (Baldauf et al., 2011). Deep convection is resolved at
       and precipitation structure (Sect. 3.2)?                    2.2 km (e.g., Ban et al., 2014), while for shallow convection
    2. What are characteristic thermodynamic properties of         the reduced Tiedtke scheme was applied (Tiedtke, 1989; Bal-
       convective and slantwise WCB ascent (Sect. 3.3)?            dauf et al., 2011). The 3-D COSMO fields are output every
                                                                   15 min, which allows capturing the large temporal and spatial
    3. Where do convective and slantwise WCB trajectories          variability of embedded convection.
       originate from (Sect. 3.4)?                                    To identify phases of embedded convective ascent in the
                                                                   WCB, 10 000 online trajectories are started from a prede-
    4. How does convective (vs. slantwise) WCB ascent mod-         fined region at seven vertical levels (250, 500, 750, 1000,
       ify the PV distribution along the ascent and in its envi-   1500, 2000, and 2500 m a.s.l.) every 2 h during the simula-
       ronment (Sect. 3.5)?                                        tion. The online trajectory positions are calculated from the
    5. What is the impact of convectively modified PV on the       resolved 3-D wind field at every model time step, i.e., every
       local wind speed and circulation in the upper tropo-        20 s, and thus explicitly capture rapid convective ascent (Mil-
       sphere (Sect. 3.6)?                                         tenberger et al., 2013, 2014; Rasp et al., 2016; Oertel et al.,
                                                                   2019). WCB trajectories are subsequently selected as trajec-
    6. How does convection embedded in WCBs and its asso-          tories with an ascent rate of at least 600 hPa in 48 h (Madonna
       ciated PV anomalies influence the larger-scale dynam-       et al., 2014).
       ics (Sect. 4)?
                                                                   2.2   Overview of WCB case study
   This study is structured in the following way: Sect. 2 ex-
plains the methodology and briefly introduces the analyzed         The investigated WCB is associated with the North At-
WCB case study. Thereafter, we systematically consider the         lantic Extratropical Cyclone Vladiana that occurred be-
mesoscale effects of convection embedded in WCBs (ques-            tween 22 and 25 September 2016, IOP 3 of the North
tions 1–5 above) in a composite analysis (Sect. 3). To address     Atlantic Waveguide and Downstream Impact EXperiment
the question of the dynamical relevance of WCB-embedded            (NAWDEX, Schäfler et al., 2018). The cyclone with a min-
convection (question 6), we consider an illustrative example       imum sea level pressure of 975 hPa on 23 September is lo-
of the characteristics and impact of WCB-embedded convec-          cated below an upper-level trough and propagates eastward
tion (Sect. 4.1) and evaluate the influence of the convectively    across the North Atlantic toward Iceland (Fig. 2), where
generated PV anomalies on the large-scale flow (Sect. 4.2).        it becomes stationary on 24–25 September. The cyclone’s
Finally, we provide a discussion and outlook (Sect. 5) and         WCB ascends in the warm sector predominantly in a nar-
conclusions (Sect. 6).                                             row band ahead of the cold front and develops a weak cy-
                                                                   clonic and a stronger anticyclonic branch (cf. Wernli, 1997;
2     Data and approach                                            Martínez-Alvarado et al., 2014), which turns into the down-
                                                                   stream upper-level ridge and contributes to its amplification
2.1    COSMO setup and trajectories                                (see Fig. 2d–f in Oertel et al., 2019). A more detailed analy-
                                                                   sis of the cyclone evolution and its WCB ascent is presented
The WCB case study was simulated with the limited-area             in Oertel et al. (2019).
nonhydrostatic model COSMO (Consortium for Small-scale                The WCB trajectories in the baroclinic zone ahead of the
Modeling; Baldauf et al., 2011; Doms and Baldauf, 2018)            cyclone’s cold front vary considerably in their ascent rates
at 0.02◦ (≈ 2.2 km) horizontal grid spacing with 60 vertical       (Fig. 2a–c; see also the animation in the Supplement) and
levels. The setup of the COSMO simulation and the online           also include phases of embedded convection. These phases

Weather Clim. Dynam., 1, 127–153, 2020                                             www.weather-clim-dynam.net/1/127/2020/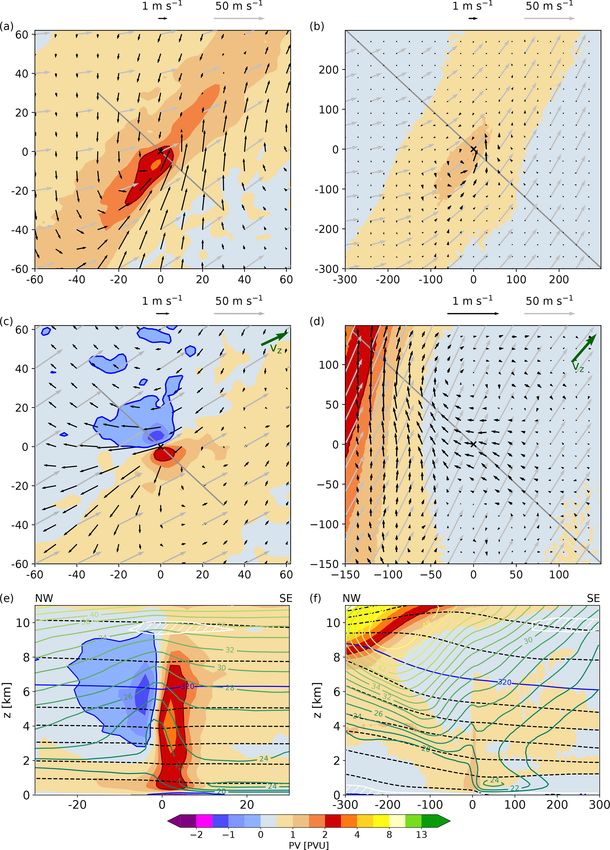
A. Oertel et al.: PV structure of embedded convection in a warm conveyor belt 131
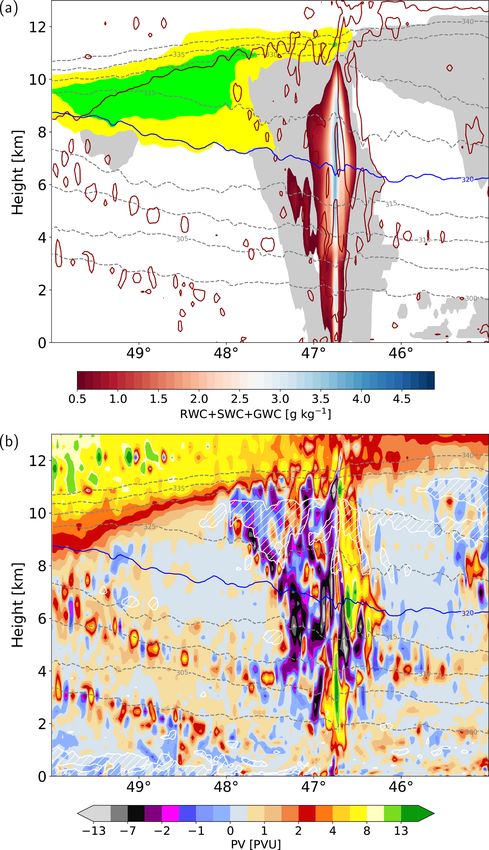
Figure 2. Overview of the WCB ascent for Cyclone Vladiana: (a–c) locations of WCB air parcel ascent (circles; colors indicate centered
2 h pressure change, 1p2 h , along all ascending WCB trajectories, in hPa), SLP (grey contours, in hPa), and 2 PVU at 320 K (red line)
for (from a to c) 22:00 UTC, 22 September; 10:00 UTC, 23 September; and 22:00 UTC, 23 September. (d–f) PV at 320 K and SLP (grey
contours, in hPa) for the same times as (a)–(c). All panels show the position of the cyclone center (L).
are characterized by a rapid ascent of more than 400–600 hPa categories of coherently ascending WCB trajectories: (i) con-
in 2 h, and they are embedded in a larger region of slower, vectively ascending WCB trajectories that perform a rapid
more gradual WCB ascent (red circles in Fig. 2a–c and the quasi-vertical ascent through the whole tropospheric col-
Supplement; see Oertel et al., 2019). The region of embed- umn and (ii) slantwise WCB trajectories that ascend more
ded convective activity is characterized by a very heteroge- slowly and gradually from the boundary layer into the upper
neous PV field of diabatically produced small-scale but high- troposphere. The selection criteria are based on the fastest
amplitude PV anomalies of ±10 PVU in the upper tropo- 400 and 600 hPa ascent phases along the WCB trajecto-
sphere (Fig. 2d–f and the Supplement), suggesting that em- ries: a WCB trajectory is considered convective if its fastest
bedded convection in WCBs can strongly modify the PV dis- 400 and 600 hPa ascent times are shorter than 1 and 3 h, re-
tribution. There is, however, no clear separation between spectively. These ascent rates correspond to the fastest 10 %
convective and slantwise ascent in the WCB of Cyclone Vla- ascent rates of all trajectories of the considered WCB. Like-
diana (Oertel et al., 2019). Instead, it is a continuum of ascent wise, a WCB trajectory is assigned to the slantwise WCB cat-
rates ranging from very rapid convective ascent of more than egory if the 400 and 600 hPa ascent times are between 1.5 to
600 hPa in 2 h to a slower gradual ascent of approximately 3.5 h and 6.5 to 22 h, respectively. These ascent times cor-
50 hPa in 2 h. Nevertheless, we can meaningfully classify the respond to the average ascent rates of all WCB trajectories
WCB trajectories into two subcategories based on their as- (25th to 75th percentiles). The selection criteria result in ap-
cent rate to compare convective vs. slantwise WCB ascent proximately 2000 convective WCB trajectories, and approx-
(see Sect. 2.3). imately 7000 more slowly ascending slantwise WCB trajec-
tories.
2.3 WCB trajectory categorization and WCB ascent Figure 3a shows the temporal evolution of the WCB tra-
region jectory positions at the start of their ascent relative to the
approaching cold front at selected times. The main WCB
To compare the rapid convective WCB ascent to the “typi- ascent occurs ahead of the cold front and the upper-level
cal” slower and slantwise WCB ascent, we define two sub- trough (see the Supplement for more details). The selected
www.weather-clim-dynam.net/1/127/2020/ Weather Clim. Dynam., 1, 127–153, 2020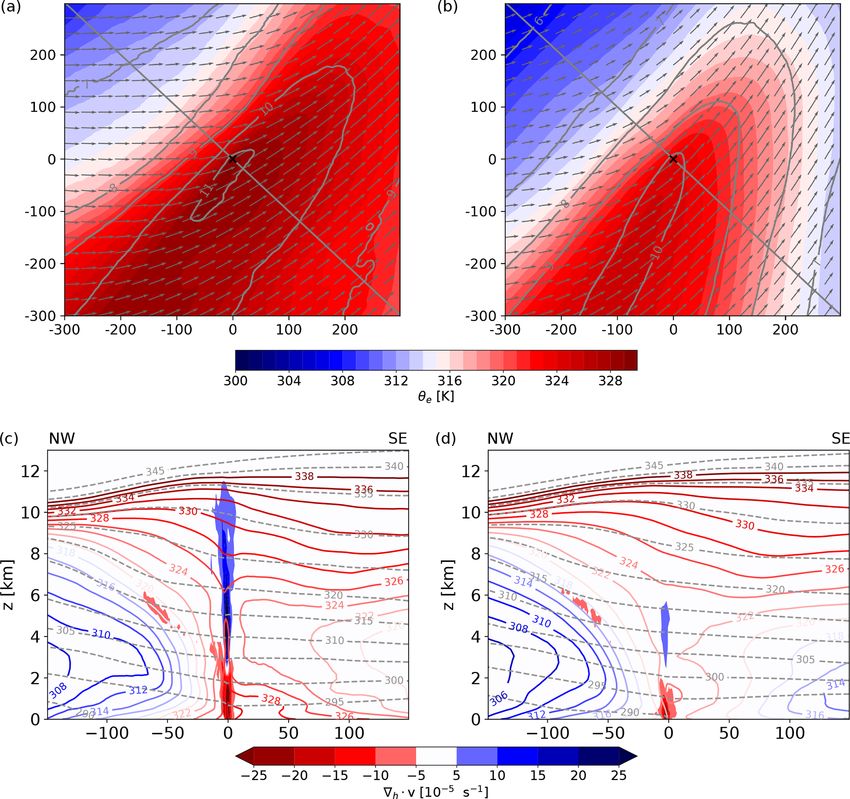
132 A. Oertel et al.: PV structure of embedded convection in a warm conveyor belt
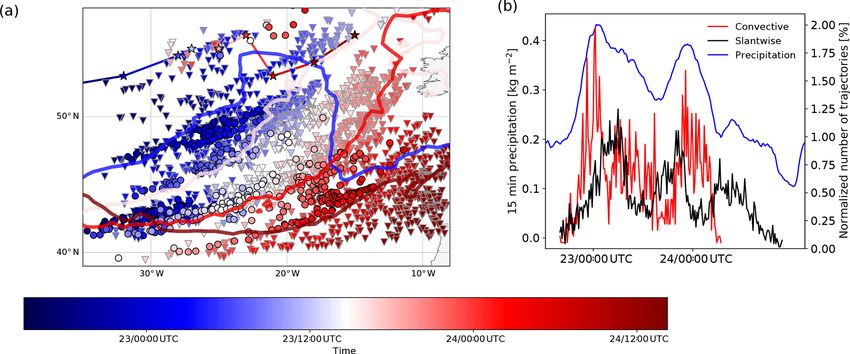
Figure 3. (a) Location of convective (black-outlined circles) and slantwise (grey-outlined triangles) WCB trajectories at the start of the
fastest 400 hPa ascent phase. Colors indicate the according time of the WCB air parcel position (blue 23 September, red 24 September). Only
every fourth trajectory is shown. The evolution of the frontal structures is indicated by θ = 293 K at 850 hPa (lines are colored according to
the selected times at 04:00 UTC, 23 September; 16:00 UTC, 23 September; 04:00 UTC, 24 September; and 16:00 UTC, 24 September). The
asterisks indicate the location of the surface cyclone every 6 h (colored according to time). (b) Temporal evolution of the number of selected
convective (red) and slantwise (black) WCB trajectories at the start of the fastest 400 hPa ascent phase normalized by the absolute number of
selected trajectories in each category and evolution of 15 min accumulated precipitation averaged over the WCB domain shown in (a). Note
that for the domain-averaged precipitation only grid points with nonzero precipitation were considered.
convective WCB trajectories perform a rapid and deep as- 3 Characteristics of convective and slantwise WCB
cent through the whole troposphere mostly south of 50◦ N ascent
(Fig. 3a, black outlined circles), and the slantwise WCB tra-
jectories with comparatively slow and gradual ascent rates 3.1 Composite analysis
are located ahead of, and travel northward with, the cold front
during their ascent (Fig. 3a, grey outlined triangles). During The similarities and differences of the characteristics of con-
the 3 d of major WCB ascent from 22 to 24 September 2016, vective and slantwise WCB trajectories are systematically
a joint evolution and eastward propagation of about 20◦ of compared in a composite analysis. For computing compos-
the cyclone, its cold front and the WCB ascent region takes ites for both WCB categories, the selected WCB trajectories
place (see colored symbols in Fig. 3a). Despite the differ- are centered relative to the time of the start of the fastest
ing ascent behavior of the WCB categories, the convective 400 hPa ascent phase. Composites are computed based on
WCB ascent is directly embedded in the region of large-scale the trajectory position every 15 min, which corresponds to
ascent, i.e., in close proximity of the more slowly ascend- the temporal resolution of the COSMO output.
ing WCB trajectories. The convective WCB trajectories start Three types of composites are produced for both WCB cat-
their ascent on average slightly further south at the cold front egories: (i) composites of vertical profiles along the trajecto-
(45.2◦ ± 3◦ ) compared to the slantwise WCB trajectories ries, i.e., time–height sections along the flow, and (ii) hori-
whose ascent region extends further poleward (47.7◦ ± 4◦ ). zontal and (iii) vertical cross sections centered at the trajecto-
Nevertheless, the overall region of origin and ascent over- ries’ geographical position. While the along-flow composites
laps (Figs. 2a–c and 3a) and the convective WCB ascent is provide a Lagrangian perspective on the local dynamical im-
indeed embedded in the region of slower WCB ascent. This pact of the WCB trajectories, the horizontal and vertical cross
indicates that although their ascent rates differ, both WCB sections allow for analyzing the mutual interaction between
categories are not spatially separated (Fig. 3a). the WCB and its surroundings. Because the trajectories are
located in a region with coherent background flow ahead of
the upper-level trough (see Fig. 2a–c), the fields are not ro-
tated for the composite computation. This enables a direct in-
terpretation of the atmospheric conditions and perturbations
in geographic coordinates.
The number of selected convective and slantwise WCB
trajectories is not homogeneous in time; instead pulses of
Weather Clim. Dynam., 1, 127–153, 2020 www.weather-clim-dynam.net/1/127/2020/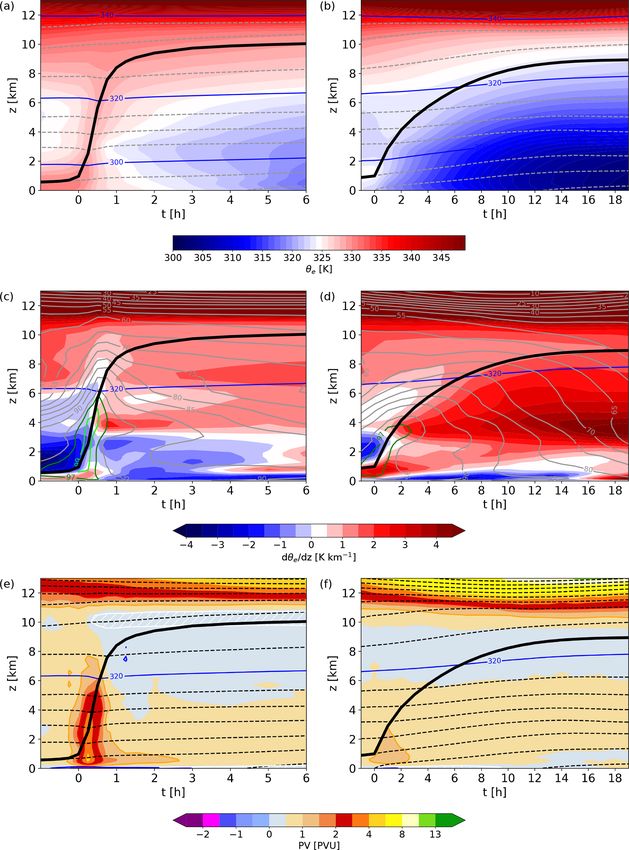
A. Oertel et al.: PV structure of embedded convection in a warm conveyor belt                                                           133

Figure 4. (a, b) Composites of vertical profiles following the motion of the trajectories (the black line shows the mean ascent of all WCB
trajectories) for (a) convective WCB trajectories and (b) slantwise WCB trajectories for hydrometeors: sum of rain and snow water content
(RWC + SWC, colors, in g kg−1 ), ice water content (IWC, turquoise contours, every 0.02 g kg−1 ), liquid water content (LWC, light blue
contours, every 0.1 g kg−1 ), graupel water content (GWC, magenta contours, every 0.4 g kg−1 ), 0 ◦ C isotherm (yellow line), 320 K isentrope
(blue line), and the 2 PVU tropopause (red line). (c, d) The 15 min accumulated surface precipitation along the ascent of the (c) convective
and (d) slantwise WCB trajectories (blue line, in kg m−2 ). (e, f) Horizontal cross section composites of vertically integrated rain and snow
water content (RWP + SWP, colors, in kg m−2 ), vertically integrated graupel water content (magenta contours, every 500 g m−2 ), and 15 min
accumulated surface precipitation (blue contours, every 1 kg m−2 ) for (e) convective WCB trajectories and (f) slantwise WCB trajectories
30 min and 1 h, respectively, after the start of the fastest 400 hPa ascent (corresponding to the respective times of maximum surface precip-
itation). The axes’ dimensions denote the distance from the WCB air parcel locations marked as “×” (in km). Note the different time axis
of (a, c) and (b, d) and the different horizontal dimensions of (e) and (f).

convective and slantwise WCB ascent occur (Fig. 3a and b;                erage, 10 km height (±1.0 km) in about 1–2 h (Fig. 4a, black
see Oertel et al., 2019). In particular, two pulses of increased         line). In contrast, the slantwise WCB trajectories are charac-
convective activity occur at around 00:00 UTC, 23 Septem-                terized by a substantially slower ascent (in agreement with
ber, and 00:00 UTC, 24 September. Hence, the composite                   our selection criteria) and perform a gradual slantwise as-
analyses are dominated by these times when large numbers                 cent until they reach their final outflow level at, on average,
of WCB trajectories are selected for each category.                      9 km (±1.2 km) height after approximately 18 h, after an ini-
   The convective WCB trajectories ascend quasi-vertically               tially swift ascent (due to the centering relative to the fastest
from the boundary layer to the upper troposphere to, on av-              400 hPa ascent) in the lower troposphere (Fig. 4b, black line).

www.weather-clim-dynam.net/1/127/2020/                                                      Weather Clim. Dynam., 1, 127–153, 2020
134                                        A. Oertel et al.: PV structure of embedded convection in a warm conveyor belt

Thus, the final WCB outflow height of the slantwise WCB          scale cloud structure if convection is directly embedded in
trajectories is on average lower than for the convective WCB     the large-scale WCB cloud band.
trajectories.                                                       A previous analysis showed that the precipitating region
   In the following, we first describe the precipitation and     for the considered cyclone is spatially confined to the WCB
cloud structure associated with the rapid convective and         ascent region (see Oertel et al., 2019, Fig. 9b). Indeed, the
slower slantwise WCB trajectories (Sect. 3.2). Subsequently,     (normalized) number of convective and slantwise WCB tra-
we analyze their thermodynamic properties (Sect. 3.3)            jectories starting their fastest ascent both correlate well with
and compare the environment of both WCB categories               the evolution of the averaged (nonzero) precipitation in the
(Sect. 3.4). Then, the PV structure associated with convec-      WCB domain (Fig. 3b). In particular, both convective ascent
tive and slantwise WCB ascent is investigated (Sect. 3.5) and    pulses clearly coincide with the domain-averaged precipita-
related to the flow anomalies (Sect. 3.6).                       tion maxima, suggesting that the evolution of embedded con-
                                                                 vection in the WCB has an impact on the precipitation inten-
                                                                 sity (cf. Fig. 9 in Oertel et al., 2019).
3.2   Precipitation and cloud structure
                                                                    The distinctly different cloud and precipitation structure
                                                                 between both WCB trajectory categories underlines the ra-
The convective cloud formed during the rapid WCB as-             tionale of our classification of convective vs. slantwise as-
cent is characterized by large hydrometeor contents of up        cent, and agrees with typical characteristics of both precip-
to 1 g kg−1 (Fig. 4a) and the vertically integrated rain, snow   itation types: The convective WCB ascent produces locally
and graupel water path in close proximity to the updraft can     confined, intense precipitation including the formation of
reach up to 6 kg m−2 (Fig. 4e), forming a locally dense and      graupel, while the precipitation associated with the slantwise
vertically extended cloud (Fig. 4a). Directly above the con-     WCB ascent is much less intense and distributed over a larger
vective updraft the cloud top height reaches a local max-        domain, whereby the ascent velocity is too slow for graupel
imum (Fig. 4a). During their rapid ascent, the convective        production. Hence, the slantwise WCB ascent forms an ex-
WCB trajectories locally produce intense surface precipi-        tended stratiform cloud band.
tation (Fig. 4c and e). The precipitation maximum coin-
cides with the strongest ascent phase in the mid-troposphere     3.3   Thermodynamic properties
(Fig. 4a and c), where a local maximum of graupel produc-
tion also occurs (Fig. 4a, magenta contours). The maximum        Consistent with the formation of clouds and precipitation, the
surface precipitation is shifted slightly upstream relative to   convective WCB trajectories experience substantial cloud di-
the convective updraft (Fig. 4e). The upper-level WCB out-       abatic heating of 35 K on average during the first 3 h, and they
flow remains inside a thick cirrus cloud for several hours,      reach their outflow level at the 330 K isentrope in agreement
which has formed during the convective ascent and is sub-        with their initial θe value of 330 K (Fig. 5a; see Sect. 3.4).
sequently advected with the upper-level mean flow (Fig. 4a,      The averaged total cross-isentropic ascent of the slantwise
turquoise contours). This convectively formed cirrus cloud       WCB trajectories with lower θe in the inflow is weaker with
can be considered a longer-lived convective anvil cloud, sug-    about 28 K in 18 h when their final outflow level is reached
gesting that embedded convection is also relevant for the        at around 323 K (Fig. 5b). The strong and localized heating
larger-scale upper-level cloud cover.                            in the convective updrafts leads to a local lifting of the melt-
   The cloud formed during the slantwise WCB ascent is           ing level (Fig. 4a) and a localized downward deflection of the
comparatively less dense, with lower rain, ice, and snow wa-     isentropes in the diabatically heated region (Figs. 6c and 5a).
ter content and without graupel production (Fig. 4b and f).         Both convective and slantwise WCB trajectories ascend
Accordingly, the cloud structure and cloud top are more ho-      only approximately along constant-θe surfaces (Fig. 5a
mogeneous and stratiform, and the surface precipitation max-     and b) due to the influence of ice microphysical processes
imum along the ascent (Fig. 4d) is substantially weaker com-     during the ascent. The calculation of θe only considers the
pared to the convective WCB ascent (peak value reduced by        heat released during the transition from the vapor to the liq-
a factor of 3). The vertically integrated rain, snow and grau-   uid phase and does not account for the additional heat re-
pel water paths for the slantwise WCB trajectories are sub-      lease associated with the ice phase (the transition from the
stantially lower and distributed homogeneously over a larger     vapor to the ice phase releases the latent heat of condensa-
area (Fig. 4f). The WCB outflow is surrounded by a cirrus        tion plus freezing, Lc + Lf , and the latter is not accounted
cloud during the entire ascent (Fig. 4b), indicating the rele-   for in the calculation of θe ). Hence, the influence of melt-
vance of WCBs for the formation and maintenance of the ex-       ing from falling hydrometeors and the phase transitions from
tended upper-level cirrus cloud cover associated with extrat-    liquid to ice above the 0 ◦ C isotherm are evident along the
ropical cyclones (Eckhardt et al., 2004; Madonna et al., 2014;   WCB ascent. Following the ascent of the convective WCB
Oertel et al., 2019; Joos, 2019). The denser cloud (Fig. 4a      trajectories from 1 to 4 km height (Fig. 5a), below and near
and b) with limited spatial extent (Fig. 4e and f) in the con-   the melting level in the vicinity of the 0 ◦ C isotherm, i.e.,
vective case implies a pronounced heterogeneity of the large-    where a transition from the solid (SWC and GWC) to the

Weather Clim. Dynam., 1, 127–153, 2020                                           www.weather-clim-dynam.net/1/127/2020/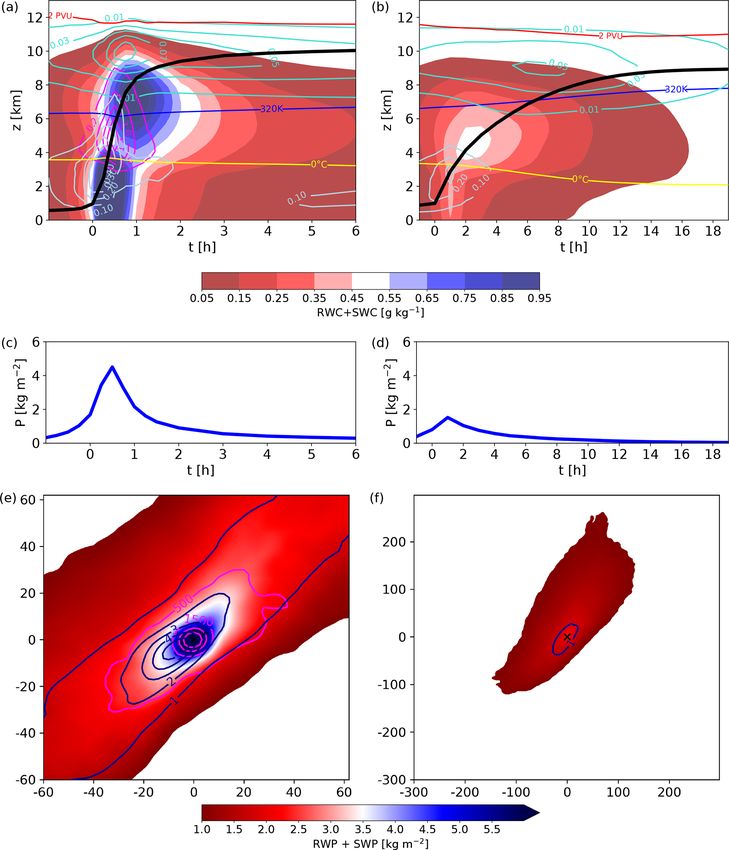
A. Oertel et al.: PV structure of embedded convection in a warm conveyor belt                                                             135

Figure 5. Composites of vertical profiles following the motion of the trajectories (the black line shows the mean ascent of all WCB trajec-
tories) for (a, c, e) convective WCB trajectories and (b, d, f) slantwise WCB trajectories. The fields shown are (a, b) equivalent potential
temperature (θe , colors, in K); potential temperature (θ , dashed grey lines, every 5 K); and the 300, 320, and 340 K isentrope (blue lines);
(c, d) moist stability (dθe /dz, colors, in K km−1 ), the 320 K isentrope (blue line), and relative humidity (RH, grey contours, in %; 97 % and
99 % RH contours are highlighted in green and lime); (e, f) PV (colors, in PVU), isentropes (dashed lines, every 5 K), the 320 K isentrope
(blue line), and in (e) low static stability layers (dθ/dz ≤ 2 K km−1 , white contour and hatching). Note the different time axis in (a, c, e)
and (b, d, f).

liquid (RWC) phase occurs (Fig. 4a), θe decreases along the               slowly ascending WCB trajectories (Fig. 5b), underlining the
ascent (Fig. 5a) due to melting of snow and graupel falling               importance of microphysical processes in WCBs (Joos and
into the ascending air parcels. At higher altitudes, i.e., fol-           Wernli, 2012; Joos and Forbes, 2016), whose effect is clearly
lowing the trajectories above the melting level at 4 km height,
θe increases again due to the additional heat release in the
ice phase (Fig. 5a). This process of decrease and subsequent
increase in θe along the ascent is also evident in the more

www.weather-clim-dynam.net/1/127/2020/                                                       Weather Clim. Dynam., 1, 127–153, 2020
136                                            A. Oertel et al.: PV structure of embedded convection in a warm conveyor belt

detectable even after averaging over hundreds of trajecto-            reached at the lifting condensation level (Schultz and Schu-
ries1 .                                                               macher, 1999; Sherwood, 2000; Schultz et al., 2000). Once
                                                                      the lifting condensation level is reached, the potential insta-
3.4   Environment for convective and slantwise WCB                    bility can be released leading to the identified rapid convec-
      ascent                                                          tive updrafts ahead of the cold front.
                                                                         In contrast, the slower slantwise WCB trajectories start
The rapidly ascending convective WCB trajectories origi-              their ascent from the boundary layer in a region characterized
nate from a slightly warmer and substantially moister re-             by weaker potential instability and lower relative humidity
gion (θ = 296 ± 1.3 K, qv = 11.5 ± 1.2 g kg−1 ) compared to           (Fig. 5d) and ascend on top of the (cold) frontal region char-
the more slowly ascending slantwise WCB trajectories (θ =             acterized by comparatively large potential stability (Fig. 5b
295 ± 1.9 K, qv = 9.9 ± 1.3 g kg−1 ) and are thus character-          and d).
ized by substantially higher initial θe (Figs. 6a and 5a) than
the slantwise WCB trajectories (Figs. 6b and 5b). At the start        3.5     Vertical and horizontal PV structure
of the ascent, θe amounts to 330 K (±4.8 K) for the convec-
tive WCB trajectories and to 324 K (±5.9 K) for the slant-            The PV perspective is useful to understand and trace the ef-
wise WCB trajectories (Fig. 5a and b). Although the convec-           fect of convection on the atmospheric circulation. In this sec-
tive ascent is embedded within the region of slantwise ascent         tion, we investigate the 3-D PV structure associated with con-
ahead of the cold front (Figs. 3 and 6a), where θe contours           vective and slantwise WCB ascent and describe the mecha-
nearly become vertical (Fig. 6c and d), the convective WCB            nisms that lead to the differing PV distributions associated
trajectories ascend from a mesoscale, meridionally elongated          with the two types of WCB ascent.
region characterized by warmer and more humid conditions                 The strong localized diabatic heating during the ascent re-
ahead of a strong localized θe gradient (Fig. 6a). This nar-          sults in a PV production below and a PV destruction above
row tongue of very high θe air with qv exceeding 11 g kg−1            the strongest ascent phase for both WCB categories (Fig. 5e
only extends laterally from ahead of the cold front approxi-          and f), which is characteristic for WCB ascent (e.g., Wernli
mately 50 km into the warm sector and forms a strong hor-             and Davies, 1997; Pomroy and Thorpe, 2000; Madonna et al.,
izontal θe gradient (Fig. 6a). Moreover, the WCB ascent re-           2014). In comparison with the more slowly ascending WCB
gion ahead of the cold frontal zone coincides with enhanced           trajectories, the positive PV anomaly formed by convective
low-level convergence of the horizontal wind (Fig. 6c and d),         WCB ascent in particular is much stronger and more local-
which is particularly strong for the convective WCB trajec-           ized. The averaged low-level PV monopole below the con-
tories. The mesoscale frontal θe structures ahead of the cold         vective WCB ascent reaches values of up to 4.5 PVU, while
front arise from large θe variability in the warm sector. The         it remains below 1.5 PVU for the slantwise WCB ascent. In
higher θe of the convective WCB trajectories subsequently             the WCB outflow, the PV values decrease to approximately
leads to more intense cloud diabatic processes and a faster           0.2 PVU for both WCB categories (Fig. 5e and f). Despite
and stronger cross-isentropic ascent (Fig. 5a and b).                 the stronger and vertically more extended positive low-level
   The rapidly ascending, convective WCB trajectories                 PV anomaly produced by the convective WCB trajectories,
(Fig. 5a) originate in the boundary layer from a region of            both types of WCB trajectories lead to an extended region
strong potential instability characterized by vertical θe gradi-      of low-PV air directly in their outflow in the upper tropo-
ents of −4 K km−1 prior to the start of the convective ascent         sphere. The outflow of the convective WCB trajectories in
(Fig. 5c). After their rapid ascent from the boundary layer           particular is associated with a region of low static stability
into the upper troposphere, the convective WCB trajectories           (dθ/dz ≤ 2 K km−1 , Fig. 5e, white hatching).
continue to moderately ascend almost isentropically along                In the following, we examine the PV structure not only
the upper-level ridge (Fig. 5a). The convective WCB ascent            along the WCB trajectories but also in the surroundings of
is likely triggered through lifting of the potentially unsta-         the WCB ascent. Furthermore, we confront the results with
ble layer in the frontal ageostrophic circulation (see quasi-         the theoretical concept of PV modification and consider the
geostrophic omega ahead of the cold front in Fig. 6 and               vorticity and static stability structure in the PV anomalies.
Sect. 5.1.2 in Oertel et al., 2019). During an initial adiabatic
ascent, the low-level potentially unstable layer in the WCB           3.5.1    Low-level positive PV monopole
inflow region remains potentially unstable until saturation is
   1 Note that the nonconservation of θ leads to the nonconserva-     Figure 7a shows the PV structure in the lower troposphere
                                       e
tion of the equivalent potential vorticity (EPV) along the ascent,
                                                                      below the mean trajectory position 30 min after the start of
which is often considered to be conserved (e.g., Hitchman and         the convective WCB ascent. In this region, below the level
Rowe, 2017) for saturated convective motion (neglecting PV mod-       of the diabatic heating maximum, the convective WCB as-
ification through the solenoid effect; for details see Cao and Cho,   cent leads to the strong positive PV anomaly identified in the
1995). EPV is defined as PV but with θe replacing θ (EPV =            along-flow analysis (Fig. 5e). This mesoscale PV monopole
 1                                                                    with values up to 4 PVU extends horizontally about 30 km
ρ ω · ∇θe ).

Weather Clim. Dynam., 1, 127–153, 2020                                                 www.weather-clim-dynam.net/1/127/2020/
A. Oertel et al.: PV structure of embedded convection in a warm conveyor belt 137
Figure 6. (a, b) Horizontal cross section composites of θe at 900 hPa (colors, in K), specific humidity (grey contours, every 1 g kg−1 ), and
wind at 900 hPa (arrows) for (a) convective WCB trajectories and (b) slantwise WCB trajectories at the start of the fastest 400 hPa ascent. The
axes’ dimensions denote the distance from the WCB air parcel locations marked as “×” (in km). (c, d) Vertical cross section composite along
the northwest–southeast orientated lines shown in (a, b) for horizontal wind divergence (colors, in s−1 ), equivalent potential temperature
(θe , red and blue lines, every 2 K), and potential temperature (θ , dashed grey lines, every 5 K) for (c) convective and (d) slantwise WCB
trajectories at the start of the fastest 400 hPa ascent. The x axis denotes the zonal distance from the WCB air parcel locations (in km).
around the convective udpraft and is embedded within, and extends vertically from about 3 km (305 K) to about 9 km
superimposed on, an environment with a lower-amplitude (330 K). The maximum amplitude of the PV dipole occurs
positive PV anomaly that results from the slower, slantwise at about 315–320 K (Fig. 7e) and coincides with the diabatic
WCB ascent (Fig. 7b). In contrast to the strong mesoscale heating maximum associated with the maximum of the for-
PV monopole formed by the convective WCB ascent, the in- mation of snow and graupel (Fig. 4a). Similar to the positive
creased low-level PV values associated with the slantwise PV monopole at low levels, the upper-level PV dipole also
WCB ascent have a lower magnitude of around 1.5 PVU. extends to about 30–40 km around the center of the convec-
However, the PV anomaly occurs on a larger spatial scale tive updraft (Fig. 7c).
of up to 100 km, with decreasing amplitude away from the This distinct mesoscale PV signal emphasizes the co-
WCB ascent. herent signature of the individual convective updrafts that
are embedded within the complex WCB airstream. The ro-
3.5.2 Upper-level PV dipole bust mesoscale response can only be identified this clearly
in the composite analysis. The large-amplitude, small-scale,
In the middle to upper troposphere a coherent mesoscale and fragmentary PV features that occur in the upper tropo-
horizontal PV dipole forms in the vicinity of the convec- sphere in the region of embedded convection on instanta-
tive WCB trajectories, with a positive PV pole of magnitude neous PV charts (Fig. 2; see the Supplement for more in-
3 PVU to the right of the vertical wind shear vector (which formation) correspond to such mesoscale PV dipoles formed
points in the same direction as the upper-level wind vector) by the individual convective updrafts embedded in the WCB.
and a negative PV pole of magnitude −1.5 PVU to the left of
the vertical wind shear vector (Fig. 7c and e). This PV dipole
www.weather-clim-dynam.net/1/127/2020/ Weather Clim. Dynam., 1, 127–153, 2020138 A. Oertel et al.: PV structure of embedded convection in a warm conveyor belt Figure 7. (a–d) Horizontal cross section composites of PV (colors, in PVU), wind speed (grey arrows, in m s−1 ), and 2 h circulation anomalies (black arrows, in m s−1 ) at (a, b) 800 m and (c, d) 320 K for (a, c) convective WCB trajectories 30 min after the start of the fastest 400 hPa ascent and (b, d) slantwise WCB trajectories (b) 1 h and (d) 10 h after the start of the fastest 400 hPa ascent. The green arrow in (c, d) shows the direction of the vertical wind shear vector (v z ) between 4 and 10 km height at the location of WCB ascent. The axes’ dimensions denote the distance from the WCB air parcel locations marked as “×” (in km). (e, f) Vertical cross section composites along the northwest–southeast orientated lines shown in (a, b) of PV (colors, in PVU), wind speed (green contours, every 2 m s−1 ), isentropes (dashed lines, every 5 K), the 320 K isentrope (blue line), and low static stability layers (dθ/dz ≤ 2 K km−1 , white contour and hatching) for (e) convective WCB trajectories and (f) slantwise WCB trajectories 30 min and 1 h, respectively, after the start of the fastest 400 hPa ascent. The x axis denotes the zonal distance from the WCB air parcel locations (in km). Note the different spatial dimensions for the convective and slantwise WCB trajectories. Weather Clim. Dynam., 1, 127–153, 2020 www.weather-clim-dynam.net/1/127/2020/
A. Oertel et al.: PV structure of embedded convection in a warm conveyor belt                                                   139

   The formation of the PV dipole above the low-level               and 7c). Horizontal vorticity is large ahead of the upper-level
PV monopole in our composite analysis is directly compa-            trough due to strong vertical wind shear below the upper-
rable to the PV structure of isolated convective updrafts in a      level jet. In this case, the vertical wind shear vector of mag-
sheared environment (cf. Fig. 2 in Chagnon and Gray, 2009)          nitude 2–3 m s−1 km−1 between 4 and 12 km height points
or larger-scale convective systems, as discussed in the Intro-      in the same direction as the upper-level wind vector, i.e., to-
duction. It has, however, not yet explicitly been associated        wards the northeast (Fig. 7c). The horizontal vorticity vec-
with WCBs identified in reanalysis data and coarser-scale           tor ωh is rotated 90◦ anticlockwise relative to the vertical
simulations, where the vertical PV dipole structure domi-           wind shear vector and points towards the cold air. Moreover,
nates (e.g., Wernli and Davies, 1997; Joos and Wernli, 2012;        the horizontal heating gradients ∇h θ̇ point radially towards
Madonna et al., 2014).                                              the center of the convective updraft, which coincides with the
   The composites for the slantwise WCB trajectories re-            maximum heating from graupel and snow formation (Fig. 4a
veal the typical PV structure of WCBs (e.g., Wernli and             and e). As outlined in the Introduction (Sect. 1.2), this re-
Davies, 1997; Pomroy and Thorpe, 2000) with a wide re-              sults in PV production to the right of the vertical wind shear
gion of low-PV air with a magnitude of about 0.5 PVU in             vector, where ∇h θ̇ k ωh , and PV destruction to the left of the
the upper-tropospheric WCB outflow above the low-level              vertical wind shear vector, where ∇h θ̇ k −ωh (Fig. 7c). The
positive PV anomaly (Figs. 7b, d, f and 5f). The poleward-          convectively produced heating gradients and the background
ascending low-PV air in the WCB outflow spreads out into            vorticity are strong enough to form a region of absolutely
the upper tropospheric ridge, potentially leading to its ampli-     negative PV. These findings from the convective WCB com-
fication (Grams et al., 2011; Madonna et al., 2014).                posites agree with the theoretical considerations in the Intro-
                                                                    duction.
3.5.3   Mechanisms leading to the PV structure                         The horizontal diabatic heating gradients for the slant-
                                                                    wise WCB ascent are weaker because the diabatic heating is
To analyze the mechanisms responsible for the formation             (i) less intense and (ii) spatially more uniform due to a larger-
of these coherent PV anomalies, we consider the material            scale gradual ascent (cf. Fig. 4b and f). Thus, for the large-
change of PV in the form of Eq. (4), which emphasizes the           scale slantwise WCB ascent, the vertical component of the
contributions from the vertical (the first term) and horizontal     PV equation is comparatively more important than the hor-
(the second term) vorticity components and heating gradi-           izontal component, and continuous heating along the ascent
ents, as discussed in the Introduction (Sect. 1.2).                 leads to PV reduction above the diabatic heating maximum
   The formation of the low-level positive PV anomaly is            and a transport of low-PV air to the upper troposphere by the
mainly due to the strong vertical heating gradient in an en-        trajectories passing through this low-PV region. However,
vironment with large cyclonic vertical vorticity (first term in     PV values remain positive because PV cannot change sign if
Eq. 4), such that below the diabatic heating maximum PV is          the first term in Eq. (4) dominates (Harvey et al., 2020). We
increased (e.g., Stoelinga, 1996; Wernli and Davies, 1997;          conclude that for the slantwise WCB ascent the vertical com-
Rossa et al., 2000; Joos and Wernli, 2012; Binder et al.,           ponent of the PV equation is most relevant, while for embed-
2016). This mechanism is important for PV modification in           ded convection with localized and intense heating gradients
both the convective and slantwise WCB trajectories, which           the horizontal components of the PV equation are essential to
ascend near the surface cold front, i.e., in a region where         explain the resulting upper-level PV dipole structure, which
absolute vertical vorticity f + ζ is particularly large. Due        includes negative PV values.
to the stronger and more localized diabatic heating in the
convective WCB ascent, the vertical heating gradient ∂∂zθ̇ is       3.5.4   Partitioning of PV anomalies in vorticity and
larger and, therefore, the convective WCB ascent leads to a                 static stability
stronger low-level positive PV anomaly. Furthermore, vortex
stretching in the convective updraft additionally enhances the      Negative PV implies either hydrostatic, inertial, or symmet-
low-level absolute vertical vorticity. Together, this can lead      ric instability (e.g., Hoskins, 2015). In the following, we an-
to a positive feedback mechanism: PV is diabatically pro-           alyze the partitioning of the PV anomalies in vorticity and
duced in the convective updraft with strong diabatic heating        static stability and discuss its implication for the expected
gradients ∂∂zθ̇ . As a consequence, the vertical vorticity is en-   lifetime of these anomalies. The PV dipole is associated with
hanced, supported by vortex stretching. In the following, the       a dipole of absolute vertical vorticity f +ζ with similar mag-
diabatic heating gradient acts on amplified vertical vortic-        nitude in both poles (Fig. 8b) and thus can be understood
ity and thus still larger PV anomalies are produced. Finally,       as the effect of tilting of horizontal vorticity by the con-
this results in increased PV production (see Joos and Wernli,       vective updraft (see Chagnon and Gray, 2009). Moreover,
2012; Madonna et al., 2014).                                        strong heating in the convective updraft leads to increased
   The midlevel to upper-level convective PV dipole results         static stability inside the updraft (dθ/dz = 3–5 K km−1 ; not
from the arrangement of horizontal vorticity and the horizon-       shown) and a shallow layer of low static stability (dθ/dz ≤
tal diabatic heating gradient (second term in Eq. 4; cf. Figs. 1    2 K km−1 , Figs. 5e and 7e) above. The static stability is rel-

www.weather-clim-dynam.net/1/127/2020/                                                Weather Clim. Dynam., 1, 127–153, 2020
140 A. Oertel et al.: PV structure of embedded convection in a warm conveyor belt
sphere (dθ/dz < 0), in contrast, would adjust to stability on
a timescale of less than 1 h (Schultz and Schumacher, 1999).
The static stability reduction above the slantwise WCB
is weaker compared to the convective WCB, but the slant-
wise WCB leads to a reduced static stability over a larger re-
gion (Fig. 7f). In the outflow of the slantwise WCB, relative
vorticity is weakly negative and absolute vertical vorticity is
weakly positive (not shown).
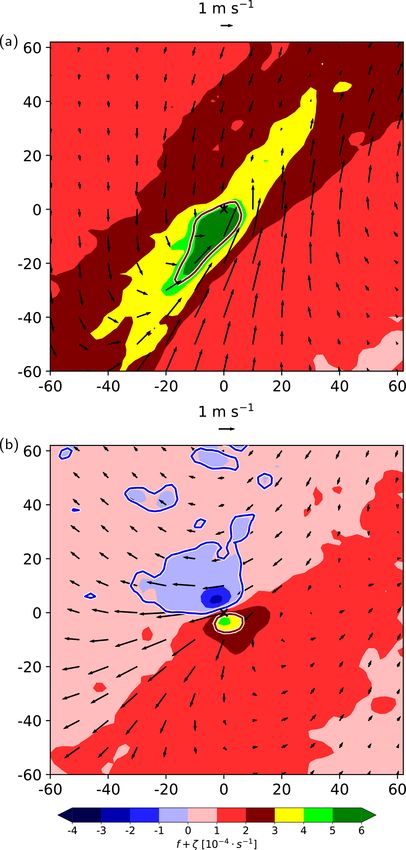
The low-level positive PV anomalies for convective and
slantwise WCB ascent are associated with large cyclonic ver-
tical vorticity f +ζ , whereby the convective WCB has higher
values, exceeding 6 × 10⁻⁴ s−1 (Fig. 8a), compared to the
slantwise WCB with values of (3–4)×10−4 s−1 (not shown).
3.6 Flow anomalies induced by PV anomalies
In agreement with idealized PV inversions (e.g., Hoskins
et al., 1985; Hoskins, 2015), where a positive PV anomaly
induces a cyclonic flow anomaly, and a negative PV anomaly
induces an anticyclonic circulation anomaly, respectively, the
convectively produced PV dipoles are associated with coher-
ent horizontal wind anomalies, calculated as the deviation
of the current wind vectors from the 2 h centered mean wind
vectors. The low-level positive PV monopole is accompanied
by a cyclonic circulation anomaly with about 4 m s−1 higher
wind speeds southeast of the convective updraft and smaller
values to the northeast (Fig. 7a and e). Despite this relatively
strong local wind anomaly, its radius of impact is limited
and the effect of the PV anomaly substantially decays be-
yond 40 km from the updraft. As hypothesized by Raymond
and Jiang (1990), the relatively long-lived low-level positive
PV anomalies interact with the background shear and thus
could trigger new convective cells through the formation of
local convergence lines on the downshear side. In this way,
convective activity could be maintained.
The positive PV monopole from the slantwise WCB
Figure 8. The same as Fig. 7a and c but for absolute vertical vor- trajectories also induces a cyclonic low-level circulation
ticity (f + ζ , in s−1 ) and 2 h circulation anomalies (black arrows,
anomaly (Fig. 7b). Yet, it hardly exceeds 1 m s−1 and oc-
in m s−1 ) at (a) 800 m and (b) 320 K for convective WCB trajecto-
curs on a larger spatial scale, in agreement with the com-
ries 30 min after the start of the fastest 400 hPa ascent. The 0 and
2 PVU contour lines are shown in blue and red, respectively. paratively weaker and larger-scale positive PV anomaly. The
initial slantwise WCB ascent occurs directly behind the pro-
nounced low-level jet ahead of the cold front (Fig. 7b and f).
This jet, which exceeds 24 m s−1 , is very slightly accelerated
atively uniform across both poles. Hence, the PV dipole’s by the diabatically produced positive PV and the associated
horizontal structure is predominantly determined by vorticity cyclonic circulation anomaly ahead of the WCB ascent re-
and not static stability. This is consistent with Chagnon and gion. This pattern agrees with the synoptic situation of early
Gray (2009), who also found that in convective updrafts the WCB studies (e.g., Fig. 5 in Wernli, 1997), where the ascent
so-called “latent vorticity” is quickly converted to horizon- region of the slantwise WCB is located ahead of the upper-
tal dipoles of vertical vorticity that determine the PV dipole level jet and behind the low-level jet.
structure. The convectively produced upper-level PV dipole is asso-
In Sect. 4.2 we will see that the negative PV pole, pro- ciated with a cyclonic and anticyclonic circulation anomaly
duced by convective WCB trajectories, persists for several around the positive and negative PV poles, respectively
hours. This is consistent with adjustment timescales of sev- (Fig. 7c and e). The superposition of these two flows leads
eral hours (e.g., Thompson et al., 2018) in inertially unsta- to a deceleration of the flow in the center of the PV dipoles
ble regions where f + ζ < 0. A convectively unstable atmo- and potentially reduces the rapid dispersion of the convective
Weather Clim. Dynam., 1, 127–153, 2020 www.weather-clim-dynam.net/1/127/2020/You can also read