Factors controlling the community structure of picoplankton in contrasting marine environments - Biogeosciences
←
→
Page content transcription
If your browser does not render page correctly, please read the page content below
Biogeosciences, 15, 6199–6220, 2018
https://doi.org/10.5194/bg-15-6199-2018
© Author(s) 2018. This work is distributed under
the Creative Commons Attribution 4.0 License.

Factors controlling the community structure of picoplankton in
contrasting marine environments
Jose Luis Otero-Ferrer1 , Pedro Cermeño2 , Antonio Bode6 , Bieito Fernández-Castro1,3 , Josep M. Gasol2,5 ,
Xosé Anxelu G. Morán4 , Emilio Marañon1 , Victor Moreira-Coello1 , Marta M. Varela6 , Marina Villamaña1 , and
Beatriz Mouriño-Carballido1
1 Departamento  de Ecoloxía e Bioloxía Animal, Universidade de Vigo, Vigo, Spain
2 Institutde Ciències del Mar, Consejo Superior de Investigaciones Científicas, Barcelona, Spain
3 Departamento de Oceanografía, Instituto de investigacións Mariñas (IIM-CSIC), Vigo, Spain
4 King Abdullah University of Science and Technology (KAUST), Read Sea Research Center, Biological and

Environmental Sciences and Engineering Division, Thuwal, Saudi Arabia
5 Centre for Marine Ecosystem Research, School of Sciences, Edith Cowan University, WA, Perth, Australia
6 Centro Oceanográfico de A Coruña, Instituto Español de Oceanografía (IEO), A Coruña, Spain

Correspondence: Jose Luis Otero-Ferrer (jootero@uvigo.es)

Received: 27 April 2018 – Discussion started: 4 June 2018
Revised: 4 October 2018 – Accepted: 10 October 2018 – Published: 26 October 2018

Abstract. The effect of inorganic nutrients on planktonic as-       played a significant role. Nitrate supply was the only fac-
semblages has traditionally relied on concentrations rather         tor that allowed the distinction among the ecological niches
than estimates of nutrient supply. We combined a novel              of all autotrophic and heterotrophic picoplankton subgroups.
dataset of hydrographic properties, turbulent mixing, nutri-        Prochlorococcus and LNA prokaryotes were more abundant
ent concentration, and picoplankton community composition           in warmer waters ( > 20 ◦ C) where the nitrate fluxes were
with the aims of (i) quantifying the role of temperature, light,    low, whereas Synechococcus and high-nucleic-acid (HNA)
and nitrate fluxes as factors controlling the distribution of au-   prokaryotes prevailed mainly in cooler environments charac-
totrophic and heterotrophic picoplankton subgroups, as de-          terized by intermediate or high levels of nitrate supply. Fi-
termined by flow cytometry, and (ii) describing the ecolog-         nally, the niche of picoeukaryotes was defined by low tem-
ical niches of the various components of the picoplankton           peratures and high nitrate supply. These results support the
community. Data were collected at 97 stations in the Atlantic       key role of nitrate supply, as it not only promotes the growth
Ocean, including tropical and subtropical open-ocean waters,        of large phytoplankton, but it also controls the structure of
the northwestern Mediterranean Sea, and the Galician coastal        marine picoplankton communities.
upwelling system of the northwest Iberian Peninsula. A gen-
eralized additive model (GAM) approach was used to pre-
dict depth-integrated biomass of each picoplankton subgroup
based on three niche predictors: sea surface temperature, av-       1   Introduction
eraged daily surface irradiance, and the transport of nitrate
into the euphotic zone, through both diffusion and advec-           Picoplankton, including archaea, bacteria, and picoeukary-
tion. In addition, niche overlap among different picoplankton       otes are the smallest (cell diameter < 2 µm) and most abun-
subgroups was computed using nonparametric kernel den-              dant organisms in marine ecosystems. Photosynthetic pi-
sity functions. Temperature and nitrate supply were more            coplankton often dominate marine phytoplankton biomass
relevant than light in predicting the biomass of most pi-           and primary production in oligotrophic tropical and subtrop-
coplankton subgroups, except for Prochlorococcus and low-           ical regions (Chisholm, 1992), whereas they are typically a
nucleic-acid (LNA) prokaryotes, for which irradiance also           minor component in nutrient-replete coastal environments,

Published by Copernicus Publications on behalf of the European Geosciences Union.
6200                                       J. L. Otero-Ferrer et al.: Factors controlling picoplankton community structure

usually dominated by large-sized plankton species (Finkel             Aside from the effect of trophic controls, the distribu-
et al., 2010; Marañón, 2015). However, due to the large            tion of microbial plankton is primarily determined by sea-
temporal and spatial variability in the structure and com-         water temperature, light, and nutrients (Li, 2009, 2007; Bar-
position of the microbial community in shelf seas (Sherr           ton et al., 2015). Quantifying their relative influence on the
et al., 2005), picoplankton, together with nanoplankton, can       spatial and temporal distribution of the different picoplank-
dominate the microbial community under certain conditions          ton subgroups is complicated by the fact that the abovemen-
(Morán, 2007; Espinoza-González et al., 2012). In addition,        tioned factors are often correlated in the ocean (Finkel et al.,
picoplankton contributes overwhelmingly to the recycling of        2010). This shortcoming can be circumvented by using ex-
organic matter (Azam et al., 1983; Fenchel, 2008), and pre-        perimental approaches in the laboratory, where the influence
vious studies suggest that photosynthetic picoplankton could       of each independent factor is isolated. Alternatively, it can
also play a role in the export of carbon to the deep ocean         be approached by combining large datasets of hydrographic
(Richardson and Jackson, 2007; Lomas and Moran, 2011;              and biological observations collected from contrasting ma-
Guidi et al., 2015). As a result, picoplankton is considered a     rine environments, which allow us to characterize the suite of
key component of the current carbon cycle and likely more          variables that best define the organism’s ecological niches.
important in future climate warming scenarios (Laufkötter             In order to study the significance of temperature and nu-
et al., 2016). When analyzed using flow cytometric tech-           trient concentrations in determining the contribution of pico-
niques, two genera of picocyanobacteria (Prochlorococcus           phytoplankton to total phytoplankton biomass and produc-
and Synechococcus), one or two subgroups of autotrophic            tion, Agawin et al. (2000) reviewed the available literature
picoeukaryotes of different sizes (small and large), and two       from oceanic and coastal estuarine areas. Although the num-
subgroups of heterotrophic prokaryotes, based on their high        ber of observations for which both temperature and nutri-
(HNA) or low nucleic acid (LNA) content, can be distin-            ent concentration were available was too small to statisti-
guished (Gasol and del Giorgio, 2000; Marie and Parten-            cally separate their effects, these authors hypothesized that
sky, 2006). Although closely related phylogenetically, Syne-       the dominance of picoplankton in warm, oligotrophic waters
chococcus and Prochlorococcus exhibit distinct physiologi-         was due to differences between picophytoplankton and larger
cal traits (Moore et al., 1995), divergent evolutionary strate-    cells in their capacity to use nutrients and in their intrinsic
gies (Scanlan and West, 2002), and disparate geographic dis-       growth rate. Bouman et al. (2011) investigated how vertical
tributions (Zubkov et al., 2000). Prochlorococcus tend to be       stratification controls the community structure of picophyto-
restricted to relatively warm (above 15 ◦ C) and nutrient-poor     plankton in subtropical regions. According to their results,
waters, extending from the surface down to 150 m, along the        photosynthetic picoeukaryotes dominate in weakly stratified
40◦ N–40◦ S latitudinal band (Partensky et al., 1999b; John-       waters, whereas in strongly stratified waters, Prochlorococ-
son et al., 2006). Synechococcus exhibit a wider geographic        cus cyanobacteria are prevalent. More recently, Flombaum
and thermal distribution, including high-nutrient waters and       et al. (2013), using a compilation of flow cytometry data
occasionally reaching polar latitudes (Paulsen et al., 2016);      from all major ocean regions, concluded that Prochlorococ-
their vertical distribution is shallower than that of Prochloro-   cus and Synechococcus abundance distributions were con-
coccus (Partensky et al., 1999a; Li, 2002). The contribu-          trolled by temperature and photosynthetically active radia-
tion of picoeukaryotes to picoplankton biomass is generally        tion (PAR, 400–700 nm), discarding the role of nitrate con-
smaller than the contribution of picocyanobacteria (Zubkov         centration. However, in tropical and subtropical domains,
et al., 2000; Buitenhuis et al., 2012), except in coastal re-      the most well-represented regions in the study of Flombaum
gions where their contribution usually increases (Grob et al.,     et al. (2013), surface nitrate is almost depleted and the vari-
2007). In general, LNA prokaryotes dominate heterotrophic          ability in its concentration can be widely disconnected from
prokaryotic biomass in the oligotrophic open ocean, whereas        changes in its availability for phytoplankton, which depends
HNA cells dominate in coastal regions (Li et al., 1995;            more on the supply from deeper waters by turbulent diffu-
Bouvier et al., 2007). These contrasting spatial distributions     sion (Mouriño-Carballido et al., 2016). It is also believed
suggest that the picoplankton subgroups occupy differen-           that fine-scale turbulence can enhance the nutrient uptake
tial ecological niches or, according to the classical defini-      and subsequent growth of larger phytoplankton (Lazier and
tion proposed by Hutchinson (1957), distinct multidimen-           Mann, 1989; Karp-Boss et al., 1996; Guasto et al., 2012), es-
sional hyper-volumes of environmental factors in which vi-         pecially in regions with low nutrient levels and strong grazing
able populations develop. By describing the overlaps of envi-      pressure (Barton et al., 2014).
ronmental factors, realized niche partitioning can be defined,        As far as we know, only one study has previously used
and the factors controlling the distribution of picoplankton       estimates of nitrate availability, derived from observations
subgroups can be identified. However, despite decades of ex-       of microstructure turbulence, to investigate the role of nutri-
perimental and field observations, the relative importance of      ent availability in controlling the composition of picoplank-
the factors driving the variability in the growth and the spa-     ton communities (Mouriño-Carballido et al., 2016). These
tial distribution of picoplankton subgroups remains largely        authors, using local data from the northwestern Mediter-
unknown.                                                           ranean Sea, found that different autotrophic picophytoplank-

Biogeosciences, 15, 6199–6220, 2018                                                     www.biogeosciences.net/15/6199/2018/
J. L. Otero-Ferrer et al.: Factors controlling picoplankton community structure                                                     6201

Figure 1. Location of the stations sampled in the tropical and subtropical Atlantic Ocean (T), the Mediterranean Sea (M), and the Galician
coastal upwelling (G). Small panels provide details about those stations sampled in M (green) and G (blue).

ton subgroups exhibit contrasting responses to nitrate supply          (FAMOSO1 March 2009, FAMOSO2 April–May 2009, and
and that as a result the ratio of prokaryotic to picoeukary-           FAMOSO3 September 2009) sampled 19 stations during
otic photoautotrophic biomass decreased with increasing ni-            three contrasting hydrographic conditions, covering from
trate supply. However, whether these patterns are general and          winter mixing to summer stratification. Finally, 52 stations
widespread in the ocean remains largely uncertain, given that          were sampled in the Galician coastal upwelling ecosystem
no concomitant datasets including measurements of turbulent            during the HERCULES1 July 2010, HERCULES2 Septem-
diffusion nutrient flux and picoplankton subgroup structure            ber 2011, HERCULES3 July 2012, DISTRAL February–
have been available to date.                                           November 2012, ASIMUTH June 2013, CHAOS Au-
   Here we extend the analysis described in Mouriño-                   gust 2013, and NICANOR February 2014–December 2015
Carballido et al. (2016) by combining a dataset of picoplank-          cruises. Additional information about the sampling design of
ton community composition, hydrographic properties, turbu-             these cruises is presented in Aranguren-Gassis et al. (2011,
lent mixing, and inorganic nutrient concentrations collected           CARPOS), Mouriño-Carballido et al. (2011, TRYNITROP),
at a total of 97 stations. Observations were made in contrast-         Mouriño-Carballido et al. (2016, FAMOSO), Cermeño et al.
ing environments of the Atlantic Ocean in order to quantify            (2016, DISTRAL), Villamaña et al. (2017, CHAOS), and
the role of temperature, light, and nitrate availability in the        Moreira-Coello et al. (2017, NICANOR).
composition of the picoplankton community and to describe                 At each station, information about hydrographic proper-
the ecological niches of each picoplankton subgroup.                   ties, turbulent mixing, nitrate concentration, and picoplank-
                                                                       ton community composition was collected. Light conditions
                                                                       for each sampling station were considered to be the 5-day av-
2   Materials and methods                                              eraged daily surface PAR obtained from satellite data (http:
                                                                       //globcolour.info; last access: 18 October 2018). Light at-
This study includes data collected at 97 stations from three           tenuation coefficients were obtained from vertical profiles
contrasting environments covering the tropical and subtrop-            of PAR estimated with LI-COR sensors using the Beer–
ical Atlantic Ocean (T), the northwestern Mediterranean                Lambert law equation (Kirk, 1994). Depth of the euphotic
Sea (M), and the Galician coastal upwelling ecosystem (G),             layer was calculated as the depth at which PAR was 1 % of
between October 2006 and December 2015 (Table 1 and                    its surface value. For those cruises for which PAR profiles
Fig. 1). Two cruises (CARPOS October–November 2006                     were not available (ASIMUTH, CHAOS, and NICANOR),
and TRYNITROP April–May 2008) sampled 26 stations                      which sampled stations in the outer part of the Galician
located in the tropical and subtropical Atlantic Ocean.                rias, the depth of the photic layer was calculated by con-
Three other cruises carried out in the Mediterranean Sea

www.biogeosciences.net/15/6199/2018/                                                            Biogeosciences, 15, 6199–6220, 2018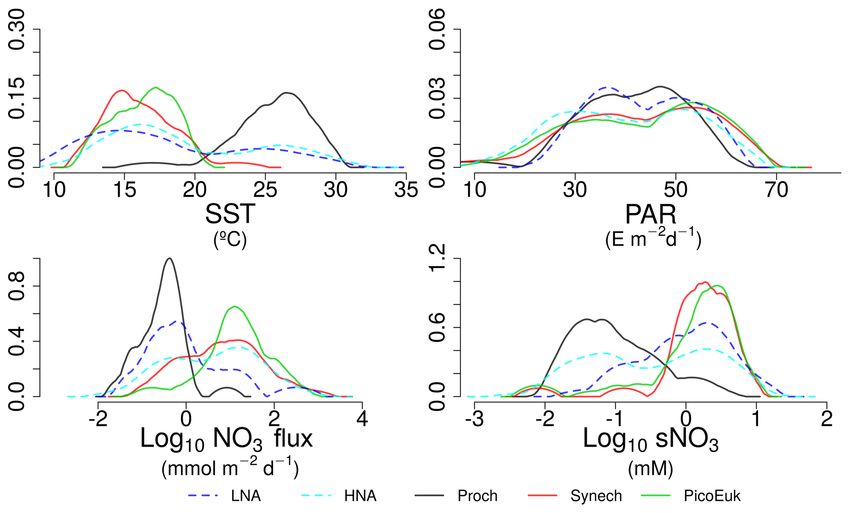
6202                                         J. L. Otero-Ferrer et al.: Factors controlling picoplankton community structure

Table 1. Details of the data included in this study. Domain refers to the tropical and subtropical Atlantic Ocean (T), the Mediterranean Sea
(M), and the Galician coastal upwelling (G). N indicates the number of stations sampled during each cruise. Duration (mean ± standard
deviation, in minutes) is the time used for the turbulence profiler deployment in each station. Depth (mean ± standard deviation, in meters)
is the maximum depth reached by the microstructure profiler.

      Domain   Region                       N     Cruise            Vessel                   Date (dd/mm/yy)      Duration      Depth
      T        NE Atlantic                   8    CARPOS            Hespérides               14/10/06–22/11/06     57 ± 24    137 ± 15
      T        Atlantic                     18    TRYNITROP         Hespérides               14/04/08–02/05/08     45 ± 12    219 ± 19
      M        Liguro-Provençal Basin        6    FAMOSO I          Sarmiento de Gamboa      14/3/09–22/3/09        66 ± 5    259 ± 38
      M        Liguro-Provençal Basin       10    FAMOSO II         Sarmiento de Gamboa      30/4/09–13/05/09       94 ± 4     273 ± 2
      M        Liguro-Provençal Basin        3    FAMOSO III        Sarmiento de Gamboa      16/09/09–20/09/09     133 ± 3    323 ± 24
      G        Ría de A Coruña               1    HERCULES I        Lura                     07/06/10               20 ± 4      35 ± 2
      G        Ría de A Coruña               5    HERCULES II       Lura                     28/09/11–29/09/11      11 ± 8     33 ± 26
      G        Ría de A Coruña              13    HERCULES III      Lura                     16/07/12–20/07/12       8±5       41 ± 29
      G        Ría de Vigo                   9    DISTRAL           Mytilus                  14/02/12–06/11/12    110 ± 76      38 ± 1
      G        Ría de Vigo                   2    CHAOS             Mytilus                  20/08/13–27/08/13    1515 ± 6     41 ± 29
      G        Ría de A Coruña              12    NICANOR           Lura                     27/02/14–17/12/15      33 ± 5      62 ± 3
      G        Rías de Vigo & Pontevedra    10    ASIMUTH           Ramón Margalef           17/06/13–21/06/13      10 ± 4     28 ± 10

sidering light attenuation coefficients derived from surface            the ebbs, as the result of the interplay of the bidirectional
chlorophyll a data, following the algorithms proposed by                upwelling circulation and the tidal current shear (Fernández-
Morel et al. (2007) for Case-1 waters (log10 Zeu = 1.524 −              Castro et al., 2018). Diffusive nitrate fluxes due to the en-
0.460[Chl]surf − 0.00051[Chl]2surf + 0.0282[Chl]3surf ). A com-         hanced dissipation observed during spring tide could be re-
parison of the estimation of the base of the euphotic zone by           sponsible for about half of the phytoplankton primary pro-
using the Morel et al. (2007) equation and the data collected           duction estimated in this system during periods of upwelling
by a radiometer during the HERCULES cruise is shown in                  relaxation–stratification (Villamaña et al., 2017).
Fig. A1a.                                                                  The profiler was balanced to have negative buoyancy and
                                                                        a sinking velocity of 0.4 to 0.7 m s−1 . The frequency of
2.1    Hydrography and turbulent mixing                                 data sampling was 1024 Hz. The sensitivity of the shear
                                                                        sensors was checked after each use. Due to significant tur-
Hydrographic properties and turbulent mixing were derived               bulence generation close to the ship, only the data below
from a microstructure turbulent profiler (Prandke and Stips,            5 (HERCULES1, HERCULES2, HERCULES3, DISTRAL,
1998, MSS) equipped with a high-precision conductivity–                 ASIMUTH, CHAOS, and NICANOR) and 10 m (CARPOS,
temperature–depth (CTD) probe, two microstructure shear                 TRYNITROP, FAMOSO1, FAMOSO2, FAMOSO3) were
sensors (type PNS06), and also a sensor to measure the hor-             considered reliable. Data processing and calculation of dissi-
izontal acceleration of the profiler. Measurements of dissi-            pation rates of (ε) were carried out with the commercial soft-
pation rates of turbulent kinetic energy (ε) were conducted             ware MSSpro. The squared Brunt–Väisälä frequency (N 2 )
to the bottom, or to 137–323 m over deep waters (Table 1).              was computed from the CTD profiles according to the equa-
The number of microstructure turbulence profiles used for               tion
computing nitrate fluxes at each station were always de-

                                                                                    g      ∂ρ
ployed successively. Sets include 2–11 in the tropical and              N2 = −                   s −2 ,                            (1)
                                                                                   ρw      ∂z
subtropical Atlantic (37 ± 18 min), 6–7 in the Mediterranean
(76 ± 22 min), and 3–402 in the Galician coastal upwelling              where g is the acceleration due to gravity (9.8 m s−2 ), ρw
(65 ± 246 min) (Fig. A1b in Appendix). Episodic bursts of               is seawater density (1025 kg m−3 ), and ∂ρ/∂z is the vertical
turbulence can induce episodic inputs of nutrient supply,               potential density gradient. Vertical diffusivity (Kz ) was esti-
which can be easily missed in sets of a low number of pro-              mated as
files. In coastal regions where short-term variability in mix-                   ε
                                                                        Kz = 0 2 m2 s−1 ,                                           (2)
ing processes is expected to be higher, our dataset includes                    N
two high-frequency samplings carried out in the outer part of           where 0 is the mixing efficiency, here considered to be 0.2
Ría de Vigo (Galician upwelling ecosystem) in August 2013               (Osborn, 1980).
(CHAOS cruises). During these cruises two 25 h series of
turbulent microstructure and current observations were car-             2.2    Nutrient supply
ried out during spring and neap tides. Turbulent kinetic en-
ergy dissipation at the interface between upwelled and sur-             Samples for the determination of nitrate (NO3 ) + nitrite
face waters was enhanced by 2 orders of magnitude during                (NO2 ) were collected from 5 ± 2 (Galician coastal up-

Biogeosciences, 15, 6199–6220, 2018                                                           www.biogeosciences.net/15/6199/2018/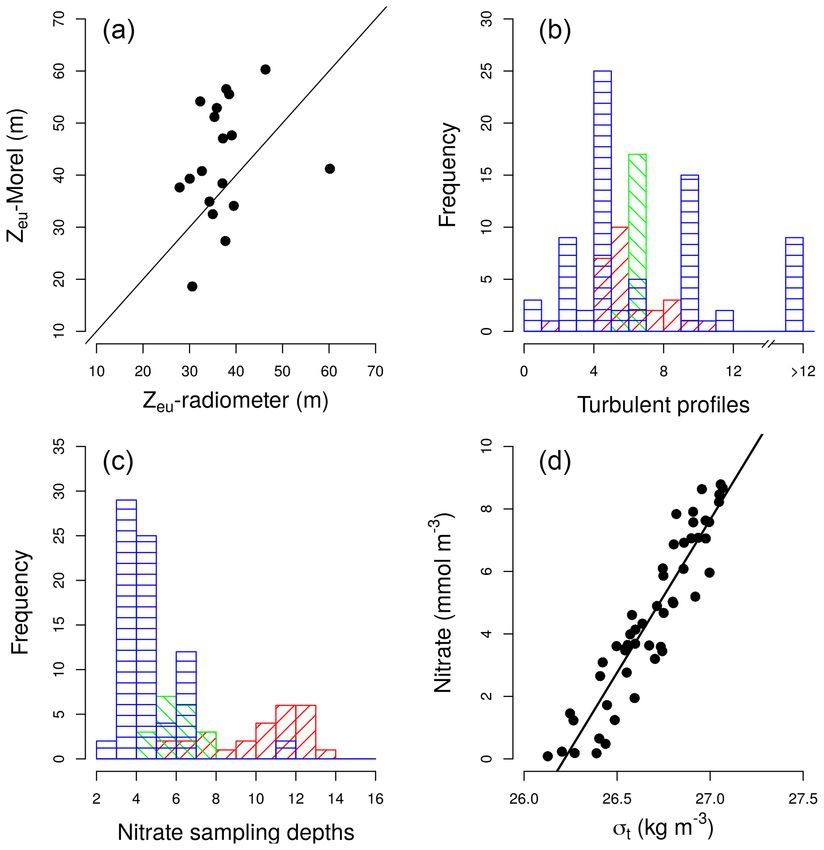
J. L. Otero-Ferrer et al.: Factors controlling picoplankton community structure                                             6203

welling), 7±1 (Mediterranean), and 11±2 (tropical and sub-        and the lengths of the mouth of the rias (ca. 10–11.5 km).
tropical Atlantic Ocean) different depths in rinsed polyethy-     IW was averaged over the 3-day period before each cruise
lene tubes and stored frozen at −20 ◦ C until analysis on         from wind data recorded by meteorological buoys located
land, according to standard methods using the automated           in Cabo Vilán (HERCULES, NICANOR) and Cabo Silleiro
colorimetric technique (Hansen and Koroleff., 1999). The          (DISTRAL, ASIMUTH, CHAOS, ASIMUTH), or modeled
frequency histogram of sampling depths collected for ni-          by the Fleet Numerical Meteorology and Oceanography Cen-
trate concentration in each region is indicated in Fig. A1c,      ter (FNMOC) model when buoy data were not available
whereas the maximum sampling depth at which the mi-               (http://www.indicedeafloramiento.ieo.es; last access: 18 Oc-
crostructure turbulence profiler was deployed is indicated in     tober 2018). Finally, the transport of nitrate into the euphotic
Table 1. At one station carried out during the NICANOR            zone through vertical advection was computed as
cruises, where nitrate concentrations were not available, con-
centration values were obtained by using a nitrate–density                                 Qz
                                                                  NO3 Advective flux =           [NO3 ]D ,                    (4)
relationship built by using all samples (n = 52) collected                                Abasin
during the NICANOR sampling period. The relationship              where Abasin is the surface area of the Galician rias, QZ is
showed a linear behavior (NO3 = 9.7788×σt −256.38; Adj-           the vertical advective flux, and [NO3 ]D is the averaged ni-
r 2 = 0.87; p < 0.001) for density ranging between 26.1 and       trate concentration at the base of the euphotic layer. Abasin
27.1 kg m−3 (Fig. A1d).                                           is 141 km2 for Ría de Pontevedra (ASIMUTH), 174 km2 for
    Vertical diffusive fluxes of nitrate into the euphotic zone   Ría de Vigo (CHAOS, ASIMUTH, DISTRAL), and 145 km2
were calculated following Fick’s law as                           for Ría de A Coruña (HERCULES, NICANOR) (see Vil-
Flux NO3 = Kz 1NO3 ,                                       (3)    lamaña et al., 2017; Villamaña et al., 2017; Moreira-Coello
                                                                  et al., 2017; Moreira-Coello et al., 2017, for details).
where 1NO3 is the nitrate vertical gradient obtained by lin-
ear fitting of nitrate concentrations in the nitracline, deter-   2.3   Flow cytometry
mined as a region of approximately maximum and constant
gradient, and (K z ) is the averaged turbulent mixing over the    Picoplankton samples (1.8 mL) for the determination of pi-
same depth interval. In the Galician coastal upwelling, nitrate   coplankton abundance and cell properties were taken from
diffusive fluxes were estimated over a fixed depth interval us-   three to nine depths and measured immediately onboard
ing the same procedure (10–40 m) except at the shallowest         (TRYNITROP), or preserved with paraformaldehyde plus
stations at which we compute the surface–bottom flux.             glutaraldehyde (P + G) and frozen at −80 ◦ C until analy-
   Most stations carried out in the Galician coastal upwelling    sis in the laboratory (the other cruises). Unfortunately, due
were conducted inside three different rias (Ría de Vigo, Ría      to problems with sample preservation, only heterotrophic
de Pontevedra, and Ría de A Coruña). The rias are coastal         or autotrophic picoplankton subgroup data were available
embayments affected by seasonal wind-driven coastal up-           for the DISTRAL and ASIMUTH cruises, respectively. Two
welling of cold, nutrient-rich North Atlantic Central Water       aliquots from the same sample were used for the study
(Wooster et al., 1976; Fraga, 1981; Álvarez-Salgado et al.,       of picophytoplankton (0.6 mL) and heterotrophic prokary-
1993). The Galician rias, despite being, in general, longer       otes (0.4 mL), analyzed at high (mean 60 µL min−1 ) and
and narrower than many open bays in upwelling areas, they         low (mean 18 µL min−1 ) flow rates for 4 and 2 min, re-
resemble them in that its primary hydrographic and circula-       spectively. Before the analysis, the DNA of heterotrophic
tion features are determined by the extension of wind-driven      prokaryotes was stained with nucleic-acid-specific fluores-
flow on the external continental shelf throughout the bay         cent dye (SYTO-13 or SYBR1). A FACSCalibur flow cy-
(Alvarez-Salgado et al., 2010). Fertilization in the rias oc-     tometer (Becton, Dickinson and Company) equipped with a
curs essentially by coastal upwelling, with fresh and rain        laser emitting at 488 nm was used to measure and count pi-
water inputs being residual (2 %) (Fernández et al., 2016).       coplankton. Autotrophic cells were separated into two groups
The total nitrate supply in the Galician rias was computed        of cyanobacteria (Synechococcus and Prochlorococcus) and
as the sum of nitrate vertical diffusion plus nitrate verti-      one group of small picoeukaryotes, based on their fluores-
cal advection due to coastal upwelling. A simplified esti-        cence and light scatter signals (size scatter, SSC), as ex-
mate of nitrate supply through vertical advection due to up-      plained in Calvo-Díaz and Morán (2006). Two groups of het-
welling was computed considering the Galician rias as single      erotrophic prokaryotes (LNA and HNA) were distinguished
boxes divided into two layers (Álvarez-Salgado et al., 1993),     based on their relative green fluorescence, which was used
the deeper one influenced by upwelled inflowing waters and        as a proxy for nucleic acid content (Gasol and del Giorgio,
the surface layer dominated by the outgoing flow. Assuming        2000; Bouvier et al., 2007).
that the bottom layer volume is conservative and stationary,         In order to estimate biovolume (BV), we used an em-
the vertical advective flux (QZ , m3 s−1 ) would be equiva-       pirical calibration between SSC and cell diameter (Calvo-
lent to the incoming bottom flux (QB , m3 s−1 ), computed         Díaz and Morán, 2006), assuming spherical shape for all
as the product of the upwelling index (IW , m3 s−1 km−1 )         groups. The following volume-to-carbon conversion fac-

www.biogeosciences.net/15/6199/2018/                                                     Biogeosciences, 15, 6199–6220, 2018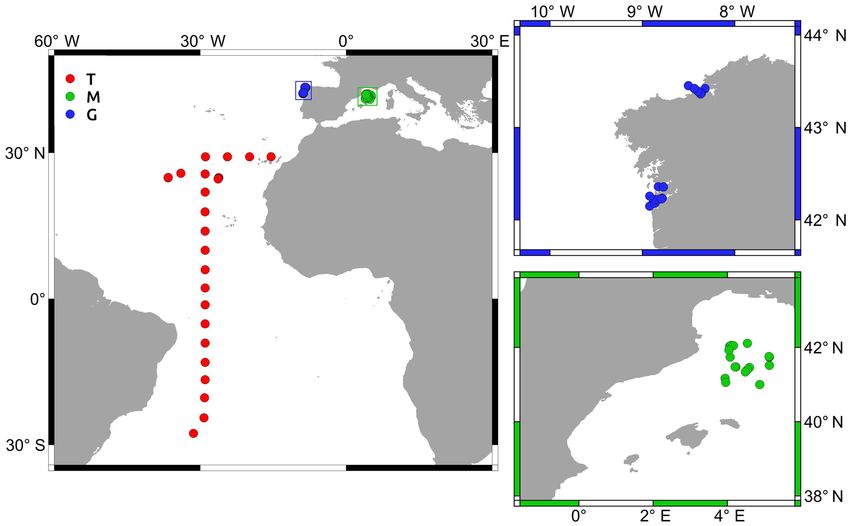
6204 J. L. Otero-Ferrer et al.: Factors controlling picoplankton community structure
tors were used for picoautotrophic groups: 230 fg C BV ated based on explanatory power (explained variance) and
for Synechococcus, 240 fg C BV for Prochlorococcus, and goodness of fit (GOF). GOF was assessed via quantile–
237 fg C BV for picoeukaryotes (Worden et al., 2004). For quantile (QQ) plots of Pearson residuals (provided in SM
bacteria, BV was converted into carbon biomass by using Fig. A2). All calculations were carried out using the mgcv
the allometric relationship: 108.8 fg C BV0.898 (Gundersen package (Wood, 2011) in R (R Core Team, 2015).
et al., 2002). More details about the processing and analysis
of flow cytometry samples are provided in Calvo-Díaz and 2.5 Niche overlap analysis
Morán (2006) (Calvo-Díaz and Morán, 2006, TRYNITROP),
Gomes et al. (2015) (Gomes et al., 2015, FAMOSO), Vil- The estimation of niche overlap among different picoplank-
lamaña et al. (2017) (Villamaña et al., 2017, CHAOS), and ton subgroups based on nonparametric kernel density func-
Moreira-Coello et al. (2017) (Moreira-Coello et al., 2017, tions (NOK ) was calculated following Mouillot et al. (2005):
NICANOR). Abundance data obtained at different depths
Z
1
for each station were combined to compute depth-integrated NOKi,j,t = 1 − fit (x) − fj t (x) dx, (6)
2
biomass for the photic layer.
where NOKi,j,t is the niche overlap between picoplankton
2.4 Generalized additive models subgroups i and j for the environmental factor t, and fit
and fj t are the kernel population density functions of fac-
A generalized additive model (GAM) approach was used to tor t for species i and j , respectively. In order to correct the
predict depth-integrated biomass of each picoplankton sub- correlation among niche predictors, we used the estimator in
group, the contribution of LNA prokaryotes to heterotrophic a dependent sample (EDS) proposed by Kark et al. (2002).
picoplankton, the cyanobacteria-to-picoeukaryote ratio, and To assess the statistical niche differences between sub-
the autotrophic-to-heterotrophic ratio based on observations groups, null model permutation tests were performed to
and estimates of three environmental factors: sea surface verify whether the niche overlaps were significantly lower
temperature (SST), daily surface PAR, and the transport of than 100 % (Geange et al., 2011). When the contribution of
nitrate into the euphotic zone (NO3 flux), including both dif- depth-integrated biomass for each picoplankton subgroup ex-
fusive and advective processes. GAMs assume that the effect ceeded that expected by chance (one-third for autotrophic
of each predictor on the response variable can be described and one-half for heterotrophic picoplankton), niche predic-
by smoothed functions whose effects are additive. Due to the tors for each station were selected. Statistical null distribu-
large number of zero observations, data overdispersion, and tions (the distribution of the statistic test under the null hy-
the need for a single parsimonious model to make predictions pothesis of no niche differentiation) were generated by cal-
for a large number of groups, we assumed that the depth- culating pseudo-values through randomly permuting group
integrated biomass of each picoplankton subgroup, relative labels in the corresponding dataset over 10 000 runs. The dis-
contribution values, and biomass ratios all followed negative tributions of the average niche overlaps for the null model
binomial distributions. Those niche descriptors that did not were then computed. Niche overlap calculations and associ-
follow normal distributions were log transformed. The com- ated null model tests were performed using the density func-
plete model structure for the biomass of each picoplankton tion and the source code provided as supporting information
subgroup was in Geange et al. (2011). All calculations were performed us-
ing R (R Core Team, 2015).
yj = I + s(SST) + s(PAR) + s(log(NO3 Flux)) + Error, (5)
where yj represents the depth-integrated biomass for each pi- 3 Results
coplankton subgroup j , and s a cubic regression spline used
for fitting the observations to the model (Wood, 2006). 3.1 Environmental variables and picoplankton biomass
Generalized models include a function linking the mean
value of yj and the predictors. For those response variables Our database covered a wide environmental gradient from
that followed a negative binomial distribution, the used link oligotrophic to eutrophic conditions. Stations sampled in
function was the natural logarithm. The LNA contribution to the tropical and subtropical Atlantic Ocean (T) were, on
total heterotrophic prokaryotes was adjusted using a Gaus- average, characterized by warm surface waters (26 ± 2 ◦ C,
sian distribution and an identify link (Wood et al., 2016). mean ± SD) where the supply of nitrate through vertical dif-
The inclusion of the different predictors to explain the re- fusion from deeper waters (0.7 ± 1.6 mmol N m−2 d−1 ) and
sponse variable (the biomass of each picoplankton subgroup, surface chlorophyll a were low (0.1 ± 0.1 mg m−3 ) (Table 2
its relative contribution, and biomass ratios) was assessed via and Fig. 2). The Mediterranean Sea, sampled from March
stepwise model selection using the minimum Akaike infor- to September, was characterized by cooler surface waters
mation criterion (Hastie and Tibshirani, 1993). (16 ± 4 ◦ C) and intermediate values of both nitrate vertical
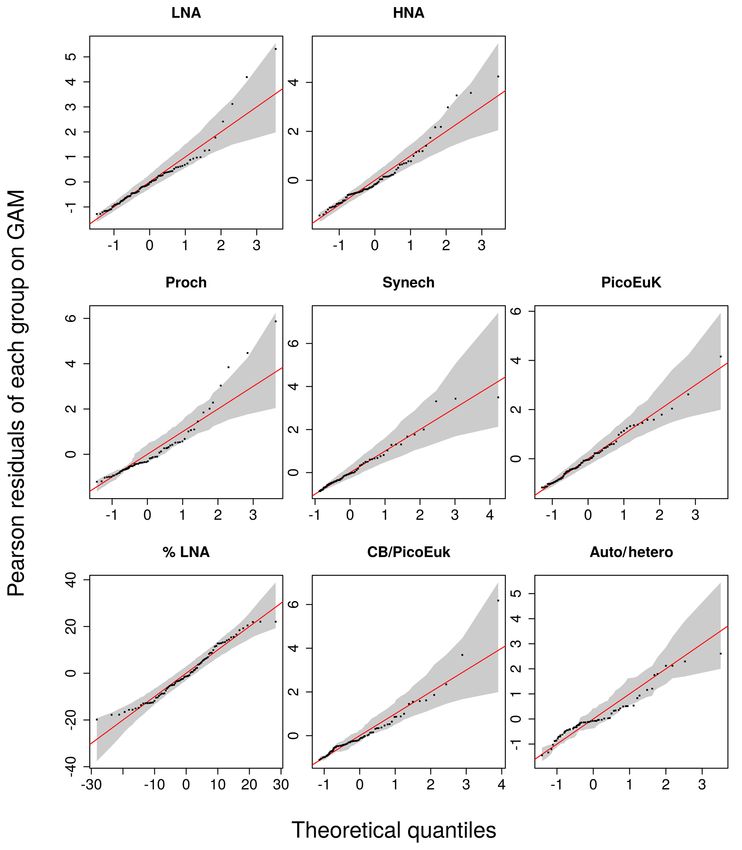
Smooth terms were tested using a Bayesian test (Marra diffusive supply (41 ± 113 mmol N m−2 d−1 ) and also sur-
and Wood, 2012) to prevent overfitting. GAMs were evalu- face chlorophyll a (0.9 ± 0.9 mg m−3 ). Finally, the stations
Biogeosciences, 15, 6199–6220, 2018 www.biogeosciences.net/15/6199/2018/J. L. Otero-Ferrer et al.: Factors controlling picoplankton community structure 6205
Table 2. Mean ± standard deviation of sea surface temperature (SST), surface photosynthetic active radiation (PAR), mixed-layer depth
(MLD), photic layer depth (1 % PAR), surface nitrate concentration (sNO3 ), nitrate gradient, vertical diffusivity (K), nitrate supply (NO3
flux), surface chlorophyll (sChl a), photic layer depth-integrated chlorophyll a (Chl a); biomass (B), abundance (A), and contribution (C)
to total picoplankton biomass (Total Pico B); and surface abundance (s) of LNA and HNA bacteria, Prochlorococcus, Synechococcus and
picoeukaryotes computed for the tropical and subtropical Atlantic Ocean (T), the Mediterranean (M), and the Galician coastal upwelling (G).
MLD was estimated from an increase in water column density of 0.125 Kg m−3 relative to surface values. A nonparametric one-way ANOVA
(Kruskal–Wallis) was performed to test the null hypothesis that independent groups come from the same distribution. The Bonferroni multiple
comparison test was applied a posteriori to analyze the differences between every pair of groups (∗ p < 0.05; ∗∗ p < 0.01; ∗∗∗ p < 0.001).
Variables (units) T M G KW p value Post hoc Bonferroni
SST (◦ C) 26 ± 2 16 ± 4 16 ± 2 < 0.001∗∗∗ T>G>M
PAR (E m−2 d−1 ) 43 ± 23 42 ± 13 39 ± 17 0.69
MLD (m) 61 ± 30 61 ± 71 12 ± 10 < 0.001∗∗ T, M > G
1 % PAR (m) 109 ± 23 62 ± 13 37 ± 17 < 0.001∗∗ T>M>G
sNO3 (µmol m−3 ) 90 ± 77 2414 ± 1635 1601 ± 1604 < 0.001∗∗∗ T < M, G
NO3 gradient (µmol m−4 ) 146 ± 158 90 ± 40 105 ± 100 0.71
K (m2 s−1 ) ×10−3 0.2 ± 0.3 5.3 ± 13.9 0.5 ± 0.8 0.24
NO3 flux (mmol m−2 d−1 ) 0.7 ± 1.6 41 ± 113 30 ± 46 < 0.001∗∗∗ TM>G
Prochl A (cell m−2 ) ×1011 156 ± 121 10 ± 23 0.5 ± 1 < 0.001∗∗∗ T > M, G
Synech A (cell m−2 ) ×1011 7 ± 15 50 ± 49 2±2 < 0.001∗∗∗ TG
PicoEuk A (cell m−2 ) ×1011 1.7 ± 3 2.8 ± 2 1±2 < 0.001∗∗∗ TG
LNA B (mg C m−2 ) 253 ± 105 170 ± 97 43 ± 34 < 0.001∗∗∗ T>M>G
HNA B (mg C m−2 ) 216 ± 127 168 ± 105 108 ± 73 0.02* T>M>G
Prochl B (mg C m−2 ) 482 ± 516 36 ± 84 1.3 ± 4 < 0.001∗∗∗ T > M, G
Synech B (mg C m−2 ) 43 ± 83 576 ± 530 19 ± 26 < 0.001∗∗∗ T, M > G
PicoEuk B (mg C m−2 ) 59 ± 102 86 ± 59 43 ± 59 < 0.001∗∗∗ TG
Total Pico B (mg C m−2 ) 1052 ± 215 1038 ± 485 216 ± 36 < 0.001∗∗∗ T, M > G
LNA C (%) 27 ± 10 18 ± 8 21 ± 9 < 0.001∗∗∗ T > M, G
HNA C (%) 22 ± 12 17 ± 10 55 ± 15 < 0.001∗∗∗ T, M < G
Prochl C (%) 41 ± 16 5 ± 12 1±2 < 0.001∗∗∗ T, M < G
Synech C (%) 4±5 50 ± 24 6±7 < 0.001∗∗∗ T, G > M
PicoEuk C (%) 5±5 10 ± 9 11 ± 9 < 0.001∗∗∗ T < M, G
sampled in the Galician coastal upwelling system, which in- and the Mediterranean (1038 ± 485 mg C m−2 ), compared
cluded year-round samples, were characterized by relatively to the Galician coastal upwelling (216 ± 36 mg C m−2 ) (Ta-
cold surface waters (16±2 ◦ C), enhanced rates of nitrate sup- ble 2). In the tropical and subtropical Atlantic, the contribu-
ply (30 ± 46 mmol N m−2 d−1 ), and high values of surface tion of Prochlorococcus to total picoplankton biomass was
chlorophyll a (2.2 ± 2.5 mg m−3 ). No statistically significant 41 %, followed by LNA (27 %) and HNA (22 %) prokary-
differences were observed in averaged surface PAR among otes, with smaller contributions of Synechococcus and pi-
the three regions. coeukaryotes (< 5 % each). In the Mediterranean, picoplank-
Differences in picoplankton biomass and composition ton biomass was on average dominated by Synechococcus
were also observed among the three domains. Averaged (50 %), followed by LNA and HNA prokaryotes (∼ 17 %
photic layer depth-integrated total picoplankton biomass (in- for each group), picoeukaryotes (10 %), and Prochlorococ-
cluding both LNA and HNA prokaryotes, Prochlorococ- cus (5 %). Finally, HNA (55 %) and LNA (21 %) prokary-
cus, Synechococcus, and picoeukaryotes) was higher in the otes dominated in the Galician coastal upwelling system, fol-
tropical and subtropical Atlantic (1052 ± 215 mg C m−2 )
www.biogeosciences.net/15/6199/2018/ Biogeosciences, 15, 6199–6220, 20186206 J. L. Otero-Ferrer et al.: Factors controlling picoplankton community structure
Figure 2. Box-and-whisker plots of sea surface temperature (SST), surface photosynthetic active radiation (PAR), nitrate supply (NO3 Flux),
surface chlorophyll a concentration (sChl a), and contribution to total picoplankton biomass of low (LNA) and high (HNA) nucleic acid
content bacteria, Prochlorococcus (Proch), Synechococcus (Synech), and small picoeukaryotes (PicoEuk) computed for the tropical and
subtropical Atlantic Ocean (T), the Mediterranean (M), and the Galician coastal upwelling (G). In each box, the central mark indicates the
median, the notches the 95 % confidence interval for the median, and the bottom and top edges of the box the 25th and 75th percentiles,
respectively. The whiskers extend to the most extreme data points not considered outliers, and the outliers are plotted individually using
white circles.
lowed by picoeukaryotes (11 %), Synechococcus (6 %), and itive for all the other subgroups (Fig. 3). Only LNA and
Prochlorococcus (1 %). HNA prokaryotes and Synechococcus exhibited significant,
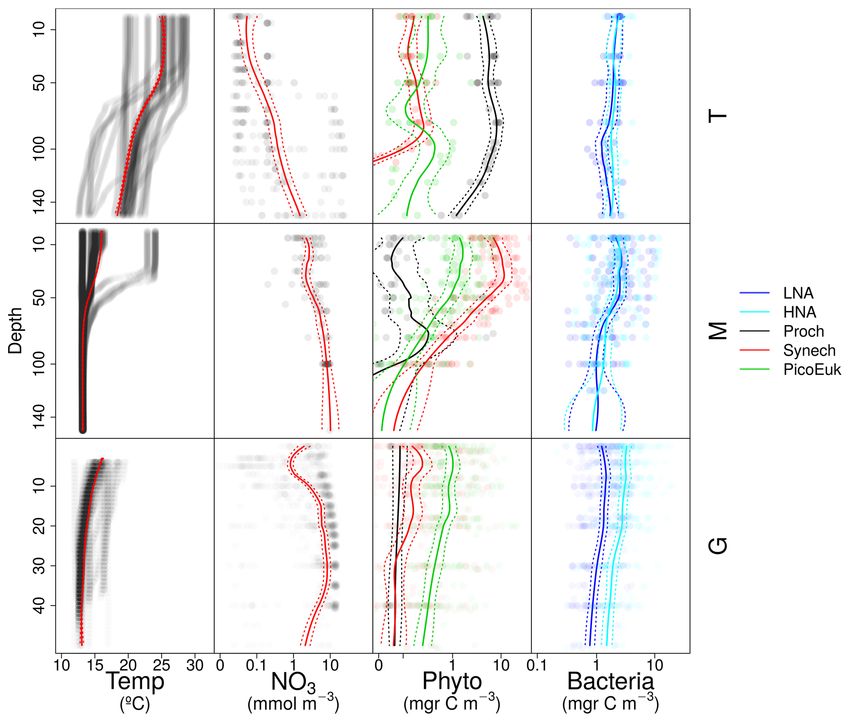
Vertical distributions of temperature, nitrate concentration, positive relationships with surface radiation. All groups ex-
and the biomass of autotrophic and heterotrophic picoplank- cept the picoeukaryotes were negatively correlated with ni-
ton groups for each domain are shown in Fig. A3. trate fluxes. The contribution of LNA prokaryotes to het-
erotrophic picoplankton biomass only exhibited a signifi-
3.2 The role of environmental factors in picoplankton cant negative relationship with nitrate fluxes, whereas the
composition cyanobacteria-to-picoeukaryote ratio was positively corre-
lated with surface temperature and negatively correlated
In order to explore the role of temperature, light, and ni- with nitrate fluxes. Finally, the ratio of autotrophic to het-
trate supply in the composition of the picoplankton com- erotrophic biomass was not linearly correlated with any of
munity, we first used generalized linear models to investi- the studied environmental factors. In order to exclude cross
gate simple linear relationships among each of these fac- correlation among the three environmental factors and con-
tors and the depth-integrated biomass of each picoplank- sider the possibility of nonlinear relationships, we subse-
ton subgroup, the contribution of LNA prokaryotes to het- quently fitted the data to GAMs (Fig. 4 and Table 3). Tem-
erotrophic picoplankton biomass, the ratio of cyanobacteria perature was the only factor included in the models built for
(Prochlorococcus and Synechococcus) to picoeukaryote, and predicting the depth-integrated biomass of all picoplankton
the autotrophic-to-heterotrophic picoplankton ratio (Fig. 3 subgroups. HNA prokaryotes exhibited a positive relation-
and Table 3). All picoplankton groups except picoeukary- ship with temperature above 19 ◦ C, whereas Prochlorococ-
otes exhibited statistically significant relationships with SST. cus and LNA prokaryotes showed a nearly sigmoid curve re-
This relationship was negative for Synechococcus and pos-
Biogeosciences, 15, 6199–6220, 2018 www.biogeosciences.net/15/6199/2018/J. L. Otero-Ferrer et al.: Factors controlling picoplankton community structure 6207
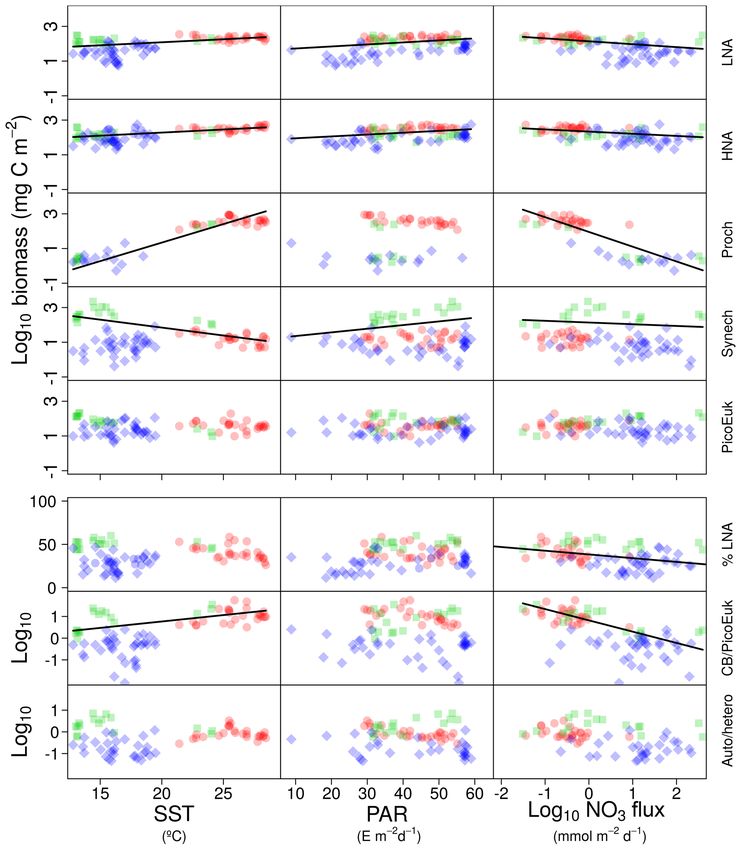
Figure 3. Pair scatter plots representing the relationship among log-transformed depth-integrated biomass for each picoplankton subgroup,
the contribution of bacteria with a low nucleic acid content to heterotrophic picoplankton biomass (%LNA), the ratio of cyanobacteria
(Prochlorococcus + Synechococcus) to picoeukaryote depth-integrated biomass (CB / PicoEuK), and the ratio of autotrophic to heterotrophic
picoplankton biomass (Auto / hetero) versus sea surface temperature (SST), surface photosynthetically active radiation (PAR), and nitrate
flux (NO3 flux). Significant linear relationships are indicated as solid (p value < 0.01) black lines. Samples collected at different regions
are indicated as red dots (tropical and subtropical Atlantic Ocean), green squares (Mediterranean), and blue diamonds (Galician coastal
upwelling).
lationship with a transition between ca. 16 and 25 ◦ C (Fig. 4). contribution of LNA prokaryotes to heterotrophic picoplank-
The relationship between the biomass of both Synechococ- ton biomass and both the cyanobacteria-to-picoeukaryote
cus and picoeukaryotes and temperature showed a nega- biomass ratio and the autotrophic-to-heterotrophic biomass
tive trend until ∼ 20 ◦ C and remained relatively constant ratio. This relationship was negative in the three models.
above this temperature. PAR was included in the models Temperature was also negatively correlated with the contri-
of all picoplankton groups except picoeukaryotes. Whereas bution of LNA prokaryotes to heterotrophic biomass and the
the biomass of Prochlorococcus exhibited a saturation-type ratio of autotrophic to heterotrophic biomass. Finally, PAR
relationship with PAR, heterotrophic prokaryotes and Syne- showed a positive correlation with the contribution of LNA
chococcus showed a linear positive relationship. Finally, only prokaryotes to heterotrophic biomass and the cyanobacteria-
LNA prokaryotes, Synechococcus, and picoeukaryotes ex- to-picoeukaryote biomass ratio.
hibited statistically significant relationships with nitrate sup-
ply. This relationship was negative for LNA prokaryotes and 3.3 Ecological niches for picoplankton groups
Synechococcus, whereas picoeukaryotes showed a unimodal
function, peaking at ∼ 1 mmol NO3 m−2 d−1 . Nitrate flux By using nonparametric kernel density functions, we in-
was the only factor selected in the models to predict the vestigated the overlapping in the ecological niches of the
autotrophic and heterotrophic picoplankton subgroups de-
www.biogeosciences.net/15/6199/2018/ Biogeosciences, 15, 6199–6220, 20186208 J. L. Otero-Ferrer et al.: Factors controlling picoplankton community structure Figure 4. GAM-predicted effects of the response variables (biomass and contribution of picoplankton subgroups) as a smooth function of sea surface temperature (SST), photosynthetically active radiation (PAR), and nitrate flux (NO3 flux). All terms were centered at zero. Significant linear relationships are indicated as solid (p value < 0.01) black lines. Shaded regions represent the 95 % confidence intervals of the smooth spline functions. Intercept values were 4.6 (LNA), 5.1 (HNA), 2.1 (Prochlorococcus), 3.6 (Synechococcus), 3.7 (picoeukary- otes), 36.4 (contribution of LNA to heterotrophic picoplankton, %LNA), 1.4 (cyanobacteria-to-picoeukaryote ratio, CB/PicoEuk), and −0.1 (autotrophic-to-heterotrophic biomass ratio, Auto / hetero). fined by using the three variables previously considered to- trate supply enabled a statistically significant separation of gether with surface nitrate concentration (Fig. 5). Photic the niches of both heterotrophic (HNA and LNA prokary- layer depth-integrated biomass of each picoplankton group otes) and autotrophic (Prochlorococcus, Synechococcus, and was used for this analysis. These results revealed three eco- picoeukaryotes) picoplankton subgroups. Although the min- logical niches in the distribution of picoplankton subgroups. imum overlap between Prochlorococcus and the other au- Prochlorococcus and LNA prokaryotes were more abundant totrophic picoplankton subgroups was also well defined by in warm waters, where nitrate supply was low. HNA prokary- temperature, only nitrate supply could statistically distin- otes and Synechococcus dominated in cooler regions with guish the niche partitioning between the two groups of het- medium to high nitrate supply, and picoeukaryotes were erotrophic prokaryotes (p < 0.05) and between Synechococ- more abundant in cold waters with high nitrate supply. A cus and picoeukaryotes (p < 0.1). large degree of overlapping of the ecological niches for all pi- coplankton subgroups was observed when only surface light was considered. For each picoplankton subgroup Table 4 shows the partial weighted overlap of the ecological niches defined by the four factors: SST, PAR, nitrate flux, and sur- face nitrate concentration. According to these data only ni- Biogeosciences, 15, 6199–6220, 2018 www.biogeosciences.net/15/6199/2018/
J. L. Otero-Ferrer et al.: Factors controlling picoplankton community structure                                                          6209

Table 3. Simple (R 2 ) and adjusted squared correlation coefficients (Adj-R 2 ) for simple linear regression and multiple generalized additive
models (GAMs) built to predict depth-integrated biomass for each picoplankton subgroup, the contribution of LNA bacteria to total het-
erotrophic picoplankton biomass (% LNA), the ratio of cyanobacteria (Prochlorococcus + Synechococcus) to picoeukaryote depth-integrated
biomass (CB / PicoEuK), and the ratio of autotrophic (CB + PicoEuk) to heterotrophic bacteria (LNA + HNA) biomass based on sea surface
temperature (SST), surface photosynthetically active radiation (PAR), and nitrate supply (NO3 flux). Negative binomial distribution was
assumed. Multiple model selection was based on stepwise regression and the Akaike information criterion (see Sect. 2). Only significant
(p value < 0.05) results are shown. Percentage of total effects represents the contribution of each environmental factor to the variability
explained by each GAM model (see Sect. 2).

                         Group                   R 2 simple linear                 Adj-R 2   Percentage of total effects
                                                                                  multiple
                                                                                regression
                                             SST       PAR     NO3 flux                      SST     PAR      NO3 flux
                         LNA                 0.39    < 0.01            0.34          0.55    0.30    0.35          0.35
                         HNA                 0.47      0.05            0.18          0.53    0.52    0.48
                         Proch             < 0.01                    < 0.01          0.86    0.72    0.28
                         Synech              0.11    < 0.01                          0.52    0.53    0.16          0.31
                         PicoEuk                                                     0.23    0.51                  0.49
                         % LNA                         0.05           0.12           0.49    0.39    0.26          0.35
                         CB / PicoEuk        0.25                     0.28           0.40            0.38          0.62
                         Auto / hetero                                               0.29    0.39                  0.61

Figure 5. Kernel density estimates of LNA and HNA bacteria, Prochlorococcus, Synechococcus, and picoeukaryotes based on the considered
niche descriptors: sea surface temperature (SST), surface photosynthetically active radiation (PAR), nitrate flux (NO3 flux), and surface
concentration (sNO3 ).

4     Discussion                                                              these environmental factors in the distribution of, in this case,
                                                                              the two major groups of cyanobacteria. By using a large flow
4.1    Environmental factors and ecological niches                            cytometry dataset from all major ocean regions, Flombaum
                                                                              et al. (2013) concluded that temperature and light were the
Picoplankton community composition and concurrent esti-                       most important predictors of the abundances of Prochloro-
mates of nitrate supply into the euphotic zone from highly                    coccus and Synechococcus, with nitrate availability exert-
contrasting marine environments allowed us to conclude that                   ing a negligible effect. Although this conclusion seems to
SST and nitrate supply are the main factors controlling the                   be contradictory with the results presented here, some im-
variability in the biomass of different subgroups, whereas                    portant differences between these studies should be noted.
surface light generally played a minor role. As far as we                     Firstly, Flombaum et al. (2013) used bulk estimates of sea-
know, only one study had previously investigated the role of

www.biogeosciences.net/15/6199/2018/                                                                  Biogeosciences, 15, 6199–6220, 2018
6210 J. L. Otero-Ferrer et al.: Factors controlling picoplankton community structure
Table 4. Partial weighted niche overlap (%) for each environmental factor and picoplankton subgroup. sNO3 represents surface nitrate
concentration. Asterisks denote the existence of significant differences among niches (∗ p < 0.1, ∗∗ p < 0.05, ∗∗∗ p < 0.01, ∗∗∗∗ p < 0.001).
LNA HNA Proch Synech PicoEuk
SST LNA 100
HNA 85 100
Proch 100
Synech 9∗∗∗∗ 100
PicoEuk 5∗∗∗∗ 84 100
PAR LNA 100
HNA 80 100
Proch 100
Synech 80 100
PicoEuk 74∗∗ 94 100
NO3 Flux LNA 100
HNA 69∗∗ 100
Proch 100
Synech 31∗∗∗∗ 100
PicoEuk 14∗∗∗∗ 77∗ 100
sNO3 LNA 100
HNA 73∗ 100
Proch 100
Synech 22∗∗∗∗ 100
PicoEuk 29∗∗∗∗ 89 100
water nitrate concentration as a proxy for nitrate availability line the physiological and ecological features of the dis-
in the euphotic zone. However, in near-steady-state systems tinct picoplankton functional subgroups. Our results confirm
such as the subtropical gyres, where diffusive nutrient sup- the previously reported ecological differences between the
ply into the euphotic zone is slow, nitrate concentrations are two major groups of unicellular cyanobacteria (Scanlan and
kept close to the detection limit due to phytoplankton uptake. West, 2002; Partensky and Garczarek, 2010; Li, 2009).
For this reason, nitrate concentrations and actual nitrate sup- Moreover, the ecological niche alignment of the two
ply into the euphotic zone in the vast oligotrophic regions cyanobacteria genera with the two heterotrophic prokary-
are often largely disconnected (Mouriño-Carballido et al., otes subgroups is consistent with taxa that prevail in olig-
2011, 2016). Moreover, whereas Flombaum et al. (2013) otrophic regions (e.g., SAR11) being included in the LNA
used Prochlorococcus and Synechococcus abundances deter- prokaryotes, whereas copiotrophic and more diverse taxa
mined at several depths in the upper 200 m, we used depth- (Gammaproteobacteria, Bacteroidetes/Flavobacteria, etc.)
integrated biomass of both autotrophic and heterotrophic pi- are generally grouped under HNA (Vila-Costa et al., 2012;
coplankton subgroups in the photic layer. Schattenhofer et al., 2011). Although the relationship among
Although our results point to both temperature and ni- stratification, mixing, and nutrient supply is not obvious
trate supply as important factors controlling the distribu- (Mouriño-Carballido et al., 2016), our results are in gen-
tion of the picoplankton subgroups (Fig. 4 and Table 3), eral consistent with the patterns described by Bouman et al.
nitrate supply was the only factor that allowed the distinc- (2011). These authors, by using vertical density stratifica-
tion among the ecological niches of autotrophic and het- tion as a proxy for the three main environmental factors in-
erotrophic picoplankton subgroups (Fig. 5 and Table 4). Our fluencing phytoplankton growth (temperature, light, and nu-
attempt to sort out the ecological niches of picoplankton sub- trients) in subtropical regions of the Pacific, Atlantic, and
groups gave rise to three distinct categories. Prochlorococ- Indian oceans, described the dominance of photosynthetic
cus and LNA prokaryotes were more abundant in warmer picoeukaryotes in well-mixed waters and the prevalence of
waters (above 20 ◦ C) where the availability of nitrate was cyanobacteria in strongly stratified conditions.
low. Synechococcus and HNA prokaryotes prevailed mainly
in cooler (below 20 ◦ C) marine environments characterized 4.2 Physiological traits of picoplankton subgroups
by intermediate and high levels of nitrate supply, and fi-
nally, the niche for picoeukaryotes was characterized by low
Although previous studies have revealed that Prochlorococ-
temperatures and high nitrate supply. These results under-
cus may have acquired the ability to use nitrate by horizon-
Biogeosciences, 15, 6199–6220, 2018 www.biogeosciences.net/15/6199/2018/J. L. Otero-Ferrer et al.: Factors controlling picoplankton community structure 6211 tal gene transfer, their photosynthetic activity primarily re- tio increases with decreasing cell size, which narrows the lies on regenerated forms of nitrogen (Moore et al., 2002; nutrient diffusion boundary layer around the cell and facil- Malmstrom et al., 2013). Our results support this view and itates the acquisition of nutrients in nutrient impoverished substantiate that, after controlling for the concurrent effects environments. Second, small-sized cells have lower sinking of light and seawater temperature, Prochlorococcus biomass rates than their larger counterparts, which allow them to ex- was uncorrelated with nitrate fluxes. However, it is important tend their chances of survival in the euphotic layer (Smayda, to note that we could not discriminate between high-light 1980; Chisholm, 1992; Kiørboe, 1993). (HL) and low-light (LL) ecotypes and that the presence of Our analysis indicates that among the picophytoplankton, nitrate reductase seems to be more relevant in LL (Martiny picoeukaryotes were the most responsive to nutrient fluxes. et al., 2009; Berube et al., 2014). Evolutionary adaptation This is consistent with experimental observations under to light-limiting conditions makes Prochlorococcus the most laboratory-controlled conditions revealing that, within the pi- efficient light harvesters among Earth’s photosynthetic or- coplankton size range, the maximum attainable growth rate ganisms (Morel et al., 1993). Their competitive ability under increases with increasing cell size (Raven, 1994; Marañón light-limiting conditions could explain the negative effect of et al., 2013). This positive relationship between maximum light as a predictor for Prochlorococcus biomass. Ultimately, growth rate and cell size in the picophytoplankton to small the photo-physiological strategy of Prochlorococcus leads nanophytoplankton size range has been explained as a trade- to (i) thermal sensitivity of photosystem II (Mackey et al., off between intracellular nitrogen quotas (N requirements) 2013), which limits its fundamental niche to temperatures and mass-specific nitrate uptake rates (N uptake) (Marañón greater than 15 ◦ C (Moore et al., 1995), and (ii) high sensi- et al., 2013). Whereas nitrogen uptake rate exhibits an iso- tivity to ultraviolet (UV) radiation in surface waters (Llabrés metric relationship with cell size, smaller picoplankton cells et al., 2010; Mackey et al., 2013; Sommaruga et al., 2005). have substantially larger intracellular nitrogen quotas, which This could explain that, after removing the effect of light, reduce their capability to maximize carbon-specific growth our data analysis revealed that the effect of temperature on rates. Conversely, high maximum growth rates represent an Prochlorococcus biomass showed a sigmoid relationship as advantage for picoeukaryotes, compared to any other organ- temperature increased. ism, as they attenuate the effect of loss processes such as Synechococcus is able to use both new and regenerated predation or the washout of plankton communities in highly forms of nitrogen (Moore et al., 2002; Mulholland and Lo- dynamic, turbulent systems (Sherr et al., 2005; Echevarría mas, 2008), which largely explains its wider geographical et al., 2009). For instance, microzooplankton is thought to distribution range (Flombaum et al., 2013). The fact that it is maintain the biomass of their prey under tight control, and more abundant at intermediate levels of nitrate supply is con- thus slight variations in picophytoplankton growth rate may sistent with the lower intracellular nitrogen quota of Syne- substantially alter the resulting biomass of the different pico- chococcus relative to Prochlorococcus and hence their higher phytoplankton subgroups (Chen et al., 2009). growth rate under saturating nutrient conditions (Marañón The unimodal relationship observed between the biomass et al., 2013). Conversely, the large affinity of Prochlorococ- of picoeukaryotes and nitrate supply (Fig. 4) could seem at cus to acquire nutrients (Partensky and Garczarek, 2010) and first contradictory with the rising hypothesis proposed by absorb light under severe nutrient- and light-limiting condi- Barber and Hiscock (2006), which describes that improved tions (Mella-Flores et al., 2012) precludes the supremacy of growth conditions benefit all phytoplankton size classes, in- Synechococcus in warm and stratified oligotrophic systems cluding picoplankton. In this regard, Brewin et al. (2014) (Moore et al., 2007). Although Prochlorococcus and Syne- by using data collected along the Atlantic Meridional Tran- chococcus are not very different in cell size and they usu- sect cruises showed that < 2 µm size-fractionated chloro- ally coexist in oligotrophic regions, differences in adapta- phyll was positively correlated with total chlorophyll only tion to light conditions and UV stress lead to segregate their until a value of 1 mg m−3 , and then it did not show any pos- maximal distributions across space (vertical segregation) and itive relationship with total chlorophyll. It is also important through time (Chisholm, 1992; Mella-Flores et al., 2012). to note that surface abundance of picoplankton subgroups re- Picoeukaryotes, like Synechococcus, also exhibited a neg- ported in our study, which are consistent with previous obser- ative relationship with seawater temperature, again reflecting vations (Zubkov et al., 2000; Frojan et al., 2014; Teira et al., the superior competitive ability of Prochlorococcus under se- 2015), did show higher surface abundance of picoeukary- vere nutrient-limiting conditions (Moore et al., 2007). The otes in the Galician coastal upwelling and the Mediterranean relative dominance of cyanobacteria in oligotrophic systems compared to the tropical and subtropical Atlantic (Table 2 results from the fact that cyanobacteria are less negatively and Fig. A3). However, this pattern was diluted when depth- affected by nutrient diffusion limitation than picoeukaryotes integrated biomasses were computed since the lower limit for (Chisholm, 1992). It is widely accepted that small cells are the integration (the base of the photic zone) was much shal- at an advantage over large cells in stratified open-ocean envi- lower in the coastal upwelling domain (ca. 37 m) compared ronments, where nutrient recycling dominates biogeochem- to the Mediterranean (ca. 62 m) and the tropical and subtrop- ical fluxes (Raven, 1998). First, the surface-to-volume ra- ical regions (ca. 109 m). www.biogeosciences.net/15/6199/2018/ Biogeosciences, 15, 6199–6220, 2018
You can also read


