Heterogeneous ice nucleation on dust particles sourced from nine deserts worldwide - Part 2: Deposition nucleation and condensation freezing
←
→
Page content transcription
If your browser does not render page correctly, please read the page content below
Atmos. Chem. Phys., 19, 1059–1076, 2019
https://doi.org/10.5194/acp-19-1059-2019
© Author(s) 2019. This work is distributed under
the Creative Commons Attribution 4.0 License.

Heterogeneous ice nucleation on dust particles sourced from nine
deserts worldwide – Part 2: Deposition nucleation and
condensation freezing
Yvonne Boose1,a , Philipp Baloh2 , Michael Plötze3 , Johannes Ofner4 , Hinrich Grothe2 , Berko Sierau1 ,
Ulrike Lohmann1 , and Zamin A. Kanji1
1 Institute for Atmospheric and Climate Science, ETH Zürich, Zürich, Switzerland
2 Institute for Materials Chemistry, TU Wien, Vienna, Austria
3 Institute for Geotechnical Engineering, ETH Zürich, Zürich, Switzerland
4 Institute for Chemical Technologies and Analytics, TU Wien, Vienna, Austria
a now at: Institute of Atmospheric Physics, German Aerospace Center, Wessling, Germany

Correspondence: Yvonne Boose (yvonne.boose@alumni.ethz.ch) and Zamin A. Kanji (zamin.kanji@env.ethz.ch)

Received: 29 September 2018 – Discussion started: 16 October 2018
Revised: 22 December 2018 – Accepted: 11 January 2019 – Published: 28 January 2019

Abstract. Mineral dust particles from deserts are amongst           ished, likely by semi-volatile species covering ice nucleation
the most common ice nucleating particles in the atmosphere.         active sites of the minerals. This study shows that in addi-
The mineralogy of desert dust differs depending on the              tion to mineralogy, other factors such as organics and crystal
source region and can further fractionate during the dust           water content can alter the ice nucleation behavior of desert
emission processes. Mineralogy to a large extent explains           aerosol during atmospheric transport in various ways.
the ice nucleation behavior of desert aerosol, but not entirely.
Apart from pure mineral dust, desert aerosol particles often
exhibit a coating or are mixed with small amounts of bio-
logical material. Aging on the ground or during atmospheric         1   Introduction
transport can deactivate nucleation sites, thus strong ice nu-
cleating minerals may not exhibit their full potential. In the      The ice phase in clouds causes one of the largest uncer-
partner paper of this work, it was shown that mineralogy de-        tainties for understanding the role of clouds in the present
termines most but not all of the ice nucleation behavior in         climate and for projecting future climate (Boucher et al.,
the immersion mode found for desert dust. In this study, the        2013). While it is known that for the initial formation of ice
influence of semi-volatile organic compounds and the pres-          in clouds warmer than 235 K certain aerosol particles, so-
ence of crystal water on the ice nucleation behavior of desert      called ice nucleating particles (INPs), are necessary, many
aerosol is investigated. This work focuses on the deposition        aspects of heterogeneous ice nucleation remain poorly un-
and condensation ice nucleation modes at temperatures be-           derstood (Coluzza et al., 2017; Kanji et al., 2017). Min-
tween 238 and 242 K of 18 dust samples sourced from nine            eral dust is thought to be the most prevalent INP type in
deserts worldwide. Chemical imaging of the particles’ sur-          the atmosphere (Hande et al., 2015). Schaefer (1949) found
face is used to determine the cause of the observed differ-         naturally occurring mineral dust particles to nucleate ice at
ences in ice nucleation. It is found that, while the ice nu-        temperatures T < 258 K. Cozic et al. (2008) and Kamphus
cleation ability of the majority of the dust samples is dom-        et al. (2010) detected mineral dust in ice crystal residuals
inated by their quartz and feldspar content, in one carbona-        in mixed-phase clouds. In these clouds the most common
ceous sample it is mostly caused by organic matter, poten-          ice nucleating mechanisms are likely immersion and contact
tially cellulose and/or proteins. In contrast, the ice nucleation   freezing. Both mechanisms require a cloud droplet to form
ability of an airborne Saharan sample is found to be dimin-         first and an INP to either initiate freezing from the inside of

Published by Copernicus Publications on behalf of the European Geosciences Union.
1060                        Y. Boose et al.: Ice nucleation on dust particles sourced from nine deserts worldwide – Part 2

the droplet (immersion) or via contact with the surface of        The nature of these active sites is still under debate. It is
the droplet (contact freezing). Cziczo et al. (2013) observed     suspected that they are associated with high energy defects
mineral dust also in ice crystal residuals in cirrus clouds.      in the lattice structure such as steps, cracks, and impurities
When the relative humidity (RH) with respect to ice is high       (Fletcher, 1969; Marcolli et al., 2007) or crystal boundaries
enough (e.g., RHi > 140 % at 238 K), ice forms via homo-          in twinned crystals (Harrison et al., 2016) where a (100) crys-
geneous freezing of solution droplets without the help of an      tal plane is exposed to water or vapor (Kiselev et al., 2017).
INP (Koop et al., 2000). At lower RH ice may form via im-         Whale et al. (2017) found that feldspars with perthitic micro-
mersion freezing on INPs in solution droplets (Zuberi et al.,     texture, i.e., intergrowth of sodic alkali feldspar into a host
2002) or via the deposition mode, where ice nucleation oc-        of K-feldspar, have the highest ice nucleating ability. Berner
curs on an INP directly from the vapor phase (Vali, 1985; Vali    and Holdren (1977) observed weathering to occur primar-
et al., 2015). Condensation freezing is understood as freezing    ily at excess energy sites on the feldspar surface. During at-
occurring during the formation of a liquid phase, when wa-        mospheric transport, such chemical weathering processes or
ter saturation is exceeded but before a droplet has formed.       aging could alter the ice nucleation activity of feldspar par-
Recently, the differentiation between condensation and im-        ticles compared to those on the ground or freshly cleaved
mersion freezing has been questioned (Marcolli, 2014; Vali        crystals used in laboratory studies (Atkinson et al., 2013;
et al., 2015). Furthermore, it has been suggested that freezing   Yakobi-Hancock et al., 2013; Harrison et al., 2016; Kiselev
at water subsaturated (RHw < 100 %) conditions, referred to       et al., 2017). By implementing parameterizations for marine
as deposition nucleation, may in some cases be explained by       organics and feldspar INPs into their global model, Vergara-
condensation and subsequent freezing of water in pores on         Temprado et al. (2017) found indications that terrestrial INP
the particles’ surface (pore condensation and freezing – PCF;     concentrations could be dominated by feldspar. However, at-
Marcolli, 2017).                                                  mospheric aging effects were not taken into account. Thus,
   Mineral dust is thought to have an influence on cloud mi-      feldspar has the potential to be the most important ice nu-
crophysical processes on a global scale, with global dust         cleating mineral in the atmosphere, but its atmospheric rele-
emission rate estimates of up to 5 Pg yr−1 (Engelstaedter         vance is yet to be confirmed.
et al., 2006, and references therein). DeMott et al. (2003)          Atmospheric aging processes are challenging to observe in
found increased concentrations of INPs in air masses over         situ, thus several laboratory studies have mimicked potential
Florida which carried Saharan dust, while Creamean et al.         aging processes. These processes often modify the surface of
(2013) observed precipitation in California to be influenced      dust particles and, as such, the ice nucleation ability of min-
by dust from Asia and the Sahara. Over Europe, Chou et al.        eral dust. Zolles et al. (2015) could block and unblock surface
(2011) and Boose et al. (2016a) found periods of Saharan          ice nucleation sites with selected organic molecules. Sulfuric
dust advection to coincide with increased INP concentrations      acid coating leads to a reduction in the ice nucleation ability
under mixed-phase cloud conditions. Even at the South Pole,       of mineral dust (Sullivan et al., 2010; Augustin-Bauditz et al.,
Kumai (1976) identified about 60 % of ice crystal residuals       2014), the exposure to low amounts of ozone increases it
to be clay minerals.                                              (Kanji et al., 2013), and coatings of organic aerosol make no
   For several decades, clay minerals were believed to be re-     difference to it in condensation mode (Koehler et al., 2010;
sponsible for the ice activity of mineral dust, mainly due        Kanji et al., 2018). The presence of ammonium sulfate has
to their high mass fraction in airborne dust. Recently, K-        been suggested to improve the ice nucleation ability of Saha-
feldspars have been identified to nucleate ice at warmer tem-     ran dust advected to Tenerife (Boose et al., 2016b). Recently,
peratures or lower relative humidity than all other miner-        Kumar et al. (2018a) and Whale et al. (2018) confirmed that
als, both in the immersion mode (Atkinson et al., 2013;           very dilute ammonium salt solutions (< 1 mol kg−1 ) increase
Zolles et al., 2015) as well as in the deposition and con-        the ice nucleation temperature of microcline by 3 to 4.5 K.
densation modes (Yakobi-Hancock et al., 2013). Paramonov          While surface-collected dust particles from the Sahara were
et al. (2018) found the K-feldspar content to correlate well      found to have negligible amounts of nitrate or sulfate, a high
with the ice nucleation activity of dust at temperatures be-      degree of mixing of nitrate and/or sulfate with mineral dust
tween 238 and 243 K for three dust samples from Iceland,          was observed after advection to Cape Verde, Tenerife, or Ire-
China, and the Himalayas. While Kaufmann et al. (2016)            land (Kandler et al., 2007; Dall’Osto et al., 2010).
found K-feldspar in only one out of eight dust samples col-          Residues from ice nucleating biological material such as
lected in potential atmospheric dust source regions in South      fungal proteins or nanoscale pollenaceous INPs have been
America, Asia, and Africa, we observed K-feldspar to be           observed to adsorb to mineral dust while retaining their
present in all but one sample from a collection of 21 samples     ice nucleation ability (Schnell, 1977; Conen et al., 2011;
from deserts around the world (Boose et al., 2016c). Further-     Augustin-Bauditz et al., 2016; O’Sullivan et al., 2015, 2016).
more, feldspars are prone to chemical weathering processes        Even though desert soils contain typically < 1 % organic
in acids or water which may passivate certain active sites        matter due to the low average annual precipitation (Troeh
and decrease the feldspar’s ice nucleation activity (Augustin-    and Thompson, 2005), long-range transport of dust has
Bauditz et al., 2014; Wex et al., 2014; Harrison et al., 2016).   been suggested to efficiently disperse bacteria on a global

Atmos. Chem. Phys., 19, 1059–1076, 2019                                            www.atmos-chem-phys.net/19/1059/2019/
Y. Boose et al.: Ice nucleation on dust particles sourced from nine deserts worldwide – Part 2                             1061

scale (Hara and Zhang, 2012). Enriched fluorescent particle       ice nucleation behavior. In addition to the samples studied
concentrations, an indication for enriched biological mate-       in the partner paper (Boose et al., 2016c), three more air-
rial, were found in long-range transported Saharan dust by        borne Saharan samples are investigated. Comparing the in to-
Kupiszewski et al. (2015) in ice crystal residuals from mixed-    tal seven airborne Saharan samples to in situ measurements
phase clouds in the Swiss Alps and in condensation-mode           in the Saharan Air Layer, we find low variability in the ice
INPs at 241 K by Boose et al. (2016b) on the Canary Islands.      nucleation behavior of dust from different sources. Further-
In contrast to biological material, secondary organic aerosol     more, we show that airborne samples containing orthoclase
coatings have been observed to decrease the ice nucleation        are similarly active at the studied temperatures to those con-
ability of dust particles in the laboratory in deposition mode    taining microcline.
(Möhler et al., 2008) but not in condensation mode (Koehler
et al., 2010; Kanji et al., 2018).
   In a partner paper to this work (Boose et al., 2016c) we in-   2     Methods
vestigated the immersion-mode ice nucleation activity of air-
borne dust samples, which were collected after atmospheric        2.1    Dust sample origins and processing
transport or sampled from the surface in deserts. We showed
that the K-feldspar fraction, i.e., the fraction of microcline    In this part of the series we present ice nucleation measure-
plus orthoclase, of these dust samples correlates well with       ments of 18 dust samples. Seven airborne samples were col-
the ice-active surface site density in the immersion mode at      lected after advection from the Sahara. Four of the airborne
T = 253 K. At T ≤ 245 K the best correlation of the ice nu-       samples were collected directly from the air in August 2013
cleation activity was found for the bulk quartz plus feldspar     and 2014 at the Izaña observatory in Tenerife, Spain, us-
(microcline, orthoclase, and plagioclase) content in the dust     ing a custom-made large cyclone (Advanced Cyclone Sys-
samples, while the fraction of clays was negatively corre-        tems, S.A.: flow rate of 200 m3 h−1 and D50 = 1.3 µm, the
lated with the ice nucleation activity. Quartz alone has been     diameter at which the collection efficiency is 50 %). The re-
found to show various immersion-mode ice nucleation activ-        maining three airborne samples were collected by deposition
ities in laboratory studies. Zolles et al. (2015) found quartz    on solar panels or roofs in April 2014 (Crete and Pelopon-
being active at temperatures comparable to microcline, while      nese, Greece) and on 10 May 2010 (Aburdees, Egypt). Nine
Atkinson et al. (2013) measured ice nucleation activity be-       samples were collected from the surface in the following
low feldspar temperatures but above those of clay. Kaufmann       deserts: (i) the Atacama desert in Chile; (ii) a location ap-
et al. (2016), in contrast, only observed ice nucleation ac-      proximately 70 km from Uluru in Australia; (iii) the Great
tivity at temperatures comparable to or lower than those of       Basin in Nevada and (iv) the Mojave desert in California,
clays. These differences in ice nucleation ability can be re-     USA; (v) a Wadi in the Negev desert, approximately 5 km
lated to the history of the quartz samples and different ways     from Sde Boker in Israel; (vi) dunes in the Sahara, close to
of pre-processing them (Zolles et al., 2015). Milling quartz      Merzouga in Morocco; (vii) dunes in the Arabian desert in
samples leads to a breakup of Si−O−Si bridges on the sur-         Dubai; (viii) the Etosha pan in Namibia, a dry salt pan; and
face, leading to the formation of Si−OH and Si−O−OH in            (ix) the Taklamakan desert in China. A map showing the lo-
the presence of water vapor, which increases the ice nucle-       cations is provided in Boose et al. (2016c). Before arriving to
ation activity of the quartz particles (Kumar et al., 2018b).     the laboratory, samples were stored in various ways: Samples
Quartz is the most abundant mineral on Earth and is widely        collected from the surface were typically stored for several
spread in various soils. It is highly resistant to chemical and   weeks in PET bottles or other plastic containers. Airborne
mechanical weathering (Goldich, 1938), the latter leading         samples were stored in polypropylene tubes and sealed with
to its abundance increasing with particle size. But quartz is     paraffin wax tape. In the laboratory, all samples were stored
also found, to a lower degree, in smaller sized dust parti-       in the dark at room temperature in polypropylene tubes af-
cles (e.g., 11 % volume fraction of 1.6 µm sized particles over   ter pre-processing (sieving and milling, see below). While
Morocco; Kandler et al., 2009).                                   changes in the ice nucleating ability due to water uptake, loss
   The current paper focuses on the ice nucleation behavior       of volatile material, or growth of biological material which
at 238–242 K of airborne and surface-collected dust samples.      may occur during storage cannot be excluded, they are as-
We investigate ice nucleation at a constant temperature while     sumed to be minor, because the samples were collected and
RH is increased from ice saturation to above water satura-        stored under dry conditions, hardly exposed to air, and kept
tion. While the partner paper (Boose et al., 2016c) showed        at a lower temperature than at which they were collected. The
that mineralogy explains most but not all of the observed         Israel sample and the Etosha sample are from the same batch
ice nucleation behavior of desert dust, this paper focuses on     as those studied in Kaufmann et al. (2016). The surface-
the role of compounds other than the pure minerals for ice        collected samples were sieved with a cascade of dry sieves
nucleation. We use thermogravimetric analysis and chemi-          (Retsch Vibratory Sieve Shaker AS 200) with 32 µm diam-
cal imaging methods to highlight the effect of other entities     eter being the smallest cutoff size. Most samples only con-
mixed with the dust, such as organic material or soot, on the     tained a few weight percent in this size range. The Australia

www.atmos-chem-phys.net/19/1059/2019/                                              Atmos. Chem. Phys., 19, 1059–1076, 2019

1062                        Y. Boose et al.: Ice nucleation on dust particles sourced from nine deserts worldwide – Part 2

and Morocco samples were milled using a vibratory disc mill       (2016c). During an experiment Ave,w was reduced by be-
(Retsch, model RS1), as the fraction of particles in the sub-     tween 6 % to 24 % due to a faster sedimentation of larger
32 µm size range was too low for ice nucleation experiments.      particles in the aerosol tank. The Great Basin sample was
Particles in the lowest available size bin (32–64 µm) of the      coarser than the other samples and settled out faster. There-
Morocco sample were milled. The Australia sample was first        fore two refills were necessary, and Ave,w varied by 64 %.
sieved with a coarse, millimeter-range sieve to separate any
large material, and the remaining smaller fraction was milled.    2.3   Mineralogical, thermogravimetric, and
For the Israel and the Atacama dusts, a sieved and a milled             morphology analysis
sample were included in the study. The Israel sample was first
sieved, and part of a sub-32 µm fraction was milled, while in     The quantitative mineralogical composition of the bulk dust
case of the Atacama sample part of the initial, unsieved batch    samples was investigated with the X-ray diffraction (XRD)
was milled.                                                       Rietveld method (Rietveld, 1969) using a Bragg–Brentano
   To investigate if the ice nucleation activity of the sam-      diffractometer (Bruker AXS D8 Advance with Cu Ka ra-
ples is influenced by biological particles internally or ex-      diation). The qualitative-phase composition was determined
ternally mixed with the dust or by organic coatings on the        with the software DIFFRACplus (Bruker AXS). On the basis
dust particle surface, selected samples were heated to 300 ◦ C    of the peak positions and their relative intensities, the mineral
and stayed at this temperature for 10 h before the ice nucle-     phases were identified in comparison to the PDF-2 database
ation experiments. At this temperature proteinaceous mate-        (International Centre for Diffraction Data). The quantitative
rial, such as bacterial and fungal INPs, should be denatured      composition was calculated by means of Rietveld analy-
(Pouleur et al., 1992), and the majority of organic material,     sis of the XRD pattern (Rietveld program AutoQuan, GE
such as glucose, is combusted and evaporated (Kristensen,         SEIFERT; Bergmann et al., 1998; Bish and Plötze, 2011).
1990, and references therein).                                    Due to the small amount of the dust sample, it was not pos-
                                                                  sible to do a mineralogical analysis of the identical size frac-
2.2    Dust particle generation and size distribution             tion as in the tank (< 2.5 µm). Instead, the entire size fraction
                                                                  of the airborne and the milled samples, and the sub-32 µm
Dust particles were dry dispersed using a rotating brush gen-     fraction of the sieved samples, was used. The measured min-
erator (RBG, Palas, model RBG 1000) with N2 (5.0) as car-         eralogical composition is provided in Boose et al. (2016c),
rier gas into a 2.78 m3 stainless steel aerosol reservoir tank    and that of the additional Tenerife samples is provided in Ta-
(Kanji et al., 2013) via a cyclone that confined the dust size    ble 1. The Tenerife2014_1 sample was additionally measured
distribution to below D50 = 2.5 µm. Total particle concen-        by Powder XRD (Panalytical XPert Pro) in Bragg–Brentano
tration was monitored using a condensation particle counter       geometry, equipped with a copper anode providing Cu Ka ra-
(CPC; TSI model 3772). The tank was filled with particles up      diation. A diffractogram was recorded before and after heat-
to a concentration of 1200 cm−3 , which decreased steadily        ing the sample to 300 ◦ C for 10 h on a silicon sample carrier.
to about 300 cm−3 over approximately 10 h. The tank was              Thermogravimetric analysis (TGA) of six of the dust sam-
cleaned before an experiment by repeatedly evacuating and         ples was conducted by gradually heating the dust samples
purging it with N2 until the particle concentration decreased     from 40 to 300 ◦ C at 10 K min−1 and continuously record-
to 30–90 cm−3 .                                                   ing the mass of the samples in a thermogravimetric analyzer
   The particle size distribution of all samples was measured     (Model Pyris 1 TGA, PerkinElmer). During the temperature
with a scanning mobility particle sizer (SMPS; TSI; DMA           scan, the samples were under a constant nitrogen flow of
model 3081, CPC model 3010) for mobility diameters (dm )          20 mL min−1 .
between 12 and 615 nm and an aerodynamic particle sizer              The morphology of one sample was investigated using
(APS; TSI; model 3321) for aerodynamic diameters (daer )          scanning electron microscopy (SEM; FEI Quanta 250 FEG,
between 0.5 and 20 µm. The mobility and aerodynamic diam-         ThermoFisher Scientific).
eters were converted to volume equivalent diameter (dve ) by
assuming a typical dust particle density of ρ = 2.65 g cm−3       2.4   Chemical imaging: ATR spectrometry and Raman
(Hinds, 1999; Kandler et al., 2007; Hiranuma et al., 2015a)             mapping
and optimizing the shape factor χ to receive the best overlap
of two size distributions measured by the SMPS and APS.           Attenuated total reflection infrared (ATR-IR) spectroscopy
This yielded χ = 1.36, which is in the range of earlier stud-     was carried out on an FTIR (Bruker Vertex 80v) equipped
ies (Hinds, 1999; Alexander, 2015; Hiranuma et al., 2015a).       with an ATR cell (Pike GladiATR, diamond ATR crystal).
Assuming spherical particles, the area size distribution was      The beam path of the spectrometer and the optical parts of
calculated and fitted with a bimodal log-normal distribution.     the ATR cell are under a vacuum (1.65 mbar) to minimize
The mean particle surface area (Ave,w ) was calculated from       the influence of water vapor and CO2 . The crystal where the
the resulting fit for each sample. Four size distributions and    sample is placed sits in a cell that is flushed with nitrogen
the fit parameters for all samples are provided in Boose et al.   gas before and through the measurement for the same rea-

Atmos. Chem. Phys., 19, 1059–1076, 2019                                            www.atmos-chem-phys.net/19/1059/2019/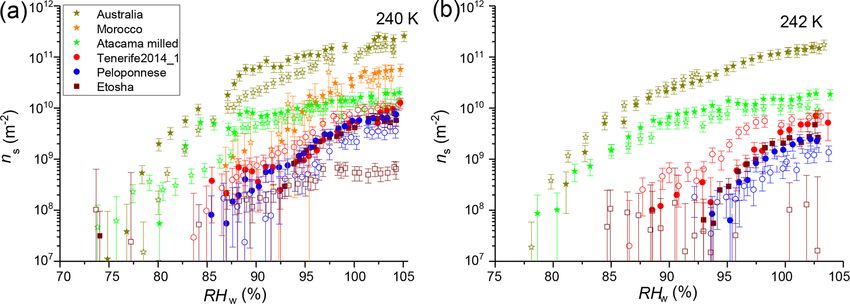
Y. Boose et al.: Ice nucleation on dust particles sourced from nine deserts worldwide – Part 2                                          1063

Table 1. Mineralogical composition in wt % of airborne Saharan dust samples. Crete, Egypt, Tenerife2013 (Tenerife in Part 1), and Pelo-
ponnese as in Boose et al. (2016c). Results were rounded to the nearest integer from the original Rietveld fit results, thus total composition
6= 100 wt % may occur.

         Mineral         Crete    Egypt     Tenerife2013     Tenerife2014_1     Tenerife2014_2     Tenerife2014_3        Peloponnese
         Calcite            25        29                7                  4                   6                     6           33
         Chlorite            4         8                2                  3                   2                     1            3
         Dolomite            3         8                2                  2                                         2            5
         Gypsum              4         6                2                  1                   3                     2
         Halite              1         4                                                       2                     1
         Hematite            1                          1                  2                   1                     1            1
         Illite                                         6                 16                   7                     9           13
         Kaolinite          12        11               16                 18                  13                    14            8
         Microcline                                     4                                      5                     5
         Muscovite            9        8                7                  7                   7                     8            5
         Orthoclase           5        4                                   4                                                      4
         Palygorskite         5                         2                  2                   3                     3            5
         Plagioclase          7                         4                  8                   6                     5            5
         Smectite                                      32                 23                  32                    30
         Quartz             23        23               14                 12                  13                    14           18

son. A liquid-nitrogen-cooled MCT detector is used for spec-             105 %) is reached. If ice nucleation occurs under these con-
tra acquisition. Spectra of the samples were recorded before             ditions, ice crystals grow on the INPs and are detected in the
and after a heat treatment. For the heat treatment the sam-              lower part of the chamber by an optical particle counter. As
ples were placed for 10 h into a laboratory oven at 300 ◦ C.             the ice nucleation mechanisms cannot be identified visually
The spectral window was set between 700 and 4000 cm−1 ,                  in the PINC we refer to the deposition mode at RHw < 100 %
with a resolution of 1 cm−1 . Spectra for the Tenerife2014_1,            and to condensation freezing at RHw > 100 %. We use these
Etosha, and Australia samples were recorded this way. Ra-                relative-humidity-based thermodynamic regimes as an oper-
man images were recorded on a confocal Raman spectrome-                  ational definition, which does not exclude the possibility of
ter (WITec alpha300 RSA+) using a 488 nm laser, 50× mag-                 PCF to occur at RHw < 100 % (Marcolli, 2017). Condensa-
nification, grating of 600 lines per millimeter, and a laser             tion mode refers here to the conditions above water satura-
power of 4.7 mW. For Raman imaging the dust was impacted                 tion where full droplet activation prior to freezing cannot be
on a clean aluminium surface as described in Ofner et al.                guaranteed.
(2017) and subsequently mapped with the aid of a Piezo XY                   In the deterministic concept (Langham and Mason, 1958)
stage. Raman mappings were carried out before and after the              ice nucleation is assumed to take place at so-called ice nucle-
same heat treatment as that for the ATR-IR measurements.                 ation active sites on the particle’s surface (Vali, 1966). The
The Etosha and Australia samples were mapped with this                   probability of such a site being present on a particle and thus
method.                                                                  of the particle to nucleate ice at a certain temperature scales
                                                                         with the particle’s surface area (Archuleta et al., 2005; Con-
2.5   Deposition and condensation nucleation                             nolly et al., 2009; Welti et al., 2009). To account for this de-
      experiments and data treatment                                     pendency and compare the ice nucleation ability of the dif-
                                                                         ferent dust samples the ice-active surface site density ns was
Ice nucleation experiments were conducted with the portable              calculated:
ice nucleation chamber (PINC; Chou et al., 2011; Boose
et al., 2016a). Aerosol particles are sampled from the tank,                      ln(1 − AF)          INP
                                                                         ns = −                ≈                ,                         (1)
dried, and introduced into the chamber, where they are lay-                          Ave,w         Ntot Ave,w
ered between two particle-free sheath air flows. Before an
experiment, the two chamber walls are coated with a thin                 with the total particle concentration Ntot and the activated
layer of ice. During an experiment a temperature gradient is             fraction AF given by INP/Ntot . The approximation is only
applied between the walls, leading to diffusion of water va-             valid for AF < 0.1, which is the case in this study. As aerosol
por and heat. A linear gradient of temperature and the partial           particles larger than 1 µm were in the size range of the ice
pressure of water vapor between the walls leads to supersat-             crystals and could not be differentiated based on size in the
uration with respect to ice. At a constant aerosol layer tem-            optical particle counter spectra, the ns was corrected by sub-
perature, the RH is raised at a constant rate until supersatura-         tracting the average ns at RHi = 100 % to 103 %. At these
tion with respect to water of a few percent (RHw = 103 %–                low RHi values no ice nucleation is expected, thus counts in

www.atmos-chem-phys.net/19/1059/2019/                                                        Atmos. Chem. Phys., 19, 1059–1076, 2019
1064 Y. Boose et al.: Ice nucleation on dust particles sourced from nine deserts worldwide – Part 2
the size range of ice crystals are assumed to be large dust
particles.
The ice nucleation activity of the Australia, Atacama
milled, Etosha, Tenerife2014_1, Peloponnese, and Morocco
samples was additionally measured after they had been ex-
posed to 300 ◦ C for 10 h. For these experiments the tank
was not used. Instead, dust was dry dispersed using particle-
free air from a sonicated flask via a cyclone with a cutoff of
2.5 µm and a diffusion dryer into a PINC, a CPC, an APS,
and a SMPS. The unheated samples were additionally mea-
sured with the same setup to allow direct comparison. The
ns measured with the tank setup, in comparison to the soni-
cated flask setup for the unheated samples, varied between a
factor of 1/3 to 3, which is a good agreement given the lim-
itations of ns as a comparison parameter (Hiranuma et al.,
2015b, 2018). Possible reasons for the differences are the
sonicated flask breaking up larger entities, thus leading to
a different mineralogy per size bin than the rotating brush
generator or uncertainties stemming from the use of a differ-
ent measurement setup. This shows the limits of using ns for
such complex, polydisperse samples, which should ideally
remove any size dependency. To reduce setup dependent un-
certainty, only results measured with the same measurement
setup are compared in the following discussion.
3 Results and discussion
3.1 Ice nucleation in the deposition and condensation
mode and dust mineralogy
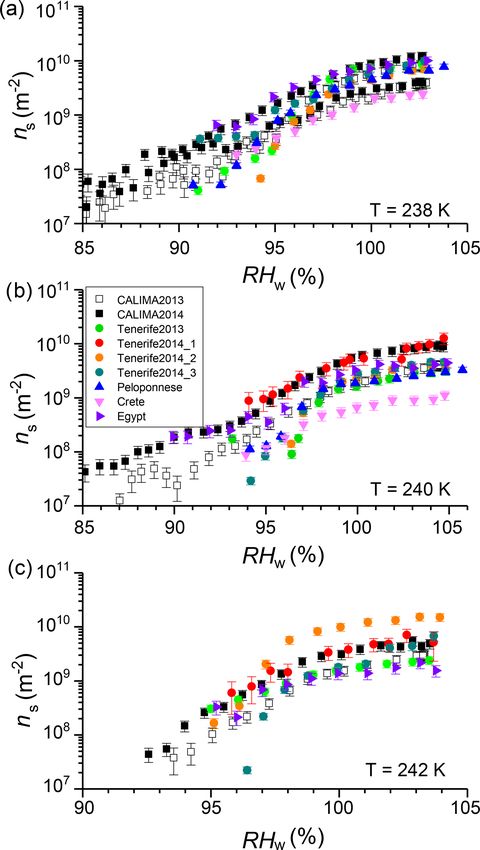
Figure 1. Ice-active surface site density at (a) 238 K, (b) 240 K, and
Ice-active surface site density was determined for 18 dust (c) 242 K of samples collected airborne at the Izaña observatory on
samples, of which four are from the Sahara and were col- Tenerife in 2013 and 2014 (circles), in Egypt, Crete, and Pelopon-
lected after atmospheric transport at the Izaña observatory in nese (triangles), and ns measured in situ during the CALIMA 2013
Tenerife and three were from after atmospheric transport in and 2014 campaigns which took place at the Izaña observatory.
the Peloponnese, in Crete, and the Sinai Peninsula in Egypt.
Figure 1 shows RH scans at three temperatures for these Sa-
haran samples together with RH scans measured online at in the Tenerife samples (23 wt %–32 wt %) and not in dust
the Izaña observatory during the Cloud Affecting particLes from the other three locations. Smectite and calcite are both
In Mineral dust from the sAhara (CALIMA) campaigns in known to have low ice nucleation activity (Atkinson et al.,
August 2013 and 2014, when the observatory was located in 2013; Kaufmann et al., 2016). Thus, the similar amount of
the Saharan Air Layer. The data and description of the lo- one or the other mineral in all Saharan dust samples is in line
cation and campaigns are given in Boose et al. (2016b). The with the observed similar ns . Differentiating between micro-
online and offline measured ns values agree well. Most of the cline and orthoclase and comparing the bulk mineralogy to
ns curves of the different Saharan samples span an order of the surface-dependent ice nucleation ability introduces un-
magnitude. In Fig. 2 a scatter plot of ln(ns ) at RHw = 102 % certainty. Within this uncertainty, there is no detectable ef-
against the quartz plus feldspar content of the dust samples fect from the presence of microcline versus orthoclase in the
is shown, which is discussed in more details below. It reveals airborne samples at the studied temperatures. This is in line
that the airborne Saharan samples are similar in ns and their with the findings by Whale et al. (2017) that there is no corre-
quartz plus feldspar fraction (20 wt %–30 wt %). This holds lation between ice nucleating ability and the level of ordering
true for most other mineral components, as shown in Ta- in the aluminosilicate framework, which determines if ortho-
ble 1. The biggest differences are found for smectite and cal- clase (less ordered) or microcline (more ordered) is present.
cite, the latter accounting for 25 wt %–33 wt % in the Crete, To determine how well the dust mineralogy can overall
Egypt, and Peloponnese samples but only for 4 wt %–7 wt % predict the ice nucleation activity, the correlation of ln(ns )
in the Tenerife samples. Smectite, in contrast, was only found with the fractions of the most common minerals in the
Atmos. Chem. Phys., 19, 1059–1076, 2019 www.atmos-chem-phys.net/19/1059/2019/Y. Boose et al.: Ice nucleation on dust particles sourced from nine deserts worldwide – Part 2 1065
Table 2. Overview of the Pearson correlation coefficients of the sum of selected mineral fractions and ln(ns ) at different temperatures. An
asterisk indicates that the correlation was significant at the 0.05 level. K-feldspar comprises microcline and orthoclase, while feldspar refers
to the sum of microcline, orthoclase, and plagioclase. The number of samples included in each correlation varies, because the ns of the
Mojave, Peloponnese, and Tenerife2014_2 samples was below the detection limit at 242 K, and the size distribution measurements of the
Tenerife2014_1 sample were corrupted for the RH scan at 238 K.
T 238 K 240 K 242 K 238 K 240 K 242 K
RHw 97 % 97 % 97 % 102 % 102 % 102 %
Number of samples 18 19 16 18 19 16
K-feldspar 0.02 0.03 −0.06 −0.08 −0.07 −0.13
Feldspar 0.15 0.08 0.05 0.05 −0.09 −0.17
Quartz 0.63∗ 0.52∗ 0.47 0.71∗ 0.74∗ 0.71∗
Illite −0.14 −0.15 0.11 −0.01 −0.04 0.13
Kaolinite −0.66∗ −0.56∗ −0.41 −0.51∗ −0.35 −0.19
Feldspars + quartz 0.64∗ 0.5∗ 0.44 0.63∗ 0.56∗ 0.49
Feldspars + quartz + illite 0.63∗ 0.49∗ 0.47 0.65∗ 0.58∗ 0.53∗
Feldspars + quartz + kaolinite 0.51∗ 0.40 0.35 0.54∗ 0.51∗ 0.48
Feldspars + quartz + illite + kaolinite 0.50∗ 0.38 0.37 0.55∗ 0.51∗ 0.51
Calcite −0.12 0.05 −0.22 −0.31 −0.26 −0.32
of other compounds, here we do a similar correlation analy-
sis of the ln(ns ) at T = 238, 240, and 242 K and RHw = 97 %
and 102 % with the fraction of various minerals contained in
the dust samples. Figure 2 exemplarily shows a scatter plot
of ln(ns ) at RHw = 102 % against the quartz plus feldspar
content of the dust samples. The Etosha sample was ex-
cluded from the correlation, as it does not contain any signif-
icant amount of these minerals. The surface-collected sam-
ples with a high ratio of quartz and feldspar tend to have
a higher ns than the airborne samples. This trend is similar
at the three investigated temperatures. The resulting corre-
lation coefficients for the investigated mineral fractions are
provided in Table 2. The findings by Boose et al. (2016c) for
the immersion mode ns are confirmed in the deposition and
Figure 2. Natural log of the ice-active surface site density as a condensation mode: at all three tested temperatures, the high-
function of the sum of quartz and feldspar content of the samples. est correlation of ns is found for the fraction of quartz, fol-
Square symbols indicate surface-collected samples, stars indicate lowed by the quartz + feldspar fraction. The correlation with
milled samples, and circles indicate airborne samples. For clarity, quartz alone is dominated by the Australia sample, which
the Tenerife samples are not named individually and are instead consists of 91 wt % quartz and is by far the most ice nu-
shown as open circles. The asterisk in the legend indicates that the cleation active dust sample. The remaining samples, which
correlation is significant at the 0.05 level. consist of, at most, 64 wt % of quartz, correlate only weakly
with quartz alone (e.g., R = 0.29, p = 0.27, at T = 238 K
and RHw = 102 %) and better with quartz plus feldspar (R =
0.41, p = 0.08). Adding illite to the quartz + feldspar frac-
dust samples was compared in the partner paper (Boose tion leads to insignificant changes of the correlation coef-
et al., 2016c). This comparison showed that the immersion- ficient while adding kaolinite reduces it. Calcite and kaoli-
mode ice nucleation activity correlates best with the K- nite alone are always negatively correlated with ns in both
feldspar fraction alone at T = 253 K, a temperature where deposition and condensation mode. These observations are
only feldspar minerals are found to have significant ice nu- reasonable when compared to the findings of Atkinson et al.
cleation activity (Atkinson et al., 2013). At T ≤ 245 K, the (2013), who found a higher ns for quartz over clay miner-
ice nucleation activity correlates best with the quartz and als at T > 236 K but lower ns for quartz than for feldspars
quartz + feldspar fractions of the dust samples (Boose et al., for T > 242 K. Generally, the correlations are lower in this
2016c). At these lower temperatures, quartz as well as, to a study compared to the immersion-mode data from Boose
lower degree, clay minerals were found to nucleate ice effi- et al. (2016c). A possible reason for this is that the only par-
ciently (Atkinson et al., 2013). Before investigating the role
www.atmos-chem-phys.net/19/1059/2019/ Atmos. Chem. Phys., 19, 1059–1076, 20191066 Y. Boose et al.: Ice nucleation on dust particles sourced from nine deserts worldwide – Part 2
Figure 3. Ice-active surface site density at (a) 240 K and (b) 242 K of samples before (filled symbols) and after (open symbols) heat treatment.
Error bars include the Poisson error of the INP measurements and the maximum variation of Ave,w . Square symbols indicate surface-collected
samples, stars indicate milled samples, and circles indicate airborne samples.
3.2 Ice nucleation and heat labile material
In this section, the role of heat labile material on the surface
of dust particles is investigated. A representative subset of the
samples was selected to reduce the number of experiments
necessary. The Australia and Morocco sample were selected
because of their exceptional high ns , the Etosha sample be-
cause its mineralogy did not explain the observed ns , the At-
acama milled sample because we expected a higher ns from
the mineralogy, and finally the Tenerife2014_1 and Pelo-
ponnese samples as representatives for two airborne samples
from different locations. Figure 3 shows the ns at 240 and
242 K of the unheated and the heated samples. In case of the
Tenerife2014_1 sample the heat treatment led to an increase
of ns at RHw < 100 %, while it had no effect above water
saturation. In contrast, the maximum ns of the Etosha sam-
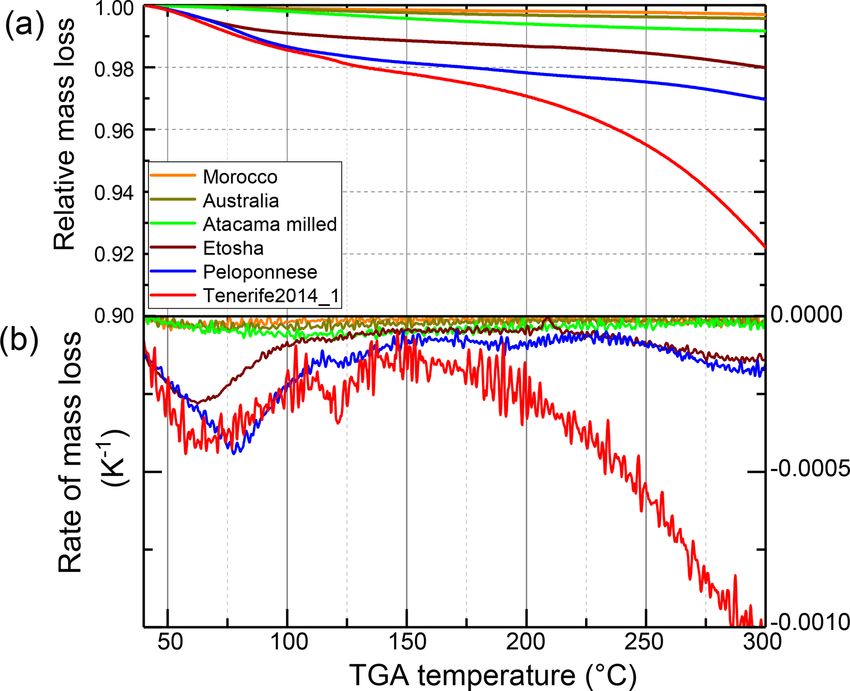
Figure 4. Relative mass loss (a) and its derivative (b) under heating ple decreased by 1 order of magnitude at 240 K after heating.
of the different dust samples. At 242 K the ns was below the detection limit, as can be seen
by a scattered flat ns curve in Fig. 3b. The heating had a small
decreasing effect on the ns of the Peloponnese sample at all
tial activation of INPs at these measurement conditions in the RH values and little to no significant effect on the ns of the
PINC due to an inhomogeneous RH profile along the particle remaining samples. A change in ice nucleation ability due
trajectories inside the chamber (Garimella et al., 2017) weak- to the heating gives an indication of the nature of the active
ens the effect of differences in mineralogy. Another reason sites, i.e., if they are inherent to the minerals themselves or a
could be that surface coatings play a more prominent role semi-volatile coating material or are due to biological parti-
at lower RH values, because they are less diluted than in im- cles, which are impacted by the heating. An RH dependency
mersion mode. Correlating mineralogy, which is based on the of the change in ice nucleation ability may suggest that the
bulk fraction, with the surface property ns , leads to additional material which contains or coats the active sites is susceptible
uncertainty, as described above. Effects by non-mineral sub- to dissolution.
stances such as coatings are discussed in the following. We investigated these possible implications further by
thermogravimetric analysis, ATR-IR, and Raman spec-
troscopy of the samples. The relative mass loss under increas-
ing temperature is shown in Fig. 4a and its first derivative in
Fig. 4b. If pure samples of single minerals or organic species
were studied, the TGA would show discrete steps in mass
loss, indicated by spikes in the derivative plot. However, the
complexity of the dust samples in this study, which consist of
Atmos. Chem. Phys., 19, 1059–1076, 2019 www.atmos-chem-phys.net/19/1059/2019/Y. Boose et al.: Ice nucleation on dust particles sourced from nine deserts worldwide – Part 2 1067 several minerals and likely also various other components, cause the spikes to widen, thus reducing the possibility to observe discrete steps. For example, Xi et al. (2004) showed that the mixture of a montmorillonite with varying concen- trations of organic surfactant shifts the peak in the derivative mass between the higher temperature of the montmorillonite and the lower temperature of the surfactant, depending on the concentration of the surfactant. This makes it impossi- ble to identify exactly which species are evaporated at which temperature. However, taking into account the temperature range, a qualitative analysis is possible. The Morocco, Australia, and Atacama milled samples, which all showed no change in ns after heating, exhibit a small, gradual decrease in mass of, at maximum, 0.5 % be- tween 40 and 300 ◦ C. In the case of the three samples whose ns changed after heating, i.e., the Etosha, Peloponnese, and Tenerife2014_1 samples, a larger mass loss is found. A first decrease in mass of about 1 % (Etosha) to 2 % (both airborne samples) is observed between 40 and 110 ◦ C. The Etosha sample shows a second graduate mass release from 220 ◦ C onwards (1 %). The two airborne samples, Peloponnese and Tenerife2014_1, show small steps in mass release between 110 and 225 ◦ C and 110 and 170 ◦ C, respectively, and a con- tinuous reduction in mass above these temperatures, reaching a total loss of 3 % and 8 % at 300 ◦ C, respectively. The temperature ranges where the mass loss occurs can be related to different materials which were evaporated and potentially altered the ice nucleation behavior. The first de- crease in mass at 40 to 110 ◦ C is mostly due to the evapo- ration of adsorbed water on the surface of the dust particles or of volatile material such as volatile organics. At tempera- tures between 110 and 300 ◦ C the mass loss is mainly related to decomposition of organic matter, e.g., amides, carboxylic, and phenolic functional groups (Miyazawa et al., 2000) or the combustion of certain organic compounds such as cellulose (Stamm, 1956; Lipska and Parker, 1966). Kristensen (1990) studied various biogenic organic materials, such as cellulose, glucose, bacteria (Escherichia coli and bacillus subtilis), and humic and glutamic acid, which showed either a bimodal or trimodal pattern in the TGA derivative. For all samples, they observed a first peak at 160–180 ◦ C, which accounted for 10 %–42 % of the mass loss and a second mass loss peak Figure 5. Attenuated total reflectance infrared (ATR-IR) spectra for between 340 and 490 ◦ C. Most minerals present in the dust the (a) Australia, (b) Etosha, and (c) Tenerife2014_1 samples before samples are stable at T ≤ 300 ◦ C, apart from smectite and (blue) and after heating (red). gypsum (Földvári, 2011), as further discussed below. We performed ATR-IR spectroscopy on the Etosha and Tenerife2014_1 to investigate the nature of the material re- kaolinite and smectite in case of the Tenerife2014_1 sample. sponsible for the respective decrease and increase in ns with Kaolinite also has signals at 3619, 3650, and 3685 cm−1 (La- heating. Furthermore, we chose the Australia sample as rep- fuente et al., 2015). No significant differences are observed resentative for most other cases where the ns stayed the same. between the unheated and the heated Australia and Etosha Figure 5 shows the ATR-IR spectra of the three samples samples. The intensity differences in the mineral bands are before and after heating. The bands between wavenumber likely related to single grains not representatively amplify- 700 to 1200 cm−1 are related to the dominant minerals in ing the signal during sampling. The Tenerife2014_1 sample, the (bulk) samples: quartz in case of the Australia sample; in contrast, shows clear differences before and after heating. dolomite, calcite, and ankerite in the case of Etosha; and A loss of intensity in the OH stretch region between 3500 www.atmos-chem-phys.net/19/1059/2019/ Atmos. Chem. Phys., 19, 1059–1076, 2019
1068 Y. Boose et al.: Ice nucleation on dust particles sourced from nine deserts worldwide – Part 2
and 3100 cm−1 is observed, which is too pronounced to be et al., 2011). While the broad band at 3180 cm−1 agrees
from adsorbed water only. Further intensity loss is observed well with the observed signal, a second band is found at
in the C–H aliphatic region, with decreasing bands between 1080 cm−1 in the Etosha sample. Ammonium sulfate has
3000 and 2850 cm−1 . This points to volatile organics being a band at 990 cm−1 , which is significantly different from
present on the unheated sample which were released during 1080 cm−1 . Thus, the signal can be attributed to the calcite
heating. which has a very prominent band at this position. In addi-
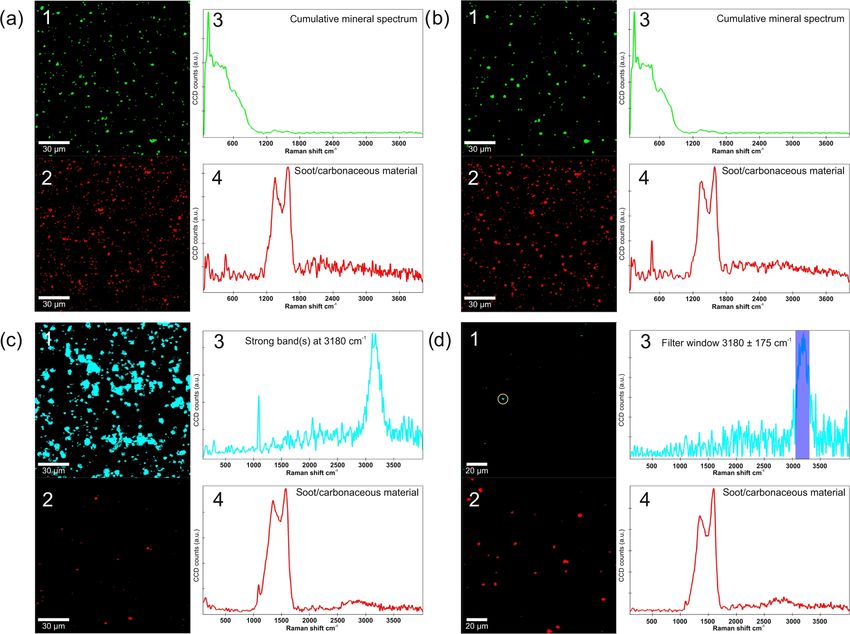
Raman mapping was performed on the Etosha, Tener- tion, the XRD measurements confirmed calcite to be present
ife2014_1, and Australia samples. Due to strong fluores- in the sample. (c) Cellulose shows a broad band between
cence, however, the Tenerife2014_1 spectra did not yield 3575 and 3125 cm−1 and numerous bands between 1320 and
any information and are thus not presented here. The Ra- 1030 cm−1 (Socrates, 2001). Additional bands at 1750 and
man maps for the Etosha and Australia samples are shown 1725 cm−1 , 1635 and 1600 cm−1 , and 1480 and 1435 cm−1
in Fig. 6. They reveal bands between 1200 and 1700 cm−1 are not distinguishable in the Etosha Raman spectrum.
with a distinctive pattern related to soot and carbonaceous For the Etosha sample an effect of organic or other heat la-
material (Sadezky et al., 2005) being present on many parti- bile material on the ice nucleation behavior appears likely.
cles in the Australia sample (Fig. 6a2 and a4) and on some The main minerals contained in the Etosha sample (i.e.,
in the Etosha sample (Fig. 6c2 and c4). The carbonaceous ankerite, calcite, dolomite, and muscovite) are not known to
material is not affected by the heating (Fig. 6b and d). A be particularly ice nucleation active at the investigated tem-
cluster with a strong broad signal at 3180 cm−1 and a sec- peratures. In case of ankerite the ice nucleation ability is
ondary band at around 1080 cm−1 is observed for the un- unknown. Based on its similarity with dolomite, a carbon-
heated Etosha sample, which is present on most particles ate known not to be ice nucleation active, it is assumed that
(Fig. 6c1 and c3). After the heat treatment, no cluster is iden- ankerite is also not active. Thus, one of the suggested can-
tified anymore containing the broad 3180 cm−1 band, yet the didates with the strong Raman signal at 3180 cm−1 is likely
signal at 1080 cm−1 remains. This supports the interpreta- responsible for the ice nucleation activity of the Etosha sam-
tion that the band at 1080 cm−1 can be attributed to cal- ple. Being part of proteins, amides are ubiquitous in nature.
cite. Furthermore, the band at 1080 cm−1 does not correlate Similarly, cellulose is the most abundant organic compound
with the 3180 cm−1 band, therefore they belong to two dif- on Earth (Kamide, 2005) amongst others as a structural com-
ferent compounds. The cluster analysis groups these signals ponent of algae. Both cellulose (Hiranuma et al., 2015b) and
for the unheated sample due to the spatial proximity of the some proteins (Maki et al., 1974) have been identified to
materials on the dust. It is likely that on mineral dust grains cause ice nucleation at the studied temperatures. Ammonium
with a high calcite content a compound was absorbed. Dur- sulfate has been observed to correlate with higher INP con-
ing the heat treatment this absorbed compound disappeared centration in Saharan dust (Boose et al., 2016b) and to in-
and the calcite remained. Afterwards, the cluster analysis crease the freezing onset temperature of microcline (Kumar
showed no group containing the 3180 cm−1 band. A filter et al., 2018a) and various other minerals (Whale et al., 2018)
(3180 ± 175 cm−1 ) was applied to search specifically for this by up to 3 K. According to a study on the Ntwetwe Pan in
signal. This revealed only very few particles carrying the re- Botswana by Thomas et al. (2014), the organic carbon con-
lated material after heating (Fig. 6d1 and d3). centration in a salt pan is about 1 wt % at the surface and
Identification of the material which was released or de- consists of cyanobacteria and algae. We assume that similar
composed during the heating was hampered by fluorescence values apply also for the Etosha pan. The Etosha sample was
inherent to the minerals in the samples and also possibly collected from the edge of the salt pan, a few hundred meters
due to biological material if present in the unheated sam- away from a fertile soil area containing the highest organic
ples. The ratio of signal to noise (fluorescence) was opti- carbon content of the national park (Beugler-Bell and Buch,
mized by impacting small amounts of the samples on a pure 1997). As wind erosion was identified in these nearby fer-
aluminum surface and by adjusting the laser power, but the tile soils, aeolian transport potentially led to higher organic
fluorescence could not be entirely suppressed. This, together matter concentration at the edge of the pan compared to far-
with the complexity of the samples, inhibited an unambigu- ther towards the center of the pan. Overall, this suggests that
ous identification of the species which were altered by the the Etosha sample’s ice nucleation ability is almost entirely
heating and may affect the ice nucleation ability. We suggest caused by organic matter, potentially cellulose or proteins
three possible candidates for the cluster with a strong Raman which were mixed with or adsorbed onto the mineral dust
signal at 3180 cm−1 in the Etosha sample. (a) Amides typ- on the ground, explaining the almost complete suppression
ically show a Raman signal between 3300 and 3100 cm−1 of ice nucleation of the heated samples.
(Socrates, 2001), as observed in the Etosha sample, but dis- In contrast to the Etosha sample, the Tenerife2014_1 sam-
tinct peaks are usually also observed for amides between ple consists of a number of minerals ice nucleation active
1700 and 1600 cm−1 , which are absent in the Etosha sam- at the studied temperatures, e.g., orthoclase, plagioclase, and
ple. (b) Pure ammonium sulfate has a broad band above quartz (Table 1). The sample shows the largest mass loss
3000 cm−1 and a sharp peak at around 990 cm−1 (Bertram in the TGA analysis. The rather steep step in the TGA
Atmos. Chem. Phys., 19, 1059–1076, 2019 www.atmos-chem-phys.net/19/1059/2019/Y. Boose et al.: Ice nucleation on dust particles sourced from nine deserts worldwide – Part 2 1069 Figure 6. Raman mapping results for the Australia (a, b) and the Etosha sample (c, d). In each panel, (1) and (2) show the location of particles from clusters with spectra similar to those shown in (3) and (4). In (d1) the particle is encircled for which the filter (d3) found a spectrum. loss curve at about 120 ◦ C suggests a certain species to be sions can originate from the North African coast or be ad- released at this temperature, probably containing aliphatic vected from Europe (Rodríguez et al., 2011; García et al., compounds as suggested by the ATR-IR measurements. The 2017). As the dust collection took place over several days complexity of the airborne Saharan samples is indicated by and nights, an influence of organic matter from local sources García et al. (2017), who studied organic material in the Sa- cannot be excluded. haran Air Layer. They collected 42 PM2.5 and PM10 filters at Another explanation for the reduction in mass at temper- the Izaña observatory in parallel to the Tenerife2013 sample atures below 300 ◦ C is the release of free water molecules collection and the CALIMA 2013 campaign in August 2013. from the crystal lattice as indicated also in the ATR-IR spec- Organic matter accounted for about 1.5 wt % of the aerosol tra between 3600 and 3100 cm−1 . In some cases, this affects composition in the Saharan Air Layer and was determined the crystal lattice: Smectite, a swelling mineral, collapses to mainly consist of saccharides, related to organic material under decreasing water vapor pressure as experienced dur- in soils, biogenic secondary organic aerosol particles result- ing the heating. This decreases the interlayer spacing (for an ing from isoprene and α-pinene oxidation, and organic com- overview of the effect of layer charge on smectite swelling pounds from natural and anthropogenic sources such as veg- see Laird, 2006). It is unknown if the change in crystal lat- etation and engine emissions. During daytime, the boundary tice has an effect on the ice nucleation ability of the otherwise layer reaches the altitude of the Izaña observatory and or- only weakly ice nucleation active smectite (Pinti et al., 2012; ganic matter can originate from local sources. During night- Kaufmann et al., 2016). An effect cannot be excluded as the time the observatory is located in the free troposphere and lattice match with ice is believed to be one of the factors pro- aerosol sources are distant. Anthropogenic and natural emis- moting ice nucleation (Pruppacher and Klett, 1997). In the www.atmos-chem-phys.net/19/1059/2019/ Atmos. Chem. Phys., 19, 1059–1076, 2019
1070                          Y. Boose et al.: Ice nucleation on dust particles sourced from nine deserts worldwide – Part 2

Figure 7. XRD diffractogram of unheated and heated Tenerife2014_1 sample. Vertical text indicates changes in peak height which were used
to identify the decrease in gypsum and increase in anhydrite with heating. Horizontal text indicates peaks associated with other minerals in
the sample.

studied samples, smectite was present in the Tenerife2014_1             served in the transformation of gypsum to anhydrite (Azimi
sample (23 wt %), and traces were found in the Etosha sam-              and Papangelakis, 2011; Grawe et al., 2016), we use the oc-
ple (1 wt %). Thus, the collapse of the smectite lattice should         currence of needles in our sample as an indication that the
only influence the Tenerife2014_1 sample. In case it has an             gypsum–anhydrite transformation took place on the surface
influence, this would be related to an increase in ice nucle-           of particles and thus might be responsible for the change in
ation ability.                                                          ice nucleation behavior of the sample. In SEM images of the
   XRD analysis of the unheated and heated Tenerife2014_1               unheated Tenerife2014_1 sample (Fig. 8a), hardly any nee-
sample show the conversion of gypsum to anhydrite (Fig. 7).             dles are visible. A small number of needles is observed at the
Gypsum has a low ice nucleation ability, similar to the                 center of the image of the heated sample (Fig. 8b), while no
clay minerals kaolinite and illite (Zimmermann et al., 2008).           needles are found in other SEM images of the heated sam-
Grawe et al. (2018) found anhydrite to have a higher ice nu-            ple (see the Supplement). The apparently limited needle for-
cleation activity than quartz in the immersion mode at tem-             mation and the fact that only about 1 wt % gypsum is con-
peratures below 243 K when dry generated but a much lower               tained in the sample suggests that gypsum transformation un-
ns when particles were generated from an aqueous solution.              der heat treatment should only have a small effect on the ice
Anhydrite transforms back to gypsum when exposed to a rel-              nucleation behavior of the Tenerife2014_1 sample. However,
ative humidity higher than 97 % at room temperature (Brac-              given that, at maximum, only about 10 % of the particles act
coni et al., 2010). However, this process occurs on the or-             as INPs in case of the Tenerife2014_1 sample, the gypsum–
der of hours to days, in line with the observed differences in          anhydrite transformation might be non-negligible. Addition-
ns between wet and dry generated particles in Grawe et al.              ally, we suggest that the increase in the ns found under sub-
(2018). Potentially, the transformation to anhydrite during             saturated RHw conditions for the Tenerife2014_1 sample is
heating explains the higher ns of the heated Tenerife2014_1             caused by the volatilization of aliphatic compounds contain-
sample compared to the unheated one at subsaturated condi-              ing matter, as indicated by the ATR-IR and TGA measure-
tions. In this case, a partial conversion of anhydrite back to          ments, which inhibited the active sites of the mineral dust
gypsum during RH conditions above water saturation might                itself.
explain the unchanged ns of the unheated and heated Tener-
ife2014_1 sample above water saturation. It should be kept
in mind that the bulk mineralogy as determined by XRD is                4   Conclusions
not necessarily representative of the particle surface where
                                                                        In this study we showed that the fractions of quartz and the
ice nucleation takes place. As needle formation has been ob-
                                                                        sum of quartz and feldspars in desert dust samples correlate

Atmos. Chem. Phys., 19, 1059–1076, 2019                                                    www.atmos-chem-phys.net/19/1059/2019/
Y. Boose et al.: Ice nucleation on dust particles sourced from nine deserts worldwide – Part 2 1071 Figure 8. Scanning electron microscopy images of the (a) unheated and (b) heated Tenerife2014_1 sample. Note the different scales in the two images. better than all other mineral fractions with the ice nucleation (2018b), the variation in quartz ice nucleation ability found in active surface site density of the dust in deposition and the laboratory studies (Atkinson et al., 2013; Zolles et al., 2015; condensation mode at temperatures between 238 and 242 K. Kaufmann et al., 2016) and the superior ice nucleation abil- This is in line with the observations for the immersion mode ity of the quartz-rich samples from Australia and Morocco in presented in Part 1 (Boose et al., 2016c) of this study. The this study and its partner paper may be explained by the pre- high abundance of quartz in soils worldwide, its resistance processing of the samples. Milling of quartz samples, as done to chemical weathering processes, and its presence in par- in our study, increases the ice nucleation ability of quartz by ticles of all sizes make it a potentially widely spread atmo- creating Si−O· and Si· radical sites, which can then react spheric INP type. According to a recent study by Kumar et al. with water vapor (Kumar et al., 2018b). However, milling www.atmos-chem-phys.net/19/1059/2019/ Atmos. Chem. Phys., 19, 1059–1076, 2019
You can also read