A closed-loop, music-based brain-computer interface for emotion mediation - Kat Agres
←
→
Page content transcription
If your browser does not render page correctly, please read the page content below
RESEARCH ARTICLE

                                                       A closed-loop, music-based brain-computer
                                                       interface for emotion mediation
                                                       Stefan K. Ehrlich ID1*, Kat R. Agres2,3, Cuntai Guan4, Gordon Cheng1
                                                       1 Chair for Cognitive Systems, Department of Electrical and Computer Engineering, Technische Universität
                                                       München (TUM), Munich, Germany, 2 Institute of High Performance Computing, Social and Cognitive
                                                       Computing Department, Agency for Science, Technology and Research (A*STAR), Singapore, Singapore,
                                                       3 Yong Siew Toh Conservatory of Music, National University of Singapore (NUS), Singapore, Singapore,
                                                       4 School of Computer Science and Engineering, Nanyang Technological University (NTU), Singapore,
                                                       Singapore
a1111111111
a1111111111                                            * stefan.ehrlich@tum.de
a1111111111
a1111111111
a1111111111                                            Abstract
                                                       Emotions play a critical role in rational and intelligent behavior; a better fundamental knowl-
                                                       edge of them is indispensable for understanding higher order brain function. We propose a
    OPEN ACCESS
                                                       non-invasive brain-computer interface (BCI) system to feedback a person’s affective state
                                                       such that a closed-loop interaction between the participant’s brain responses and the musi-
Citation: Ehrlich SK, Agres KR, Guan C, Cheng G
(2019) A closed-loop, music-based brain-               cal stimuli is established. We realized this concept technically in a functional prototype of
computer interface for emotion mediation. PLoS         an algorithm that generates continuous and controllable patterns of synthesized affective
ONE 14(3): e0213516. https://doi.org/10.1371/          music in real-time, which is embedded within a BCI architecture. We evaluated our concept
journal.pone.0213516
                                                       in two separate studies. In the first study, we tested the efficacy of our music algorithm by
Editor: Joseph Najbauer, University of Pécs           measuring subjective affective responses from 11 participants. In a second pilot study, the
Medical School, HUNGARY
                                                       algorithm was embedded in a real-time BCI architecture to investigate affective closed-loop
Received: July 25, 2018                                interactions in 5 participants. Preliminary results suggested that participants were able to
Accepted: February 23, 2019                            intentionally modulate the musical feedback by self-inducing emotions (e.g., by recalling
Published: March 18, 2019                              memories), suggesting that the system was able not only to capture the listener’s current
                                                       affective state in real-time, but also potentially provide a tool for listeners to mediate their
Copyright: © 2019 Ehrlich et al. This is an open
access article distributed under the terms of the      own emotions by interacting with music. The proposed concept offers a tool to study emo-
Creative Commons Attribution License, which            tions in the loop, promising to cast a complementary light on emotion-related brain research,
permits unrestricted use, distribution, and            particularly in terms of clarifying the interactive, spatio-temporal dynamics underlying affec-
reproduction in any medium, provided the original
                                                       tive processing in the brain.
author and source are credited.

Data Availability Statement: The data has been
made publicly available under the following URL:
https://github.com/stefan-ehrlich/dataset-affective-
music-BCI.

Funding: This research was partially funded by the
                                                       1 Introduction
Agency for Science Technology and Research             Research on emotion has a longstanding tradition that has garnered interest from a variety of
(A� STAR), Singapore, through the Singapore            scientific fields, such as psychology, sociology, and neuroscience (e.g., [1–4]). For example, sci-
International Pre-Graduate Award (SIPGA) and is
                                                       entists now know that there is at least some degree of independence between emotion process-
supported by the German Research Foundation
(DFG) through the International Graduate School of
                                                       ing and attentional mechanisms, that the amygdala is crucial in forming conditioned fear
Science and Engineering (IGSSE) at the Technical       responses, and that evoking certain emotional states biases decision making processes [5].
University of Munich (TUM).                            These findings have shed light on the cognitive, neural, and social factors at play in emotion

PLOS ONE | https://doi.org/10.1371/journal.pone.0213516 March 18, 2019                                                                                       1 / 24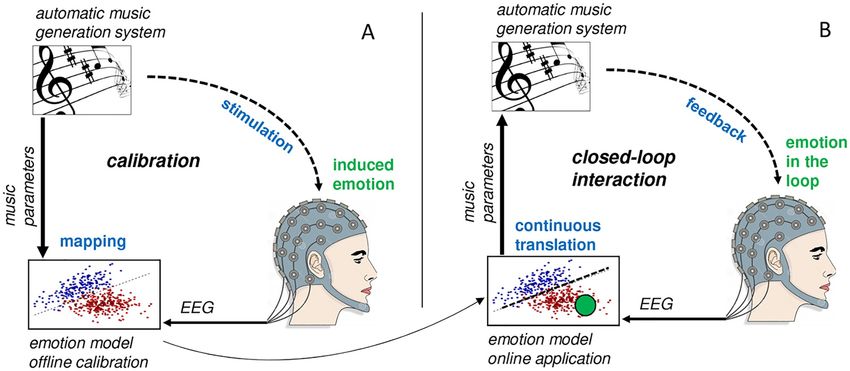
A music-based BCI for emotion mediation

Competing interests: The authors have declared   processing. Despite these advances, existing theories and models of emotion often lack consis-
that no competing interests exist.               tency, and are often strongly context-dependent [6]. In addition, the majority of neuroscientific
                                                 research on affective responses has investigated brain processes involved in mere recognition of
                                                 emotional content, while the brain processes involved in the induction and mediation of affec-
                                                 tive states by emotionally-evocative stimuli are not yet well understood, due in part to the diffi-
                                                 culty of carefully controlling these types of studies. That is, traditional approaches have elicited
                                                 important breakthroughs in terms of how we understand affective responses at the behavioral,
                                                 social, and physiological levels. They have not, however, provided many tools for directly quan-
                                                 tifying neurophysiological measures of emotion that can help individuals both detect and mod-
                                                 ulate their own emotions. This is where the comparatively recent fields of Affective Computing
                                                 [7] and Brain-Computer Interfaces (BCI) [8, 9] can offer important insight into the physiology
                                                 and neuroscience of emotions, as well as cutting-edge techniques. Recently, BCI has been sug-
                                                 gested as a “powerful tool for scientific inquiry” of the brain in vivo, most notably for investi-
                                                 gating the nervous system’s adaptive capacities during interaction with external stimuli [10].
                                                 In particular, BCI has the clear methodological advantage of offering interactive approaches
                                                 to capturing neural responses that may be used to facilitate self-regulation of affective states in
                                                 users.
                                                     BCI approaches to affective states are of particular importance at this time, not only to
                                                 advance our understanding of emotion induction mechanisms by investigating the neural sig-
                                                 natures of emotions, but also for the myriad possible medical applications [11]. For example,
                                                 mental diseases, such as mood disorders and depression, have their origin in emotional dys-
                                                 functions [12]. Effective techniques to promote emotional regulation are of great importance
                                                 to the field of medicine; the affective BCI approach has been proposed as one possible route in
                                                 this direction [13]. Indeed, BCI-based treatment protocols have been proposed for several neu-
                                                 rological disorders, such as attention deficit hyperactivity disorder (ADHD) [14] as well as
                                                 depression in elderly [15].
                                                     To aid potential BCI approaches for emotion regulation, music is a useful medium, as it
                                                 is widely acknowledged to be highly effective in eliciting affective responses. Indeed, one of
                                                 the main reasons people reportedly listen to music is to change or enhance their mood [16].
                                                 Therefore, incorporating musical feedback into BCI systems offers great potential for emo-
                                                 tion-regulation systems.
                                                     Music and emotion: Music is known to express and evoke strong emotions [17–19], and
                                                 perceiving music implicates a wide spectrum of cognitive brain processes, such as short and
                                                 long term memory, visual and auditory perception and integration, physiological entrainment,
                                                 motor planning, and coordination [12]. Because music taps into so many different cognitive
                                                 resources, it can serve as an outstanding tool for better fundamental understanding of the
                                                 human brain. As Leng and Shaw [20] stated decades ago: “Since processing of music is a com-
                                                 plex set of perceptive and cognitive operations with links to memory and emotions, it offers a
                                                 window to the understanding of higher brain functions”.
                                                     Music is also a culturally robust phenomenon; evidence of musical behavior has been found
                                                 in every society [21, 22]. Furthermore, music perception starts very early in human ontogeny,
                                                 with infants demonstrating, for example, rhythmic and melodic discrimination [23]. Scientists
                                                 have even suggested that music was even a precursor to language development over the course
                                                 of human evolution [24]. Studies have also found that a basic understanding of emotional con-
                                                 tent in music begins in early childhood [17]. Because music is so widely appreciated, and is
                                                 often used (informally) by individuals to mediate or enhance their own emotional states, it has
                                                 great potential to be an effective tool for investigating affective regulation in listeners.
                                                     Several prior studies have employed music to trigger specific patterns of brain activity,
                                                 showing that it can be used as a diagnostic tool for neurological dysfunctions [25] and for

PLOS ONE | https://doi.org/10.1371/journal.pone.0213516 March 18, 2019                                                                         2 / 24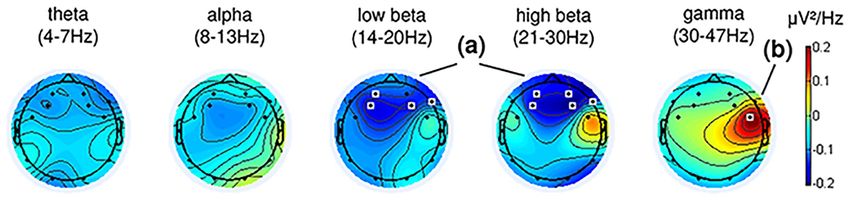
A music-based BCI for emotion mediation

                                           treatment of such diseases [26], [27]. Music has also been used to treat depression and anxiety
                                           in the elderly, individuals suffering from mental health disorders, and numerous other clinical
                                           conditions and diseases (see for example [15, 28–31]). Scientists acknowledge that “A better
                                           understanding of music evoked emotions and their neural correlates can lead to a more sys-
                                           tematic and effective use of music therapy because dysfunctions in these structures are related
                                           to emotional disorder” [12].
                                               Another important feature of music that is particularly advantageous for the BCI context
                                           of the present work: Unlike many other types of emotional stimuli that are difficult to
                                           manipulate in specific ways over time, such as pictures and videos, music can algorithmically
                                           be synthesized, and thus be used to form custom-made emotional stimuli. It can serve as a
                                           continuous affective display—a real-time representation of a person’s affective state or
                                           desired affective state. The idea to translate human brain activity into sound or music
                                           was first proposed about five decades ago, however driven by artistic, rather than scientific
                                           objectives. In a public demonstration in 1965 entitled “Music for Solo Performer”, Alvin
                                           Lucier translated EEG measures into actuations for simultaneously playing several acoustic
                                           percussion instruments [32]. A more contemporary application along these lines has been
                                           presented by Hinterberger and Baier [33], who reported an EEG-based device for the sonifi-
                                           cation of brain-oscillations. Similarly, Miranda et al. presented a concept in 2005 that maps
                                           alpha- and beta-bandpower (representing relaxation- and attention-level) onto music con-
                                           trol parameters to switch between two different styles of music [34]. In 2011, Makeig et al.
                                           [35] conducted a study in which the participant was asked to associate several two-tone
                                           musical drone sounds with corresponding self-induced emotions. Related EEG-patterns
                                           were captured during a calibration session and subsequently modeled. In a live performance
                                           together with a small chamber orchestra, the user was then able to trigger the drone sounds
                                           by re-experiencing the initially associated self-induced emotions. A more recent work by
                                           Deuel et al. in 2017 [36] utilized EEG alpha- and mu-band oscillations to allow the user to
                                           generate different notes of a musical scale based on the level of bandpower activation in real-
                                           time. The objectives of the above mentioned works were mainly for artistic purposes, and
                                           except for the work by Makeig et al. [35], were not particularly focused on emotional brain
                                           processes. Nevertheless, they demonstrate how well music lends itself to being generated in
                                           real time based on the user’s emotions, and more specifically, how brain responses may be
                                           used to drive music generation.
                                               This work presents a novel Brain-Computer Interface (BCI) to feedback a user’s emotional
                                           state by means of algorithmically synthesized music in such a way that continuous closed-loop
                                           affective interaction can be established. The concept presented here builds upon preliminary
                                           work of the authors [37]. The core component of our approach—and the major contrast to
                                           previous works—is the utilization of a parameterizable music synthesis algorithm (Fig 1). This
                                           algorithm allows for generating musical sequences with seamless and continuous transitions
                                           between patterns of different emotional expressiveness. This algorithm is utilized to both ‘cali-
                                           brate’ the system for EEG-based affect modeling (Fig 1A), and for online application (continu-
                                           ous EEG-based affect translation, as shown in Fig 1B). This approach allows for a seamless
                                           transition between the calibration phase and the online application phase as well as high flexi-
                                           bility for developing novel calibration and stimulation protocols.
                                               The remainder of this paper is structured as follows: The next section introduces our pro-
                                           posed affective BCI concept, as well as a description of the technical realization of our concept.
                                           The evaluation of the system is described in two sections: Section 2.3 describes a listening
                                           study that evaluates the algorithm’s ability to generate synthesized affective music. In Section
                                           2.4, this algorithm is integrated into the proposed affective BCI, and a real-time BCI study for
                                           evaluating affective closed-loop interaction utilizing our proposed affective BCI. Section 3

PLOS ONE | https://doi.org/10.1371/journal.pone.0213516 March 18, 2019                                                                  3 / 24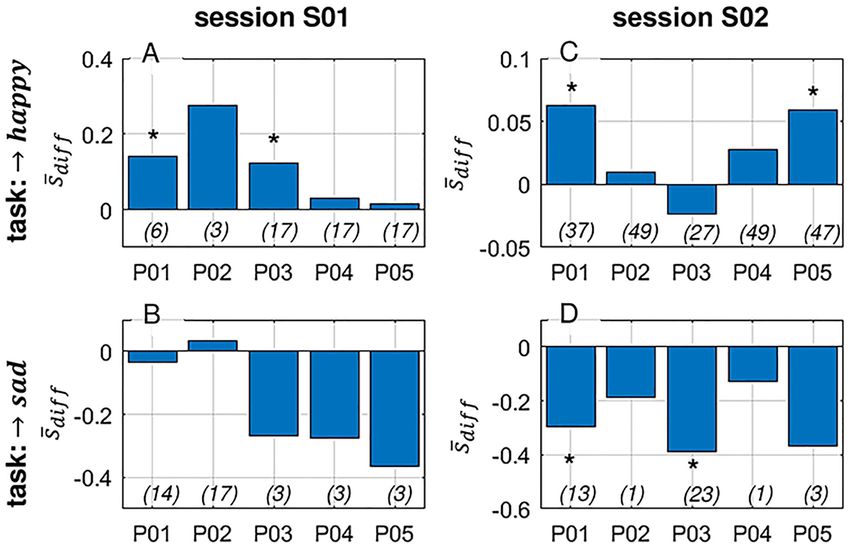
A music-based BCI for emotion mediation

               Fig 1. Conceptual illustration of the affective music BCI. (A) During calibration, the user is exposed to automatically generated patterns of affective
               music, and brain activity is measured simultaneously via EEG. EEG patterns are extracted and used to build a user-specific emotion model. (B) During
               online application, the obtained model is used to continuously translate the user’s brain activity into affective music, thereby closing the loop through
               continuous affective brain interactions.
               https://doi.org/10.1371/journal.pone.0213516.g001

                                                provides results of these two studies, which is followed by a discussion and concluding remarks
                                                in Section 4.

                                                2 Materials and methods
                                                2.1 Automatic music generation system
                                                Music can be thought of as a combination of harmonic, rhythmic and timbre components that
                                                change over time. The automatic music generation system was implemented as a rule-based
                                                probabilistic algorithm (see Fig 2A(b)), inspired by the work of Wallis et al. in 2008 [39]
                                                and 2011 [40], however with widely different technical realization. Our algorithm generates
                                                streams of MIDI-events, whereupon the occurrence and type of events are modulated by sev-
                                                eral continuous control parameters. These control parameters were implemented such that

               Fig 2. Schematic illustration of the automatic music generation system. (A) mapping of valence and arousal onto music structural parameters (a),
               state-machine to generate MIDI patterns (b), virtual instruments to translate MIDI patterns into sound (c). (B) Exemplary synthesized musical
               trajectory through affective space (valence-arousal-model according to [38]).
               https://doi.org/10.1371/journal.pone.0213516.g002

PLOS ONE | https://doi.org/10.1371/journal.pone.0213516 March 18, 2019                                                                                             4 / 24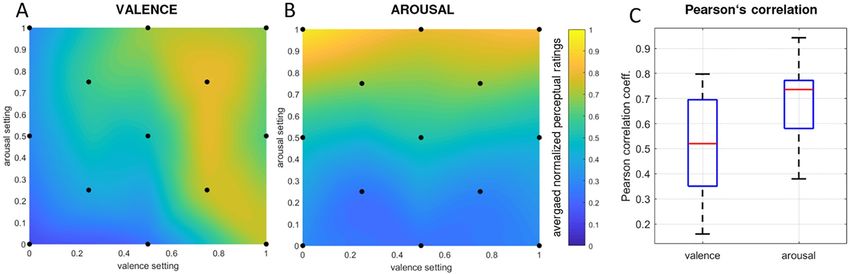
A music-based BCI for emotion mediation

                                           they modulate the musical pattern according to five music structural components, namely:
                                           harmonic mode, tempo, rhythmic roughness, overall pitch, and relative loudness of subsequent
                                           notes. According to their settings, different musical patterns are generated. However, these
                                           parameters do not inherently allow the generation of emotion-specific musical patterns. The
                                           crucial aspect of the technical realization is illustrated in Fig 2A(a): Several psychological stud-
                                           ies [41–43] have shown functional relationships between music structural parameters and
                                           emotional responses expressed by valence and arousal (see [38]). We employed a subset of
                                           functional relationships proposed by Gomez and Danuser in 2007 [43] to map two emotion-
                                           related parameters (valence and arousal, val; aro 2 ½0; 1� � R) onto the five implemented
                                           music structural parameters (input to the algorithm). The music generation system’s input
                                           controls and the generated musical patterns are consequently emotion-related. The MIDI-pat-
                                           terns are sent over a virtual MIDI path (MIDI Yoke) to software (ProTools 8 LE) hosting vir-
                                           tual instruments (Fig 2A(c)) that are then translated into sound (playback engine was an
                                           AVID MBox3 Mini external soundcard). In total 3 virtual instruments (piano, cello, bass)
                                           were controlled with the MIDI-signals, resulting in a musical style comparable with a small
                                           classical chamber orchestra (sound examples are available online here: http://ics.ei.tum.de/~
                                           ehrlich/affectiveBCI/). The music structural parameters were implemented as described below.
                                           The smallest note entity was set to an eighth note whose duration notedur is determined by the
                                           parameter tempo. Tempo was functionally related to arousal according to Eq 1. The number
                                           of notes played within one bar was randomly set based on a probability determined relative to
                                           the arousal input parameter according to Eq 2. This parameter was called rhythmic roughness
                                           as it controls the amount of notes being played, with more notes resulting in more complex
                                           rhythmicity. The velocity (loudness) of each note was uniform randomly set within a loudness
                                           range, whereupon the range is determined by the parameter relative loudness of subsequent
                                           tones. Relative loudness was functionally related to arousal according to Eq 3. The pitch regis-
                                           ter wherein one note notereg is played was also randomly set, such that the probability for high
                                           (C5), middle (C4) or low registers (C3) is determined by the parameter pitch. Pitch was func-
                                           tionally related to valence according to Eq 4. The parameter harmonic mode determines
                                           which chords are played within one chord progression. One chord progression consists of four
                                           subsequent bars; one chord is played per bar. The tonal key was fixed to C-major, as well as the
                                           harmonic progression to I-IV-V-I (among the most common chord progressions in music
                                           composition [44]). According to the principle of Kirchentonleitern, seven harmonic modes
                                           are possible. An order of these modes from positive to negative valence has been proposed by
                                           Schmuckler in 1989 [45], namely: 1. Lydian (4th mode), 2. Ionian (1st mode), 3. Mixolydian
                                           (5th mode), 4. Dorian (2nd mode), 5. Aeolian (6th mode), 6. Phrygian (3rd mode), and 7.
                                           Locrian (7th mode). The resulting chord progression is determined by the selected mode (Lyd-
                                           ian mode, e.g. would result in the following chord progression: ||:Fmaj|Cmaj|Bdim|Fmaj:||). Har-
                                           monic mode follows a 7-step discrete order, and is related to valence in a discrete manner
                                           according to Eq 5. Note that all parameters, with the exception of harmonic mode, are contin-
                                           uous.

                                                                     tempo : notedur ¼ 0:3      aro � 0:15 � R                             ð1Þ

                                                                           rhythm : pðnote ¼ 1Þ ¼ aro                                      ð2Þ

                                                                loudness : notevel ¼ unif f50; 40 � aro þ 60g � N                          ð3Þ

PLOS ONE | https://doi.org/10.1371/journal.pone.0213516 March 18, 2019                                                                   5 / 24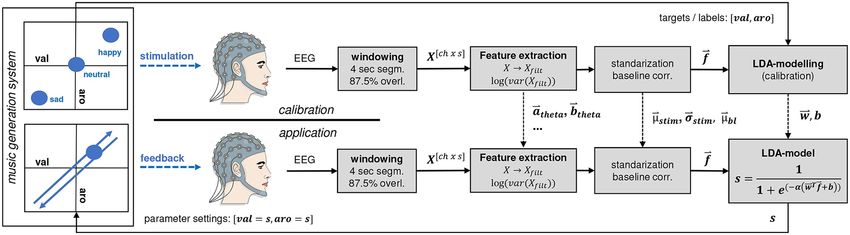
A music-based BCI for emotion mediation

                                                                             8
                                                                             >
                                                                             > pðC3Þ ¼ 2 � val                  if val < 0:5
                                                                             >
                                                                             <
                                                          pitch : notereg   ¼ pðC5Þ ¼ 2 � ðval     0:5Þ         if val � 0:5              ð4Þ
                                                                             >
                                                                             >
                                                                             >
                                                                             :
                                                                               C4                               otherwise

                                                                         mode ¼ 7   ð6 � valÞ 2 1; :::; 7 � N                             ð5Þ

                                              The way the music generation system was implemented allows for generating continuous
                                           streams of music patterns with particular qualities of emotional expressiveness (parameteriz-
                                           able with the respective input parameters valence and arousal). By gradually changing the
                                           input parameters, the algorithm’s generated music patterns flow seamlessly and gradually
                                           change in terms of emotional expressiveness. Any desired ‘trajectory’ through the valence-
                                           arousal-space is therefore possible, e.g. going continuously from happy over sad towards angry
                                           musical expressiveness (see exemplary trajectory in Fig 2B). This principle allows the integra-
                                           tion of the algorithm into an online BCI architecture according to our initially proposed con-
                                           cept (Fig 1). The applicability of the automatic music generation system is, however, not
                                           restricted to the use case described in this work. The system was also employed in one of our
                                           previous works on continuous augmentation of speech with affective synthesized music based
                                           on real-time speech emotion recognition [46].

                                           2.2 Affective BCI architecture
                                           We developed a functional prototype of our concept by introducing the automatic music gen-
                                           eration system into an online BCI architecture. In the following sections we first describe the
                                           system calibration, then the procedure of building emotion classification models based on
                                           EEG data recorded during calibration, and, finally, how we apply the emotion classification
                                           model online to continuously translate the user’s affect into a musical representation using the
                                           automatic music generation system.
                                               2.2.1 Calibration. For a first proof-of-concept, we purposely simplified a few aspects
                                           of the prototype development. For instance, during the calibration phase, the listener was
                                           exposed to three classes of musical excerpts generated by the automatic music generation sys-
                                           tem, namely: sad (low-arousal-negative-valence), neutral (intermediate-arousal-intermediate-
                                           valence), and happy (high-arousal-positive-valence). Out of these three classes of musical
                                           excerpts, only two classes (sad, happy) were used for the subsequent modeling step. This sim-
                                           plification allowed us to treat the modeling step as a binary classification problem. The neutral
                                           excerpts were introduced as a mediator between the two classes of interest (e.g., to reduce the
                                           contrast between subsequently presented excerpts). Each excerpt was presented two times for
                                           20 sec each in a pseudo-randomized order, such that subsequent excerpts were always of dif-
                                           ferent classes. The excerpts were separated by idle periods of 10 sec in which no music was pre-
                                           sented. The total calibration time was around three minutes. Brain activity during calibration
                                           was measured via a 14-channel Emotiv EPOC EEG system with a sampling rate of 128 Hz.
                                               2.2.2 Modeling. After presentation of the calibration excerpts, the recorded EEG data
                                           were automatically modeled offline in 10 steps (Fig 3, top): (1) The respective listening periods
                                           of the two classes of interest and the intermittent idle periods were extracted from the continu-
                                           ous EEG data. (2) The data were further partitioned into segments with a window size of 4 sec
                                           and an overlap of 87.5%. In previous in-house pilot experiments, we varied the window size (1,
                                           2, 4, and 8 sec) and empirically found the best system performance for 4 sec. segments. We

PLOS ONE | https://doi.org/10.1371/journal.pone.0213516 March 18, 2019                                                                  6 / 24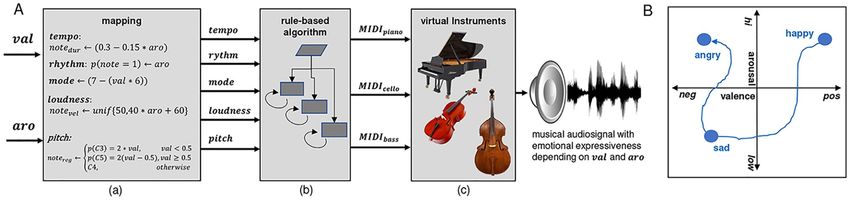
A music-based BCI for emotion mediation

                                                defined 87.5% overlap as this resulted in a reasonable update rate of 0.5 sec. during online
                                                application. (3) The EEG data were filtered into 5 frequency bands by means of 2nd order zero-
                                                phase Chebyshev IIR-bandpass filters. Please note that no continuous filtering was performed;
                                                zero-phase filtering was conducted on each segment independently after windowing. This
                                                approach was chosen to avoid unnecessary delays introduced by filtering. The selection of fre-
                                                quency bands was based on the standardized recommendations [47], namely theta (4-7 Hz),
                                                alpha (8-13 Hz), low beta (14-21 Hz), high beta (22-29 Hz) and gamma (30-47 Hz). We
                                                excluded delta-band (0-4 Hz) as low frequency components in the EEG are prone to contami-
                                                nation by eye-movement artifacts and slow signal drifts. Furthermore, we separated the beta-
                                                band into a low and high components because of its large bandwidth in comparison to the
                                                other frequency bands. (4) Spectral band power features f were extracted by computing the
                                                log-variance f = log(var(xfilt(t))) of each segment xfilt(t) for all 14 channels and 5 frequency
                                                bands, resulting in a total of 70 features, 80 observations per class, and 120 observations for the
                                                idle condition. (7) The observations from the idle condition were averaged, forming a base-
                                                line-vector. (8) The baseline-vector was then subtracted from each observation of the feature
                                                vector, resulting in class-wise observations with cleared baseline. (9) The baseline-cleared
                                                observations from the two classes of interest were then standardized. (10) Finally, the observa-
                                                tions were used to build a classification model based on Linear Discriminant Analysis (LDA).
                                                The LDA discriminant function is the hyperplane discriminating the feature space corre-
                                                sponding to two classes: yðxÞ ¼ w   ~T~ f þ b, with ~                           ~ being the normal
                                                                                                    f being the feature vector, w
                                                vector to the hyperplane (or weight vector), b the corresponding bias. The weight vector and
                                                bias were computed by w  ~ ¼ ðm~2 m~1 ÞðS1 þ S2 Þ 1 and b ¼ w   ~T ðm~1 þ m~2 Þ, with m
                                                                                                                                      ~j being the
                                                class-wise means, and Sj being the class-wise covariance matrices.
                                                   2.2.3 Online application. During online application, the previously built LDA-model was
                                                used as a translator of EEG signals into input parameter settings for the automatic music gen-
                                                eration system (Fig 3, bottom). Incoming EEG data (in segments of 4 sec with 87.5% overlap)
                                                were used for online feature extraction and classification. Identical to the calibration phase, 70
                                                band-power features were extracted from one segment of EEG data (see processing pipeline in
                                                section 2.2.2). The baseline vector and the standardization parameters obtained during the off-
                                                line modeling phase were used to clear the baseline and subsequently rescale the feature vector.
                                                According to Eq 6, the feature-vector ~f was then applied to the formerly built LDA-model to
                                                calculate the distance from the decision hyperplane separating the two classes of interest, given

               Fig 3. BCI architecture. Signal processing and information flow during calibration (top row) and online application (bottom row) of the system. Note,
               the dual use of the automatic music generation system in both cases for providing either open-loop stimulation (calibration) or closed-loop feedback
               (application). The black dashed lines indicate model-specific parameters (filter parameters, standardization and baseline parameters, and classifier
               parameters) that were obtained during calibration, and utilized during online application.
               https://doi.org/10.1371/journal.pone.0213516.g003

PLOS ONE | https://doi.org/10.1371/journal.pone.0213516 March 18, 2019                                                                                        7 / 24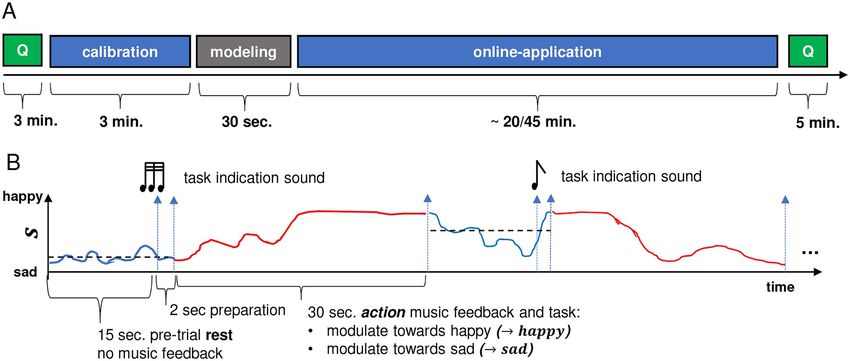
A music-based BCI for emotion mediation

                                           by the normal vector w ~ and bias b of the hyperplane. The sigmoid function scales the LDA-
                                           classifier output resulting in the final control signal s 2 (0, 1) (referred to as ‘score’ in the
                                           remainder of this paper). This controls the system reactivity; in other words, the steepness,
                                           determined by sigmoid function parameter α, controls how sensitive the score changes
                                           with regard to changes in the feature vector. This parameter was set to α = 2, which was deter-
                                           mined empirically based on subjective assessment of the system reactivity (perceived feedback
                                           latency) in previous pilot experiments. Each score update (one per 0.5 sec) was subsequently
                                           translated into an update of the music generation system’s input parameters, with val = s and
                                           aro = s. Closing the loop was achieved by playing back the resulting musical patterns to the
                                           subject. This enabled the subject to interact with the affective musical feedback along a contin-
                                           uous scale between the affective states sad (low-arousal-negative-valence) and happy (high-
                                           arousal-positive-valence).

                                                                                         1
                                                                           s¼              w T~
                                                                                         að~
                                                                                                      ;   s 2 ð0; 1Þ                               ð6Þ
                                                                                1 þ eð        f bÞÞ

                                           2.3 Listening study: Evaluating the affective responses of the algorithmic
                                           compositions
                                           The purpose of this study was to investigate whether participants’ affective responses to the
                                           generated musical patterns were in accordance with the corresponding valence and arousal
                                           settings of the music generation system. That is, the listening study was meant to evaluate and
                                           validate the functionality of the automatic music generation system, a prerequisite for justify-
                                           ing its use in the online BCI system.
                                               2.3.1 Listening study participants. Eleven healthy participants (age: 26.9±3.4 yrs; 7
                                           males, 4 females) participated in this study. The group consisted of 4 musicians (with at least 5
                                           years of formal musical education) and 7 non-musicians. All participants reported regularly
                                           listening to music at least several days per week. Music preferences ranged across classical,
                                           pop, rock genres, hip-hop, latin, electronic, and experimental music. Regardless of musical
                                           expertise or listening preferences, all participants were given the same instructions prior to
                                           the experiment. In addition, all participants signed a data collection consent form prior to the
                                           study. The study was approved by the Institutional Review Board (IRB) of the National Uni-
                                           versity of Singapore (NUS) under reference number 08-036.
                                               2.3.2 Listening study stimuli. The automatic music generation system’s input parame-
                                           ters span a two-dimensional emotional scale (valence-arousal model). In total, 13 uniformly-
                                           distributed locations in the valence-arousal space were selected to be presented as stimuli.
                                           The individual stimuli for each of the 13 locations were specific musical patterns arising
                                           from the settings of the music generation system’s input parameters: {val,aro} = [{0,0};
                                           {0,0.5}; {0,1}; {0.25;0.25}; {0.25,0.75}; {0.5,0}; {0.5,0.5}; {0.5,1}; {0.75,0.25}; {0.75,0.75}; {1,0};
                                           {1,0.5}; {1,1}]. The order of presentation of the stimuli was pseudo-randomized for each indi-
                                           vidual participant.
                                               2.3.3 Listening study experiment protocol. The experiment took place in a quiet room
                                           without visual or auditory distraction. Music was played back via an AVID Mbox Mini (exter-
                                           nal sound-card) and Sennheiser earphones. The volume was set to a comfortable listening vol-
                                           ume and participants were allowed to manually correct the volume at the beginning of the
                                           experiment to their preferred level. The participants were first instructed (verbally and by
                                           means of an instruction text) about the experiment setup, and then completed a brief question-
                                           naire capturing demographic information and music preferences. Next, the 13 music excerpts
                                           were consecutively presented to the participants for 30 sec each. Participants were asked to

PLOS ONE | https://doi.org/10.1371/journal.pone.0213516 March 18, 2019                                                                           8 / 24
A music-based BCI for emotion mediation
keep their eyes closed during music-listening in order to avoid distraction. After each excerpt,
the participants were asked to rate their emotional responses by means of the Self-Assessment
Manikin (SAM) [48], which is essentially a visual representation of a 9-point Likert scale. Par-
ticipants were allowed to take as long they desired to make each rating. The experiment was
approximately 15 minutes in duration per participant.
2.4 BCI study: Evaluating the affective closed-loop interaction
2.4.1 BCI study objective and hypothesis. The purpose of this pilot study was to investi-
gate to what extent participants were able to gain control over the music feedback, i.e., volun-
tarily change the music feedback by modulating their brain activity accordingly. We were
interested in what strategies participants would develop to attain such voluntary modulations
of the music feedback. Gaining control over the musical feedback would imply that partici-
pants are able to effectively mediate their own emotional states; this finding would support the
usability of BCI system to foster self-regulation of affective responses.
2.4.2 BCI study participants. Five healthy participants (age: 27.8±5.0, all males, all right-
handed) participated in this study. Four participants had no formal education in music. The
remaining participant had six years of formal musical training, but had not played music in
the seven years prior to this experiment. All participants reported regularly listening to music
more than a few minutes per day. Music preferences varied between rock, pop, and more spe-
cific music genres such as electronic music, folk, and hip-hop. All participants took part volun-
tarily and gave written consent. The study was approved by the Institutional Review Board
(IRB) of the National University of Singapore (NUS) under reference number 08-036.
2.4.3 BCI study experiment protocol. The experiment took place in a quiet room without
visual or auditory distractions. EEG data was recorded with a 14-channel emotiv EPOC EEG
system. While signal quality and spatial resolution of the emotiv EPOC is lower than that of
high-density research-grade gel-based EEG system, a number of publications have demon-
strated that the emotiv EPOC system can successfully be employed in different experimental
paradigms [49, 50], including neurofeedback applications [15]. In contrast to research-grade
EEG systems, the emotiv EPOC system is inexpensive, requires only brief preparation time
(around 5 min), is easy to handle (no professional training is needed), supports wireless data
transmission (high mobility), and has a comparably unobtrusive design. This offers clear
methodological advantages when deploying and validating our approach outside of the labora-
tory in the future (e.g., in elderly care centers). EEG electrodes were arranged according to the
international 10-20 system [51] (AF3, AF4, F7, F8, F3, F4, FC5, FC6, T7, T8, P7, P8, O1, O2)
and all leads were referenced to the average of two reference channels located at the locations
P3 and P4. The sampling rate was fixed to 128 Hz. Signal quality was checked with the emotiv
TestBench software prior to the start of the experiment. Sensors were adjusted until connectiv-
ity reached the ‘green’ level (corresponding to an impedance of < 220kO according to [50]).
The participants were seated on a comfortable chair, and music was played back via an AVID
Mbox Mini (external sound device) and Panasonic earphones. The music volume was set to a
comfortable listening volume, and participants were allowed to manually adjust the volume of
the music at the beginning of the experiment to their preferred level. The experiment protocol
is depicted in Fig 4A. The participants were instructed (verbally and by means of written
instructions) about the experiment procedure, and then completed a questionnaire capturing
demographic information and music preferences. Furthermore, participants were asked to
perform a self-assessment of their current mood based on a custom-made questionnaire with
14 opposing emotional attributes on a 7-point scale (e.g. stressed versus relaxed). The experi-
ment started with a 3-minute calibration phase, followed by automated building of the
PLOS ONE | https://doi.org/10.1371/journal.pone.0213516 March 18, 2019 9 / 24A music-based BCI for emotion mediation
Fig 4. BCI study experiment protocol (A) and trial structure (B). (A) Each session began with a questionnaire, followed by a calibration phase and
subsequent modeling of the emotion classifier. Afterwards, the main part of the experiment, the online application phase, was conducted. The
experiment ended with a second questionnaire. (B) A single trial started with a resting period of 15 sec in which no music feedback was presented to the
participant. The participant‘s EEG was recorded in the background, and the average score was used to assign, on every trial, one of the two tasks
(modulate towards happy or sad) to the participant. The subject then performed the task for a duration of 30 sec (action period).
https://doi.org/10.1371/journal.pone.0213516.g004
participant individual emotion classification model based on the recorded EEG data during
the calibration phase (c.f. Section 2.2.2 for details about technical implementation). The partic-
ipants were deliberately not given any hints on how to achieve the feedback modulations.
Instead, the participants were asked to develop an individual strategy, that they were allowed
to change throughout the experiment. According to the continuous metric between high-
valence-high-arousal (happy) and low-valence-low-arousal (sad), participants were asked to
perform two different tasks: modulate music feedback towards happy patterns and modulate
music feedback towards sad patterns.
A detailed description of the experimental design is shown in Fig 4B. One trial consisted of
a resting-period of 15 sec and a subsequent action-period of 30 sec. Although participants
were not explicitly instructed to try to modulate the musical feedback through the use of emo-
tion imagery, we hypothesized that they would employ this type of approach. Therefore, we
based the durations of the resting and action periods on a study using emotion imagery by
Sitaram et. al in 2011 [52]. They specified 24 seconds for the emotion imagery task and 4.5 sec-
onds for the resting period. During the resting period, no music feedback was provided; the
participants had no specific task and were asked to relax and prepare for the next trial. The
score was acquired during this resting period, and the data were then averaged to determine
which of the two tasks the participant would be given during the action-period. When the
average resting-score tended towards a sad state (< 0.5), the task modulate towards happy was
given. Conversely, when the average resting-score tended towards a happy state (>= 0.5), the
task modulate towards sad was given. Participants were informed about which of the two tasks
they had to perform two seconds before the start of the action period. The indication of the
task was realized by means of two different emotionally neutral indication sounds with the
same duration, pitch, and loudness-level: three subsequent short tones indicated the task
‘modulate towards happy‘, and one long tone indicated the task ‘modulate towards sad‘.
The action period started with the onset of music feedback and lasted for 30 seconds, during
which participants tried to modulate the music feedback towards the desired state according
PLOS ONE | https://doi.org/10.1371/journal.pone.0213516 March 18, 2019 10 / 24A music-based BCI for emotion mediation
to the given task. The end of the action period marked the start of the subsequent resting
period of the next trial. Participants were asked to sit still and limit their movement, keeping
their eyes closed throughout the entire online application phase (including the resting and
action periods).
Each participant took part in the BCI experiment twice (on two separate days). In the first
session, the participant performed 20 interaction trials (approximate duration of 15 min) to
become comfortable with the environment and the experimental setup. In the second session,
participants were asked to perform 50 interaction trials (approximate duration of 38 min). In
each session, and for each participant, the emotion classification model was (re-)calibrated.
The preparation time (questionnaires and calibration) was around 10 min and identical in
both sessions; thus the total duration of session 1 was around 25 min (15 min online interac-
tion) and of session 2 around 50 min (38 min online interaction). At the end of each session,
participants were asked to describe their experience and strategies while performing the music
feedback modulations verbally and by means of a short written text.
3 Results
3.1 Listening study
We discuss below the results of the listening study, where participants provided arousal and
valence ratings for each musical excerpt (c.f. Table 1). The raw data of perceptual ratings
revealed varying means across participants, e.g. some participants had a bias towards lower rat-
ings and others a bias towards higher ratings. These variations might have been a result of the
participants using different reference frames to make their ratings, possibly due to varying
music preferences. In order to normalize these variations we rescaled the perceptual ratings of
each participant between 0 and 1 for valence and arousal separately. Fig 5A shows the averaged
interpolated valence ratings across all presented excerpts. The valence ratings seemed to be
influenced by arousal such that excerpts with perceived low arousal produced a bias towards
negative valence, whereas the opposite effect is visible for high arousal. Although the results
are not optimal due to non-independent valence and arousal ratings, the ratings generally
reflected an increase of rated valence relative to an increase of the target values for valence.
Table 1. Listening study results. The music generation system’s parameter settings (target valence/arousal) and corre-
sponding perceptual ratings for valence and arousal (MEAN±SD, n = 11).
target ratings
No. val aro val aro
1 0 0 0.12±0.12 0.30±0.32
2 0 0.5 0.30±0.19 0.51±0.35
3 0 1 0.29±0.31 0.95±0.15
4 0.25 0.25 0.39±0.34 0.25±0.26
5 0.25 0.75 0.58±0.29 0.67±0.28
6 0.5 0 0.23±0.18 0.23±0.28
7 0.5 0.5 0.50±0.27 0.52±0.28
8 0.5 1 0.69±0.28 0.80±0.21
9 0.75 0.25 0.74±0.32 0.29±0.24
10 0.75 0.75 0.79±0.23 0.68±0.21
11 1 0 0.73±0.26 0.29±0.24
12 1 0.5 0.62±0.33 0.45±0.24
13 1 1 0.67±0.27 0.83±0.20
https://doi.org/10.1371/journal.pone.0213516.t001
PLOS ONE | https://doi.org/10.1371/journal.pone.0213516 March 18, 2019 11 / 24A music-based BCI for emotion mediation
Fig 5. Listening study perceptual ratings. (A) Interpolated valence- and (B) arousal-ratings averaged across subjects. (C) Distribution of per-subject
Pearson correlation coefficients between perceptual ratings and the music generation system‘s parameter settings for valence and for arousal.
https://doi.org/10.1371/journal.pone.0213516.g005
In contrast to the valence ratings, arousal ratings were nearly independent from perceived
valence (Fig 5B). An increase in the target arousal setting is clearly reflected in an increase in
the perceived average arousal. Participants’ arousal ratings nicely reflected the music genera-
tion system‘s target values for arousal, as hypothesized. The relatively high standard deviations
(c.f. Table 1) may be explained by considerably large variations in participants’ cultural back-
ground, musical education, and listening preferences, not to mention the relatively small sam-
ple size. Furthermore, the understanding and interpretation of the SAM scheme may have
differed slightly from participant to participant. Additionally, for each individual participant,
we computed Pearson‘s linear correlation coefficients between the perceptual ratings and the
corresponding music generation system‘s input parameters of all 13 excerpts, for valence and
arousal ratings separately. Fig 5C shows the distribution of the correlation coefficients across
participants (n = 11), with a median correlation of rval = .52 for valence, and of raro = .74 for
arousal. For valence ratings, significant correlation coefficients (p < 0.05) with target valence
were reached in 5 out of 11 participants; for arousal ratings, significant correlation coefficients
with target arousal were reached in 8 out of 11 participants.
3.2 BCI study
3.2.1 Evaluation of offline model performance. In order to obtain an estimate of the per-
formance of the individual models built prior to the start of the online application phase, we
performed 10-fold cross-validations (CV) on the calibration data. Because the calibration data
contained only two trials per class, we were unable to perform trial-based cross-validation that
would yield meaningful results. Therefore, we decided to partition the data into non-overlap-
ping windows of 1 second in duration. This produced 80 observations (40 per class). We per-
formed the cross-validation by splitting the data into 10 folds, where 9 folds were used for
training and the remaining fold was used for testing the model. The folds were then shuffled
10 times such that all folds were used once for testing. The entire procedure was repeated 100
times to obtain a stable estimate of the average performance, resulting in 1000 individual test
results, which were then averaged for every model. The averaged results for each model (for
every participant/session combination) are reported in Table 2. The average accuracy (i.e., cor-
rectly classified samples) across all participants is 58.4% for session S01 with an avg. AUC of
0.58 and 64.9% for session S02 with an avg. AUC of 0.65. The binary chance-level threshold
given the number of observations per participant (n = 80) and equal prior probabilities is
PLOS ONE | https://doi.org/10.1371/journal.pone.0213516 March 18, 2019 12 / 24A music-based BCI for emotion mediation
Table 2. Offline model performance results. Offline model performance based on 100-times-10-fold cross-validation for all subjects (P01-P05) and sessions (S01 and
S02). Offline decoding performance is expressed in form of percentage of correctly classified observations per class (happy and sad), overall correctly classified instances
(ACC) and via the area under receiver operator curve (AUC).
S01 S02
happy sad ACC AUC happy sad ACC AUC
P01 49.1% 45.6% 47.3% 0.47 72.6% 76.4% 74.5% 0.75
P02 60.6% 50.7% 55.8% 0.56 61.4% 53.9% 57.6% 0.58
P03 72.1% 52.5% 62.3% 0.62 65.7% 68.0% 66.8% 0.67
P04 65.4% 68.6% 67.0% 0.67 64.5% 62.9% 63.7% 0.64
P05 51.9% 67.6% 59.7% 0.60 63.7% 59.9% 61.8% 0.62
AVG 59.8% 57.0% 58.4% 0.58 65.6% 64.2% 64.9% 0.65
https://doi.org/10.1371/journal.pone.0213516.t002
58.75% (based on the binomial inverse cumulative distribution function with p < 0.05). There-
fore, the results were significantly higher than chance for three out of five participants (P03,
P04, P05) in session S01, and significantly higher than chance for all four out of five partici-
pants in session S02 (P01, P03, P04, P05). The improvement in average cross-validation per-
formance from session s01 to s02 is likely related to participants becoming more familiar
with the stimuli and the experimental procedure, resulting in more coherent response data.
Nevertheless, the results generally support the validity of the acquired data and the modeling
approach employed. It is worth noting that offline model performance does not directly trans-
late into the model‘s performance during online-application, because the listener in the loop
may be adapting to the music feedback during interaction.
3.2.2 Modulation performance results. After the experiment, participants were asked
to describe their strategies verbally and in the form of a short written text. All participants
reported strategies based on retrieval of emotional mental images or episodes from the past as
well as events they look forward to in the future. In addition, for the ‘modulation towards sad’
task, participant P01 reported in the second session to have successfully used the strategy of
self-inducing a “meditative state of mind”, rather than retrieving memories.
In order to quantitatively assess the participants’ performance in the given tasks, we sepa-
rated subsequent observations of the model output (score s) into resting and action periods for
each trial and task separately. The score observations were then averaged into two scalar values
per trial: the mean score of the resting-period, and the mean score of the action period. For
each individual participant and session, we then performed either a left-tailed (for the ‘! sad’
trials) or a right-tailed (for the ‘! happy’ trials) paired t-test, testing the deviation between
action and rest across all trials per participant and session according to the given task (see Fig
6). To distinguish between good and poor performance, we used a threshold at the marginal
significance level of p < 0.1. Surprisingly, although a baseline-correction was performed dur-
ing the online application phase using the acquired baseline-vector of the calibration phase,
most participants developed a bias towards one of the two affective states. This resulted in
imbalanced trials in terms of the task distribution for 7 of 10 participant-session-combina-
tions. Therefore, part of the data could not be analyzed using the proposed method due to too
few trials per specific task. However, 3 of 5 participants showed significant modulation perfor-
mance in either one or both tasks. Interestingly, the only musically educated participant (P01)
performed best in both sessions and achieved significant modulation performance in both
tasks in the second session. Yet, paradoxically, the model built for P01/S01 had very low offline
performance compared to other participant-session combinations (see Table 2). The fact that
P01 performed relatively well in S01 may indicate that this subject was able to successfully
adapt and compensate for the insufficiencies of the model during the online testing phase.
PLOS ONE | https://doi.org/10.1371/journal.pone.0213516 March 18, 2019 13 / 24A music-based BCI for emotion mediation
Fig 6. Average modulation performance. The bars represent the mean difference �s diff between the model score of the action period minus the
corresponding resting period, averaged across trials (Eq 11) separated in sessions (S01: A and B; S02: C and D) and task (! happy: A and C; ! sad: B
and D). Numbers in parentheses denote the number of trials for the respective participant/task/session combination and the asterisks (� ) those
combinations with significant modulation performance.
https://doi.org/10.1371/journal.pone.0213516.g006
Fig 6 shows the average modulation performance in form of the mean difference �s diff between
the model score of the action period minus the corresponding resting period, averaged across
trials (Eq 11). One can observe that in almost all participant/session/task-combinations,
successful modulations were performed, except for P02/S01/! sad and P03/S02/! happy.
However, the modulations were only statistically significant in some participant/session/task-
combinations (denoted with an asterisk (� )).
3.2.3 Analysis of relationships between modulation performance and mood self-assess-
ment. Besides the objective performance measures obtained in the previous analysis, we were
interested in whether observed performance variations among participants and sessions are
explained by subjective mood self-assessment ratings provided by the participants before the
start of each session, e.g. whether measures of self-assessed mood predicted subsequent perfor-
mance in the interaction tasks.
For each participant-session-combination, we designed three objective performance mea-
sures: resting mean (RM), action mean (AM), and total deviation (TD), as shown in Eqs 7–10,
where s denotes the score and n denotes the total number of task- and period-specific score
observations and m the number of trials of the corresponding condition.
1X m
1X n
RM ¼ s ð7Þ
m i¼1 n j¼1 rest
PLOS ONE | https://doi.org/10.1371/journal.pone.0213516 March 18, 2019 14 / 24A music-based BCI for emotion mediation
1X m
1X n
AM ¼ s ð8Þ
m i¼1 n j¼1 action
TDhappy ¼ AMhappy RMhappy ð9Þ
TDsad ¼ RMsad AMsad ð10Þ
1X m
1Xn
1X n
�s diff ¼ ð s s Þ ð11Þ
m i¼1 n j¼1 action n j¼1 rest
We computed Pearson‘s correlation coefficients between the 6 performance measures and
the mood self-assessment ratings across all participant-session combinations. The results for
mood assessment ratings that significantly correlated with RM, AM, and/or TD are shown in
Table 3. The analysis revealed that participants performed larger modulations towards the sad
condition if they felt concentrated (rather than distracted) and angry (rather than content)
prior to start of the experiment. In addition, a tendency for lower resting mean was discovered
when participants felt more calm (rather than excited) before the study. The resting and action
means in the ! happy task correlated with the level of tiredness vs. awakeness reported by
the participants prior to the experiment. As a result, for this condition, reports of feeling
exhausted, scattered, and tired prior to the study biased the resting and action means to be
higher.
3.2.4 Preliminary results indicating brain activity modulation. For our final analysis,
we examined participants’ brain activity while performing the modulation tasks. The objective
of this analysis was to support the behavioral results reported in the previous section with cor-
responding electrophysiological results. Specifically, we investigated whether certain kinds of
EEG oscillatory brain activity were associated with particular emotion states, as emotion states
have been associated with different EEG correlates in the literature (for a review see [53]). In
the frequency domain, variations in alpha power have been associated with affective valence
[54] and discrete emotions such as happiness, sadness, and fear [55]. Beta band power over
right temporal sites has been shown to correlate positively with affective valence [56], and
gamma band power modulations have been related to discrete emotions such as happiness
Table 3. Correlation analysis results. Correlation coefficients, across all participant-session combinations for task ‘modulate towards happy’ (!happy) and task ‘modu-
late towards sad’ (!sad), between performance measures (resting mean (RM), action mean (AM), total deviation (TD)) and mood assessment ratings (for the six signifi-
cant mood scales of 14 total ratings made by participants).
! happy ! sad
RM AM TD RM AM TD
exhausted vs. refreshed -.59 -.61
calmed vs. excited -.44
distracted vs. concentrated .67�
scattered vs. focused -.57 -.56
angry vs. contented -.56
�
tired vs. awake -.61 -.68
Note: Correlations are provided above that have at least marginal significance (p < 0.1). Asterisks (� ) denote a significant correlation of p < 0.05.
https://doi.org/10.1371/journal.pone.0213516.t003
PLOS ONE | https://doi.org/10.1371/journal.pone.0213516 March 18, 2019 15 / 24A music-based BCI for emotion mediation
and sadness [57–59]. Hence, to support the assumption that participants performed inten-
tional music feedback modulations by self-inducing corresponding emotions, we hypothesize
here that feedback modulations were accompanied by changes in emotion-relevant EEG corre-
lates, especially in the alpha, beta, and gamma bands. For this analysis, we focused on session
S02, and the task ! happy, because all participants performed a sufficiently large number of
trials (at least 27 times) in this task. Furthermore, only subjects with at least marginally signifi-
cant modulation performance for the task ! happy in session S02 were included in this analy-
sis. This criterion excluded participants P02 and P03, leaving participants P01, P04, and P05
for the analysis. We performed a pseudo-online analysis by processing the continuous raw
EEG data as in the online application of the original experiment: 4-second long EEG segments
were fed into the model segment-by-segment with an overlap of 87.5% in the processing chain
(c.f. Section 2.2.3). We then extracted all data segments from the ! happy (action-period)
task, as well as all segments belonging to their corresponding resting periods. For the analysis
all data from the respective subjects and task were used; no artifact removal was performed.
On each trial, we computed the mean bandpower across all segments of the action-period and
subtracted the mean bandpower from all segments of the corresponding resting period. This
resulted in one observation per trial (action minus rest) and 70 features in total (14 channels x
5 frequency bands). We then performed within-participant standardization of the observations
in order to minimize inter-participant variations. Finally, we performed Bonferroni-corrected
multiple t-tests on all features (p < (0.05/70)) in order to test for significant differences. The
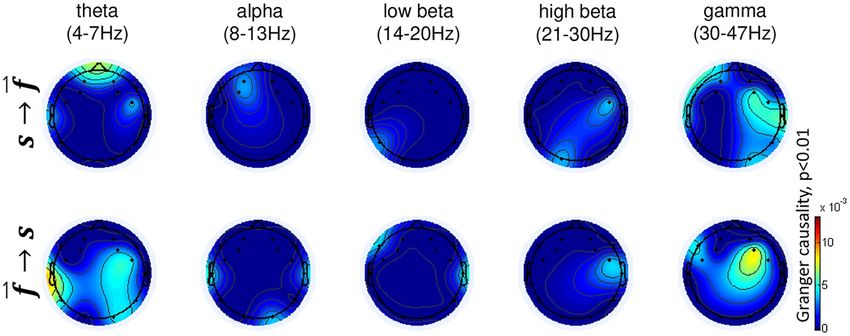
results are depicted in Fig 7 and show that music feedback modulations towards the happy
state were accompanied by significant power decrease in beta band over frontal areas, in par-
ticular in the high beta band (21-30Hz), as well as a significant increase in gamma band power
over the fronto-central right hemisphere. These effects are largely driven by subjects s01 and
s05, who exhibited similar topographic plots for all frequency bands. In s04, decreased frontal
beta power and a general increase in gamma power are also observable, but are weaker than in
s01 and s05.
Granger causality: The closed-loop experimental design allowed us to conduct an explor-
atory causality analysis to elucidate which neural modulations may have likely contributed to
changes in music feedback (and which modulations resulted from hearing the music). One
may argue that the significant modulations observed in participants P01, P04, P05 merely
reflect a reaction to the onset of the presentation of the music stimuli rather than an effect that
reflects a bi-directional interaction between brain activity and musical feedback. To account
for this possibility, we performed a causality analysis to investigate whether brain activity
Fig 7. Brain activity modulations during online application in task ! happy averaged across participants P01, P04, and P05. Music feedback
modulations toward the happy state were accompanied by significant power decrease in beta band over frontal areas (a), as well as an increase in
gamma power over the right hemisphere (b). The highlighted channels indicate Bonferroni-corrected statistically significant modulations comparing
action and resting periods (action minus rest), (p < 0.05).
https://doi.org/10.1371/journal.pone.0213516.g007
PLOS ONE | https://doi.org/10.1371/journal.pone.0213516 March 18, 2019 16 / 24You can also read