A methodology to conduct wind damage field surveys for high-impact weather events of convective origin
←
→
Page content transcription
If your browser does not render page correctly, please read the page content below
Nat. Hazards Earth Syst. Sci., 20, 1513–1531, 2020
https://doi.org/10.5194/nhess-20-1513-2020
© Author(s) 2020. This work is distributed under
the Creative Commons Attribution 4.0 License.

A methodology to conduct wind damage field surveys for
high-impact weather events of convective origin
Oriol Rodríguez1 , Joan Bech1 , Juan de Dios Soriano2 , Delia Gutiérrez2 , and Salvador Castán3
1 Department of Applied Physics – Meteorology, University of Barcelona, Barcelona, 08028, Spain
2 Agencia Estatal de Meteorología, Seville, 41092, Spain
3 Agencia Pericial, Cornellà de Llobregat, 08940, Spain

Correspondence: Oriol Rodríguez (orodriguez@meteo.ub.edu)

Received: 5 September 2019 – Discussion started: 17 September 2019
Revised: 18 April 2020 – Accepted: 2 May 2020 – Published: 29 May 2020

Abstract. Post-event damage assessments are of paramount          mogeneous and robust databases of severe weather cases and
importance to document the effects of high-impact weather-        high-impact weather events.
related events such as floods or strong wind events. More-
over, evaluating the damage and characterizing its extent and
intensity can be essential for further analysis such as com-
pleting a diagnostic meteorological case study. This paper        1   Introduction
presents a methodology to perform field surveys of damage
caused by strong winds of convective origin (i.e. tornado,        Meteorological phenomena associated with strong surface
downburst and straight-line winds). It is based on previous       wind of convective origin (i.e. tornadoes, downbursts,
studies and also on 136 field studies performed by the au-        straight-line winds) can cause important disruption to socio-
thors in Spain between 2004 and 2018. The methodology in-         economic activity, including injuries or even fatalities, de-
cludes the collection of pictures and records of damage to        spite their local character compared to larger-scale mid-
human-made structures and on vegetation during the in situ        latitude synoptic windstorms or tropical storms. For ex-
visit to the affected area, as well as of available automatic     ample, from 1950 to 2015, tornadoes in Europe caused
weather station data, witness reports and images of the phe-      4462 injuries, 316 fatalities and economic losses of at least
nomenon, such as funnel cloud pictures, taken by casual ob-       EUR 1 billion (Antonescu et al., 2016, 2017). Due to their
servers. To synthesize the gathered data, three final deliver-    economic and social impact, a large number of works have
ables are proposed: (i) a standardized text report of the anal-   been devoted to the study of these phenomena both from
ysed event, (ii) a table consisting of detailed geolocated in-    a meteorological point of view (e.g. Taszarek et al., 2017;
formation about each damage point and other relevant data         Miller and Mote, 2018; Rodríguez and Bech, 2018) and from
and (iii) a map or a KML (Keyhole Markup Language) file           the point of view of their consequences (e.g. Rosencrants and
containing the previous information ready for graphical dis-      Ashley, 2015; Strader et al., 2015).
play and further analysis. This methodology has been applied         The systematic elaboration of post-event forensic field sur-
by the authors in the past, sometimes only a few hours after      veys is still the standard way to evaluate the damage caused
the event occurrence and, on many occasions, when the type        by a strong-convective-wind event (Marshall, 2002; Marshall
of convective phenomenon was uncertain. In those uncertain        et al., 2012; Zanini et al., 2017), despite the recent progress
cases, the information resulting from this methodology con-       on assessing wind damage using remote-sensing data such
tributed effectively to discern the phenomenon type thanks        as high-resolution radar observations (Wurman et al., 2013;
to the damage pattern analysis, particularly if no witness re-    Wakimoto et al., 2018). A detailed damage analysis from
ports were available. The application of methodologies such       these meteorological phenomena allows us to estimate the
as the one presented here is necessary in order to build ho-      wind intensity using a wind damage scale such as the Fu-
                                                                  jita scale (F scale; Fujita, 1981) or the Enhanced Fujita scale

Published by Copernicus Publications on behalf of the European Geosciences Union.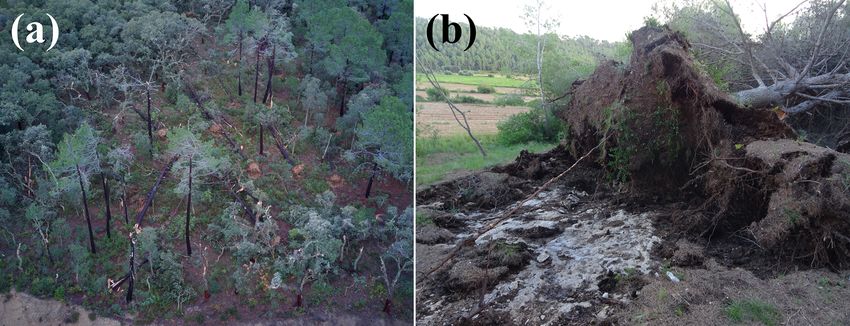
1514                                             O. Rodríguez et al.: A methodology to conduct wind damage field surveys

(EF scale; WSEC, 2006). Similarly to field surveys of hail-
storms (Farnell et al., 2009) or floods (Molinari et al., 2014;
Li et al., 2018), wind damage field studies contribute to a
better characterization of the affected area, making it pos-
sible to estimate the length and width of the damage swath
(e.g. Burgess et al., 2014; Meng and Yao, 2014; Bech et al.,
2015). Moreover, in situ damage surveys are especially use-
ful to determine which phenomenon took place when there
is an absence of observations by analysing damage patterns
on forest and how debris is spread (Hall and Brewer, 1959;
Holland et al., 2006; Bech et al., 2009; Beck and Dotzek,
2010; Rhee and Lombardo, 2018). This information can be
added to natural hazard databases such as the US Storm            Figure 1. Location of 136 analysed events in Spain using the pro-
Prediction Center Severe Weather Database (Verbout et al.,        posed methodology between 2004 and 2018, mostly concentrated in
2006) or the European Severe Weather Database (Dotzek et          Andalusia and Catalonia. Symbols indicate locations of tornadoes
al., 2009), making it possible to build up robust and homoge-     (red triangles), downbursts (blue squares), undetermined phenom-
neous datasets, improving the knowledge of spatial–temporal       ena (grey circles) and other phenomena such as gust fronts, funnel
                                                                  clouds which did not touch down or dust devils (white circles). The
distribution and characteristics of tornadoes, downbursts and
                                                                  case study location for which final deliverables are attached as the
straight-line winds.                                              Supplement is indicated on the map. Black contours delimitate re-
   Currently, field studies are usually performed to as-          gions and grey lines show provinces.
sess damage of specific strong-convective-wind events (e.g.
Lemon et al., 2003; Bech et al., 2011; Wesolek and Mahieu,
2011) but rarely to analyse in detail most of the reported        jority of the Iberian Peninsula and also the Balearic and Ca-
cases. The timing and economical costs, especially when he-       nary islands. Nevertheless, most of these field studies have
licopter flights are used, prevent carrying out in situ damage    been carried out in the Catalonia and Andalusia regions
analysis frequently (Edwards, 2020), particularly outside of      (Fig. 1), where highly densely populated areas are frequently
the USA. Therefore, there is a need for a methodology to          affected by tornadoes (Bech et al., 2007, 2011; Mateo et al.,
conduct wind damage field surveys for high-impact weather         2009; Sánchez-Laulhé, 2013; Gayà et al., 2011; Riesco et
events of convective origin that is easily reproducible any-      al., 2015). Three final deliverables are suggested to synthe-
where and should be efficient to optimize time and economic       size the data recorded: (i) a text report of the analysed event,
resources, allowing the study of as many reported events as       (ii) a table consisting of detailed geolocated information, and
possible.                                                         (iii) a map or a KML (Keyhole Markup Language) file con-
   The objective of this paper is to propose a methodology to     taining the previous information ready for graphical display
conduct in situ damage surveys of strong wind events from         and further analysis.
convective origin. It can contribute to improve the detection,       The rest of the article is organized as follows. Firstly, in
mapping and characterization of wind damage in a homoge-          Sect. 2 an overview of previous in situ fieldwork techniques
neous way, which is important to better describe specific me-     is provided. Section 3 describes, in detail, the field survey
teorological phenomena, with the particularities associated       methodology proposed. In Sect. 4 specific strengths and lim-
with damage from convective local storms. Therefore, the          itations of the methodology are discussed, as well as possible
main goal of the proposed methodology is to gather as much        uses of fieldwork data. Finally, Sect. 5 presents a summary
geo-referenced information (pictures and records) as possi-       and final conclusions of the study. In the Supplement, an ex-
ble about relevant damaged elements (i.e. human-made struc-       ample of deliverables (text report, table and KML file) of a
tures and vegetation) to reproduce the damage scenario. This      damage survey of a recent tornadic event is provided with
information should be complemented with other available           the aim to better illustrate the methodology proposed and to
data, such as witness enquiries, data from automatic weather      facilitate its application.
stations (AWSs) located close to the affected area, remote-
sensing data and images of the phenomenon together with
their location and orientation to analyse strong-convective-      2   Background
wind phenomena from a meteorological point of view.
   The methodology presented here is based on previous            McDonald and Marshall (1984) and Bunting and Smith
studies (McDonald and Marshall, 1984; Bunting and Smith,          (1993) provided guidelines to carry out strong-convective-
1993; Gayà, 2018; Holzer et al., 2018) and also on 136            wind damage surveys. There, the process of mapping data by
wind damage surveys performed between 2004 and 2018 by            locating images taken during the fieldwork was challenging
the authors. All the analysed events have been recorded in        due to non-digital cameras and the absence of Global Naviga-
Spain (south-western Europe), which includes the vast ma-         tion Satellite System on these devices. Both documents rec-

Nat. Hazards Earth Syst. Sci., 20, 1513–1531, 2020                                https://doi.org/10.5194/nhess-20-1513-2020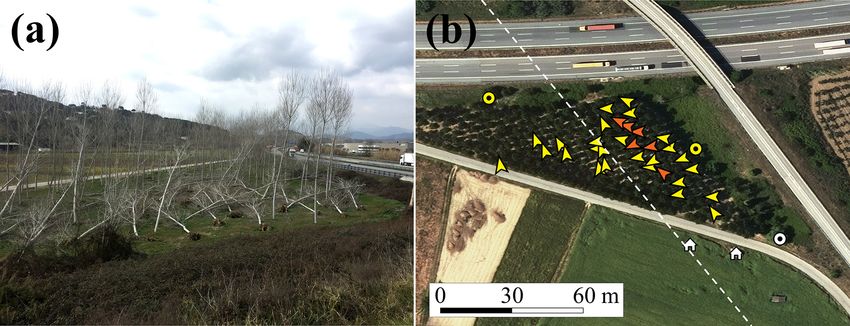
O. Rodríguez et al.: A methodology to conduct wind damage field surveys                                                     1515

ommended complementing surface observations with aerial           Table 1. Devices required to perform strong-convective-wind dam-
images if available, and, in the second one, it was also ex-      age surveys.
plained how to treat direct witnesses and ask them for spe-
cific information about the event and damage.                            Device      Device
   On the other hand, the analysis of historical events such             reference
as those of Gayà (2007) and Holzer et al. (2018) showed the              D1          Smartphone or camera with GPS image
utility of press references and in situ images taken by wit-                         geolocation and orientation (azimuth
nesses on reconstructing tornado damage paths. They pointed                          pointing) capabilities
out the necessity of geo-referencing the locations where pho-            D2          Compass
tos were taken and the damaged elements, using GIS tools                 D3          Tape measure
and triangulation methods. Furthermore, Holzer et al. (2018)             D4          Hand counter
provided useful indications for current field studies, such as           D5          Suitcase balance
visiting affected areas as soon as possible and also providing
an estimation of the wind intensity for each damaged element
given by the pair damage indicator–degree of damage (DI–          simply because of the absence of roads. Especially in these
DoD) from the EF scale (WSEC, 2006), similarly to other           cases, and also to study damaged areas in detail, walking is
authors such as Burgess et al. (2014).                            the basic way to perform the field survey.
   During the first decade of the current century, the use           Despite this not always being feasible, it would be ideal
of GPS receivers or similar systems was extended to in            that the damage survey team was multidisciplinary, being
situ damage assessments to geolocate gathered data, as dis-       formed by meteorologists, insurance inspectors, forestry en-
cussed in Edwards et al. (2013). Moreover, aerial imagery         gineers and architects experienced in damage assessments,
from helicopters or aeroplanes (e.g. Fujita, 1981; Bech et        preferably familiar with damage reporting systems such as
al., 2009) and high-resolution satellites (e.g. Molthan et al.,   the EF scale. This would facilitate an accurate and detailed
2014; Chernokulsky and Shikhov, 2018) has also been fre-          analysis of the damage and the phenomenon intensity.
quently used to analyse damage swaths. Recently, drones              The proposed methodology is organized in three stages
have been raised as a new device which might be useful to,        (Fig. 2). The first step includes pre-in situ damage sur-
at least, complement surface surveys (Bai et al., 2017).          vey tasks, preparing the actual visit of the damaged area
                                                                  (Sect. 3.1). Secondly, the in situ fieldwork tasks, which in-
                                                                  clude direct gathering of human-made structure and vegeta-
3   Methodology                                                   tion damage information, and also collection of direct wit-
                                                                  ness experiences (Sect. 3.2). Finally, post-in situ damage as-
The methodology to carry out damage surveys must be ef-           sessment tasks are performed, which involve the organization
ficient, allowing us to visit the affected area in the shortest   of all the information collected into three deliverables (a text
time possible. It must also be easily reproducible, and its       report of the event, a geolocated information table and a data
results should be accurate. Geolocating damage using pic-         location map; Sect. 3.3).
tures or videos recorded with smartphones or cameras with a
Global Navigation Satellite System such as GPS fulfils these      3.1   Pre-in situ survey tasks
conditions (Edwards et al., 2013). Nevertheless, as it hap-
pens with other types of damage assessments, there are in-        To properly prepare the damage survey, a number of previ-
herent uncertainties that should be taken into account when       ous tasks must be performed. One of them is planning the
analysing field data (Beven et al., 2018), like possible GPS      route of the fieldwork. As mentioned in Holzer et al. (2018)
location errors or ambiguous application of intensity rating      it is strongly recommended to start in situ damage surveys as
assessments due to EF scale limitations, which are discussed      soon as possible, especially if urban areas have been affected.
on Sect. 4.                                                       Emergency and clearing services may start repair only a few
   In Table 1 the main devices needed to carry out field          hours after the event, which can alter the quality and quantity
studies throughout the proposed methodology are summa-            of possible information available during the fieldwork. Thus,
rized. Moreover, as indicated in Bunting and Smith (1993)         to optimize time and resources, detailed planning is neces-
and Gayà (2018), water, food, comfortable footwear, a rain        sary to carry out the in situ damage assessment.
jacket, spare clothes and a mobile phone spare battery are            Firstly, preliminary information should be collected about
recommended, because affected areas may be far away from          damage location and images available in the media and social
inhabited locations. As surveyor displacements longer than        networks, which are the main providers of strong-convective-
a few kilometres can be required, a well-equipped, prefer-        wind reports today (Hyvärinen and Saltikoff, 2010; Knox et
ably all terrain, car is necessary to save time between points    al., 2013; Kryvasheyeu et al., 2016). Collaborative citizen
of damage. Nevertheless, difficult-access areas may be found      science platforms covering different geographical domains
along the track, because of muddy roads and fallen trees or       such as the European Severe Weather Database (ESWD;

https://doi.org/10.5194/nhess-20-1513-2020                               Nat. Hazards Earth Syst. Sci., 20, 1513–1531, 2020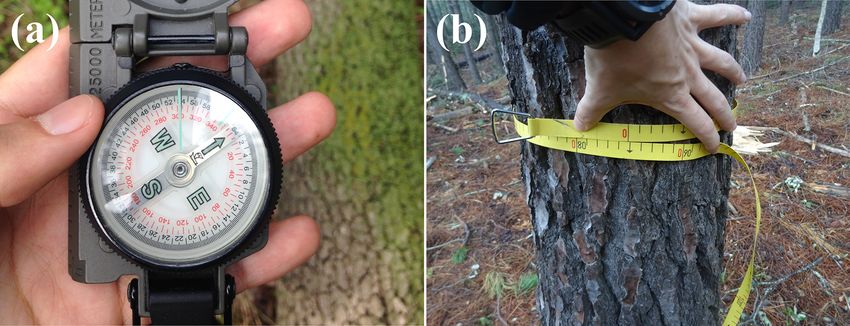
1516                                               O. Rodríguez et al.: A methodology to conduct wind damage field surveys

Figure 2. Flow diagram of the structure and application of the proposed methodology to carry out strong-convective-wind fieldwork damage
assessment. Start and end are shaded in yellow, processes in green, decisions in orange and inputs–outputs in blue.

Nat. Hazards Earth Syst. Sci., 20, 1513–1531, 2020                                    https://doi.org/10.5194/nhess-20-1513-2020
O. Rodríguez et al.: A methodology to conduct wind damage field surveys 1517
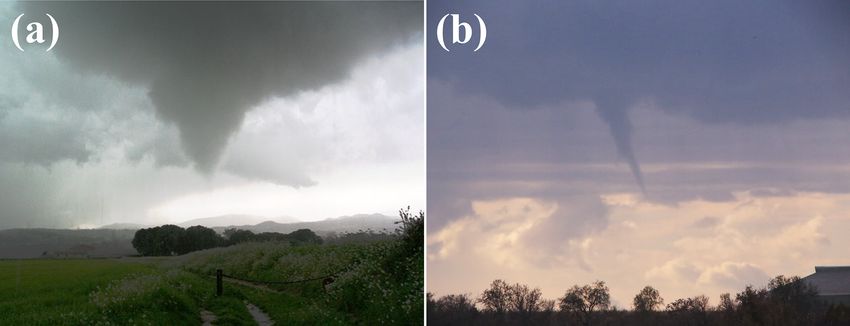
Figure 3. (a) Well-developed funnel cloud observed in Santa Eu-
làlia de Ronçana (Catalonia) on 4 April 2010 (author: @Cal-
abobosChaser), and (b) well-developed funnel cloud observed in
Bellpuig (Catalonia) on 1 December 2017 (author: Edgar Aldana).
Figure 4. Wind gust (red line) and wind gust direction (green bars)
In both cases no evident tornado was actually observed (i.e. touch-
registered by an AWS in Mataró (Catalonia) with 1 min temporal
down) but nearby damage was reported, suggesting tornado occur-
resolution data. The AWS was located 240 m west of the estimated
rence.
centre of the EF0 tornado track, on 23 November 2016. Data source:
Meteomar, Consell Comarcal del Maresme.
Dotzek et al., 2009), the severe weather database of the
Spanish Meteorological Agency (SINOBAS; Gutiérrez et al.,
2015) or the meteorological spotters platform of the Meteo- pictures of the funnel cloud it is possible to preliminarily
rological Service of Catalonia (XOM; Ripoll et al., 2016) are identify a possibly affected area, which can be more precisely
also examples of valuable sources of tornado and downburst delimited when the number of photos or videos from differ-
reports. ent perspectives is high (Rasmussen et al., 2003). However,
Contacting emergency services and local authorities can at this stage it has to be kept in mind it is possible that the
also provide valuable information, as they may record de- funnel cloud may have not produced damage, either due to
tailed damage data, especially if an urban area is affected. the lack of human-made structures or trees in the area inter-
This kind of information may be crucial for post-in situ dam- cepted by the tornado or because the strong rotation associ-
age study because clearing services might start arrangement ated with the funnel cloud actually did not touch down. This
tasks before the in situ visit is started. Occasionally, they may possibility will be verified during the in situ survey tasks.
take aerial damage recordings, which can be very useful to Analysis of satellite and weather radar imagery is required
complement the damage survey assessment. to estimate the approximate timing of the event and the
To consider performing an in situ damage survey, the re- movement of the convective parent storm that may have pro-
port must contain information about damage and/or a well- duced the phenomenon. That information should be consid-
developed funnel cloud (i.e. a funnel cloud extending down ered in order to extend the initial evidence of a preliminary
below cloud base at least 50 % of the distance between the damage path (looking for possible initial and ending dam-
cloud base and the ground level). Funnel clouds (Fig. 3) are age path points) and to assess the consistence of reports by
a typical feature of tornadic storms, though sometimes they eyewitnesses.
may form without developing a tornado, i.e. when the ro- On the other hand, existing AWSs in the area of interest
tating air column associated with the funnel does not reach can play an important role in determining the phenomenon
the ground. When damage reports are available (Case 1 in type and the timing of the event and also in estimating the
Fig. 2), their location should be found by contacting their au- wind strength (Letchford and Chay, 2002; Karstens et al.,
thors and/or using GIS cartography, proceeding as described 2010). Therefore, it is strongly recommended to search and
in Holzer et al. (2018). Applications such as Google Street locate all weather stations in the area of study, requesting the
View can be very useful to carry out this task. data with the maximum temporal resolution and performing
Nevertheless, if damage reports are not available but only basic quality control (time consistency and comparison with
developed funnel cloud images are reported (Case 2 in official observations) before use. High-temporal-resolution
Fig. 2), then authors have to be asked for the location where wind data series during the passage of a tornado are usually
photos were taken and their orientation. If for any reason this characterized by a sudden increase in wind speed and a swift
information is not accessible, it should be estimated from direction shift, as is shown in Fig. 4. By contrast, although
meteorological observations such as weather radar and satel- a downburst event is also described by a wind strengthen-
lite imagery (e.g. comparing radar images and the location ing, there is a predominant wind direction without relevant
of precipitation features observed in photos of the event with changes (Orf et al., 2012).
respect to the funnel cloud, as described by Wakimoto and Another important task before starting the actual in situ
Lew, 1993; Wakimoto and Liu, 1998; Zehnder et al., 2007) damage assessment is to check the wind climatology of the
and GIS cartography. Then, from the triangulation of those studied area, particularly in windy regions (because of either
https://doi.org/10.5194/nhess-20-1513-2020 Nat. Hazards Earth Syst. Sci., 20, 1513–1531, 2020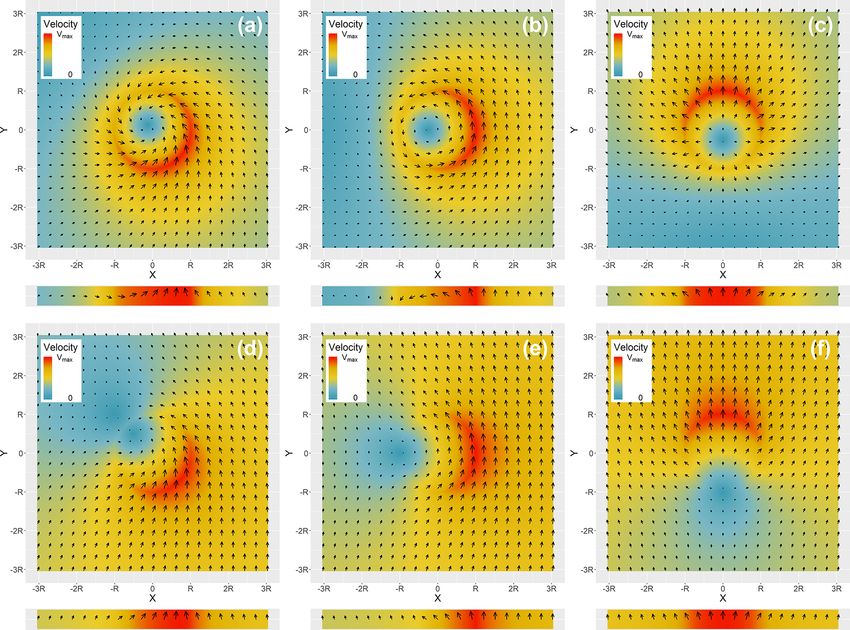
1518                                              O. Rodríguez et al.: A methodology to conduct wind damage field surveys

the orography or the prevailing synoptic conditions; Feuer-
stein et al., 2011). In this case, human-made structures and
vegetation are adapted to resist strong winds – sometimes
from specific directions – and wind speed thresholds over
which an element can be damaged may be higher than in non-
windy regions. Therefore, if a weak tornado or microburst
affects a region usually influenced by strong winds, it is pos-
sible that little or no damage is found. Similarly, the applica-
tion of an intensity damage scale in very windy regions may
require some adjustments – i.e. increasing the wind speed          Figure 5. (a) Measure of the fall direction of a tree and (b) mea-
                                                                   sure of trunk diameter during the damage survey of an EF1 tornado
thresholds for specific damages – as discussed in Feuerstein
                                                                   on 13 October 2016 in Llinars del Vallès (Catalonia) and an EF2
et al. (2011).
                                                                   tornado on 7 January 2018 in Darnius (Catalonia), respectively (au-
   On some occasions, the studied area may have been af-           thor: Oriol Rodríguez).
fected recently by another damaging windstorm or by a
heavy snowfall which may have produced widespread dam-
age in forests – for example due to wet snow as described in
Bech et al. (2013) and Llasat et al. (2014). In those cases, the   each geolocated element during the post-in situ tasks when
data collection process may be hampered by possible over-          organizing the records gathered in the fieldwork.
lapping damage, and, consequently, great care must be taken           Note also that Table 2 lists maximum uncertainties recom-
to identify the most recent damage event. A possible way to        mended for each measure type reflecting possible maximum
mitigate this problem is asking locals about previous events       errors in the field survey measures as suggested in Beven
and paying attention to the dryness from affected trees and        et al. (2018). Particular uncertainty values listed in Table 2
broken branches, which can indicate if forest damage is re-        are consistent with the resolution of data presented in sev-
cent or not.                                                       eral severe weather databases such as NOAA/SPC (2019),
                                                                   ESWD (Dotzek et al., 2009), SINOBAS (Gutiérrez et al.,
                                                                   2015), KERAUNOS (2020) and Gayà (2018), where dam-
3.2    In situ survey tasks                                        age path width is usually expressed with a resolution of
                                                                   ±10 m (i.e. damage location uncertainty must be smaller
To avoid alterations of the damage scenario due to clearing        than ±1 × 10⁻⁴◦ ). Furthermore, uncertainties listed also take
services, the fieldwork should preferably start on the most        into account surveyors’ experience and the data resolution
resilient areas, i.e. where socio-economic activity is more in-    from previous studies – e.g. direction of fallen trees and
tense and the areas are more likely to recover quickly. The        windborne debris are typically presented with 5◦ range (Bech
proposed priority order is to visit urban areas first, then dam-   et al., 2009, 2011, 2015).
aged electrical transmission or telecommunication lines, in-
dustrial parks and urban parks, and, finally, forest and other     3.2.1   Human-made structure damage assessment
surrounding areas (Fig. 2).
   As a general principle, the highest possible number of rel-     Human-made structural damage analysis is essential to esti-
evant damaged elements should be analysed in the affected          mate the phenomenon wind intensity, for example using the
area, both human-made structures and natural (vegetation)          EF scale. As explained in WSEC (2006), the Enhanced Fu-
elements. Moreover, if any previously unknown AWS is de-           jita scale considers several degrees of damage (DoD) from a
tected during the fieldwork, it should be considered to con-       total of 23 damage indicators (DIs) related to constructions
tact its owner asking for data. The same process should be         and three DIs from other human-made structures that can be
carried out for outdoor security cameras, which may record         used to determine the 3 s wind gust speed associated with this
the event and could provide valuable information in order          damage.
to determine which phenomenon took place. Interviews with             In the present methodology it is proposed to geolocate ev-
eyewitnesses, which can provide key information about the          ery damaged structure in the affected area, whose coordi-
event and other damaged areas, are also very important.            nates (latitude and longitude) can be obtained from the GPS
   All the in situ measurements are related to geo-referenced      receiver of the photo camera (with a precision greater than
damaged elements. To reduce the time of registering data in        ±1 × 10⁻⁴◦ ; see Table 2). It is also convenient to take one or
order to proceed to other affected areas, it is proposed to take   more pictures from each damaged element, both general and
a photo from the measuring device clearly showing the data         detailed views that may be of interest to evaluate the damage
(Fig. 5), following the order proposed in Table 2 (from V5         intensity (Marshall et al., 2012; Roueche and Prevatt, 2013).
to V10). After that, a photo of the damaged element should         These photos should also be used during the post-in situ dam-
be taken, whose metadata already contain latitude and longi-       age survey analysis to study which type of strong-convective-
tude. Therefore, surveyors can associate each measure with         wind phenomenon caused the damage.

Nat. Hazards Earth Syst. Sci., 20, 1513–1531, 2020                                 https://doi.org/10.5194/nhess-20-1513-2020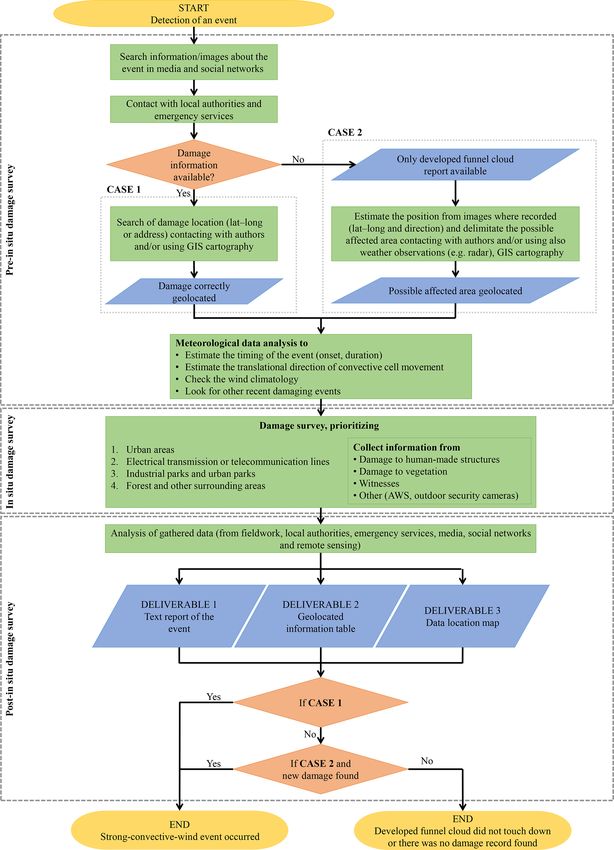
O. Rodríguez et al.: A methodology to conduct wind damage field surveys                                                                    1519

Table 2. Variables and maximum uncertainties recommended for data descriptors for damaged human-made structures and vegetation el-
ements. The first four variables are required for all damaged elements (both human-made structures and vegetation). Dragged distance,
direction and weight of windborne debris should be measured if possible for relevant and representative elements (e.g. fragment of panel
roof). Fallen tree direction and trunk diameter should be measured in the case of uprooted and snapped trees, respectively. Degraded state or
previous weakness of damaged elements should also be reported.

     Index     Variable                       Uncertainty      Comments
     V1        Latitude                       ± 1 × 10⁻⁴◦      Measured with GPS camera.
     V2        Longitude                      ±1 × 10⁻⁴◦       Measured with GPS camera.
     V3        Damage indicator (DI)          –                Determined during the post-in situ damage survey using intensity rating
                                                               scales such as the EF scale.
     V4        Degree of damage (DoD)         –                Determined during the post-in situ damage survey using intensity rating
                                                               scales such as the EF scale.
     V5        Fallen tree direction          ±5◦              In the case of uprooted trees. Measured with a compass.
     V6        Dragged direction object       ±5◦              Direction of the displacement. Measured with a compass or GIS tools.
     V7        Trunk diameter                 ±5 cm            In the case of snapped trees. The trunk perimeter is measured with a
                                                               tape measure and then the diameter can be calculated.
     V8        Dragged distance object        ±1 m             Distance between the final position and the origin of an object displaced
                                                               by the wind. Measured with a tape measure or GIS tools.
     V9        Weight of windborne debris     ±10 %            Weight of an object of interest moved by the wind. In the case of small
                                                               objects, measured with a balance if possible.
     V10       Previous weakness              –                Description of deficiencies that can increase the vulnerability of ele-
                                                               ments to strong winds.

    Moreover, for each affected human-made structure, the                and direction of objects of interest, if origin and final loca-
pair of DI–DoD data values should be provided by using an                tions are known, using a tape measure or GIS tools (Table 2).
intensity rating scale such as the EF scale, as proposed by              It is also interesting to document its weight, either estimated
several authors such as Burgess et al. (2014) and Holzer et              consulting the bibliography or measuring it with a portable
al. (2018). This task can be carried out during the damage               balance in the case of small objects (the relative error should
survey, but it is recommended that it be performed during the            be less than 10 %).
post-in situ damage assessment analysis. The main reason is
to optimize the time and sources devoted to the in situ survey.          3.2.2   Forest damage assessment
In the case that no DI could be associated with the damaged
element, it should be explicitly shown as “unrated”.                     As mentioned in previous studies (see for example Holland
    It is highly recommendable to check the maintenance sta-             et al., 2006 or Bech et al., 2009), the maximum wind field
tus of the damaged human-made structures to avoid a bi-                  (direction and intensity) associated with a strong-convective-
ased intensity determination. Previous weaknesses or defi-               wind event can be approximately derived from the fallen-
ciencies in construction can make structures more vulnera-               tree pattern. Therefore, if a substantial number of trees are
ble to strong winds, and so a higher degree of damage might              damaged to produce a clear damage pattern, a detailed for-
be caused for an expected wind speed (Doswell et al., 2009).             est damage study is recommended. As described in detail in
For example, if an absence of anchors or the presence of rust            the Appendix, if fallen trees present a convergence and ro-
on metal beams from a roof are observed, this should be ex-              tational pattern along a linear path, it is likely it was caused
plicitly documented by pictures and a brief description to be            by a tornado, whereas if a divergent damage pattern, mostly
taken into account when a damage rating scale is applied, as             non-linear, is observed, the most likely cause is a downburst.
already proposed by Fujita (1992).                                       This analysis is especially interesting for those cases where
    The estimated trajectory and distance covered by wind-               there is no image nor direct witness of the phenomenon to
borne debris, as well as its size and weight, may also provide           determine the damage origin.
valuable information to estimate wind velocity associated                   The forest damage survey should be carried out similarly
with the studied phenomenon (Knox et al., 2013). Therefore,              to the human-made structure damage assessment, taking pic-
it is recommended to measure the dragged or flying distance              tures of every relevant damaged vegetation element and reg-

https://doi.org/10.5194/nhess-20-1513-2020                                       Nat. Hazards Earth Syst. Sci., 20, 1513–1531, 2020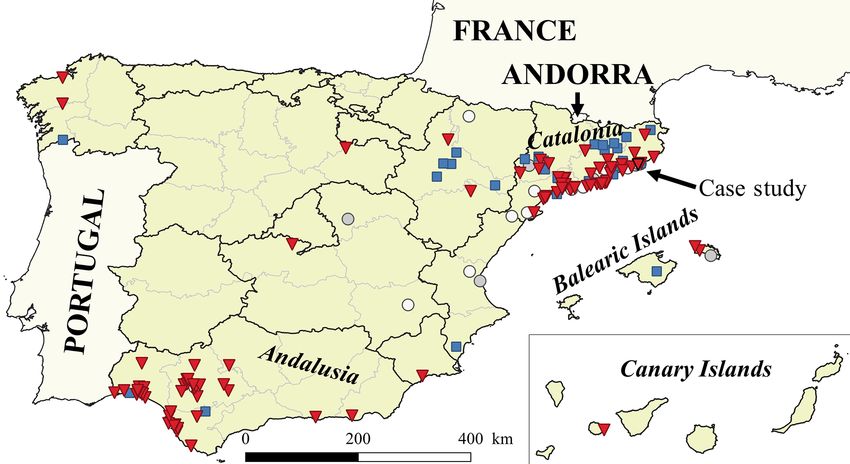
1520                                                O. Rodríguez et al.: A methodology to conduct wind damage field surveys

                                                                      to the EF scale, according to Godfrey and Peterson (2017).
                                                                      High-resolution aerial imagery (i.e. from helicopter or drone)
                                                                      can be useful to carry out this task. This analysis is espe-
                                                                      cially interesting in the most severely affected forest area of
                                                                      the damage swath.
                                                                         Most tornado damage paths are less than 5 km long; for
                                                                      example, in Spain only 25 % of identified tornado tracks are
                                                                      longer than 5 km (Gayà, 2018). Therefore, a detailed for-
                                                                      est damage analysis is usually possible. However, in cases
Figure 6. (a) Drone image of a mixed Mediterranean forest in          where damage is widespread, a complete detailed analysis
Darnius (Catalonia) where most pine trees were blown down,
                                                                      may not be feasible. In this case, it is recommended to study
whereas cork oaks were only slightly affected with broken branches,
                                                                      discontinuous segments every 250–500 m along the expected
by an EF2 tornado, on 7 January 2018 (author: Jonathan Carvajal).
(b) Pine blown down by an EF0 tornado in Perafort (Catalonia) in      damage swath. This allows estimation of the path width and
a very thin, moist soil area, on 14 October 2018 (author: Oriol Ro-   identification of the damage continuity. In addition, as previ-
dríguez).                                                             ously commented, aerial images can enhance the forest dam-
                                                                      age analysis, especially in the case of large damage tracks
                                                                      and difficult-access areas (Karstens et al., 2013). Alterna-
                                                                      tive approaches to surveys over widespread damaged forest
istering its location (latitude and longitude). In the case of up-    areas are satellite image processing, as recently developed
rooted trees, the fall direction (azimuth) should be measured         by Molthan et al. (2014), Chernokulsky and Shikhov (2018),
using a compass with, at least, 5◦ of precision (see Table 2).        Shikhov and Chernokulsky (2018), and Shikhov et al. (2019).
However, it should be noted that tree fall directions may be
influenced by local factors and might not be representative           3.2.3   Witness enquiries
of the wind direction. For example, trees falling on a steep-
slope terrain (favouring one fall direction over others) or the       Direct witnesses, if available, are an important source of in-
presence of another nearby tree falling first can alter the tree      formation often essential to determine which type of strong-
direction with respect to the dominant wind. Therefore, in            convective-wind phenomenon occurred. Witnesses’ experi-
these cases it is recommended not to consider the data. In the        ence of the event and their possible knowledge of other ca-
case of snapped trees, trunk diameters should be measured             sual witnesses in nearby damaged locations can be very use-
with a measuring tape (with a minimum resolution of 5 cm;             ful to complement a damage survey. In Bunting and Smith
Table 2). These data can help in the damage rating task. How-         (1993) and Gayà (2018) it is noted that a direct witness may
ever, as there may be a large number of damaged trees in a            have been emotionally or physically affected by the phe-
forest area, it is advisable to collect data from the most repre-     nomenon (for example private property damaged or loved
sentative ones (for example, where tree fall direction changes        ones injured) so it is necessary to be respectful and careful
or converges, probably indicating the effects of air rotation,        during the enquiry.
or where damage is most significant and surrounding dam-                 It is important to let witnesses explain their experience of
aged trees to delimitate the damage swath width).                     the event in their own words, and interviewers should avoid
   Damage in forest areas can also be useful to evaluate              using key words such as tornado, downburst or gust front,
the phenomenon intensity. The EF scale (WSEC, 2006) de-               particularly in those cases when the phenomenon type is not
scribes different wind velocity ranges for five degrees of            known yet. The terms used by the witness may provide valu-
damage (DoD), namely small limbs broken, large branches               able clues about what happened. In addition, it is necessary
broken, trees uprooted, trunks snapped and trees debarked             to consider that previous media reports can alter the explana-
with only stubs of the largest branches remaining. As wind            tion of witnesses; for example, if the event has already been
effect on trees also depends on the tree species (Foster, 1988;       described as a tornado in the media, even if evidence of rota-
Fig. 6a), the EF scale also distinguishes between softwood            tion is not found in the damaged area, people will probably
and hardwood trees. Thus, DI–DoD pairs for each analysed              say that a tornado has occurred.
vegetation element should be provided.                                   A brief and concise enquiry, with specific questions but
   Moreover, soil characteristics can affect tree stability; in       allowing open answers that may unveil relevant information,
the case of very moist soil, or thin soil over rocky subsoil,         is proposed. Recommended questions are shown in Table 3.
trees can be uprooted more easily, as is illustrated in Fig. 6b.      Moreover, on some occasions a direct witness may have
Trees’ health can also alter the resistance to strong winds. As       taken photos or videos of the phenomenon that can be help-
is done for human-made structures, these debilities must be           ful for the study. When pictures are available, they should be
stated in the report. In order to refine intensity rating tasks in    treated as described in Sect. 3.1.
forests, it is recommended to calculate the ratio of affected
trees in 50 m × 50 m areas if possible; this can be related

Nat. Hazards Earth Syst. Sci., 20, 1513–1531, 2020                                   https://doi.org/10.5194/nhess-20-1513-2020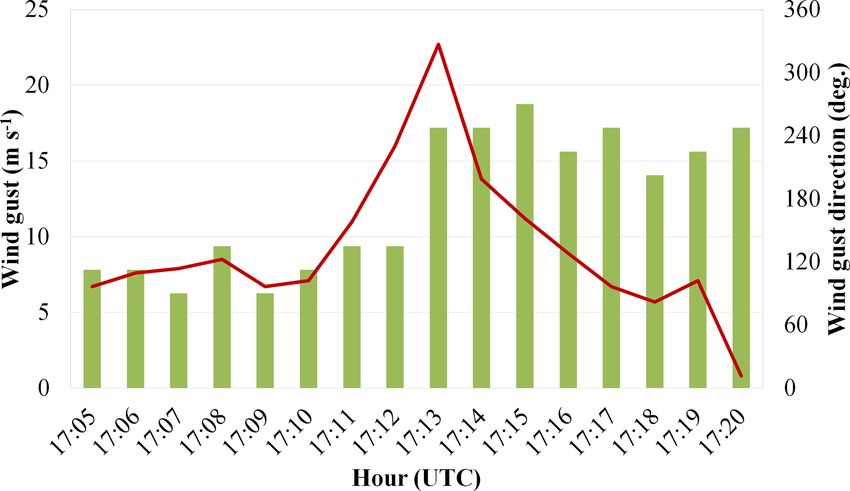
O. Rodríguez et al.: A methodology to conduct wind damage field surveys                                                       1521

Table 3. Witness questionnaire (reference and question).             tion in Fig. 1), provided as the Supplement. Then, according
                                                                     to the flow diagram shown in Fig. 2, in Case 1 and in Case 2
 Question     Question                                               and new damage found, it can be concluded that a damaging
 reference                                                           strong-convective-wind event (tornado, downburst, straight-
 Q1           At what time did the phenomenon occur?                 line winds) occurred, whereas if a developed funnel cloud
 Q2           Where were you when the phenomenon took place?         was reported and during the fieldwork no damage was found,
 Q3           How long did the strongest winds last? (Some sec-      it might be deduced that the funnel cloud did not touch down
              onds, around 1 min, several minutes, etc.)             or there was not any exposed and/or vulnerable element in
 Q4           During the phenomenon, did you hear any special        the tornado track to be damaged.
              or rare noise?
 Q5           What was the weather like before, during and af-       3.3.1   Text report of the event
              ter the phenomenon? (Light rain, heavy rain, small
              hail, large hail, snow, no precipitation.)             The text report of the event should be an overview of the anal-
 Q6           Have you noticed other areas with damage?              ysed episode, including a brief description of the informa-
 Q7           Do you remember any previous similar
                                                                     tion gathered during the fieldwork and the main conclusions
              phenomenon in this area?
                                                                     from the analysis of these data. The proposed deliverable is
                                                                     divided into seven parts.

                                                                       – General event information. This includes geographic
3.3   Post-in situ survey tasks and deliverables
                                                                         data of the analysed meteorological phenomenon fol-
                                                                         lowing current international standards for disaster report
When the in situ damage survey is completed, the event                   losses (De Groeve et al., 2014), such as names and codes
analysis should be complemented revising meteorological                  of country (ISO 3166-1 alpha-3 specification), regions
remote-sensing data, which can now be compared with the                  or provinces (NUTS code), and municipalities (LAU
records obtained in the survey. The information collected by             code). This part must also contain the start and end dates
direct witnesses, pictures and videos usually allows us to re-           and time (in UTC) of the event and hazard classification
strict the event occurrence to a temporal window of about                according to the Integrated Research on Disaster Risk
15 min to 2 h. Satellite imagery and data from Doppler radar,            Peril Classification and Hazard Glossary (IRDR, 2014),
lightning detection systems and AWS (particularly if located             including the family, the main event and the peril type.
within or close to the damage swath) from the period of in-
terest can provide the necessary information to verify that            – Fieldwork information. This describes specific data
the identification of the convective structure as that respon-           about team members, including their affiliation and
sible for the damage performed during the pre-in situ dam-               email address. Moreover, date and time of the visits,
age survey was correct. In particular, the starting and ending           estimation of the fieldwork coverage over the total af-
time of the event can be estimated by checking the time when             fected area, and a brief description of difficult-access
the convective structure passed over the initial and the final           areas should also be provided.
points of the damage swath, respectively, with an error typi-
cally less than 5 min. It is recommended to perform this com-          – Initial sources of information. This contains informa-
parison with Doppler radar observations, if available, with              tion available (web pages and links) in media and social
data in original polar coordinates keeping the highest spatial           networks and developed funnel cloud images (if any),
resolution (see for example Bech et al., 2009, 2011, 2015). In           together with a brief explanation of the initial informa-
some cases, it is even possible to estimate the mean transla-            tion gathered before starting the damage survey.
tional velocity and direction of the convective cell, knowing
                                                                       – Meteorological conditions. This part describes weather
the distances between initial and final damage paths and the
                                                                         conditions before, during and after the event according
starting and ending times of the event. This can be very useful
                                                                         to direct witnesses, the visibility (darkness, precipita-
to compare theoretical surface wind vortex models with ob-
                                                                         tion), AWS data (location and a summary of the most
served damage patterns over forest areas (Bech et al., 2009;
                                                                         relevant recorded data), and other data of interest de-
see the Appendix for further details).
                                                                         rived from an overview of remote-sensing tools.
   Finally, all the information gathered needs to be organized
and archived in an easily interpretable way to analyse the             – Damage observed. A general description of the ob-
strong-convective-wind event. In the following subsections,              served damage is given (i.e. the most common and the
three final deliverables are proposed to achieve this objective:         most relevant seen during the fieldwork), including the
(i) a standardized text report of the event, (ii) a geolocated in-       maximum DoD for every DI noticed.
formation table and (iii) a data location map. These deliver-
ables are illustrated explicitly with the example of the 15 Oc-        – Direct witness inquiries. This part summarizes witness
tober 2018 Malgrat de Mar–Massanes tornado case (see loca-               enquiries (which should also be attached entirely apart).

https://doi.org/10.5194/nhess-20-1513-2020                                   Nat. Hazards Earth Syst. Sci., 20, 1513–1531, 2020
1522 O. Rodríguez et al.: A methodology to conduct wind damage field surveys
It should contain, if available, the duration of the strong 4 Discussion
winds and a brief description of the experience of each
witness. The proposed methodology is formulated in a convenient,
feasible and detailed way so it can be readily used, but its
– Characterization of the event. This final section con- practical application may present some weaknesses. Among
tains the length and average and maximum width of the the advantages of the proposed methodology is the relative
damage swath, the maximum wind intensity (specifying simplicity of the devices required (Table 1), which are neither
the intensity scale used), the translational direction and unusual nor expensive tools, so meteorological services, pub-
other data of interest such as the convective cell transla- lic research institutions and private entities may perform sys-
tion velocity. tematic damage surveys of reported events, analysing even
suspicious developed funnel clouds for which it is previously
3.3.2 Geolocated information table
unknown if they reached the ground. Moreover, the easy-to-
A geolocated information table providing disaggregated data reproduce fieldwork process and the generation of the pro-
for each point of damage is proposed, similarly as in Holzer posed three final deliverables support the main objectives of
et al. (2018). It should contain all relevant geolocated infor- the in situ damage assessment, which are identifying the phe-
mation gathered during the fieldwork and also damage lo- nomenon type, estimating wind intensity, and characterizing
cations provided by local authorities, emergency services, the event and the damage swath. Besides, the methodology is
media and social networks, which have been previously col- also intended to optimize time during in situ measurements
lected and analysed. To better organize the information dis- in order to make possible visiting the whole affected area as
played, seven different location types (L1 to L7; see Table 4) soon as possible to avoid the alteration of the damage sce-
are considered. Note that L1 to L3 (vegetation and human- nario by clearing services, as stated in Sect. 3.1.
made structures) correspond to point-of-damage locations so Surface in situ analysis provides more detailed informa-
that, if possible, they should include information about inten- tion than aerial surveys or analysis based only on remote-
sity rating (DI–DoD), according to Sect. 3.2. The rest of the sensing data. For instance, minor damage to vegetation and
locations describe positions of AWS, witnesses, pictures or to human-made structures is more easily detected (e.g. Mar-
windborne debris. shall et al., 2012). In addition, it is possible to study in detail
the soil state in forest areas and the degraded state or pre-
3.3.3 Data location map vious weaknesses of damaged elements, which are essential
to assess the wind intensity, and measuring data of interest
The third deliverable consists of a map or a KML file format such as snapped trunk diameter or small windborne debris
containing geolocated information gathered during the field weight. On the other hand, tornado outbreaks and widespread
survey in order to allow further graphical analysis, for exam- events (such as derechos – e.g. Peterson, 2019; Chmielewski
ple using Google Earth software (Gorelick et al., 2017). It is et al., 2020) may be cases where it is challenging to apply
proposed that each of the seven location types presented in the methodology. Nevertheless, in Sect. 3.2 some methods to
Sect. 3.3.2 is represented with a different icon, with a spe- mitigate these problems have been provided, such as making
cific colour for points of damage (L1 to L3 from Table 4) a discontinuous analysis in forest areas, studying transversal
depending on its intensity. Moreover, in the case of damage stripes along the damage track every 250 to 500 m if possi-
in trees with fall direction (L1) it is convenient to display an ble. Another option would be to distribute areas to be anal-
arrow icon on the map, whose direction should be the fall di- ysed among the members of the surveyor team to carry out
rection. Thereby, a tree damage pattern analysis to discrimi- several field studies in parallel. Especially in those cases, and
nate between damage caused by a tornado or by a downburst also in complex-terrain events, aerial imagery could be use-
should be easily carried out. Damage swath characteristics ful to complement surface data, providing an overview of the
(length and width) should also be calculated using the data damaged area and information from difficult-access zones.
location map. On the other hand, the geolocation of damaged elements
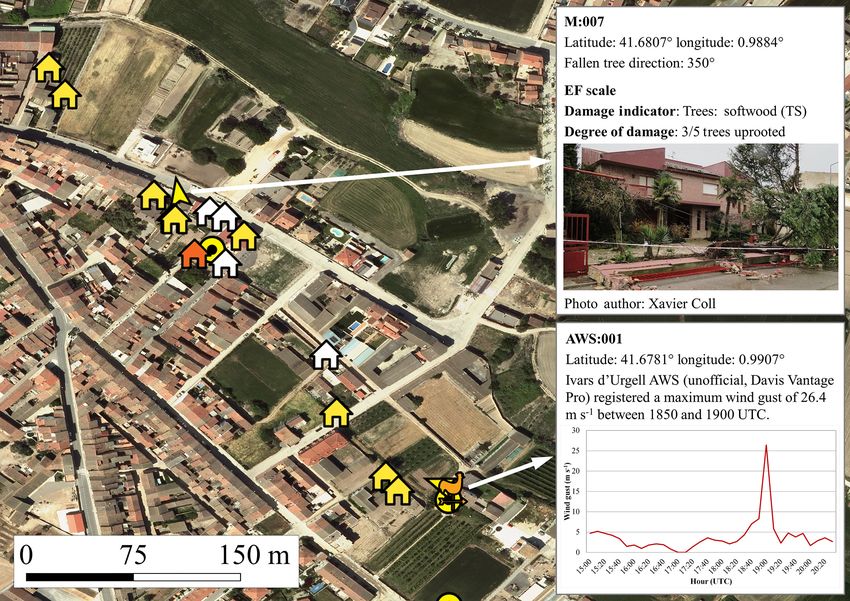
As an example, Fig. 7 shows the data location map of and data of interest has a strong dependence on GPS signal
part of the fieldwork carried out on 25 March 2012 to study reception. Geolocation accuracy depends on a number of fac-
the EF1 tornado that affected the municipalities of Castell- tors including local terrain geometry, quality of the receiver
nou de Seana and Ivars d’Urgell (Catalonia) on 21 March antenna system or number of satellites observed. Photo cam-
2012 (Bech et al., 2015). It displays the information con- eras and smartphones have location errors usually ranging
tained in a fallen tree damage-point type (in this case, lati- from 5 to 20 m, typically being the greatest in deep valleys,
tude, longitude, tree fall direction, DI–DoD, a brief descrip- or close to large buildings or structures blocking satellite sig-
tion and a photo) and in the unofficial Ivars d’Urgell AWS nals. To minimize geolocation errors, it is recommended to
location (here latitude, longitude, AWS type and maximum check the accuracy with manually selected reference loca-
wind speed plot), which registered a maximum wind gust of tions and, if necessary, to correct damage locations on the
26.4 m s−1 during the event. summary map and on the geolocated information table. This
Nat. Hazards Earth Syst. Sci., 20, 1513–1531, 2020 https://doi.org/10.5194/nhess-20-1513-2020O. Rodríguez et al.: A methodology to conduct wind damage field surveys 1523
Table 4. Information location types (reference, description and data that should be presented).
Location Description Data
reference
L1 Damage to trees with fall Latitude, longitude, DI–DoD, previous weaknesses, fall
direction direction
L2 Damage to trees without Latitude, longitude, DI–DoD, previous weaknesses,
fall direction trunk diameter (if snapped tree)
L3 Damage to human-made Latitude, longitude, DI–DoD, previous weaknesses
structures
L4 AWS location Latitude, longitude, data (maximum wind gust,
direction of maximum wind gust and hour)
L5 Witness location Latitude and longitude of the witness location at the mo-
ment of the meteorological event and a brief description
of their experience
L6 Image of the phenomenon Latitude and longitude of the point where the image was
recorded and orientation
L7 Windborne debris Latitude, longitude, distance and direction of the dis-
placement, size and weight of the object if measured
is feasible in urban or peri-urban areas, where buildings or need to know the area affected by a strong-convective-wind
other elements are easily identifiable using high-resolution event and its intensity to cover compensations and, in some
aerial images such as orthophotos, but not in forests or other specific cases as in Spain, the phenomenon type (De Groeve
natural areas without evident references where this verifica- et al., 2014).
tion may not be possible. Data collected from damage to buildings (general photos
The estimation of wind intensity of convective origin is and detailed pictures of deficiencies or previous weaknesses)
based on damage rating scales, which relate the damage ob- may also contribute to study exposure and vulnerability of
served with the wind speed. Despite the proposed methodol- constructions in an area of interest and also to assess the
ogy being illustrated using the EF scale, it should be noted failure modes (e.g. north-eastern Italy; Zanini et al., 2017;
that other intensity scales could be used such as the TORRO Pipinato, 2018), as pointed out in De Groeve et al. (2013,
scale (Meaden et al., 2007). The practical application of the 2014). Moreover, the identification of typical damaged build-
EF scale has some limitations (Doswell et al., 2009), in spite ings using the information provided in the set of final de-
of the progress made some years ago by introducing a more liverables can give a guideline for adapting intensity rating
detailed intensity rating scale (WSEC, 2006) compared to scales, such as the EF scale, outside of the USA, partially
the original and simpler Fujita scale (Fujita, 1981, 1992; solving those deficiencies in assessing wind intensity. In this
Doswell, 2003). The Enhanced Fujita scale, developed in line of work, some authors have propounded new damage
the USA, is mainly based on the damage caused by wind indicators to append to the above-mentioned scale using in-
to standard US buildings and elements (schools, hospitals, formation derived from tens of field studies (Mahieu and
automobile showrooms, etc.), so-called damage indicators Wesolek, 2016); to adapt them to typical human-made struc-
(DIs). When applied to areas outside the USA many DIs may tures from other countries, as recently reported in Canada
not exist, hampering its application as discussed in detail in (Environment Canada, 2013) or Japan (Japan Meteorolog-
Feuerstein et al. (2011) and Holzer et al. (2018). Moreover, ical Agency, 2015); or even to develop a standardized in-
there are elements which are susceptible to damage such ternational Fujita scale, as proposed in Groenemeijer et al.
as traffic signals, walls and fences, trash bins, and vehicles, (2019). Furthermore, in some articles it has been discussed
which are not included on the EF scale. how to assess wind intensity throughout effects on vehicles,
The data gathered can have several uses, apart from with data given by field studies (Paulikas et al., 2016), simi-
contributing to build-up of homogeneous severe weather larly to here. As provided in the geolocated information map,
databases, which at the same time enhance the knowledge where each point of damage with its DI–DoD pair is given,
about tornado, downburst and straight-line wind occurrence. it is possible to assess the degree of damage severity along
Insurance and reinsurance companies can be one of the major the damage swath of a tornadic event. This information can
benefitted sectors from results of field studies, which usually be very valuable to analyse the impact of tornadoes in future
https://doi.org/10.5194/nhess-20-1513-2020 Nat. Hazards Earth Syst. Sci., 20, 1513–1531, 20201524 O. Rodríguez et al.: A methodology to conduct wind damage field surveys
Figure 7. Data location map and two examples of recorded information from the 21 March 2012 EF1 Ivars d’Urgell (Catalonia) tornado
track. Map symbols indicate locations of AWS (orange weathervane), damage to human-made structures (house icon) and fallen trees or
damaged vegetation elements (arrow and circle icon if no direction is available, respectively). Icon colours indicate damage intensity using
the EF scale: EF0 (yellow), EF1 (orange) and unrated (white). The background orthophoto is from the Institut Cartogràfic i Geològic de
Catalunya (ICGC), http://www.icc.cat (last access: 1 September 2019), under a CC BY 4.0 license.
projected scenarios, for example modelling damaged areas in The purpose of this article is to provide an easily repro-
tornado paths using the data provided by field studies and as- ducible methodology to carry out surface strong-convective-
sessing the possible consequences under different expected wind event damage surveys, which optimize time and eco-
urban conditions (Ashley et al., 2014; Rosencrants and Ash- nomic resources. It is mainly based on collecting geolocated
ley, 2015). information about damaged human-made structures and veg-
etation, with the final aim of representing the damage sce-
nario to study the event from a meteorological point of view.
5 Summary and concluding remarks Complementary data from AWSs close to the affected area
and witness reports should also be gathered if available, and
In situ damage survey data are used to study the conse-
remote-sensing data should be used to get a deeper under-
quences of natural hazards, such as floods or damaging
standing of the convective storm event. With all this infor-
strong convective winds. The latter can be specifically char-
mation, three final deliverables are generated (a standardized
acterized carrying out field studies, estimating the damage
text report of the event, a table consisting of detailed geolo-
path length and width and also the intensity of the event.
cated information, and a map or a file in KML format).
Moreover, through an analysis of the data gathered it might
This methodology is based on previous studies and has
be possible to clarify which phenomenon caused the damage
been refined during the elaboration of 136 strong-convective-
(tornado, downburst or straight-line winds) in case neither
wind damage surveys carried out in Spain between 2004 and
images nor direct witness reports exist.
2018. Known limitations of its application include geoloca-
tion errors of damage, applicability of the EF scale outside
Nat. Hazards Earth Syst. Sci., 20, 1513–1531, 2020 https://doi.org/10.5194/nhess-20-1513-2020O. Rodríguez et al.: A methodology to conduct wind damage field surveys 1525 the USA and difficulties in analysing extensive events or complex topography areas. Nevertheless, surface-based de- tailed data provided, such as previously degraded state of damaged elements, minor damage to human-made structures and vegetation, snapped tree trunk diameter, and soil state in forest areas, might be helpful to better analyse event conse- quences compared to other methodologies. In any case, the field survey data obtained are valuable for further analysis, complementing detailed meteorological case studies based on operational remote sensing such as Doppler weather radar data, surface observations and numerical weather prediction model output. Moreover, the methodology proposed may contribute to standardize detailed field surveys, which are essential to build up and maintain robust and homogeneous databases of severe weather phenomena. https://doi.org/10.5194/nhess-20-1513-2020 Nat. Hazards Earth Syst. Sci., 20, 1513–1531, 2020
1526                                              O. Rodríguez et al.: A methodology to conduct wind damage field surveys

Appendix A: Tornado vs. downburst damage patterns                     In Fig. A1a, where tangential and inflow velocities are
                                                                   equal (α = 45◦ ), a convergence damage pattern is identi-
The determination of the damaging wind phenomenon (tor-            fied, whereas in Fig. A1b, where the radial component is
nado, downburst or straight-line winds) can be rather chal-        zero (α = 90◦ , i.e. pure tangential flow), the damage swath
lenging in some cases. As reported in previous studies (Hall       presents a rotational pattern. Figure A1c presents pure out-
and Brewer, 1959; Holland et al., 2006; Bech et al., 2009;         flow with no tangential velocity (α = 180◦ ), exhibiting a sim-
Beck and Dotzek, 2010; Rhee and Lombardo, 2018), it can            ilar divergence pattern as Fig. A1f, in the damage swath,
be assumed that the direction of fallen trees indicates the di-    which could correspond to a classical downburst pattern.
rection of maximum wind speed in strong-convective-wind               Thus, based on this simple model, if fallen tree patterns
events, provided there are no influences from the terrain (i.e.    present convergence or rotation, it can be assumed that a vor-
slope favouring a specific fall direction) or from another tree    tex caused the damage, whereas a divergent pattern would
fall interacting with the tree considered. Despite the fact        suggest the effects of a downburst. Similarly, the way debris
that real wind damage patterns can be very complex due to          is spread or how a roof is collapsed or lifted can indicate
their interaction with topography or with other nearby events      winds either with a rotation and upward pattern (i.e. a tor-
(Forbes and Wakimoto, 1983; Cannon et al., 2016), theo-            nado) or with a divergent and downward pattern (i.e. a down-
retical idealized damage swath patterns of both tornado and        burst) – see Rhee and Lombardo (2018) for a more detailed
downburst wind fields can be compared with observed dam-           discussion.
age patterns in order to look for similarities to assess their        Nevertheless, it is also noticeable that in cases where tan-
possible origin.                                                   gential and translational velocities are similar (G ≈ 1; see for
   As explained in previous studies (e.g. Holland et al., 2006;    example the second row of the Fig. A1), damage swaths may
Bech et al., 2009), a simple approximation to describe a tor-      present only little differences among them. This can occur
nado vortex wind field near the surface is given by the Rank-      in weak (EF0 or EF1) tornado or downburst events that af-
ine vortex model. This approach combines an inner rigidly          fect a small area. In these cases, damage may also be sparse,
rotating core with an outer region with decreasing rotation        scattered and unconnected, which makes any damage pat-
speed. The wind field velocity module is defined in polar co-      tern consistent with a tornado or a microburst unidentifiable
ordinates by Eq. (A1):                                             (Bech et al., 2009; Rhee and Lombardo, 2018). Then, even a
          vmax r
                   if r ≤ R                                        detailed damage survey, if there are neither images nor direct
v(r) = vmax  R               ,                             (A1)
                R                                                  witnesses, may not be sufficient to determine which type of
              r    if r > R
                                                                   phenomena caused the damage. This situation of inconclu-
where v(r) is the wind velocity as a function of the distance      sive results regarding the phenomenon type occurred in 7 %
to the centre of the vortex r, vmax is the maximum wind ve-        of the 136 damage surveys carried out in Spain by the authors
locity and R is the vortex radius where v(r) = vmax .              between 2004 and 2018.
   Note that according to Eq. (A1), the Rankine vortex can            As a real example, the case shown in Fig. A2 presents
describe, in simple terms, only a rotating vortex and its          fallen poplar trees following a convergence pattern: on the
nearby environment, i.e. a stationary vortex. To model real        right-hand side of the damage swath, trees are blown down
tornadoes, a Rankine vortex with both tangential and radial        to the west, whereas on the left-hand side they are uprooted
wind components is combined with a translational move-             to the north. Comparing this real case and idealized cases
ment, i.e. a homogeneous wind field. As described in Bech et       (Fig. A1), this damage pattern matches the damage swath
al. (2009), according to Peterson (1992), two parameters are       caused by a vortex with G = 4 and α = 45◦ well (Fig. A1a).
used to characterize this model: parameter G, which is the ra-     This fact along with other evidence confirm the hypothe-
tio between tangential velocity and translational velocity, and    sis that damage was caused by a tornado, as presented in
parameter α, which is the angle between radial velocity and        the Supplement. Moreover, it is remarkable that these vor-
tangential velocity, with 0◦ corresponding to a pure inflow,       tex characteristics are also coherent with the damage rated as
90◦ to a pure tangential case and 180◦ to a pure outflow.          the lower EF1 bound and the mean translational velocity of
   Examples of two-dimensional wind fields with different          12 m s−1 , estimated using radar data from the Meteorological
parameter configurations are shown in Fig. A1, including           Service of Catalonia (not shown).
their associated damage swath pattern shown as a rectangu-
lar panel below each two-dimensional wind field. The dam-
age swath pattern is obtained computing the maximum wind
vector of the wind field along the y axis, as the examples
assume a northern translation of the vortex. In the first row
(Fig. A1a, b, and c), translational velocity is one-fourth the
tangential velocity (G = 4) and, in the second row (Fig. A1d,
e and f), translational velocity is equal to tangential velocity
(G = 1).

Nat. Hazards Earth Syst. Sci., 20, 1513–1531, 2020                                https://doi.org/10.5194/nhess-20-1513-2020
You can also read