Last interglacial sea-level history from speleothems: a global standardized database - ESSD
←
→
Page content transcription
If your browser does not render page correctly, please read the page content below
Earth Syst. Sci. Data, 13, 2077–2094, 2021
https://doi.org/10.5194/essd-13-2077-2021
© Author(s) 2021. This work is distributed under
the Creative Commons Attribution 4.0 License.

         Last interglacial sea-level history from speleothems: a
                      global standardized database
                     Oana A. Dumitru1 , Victor J. Polyak2 , Yemane Asmerom2 , and Bogdan P. Onac3
         1 Biology  and Paleo Environment Department, Lamont-Doherty Earth Observatory, Columbia University,
                                                Palisades, NY 10964, USA
          2 Department of Earth and Planetary Sciences, University of New Mexico, Albuquerque, NM 87131, USA
       3 School of Geosciences, University of South Florida, 4202 E. Fowler Ave., NES 107, Tampa, FL 33620, USA

                            Correspondence: Oana A. Dumitru (odumitru@ldeo.columbia.edu)

                               Received: 12 December 2020 – Discussion started: 17 December 2020
                             Revised: 5 April 2021 – Accepted: 9 April 2021 – Published: 18 May 2021

      Abstract. Speleothems (secondary cave carbonate precipitates) are archives of valuable information for recon-
      structing past sea levels as they are generally protected from weathering and erosion by their location and can be
      dated with U-series methods. Two main categories of speleothems are recognized as sea-level indicators: phreatic
      overgrowth on speleothems (POSs) and submerged vadose speleothems (SVSs). POSs have the great advantage
      that they precipitate on preexisting supports (vadose speleothems or cave walls) at a brackish water level equiv-
      alent to sea level when air-filled chambers of coastal caves are flooded by rising sea. SVSs are also useful, but
      sea level is inferred indirectly as periods of growth provide constraints on maximum sea-level positions, whereas
      growth hiatuses, sometimes difficult to observe, may indicate times when cave passages are submerged by sea
      highstands; hence they record minimum sea-level elevations.
         Here we describe a compilation that summarizes the current knowledge of the complete last interglacial (in
      its broadest sense from ∼ 140 to 70 ka, also known as marine isotope stage (MIS) 5) sea level captured by
      speleothems. We used the framework of the World Atlas of Last Interglacial Shorelines (WALIS), a comprehen-
      sive sea-level database, to provide a standardized format in order to facilitate scientific research on MIS 5 sea
      level. The discussion is focused on MIS 5e, but records that capture MIS 5d, 5c, 5b, and 5a are also included.
      We present the data from 71 speleothems (36 sea-level index points and 37 limiting points) in coastal caves
      located in 10 different locations, and we include the spatial coverage, the samples used, and their accuracy as
      indicators of sea level, U and Th isotopes used to generate the chronologies, and their scientific relevance to
      understand past sea-level changes. Furthermore, the paper emphasizes the usefulness of these indicators not only
      to render information regarding the eustatic sea level, but also for their contribution to refine the glacial isostatic
      adjustment models and to constrain regional tectonic uplift rates. The standardized sea-level database presented
      here is the first of its kind derived from speleothems and contains all the information needed to assess paleo
      relative sea levels and the chronological constraints associated with them. The database is available open-access
      at https://doi.org/10.5281/zenodo.4313860 (Dumitru et al., 2020). We refer the readers to the official documenta-
      tion of the WALIS database at https://walis-help.readthedocs.io/en/latest/ (last access: 20 January 2021), where
      the meaning of each field is explained in detail.

Published by Copernicus Publications.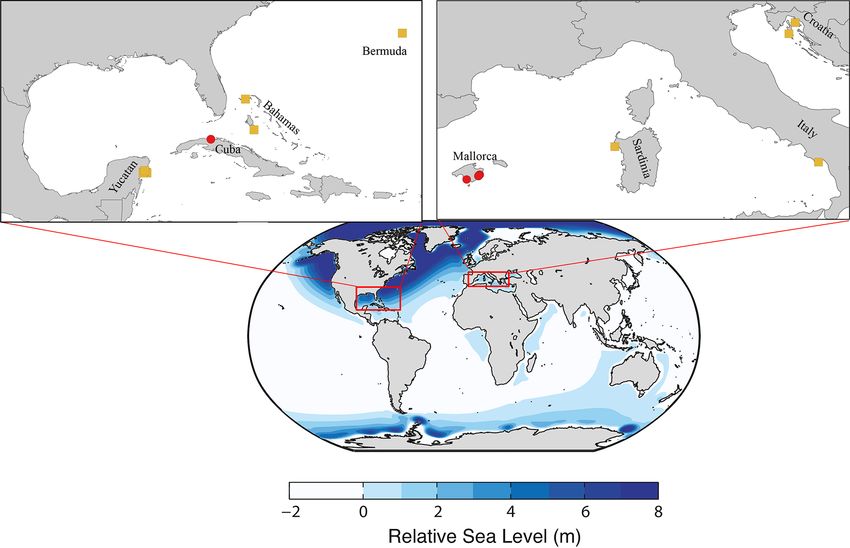
2078                                                  O. A. Dumitru et al.: Last interglacial sea-level history from speleothems

1   Introduction                                                    1.1     The relationship between POS/SVS deposition and
                                                                            sea-level changes
Understanding sea-level changes during the last interglacial
period (MIS 5e; in its strictest sense from 130 to 116 ka) is       1.1.1    Phreatic overgrowths on speleothems
key to assess the behavior of ice sheets in a warmer world
as MIS 5e is considered a potential analog for the future sea-      POSs form on submerged cave walls and pre-existing vadose
level rise due to anthropogenic global warming since tem-           speleothems at and just below the water table (Ginés et al.,
peratures were on average ∼ 1.5 ◦ C higher than today (rela-        2012), when seawater mixes with meteoric water inside caves
tive to the 1961–1990 CE period; Turney and Jones, 2010).           that are located in close proximity to the coastline (within
Sea-level indicators formed during MIS 5e are often better          300 m). The pre-existing vadose speleothems become partly
preserved compared to those from earlier interglacial peri-         submerged in the resulting brackish water (Fig. 1a). Previous
ods, and thus, relative sea level (RSL) during this time inter-     petrographic investigations of these deposits suggested that
val is especially informative (Capron et al., 2019). However,       the major control on carbonate precipitation is the ability of
significant uncertainties regarding the precise timing, dura-       CO2 to degas across the water–air interface (Pomar et al.,
tion, and amplitude of MIS 5e sea level remain. The main            1976; Csoma et al., 2006). These findings are supported by
limiting factor is finding a sea-level indicator that can ro-       present-day observations that indicate the upper 40 cm of the
bustly constrain both water depth and age. Fossil corals can        water column is supersaturated with respect to calcium car-
be dated to relatively high precision but have meter-scale un-      bonate, allowing for POS to form (Boop et al., 2014). While
certainties in the reconstructed sea level (Hibbert et al., 2016;   meteoric–marine mixing zones are mostly referred to as sites
Chutcharavan and Dutton, 2021). Other indicators, such as           of extensive dissolution, aragonite or calcite precipitation oc-
erosional notches (Bini et al., 2014; Antonioli et al., 2015) or    curs when a high concentration gradient between pCO2 of
flank margin caves (Carew and Mylroie, 1995; Mylroie et al.,        the cave water and atmosphere exists. Therefore, faster de-
2020) pinpoint sea level, but lack tight age control. For this      gassing is expected to happen in caves with low CO2 partial
reason, there is a growing demand in exploring sea-level in-        pressure (pCO2 ) in their atmosphere. Corrosion of carbonate
dicators that can simultaneously provide a robust chronology        minerals was noticed in some Majorcan caves, particularly
and have a clear indicative meaning.                                when approaching the halocline; however, both calcite and
   Relevant sea-level markers such as flank margin caves            aragonite are presently precipitating at the water table in the
(Mylroie et al., 2020), tidal notches (Bini et al., 2014),          mixing zone, where the numerical model predicts dissolution
phreatic overgrowths on speleothems, and vadose submerged           (Csoma et al., 2006).
speleothems (Richards et al., 1994; Onac et al., 2012) are             With very few exceptions, the morphology of the POS is
unique to coastal karst environments (Van Hengstum et al.,          clearly different from that of speleothems precipitated at the
2015). Over the past decade, there has been a growing in-           freshwater level in pools from non-coastal caves, e.g., shelf-
terest in cave deposits that allow for sea-level reconstruc-        stones and subaqueous freshwater pool spar, on which the
tions, which include phreatic overgrowths on speleothems            overgrowths are truncated in the upper part and mainly ac-
(POSs; indicative of the position of sea-level stillstands) and     crete under the water level. Furthermore, the carbonate depo-
submerged vadose speleothems (SVSs; providing maximum               sition of these speleothems is not symmetric with respect to
elevations of sea-level position). A very large number of           the water level and the tide range, which is a particularity of
speleothem records have been reported and a comprehen-              POS. The only instance when the shape of POS is asymmet-
sive compilation by the Speleothem Isotope Synthesis and            ric (i.e., form only under the water level) is when the preexist-
AnaLysis working group was used for multiple climate re-            ing vadose speleothem (i.e., stalagmite) was not long enough
constructions and model evaluations (Atsawawaranunt et al.,         to capture the full range of the tide, which is responsible for
2018; Comas-Bru et al., 2020). However, the majority of             their spherical or elliptical morphology. POS can take a va-
these studies are mainly directed towards paleoclimate re-          riety of shapes and sizes (Fig. 1e, f), depending on the mor-
constructions and only a handful focused on documenting             phology of the vadose support, how long they were immersed
sea-level changes as recorded by these deposits. The idea           in the cave’s brackish water, and the tide amplitude. Only
of using speleothems in reconstructing Quaternary sea-level         a few petrological and geochemical studies have been per-
changes dates back 5 decades (Benjamin, 1970; Spalding and          formed so far (Pomar et al., 1976; Ginés et al., 2005, 2012;
Mathews, 1972; Ginés and Ginés, 1974). Relative to corals,          Csoma et al., 2006). The mineralogical and crystallographi-
an advantage of employing speleothems as sea-level markers          cal data indicate calcite as the dominant phase with fibrous,
is that the dense cave calcite is less susceptible to alteration.   elongated, and isometric crystals, but radial-fibrous/acicular
An additional benefit is that karst caves provide an excellent      aragonitic fabric can exceed 70 % in some samples (Ginés
and sheltered environment in which these deposits are well          et al., 2012). A limited number of stable isotope analyses
preserved and protected against processes that disrupt or de-       showed an isotopic evolution towards heavier composition
stroy other terrestrial archives.                                   through the MIS 5e and 5a possibly due to excessive ma-
                                                                    rine water intrusion in the cave ponds (Vesica et al., 2000).

Earth Syst. Sci. Data, 13, 2077–2094, 2021                                          https://doi.org/10.5194/essd-13-2077-2021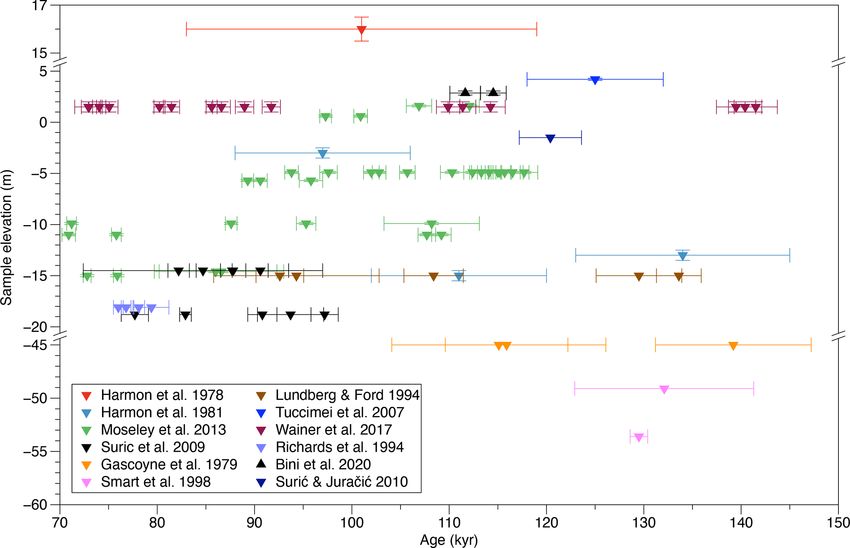
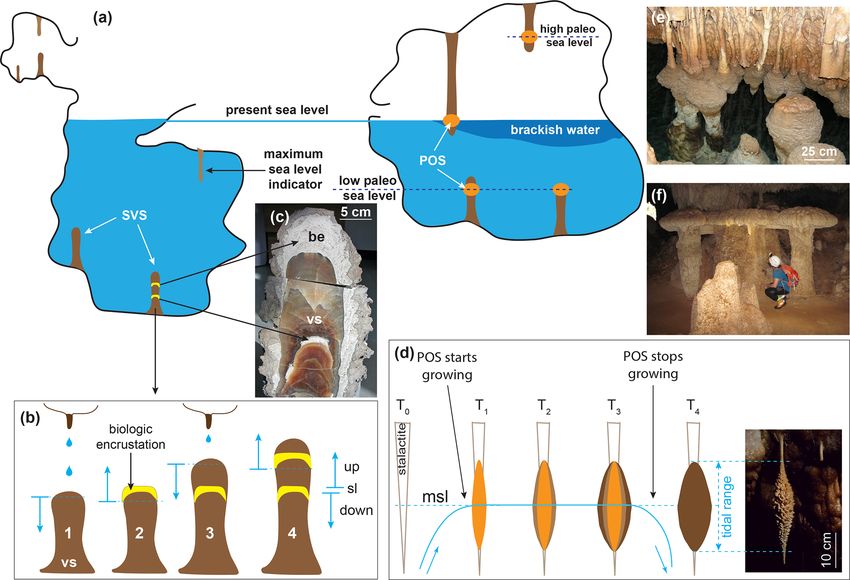
O. A. Dumitru et al.: Last interglacial sea-level history from speleothems                                                              2079

Figure 1. (a) Composite diagram showing how submerged vadose speleothems (on the left) and phreatic overgrowths on speleothems (on
the right) in littoral caves act as sea-level indicators. (b) Conceptual model showing that (b1) growth of SVSs indicates times when sea level
was lower than their elevation; (b2) Hiatus – period of SVS submergence suggesting sea level higher than the SVS elevation; (b3) SVSs
resume their deposition when sea level fell below its elevation. (c) SVS (be: biogenic encrustation; vs: vadose speleothem) from Argentarola
Cave, Italy (photo courtesy Fabrizio Antonioli). (d) Conceptual models showing how POSs form; as long as sea level remains at the same
elevation (T1–T3) POSs will precipitate at sea level and within tidal range and will continue to grow until the sea level drops below the
speleothem (T4). (e) Late Holocene POS in Cala Varques Cave, Majorca. (f) Mushroom-shaped POS in Santa Catalina Cave, Cuba (photo
courtesy Bogdan P. Onac).

More in-depth studies have been undertaken to investigate                ful sea-level index points because they provide spatial ge-
the POS precipitation conditions and the relationships be-               ographic positioning, accurate elevation, and absolute ages.
tween surface conditions (temperature, barometric pressure,              This type of cave deposit has only been identified in a few
precipitation, tidal level of the sea) and the microenviron-             places worldwide: Majorca (Ginés and Ginés, 1974; Vesica
ment of coastal caves (temperature, pCO2 , and water level;              et al., 2000; Tuccimei et al., 2007; Dorale et al., 2010; Polyak
Boop et al., 2014). The distinction between POS and shelf-               et al., 2018; Dumitru et al., 2019); Sardinia (Tuccimei et
stones (flat deposits attached to cave walls or on partly im-            al., 2012); Nansei islands, Japan (Pacific Ocean; Urushibara-
mersed speleothems that grow inwards from the edge of the                Yoshino, 2003; Minami Daito Island; Miklavič et al., 2018);
pool/speleothem) is clearly described in Onac et al. (2012).             Christmas Island, Australia (Indian Ocean; Grimes, 2001);
   The hydraulic gradient between caves hosting POS and the              and Mexico (Jenson, 2018). Similar deposits have been re-
sea is insignificant, since the caves are proximal to the coast-         cently described and dated from Santa Catalina Cave in Cuba
line, and thus, the brackish water table in these caves is, and          (De Waele et al., 2017, 2018). While of different morpholo-
was in the past, coincident with sea level. As long as sea level         gies, such as mushroom caps and bench-like encrustations
remains at the same elevation, carbonate precipitation occurs            similar to cave shelfstones (called balconies), they appear to
within the tidal range at the air–water interface (Vesica et             be POSs (Fig. 1f). Earlier investigations of these speleothems
al., 2000; Fornós et al., 2002; Dorale et al., 2010; Polyak et           suggested that their formation is highly dependent on micro-
al., 2018). Therefore, the presence of POS horizons at differ-           bial activity and water level fluctuation (Bontognali et al.,
ent elevations precisely marks the positions of paleo-water              2016).
tables and consequently their associated sea-level position.
Given the precipitation mechanism (Fig. 1d), POSs arguably
provide the most precise and less ambiguous indicator of the
absolute elevation of sea-level position. POSs are meaning-

https://doi.org/10.5194/essd-13-2077-2021                                                 Earth Syst. Sci. Data, 13, 2077–2094, 2021
2080                                                 O. A. Dumitru et al.: Last interglacial sea-level history from speleothems

1.1.2   Submerged vadose speleothems                               them captured the MIS 5 sea-level stand, they are not dis-
                                                                   cussed in this paper. The age of growth initiation and ces-
Speleothems such as stalactites and stalagmites form in air-       sation is dependent on sample position and growth rate. A
filled passages (Fig. 1a); thus periods of their growth indicate   highly resolved U–Th chronology defines the degree of con-
times when sea level was lower; hence they are sea-level ter-      tinuous growth, and a high-quality petrographic examination
restrial limiting points. For vadose speleothems that are sub-     of the sample would support that. These ages can be used
ject to sea-level submergence, hiatuses (i.e., no carbonate de-    to calculate the growth rate, allowing a better definition of
position) can be correlated with periods when sea level rose       the onset and cessation of deposition for either POS or SVS
and inundated the cave, causing speleothem growth to cease.        samples. This information bears significance since one can
Important to note is that a prolonged pause in speleothem          use the growth rate to project the onset of a hiatus, which in
growth is not always caused by sea-level rise; changes in hy-      coastal caves provides evidence for when sea level emerged
drology and hydrochemistry above the cave, for example, un-        above that particular speleothem elevation. To provide robust
dersaturation of drip water or cessation of dripping (drought      chronologies, we refer the readers to the workflow to treat
or blockage of drainage path), can also lead to interruption       records with hiatuses developed by Comas-Bru et al. (2020).
of speleothem deposition (Onac et al., 2012). When growth
cessation is sea-level related, particular mineralogical and/or    1.2   Existing MIS 5e sea-level databases and context of
biological features can be visible using petrography. Some               our work
of these include (i) corroded layers when dissolution hap-
pens at the halocline, (ii) biogenic encrustations (Fig. 1b, c),   Extensive reviews of MIS 5e sea-level indicators (coral reef
(iii) traces of marine borings, and (iv) deposition of various     and marine terraces, shore platforms, beach deposits and
trace elements or minerals (halite, gypsum, etc.). Details re-     ridges, tidal notches, and sea caves) at global scale have been
garding ways of deciphering different types of growth hia-         compiled by Kopp et al. (2009), Dutton and Lambeck (2012),
tuses are presented by Onac et al. (2012) and van Hengstum         Pedoja et al. (2014), and Hibbert et al. (2016). A step for-
et al. (2015). Dating the carbonate layer immediately above        ward was taken by Rovere et al. (2016a), who set the basis
each of these hiatuses provides a minimum estimate of when         for a standardized approach to MIS 5e paleo sea-level re-
the cave became air-filled, again constraining the minimum         constructions and interpreted the indicators in terms of the
age for the sea-level fall. The carbonate layer below a hiatus     entire geological or sedimentary facies, rather than consider-
indicates the maximum age, assuming no post-depositional           ing each of them separately. Standardized sea-level databases
alteration of the exposed surfaces, for when this location in      allow for regional to global comparisons of records from dis-
the cave was air-filled and the sea level was clearly below        parate locations. In turn, this provides a means to disentan-
the speleothem elevation. It is worth noting that the earliest     gle spatial patterns and rates of sea-level change at different
layers deposited above the hiatuses are protected by further       timescales. These curated sets of data will ultimately enhance
carbonate precipitation, whereas those below the hiatuses are      our understanding of the mechanisms driving sea-level fluc-
susceptible to diagenetic alteration or even dissolution. Thus,    tuations, thus improving both physical models and statistical
such carbonate accumulations provide precise age constraint        reconstructions (Khan et al., 2019).
on the initiation of growth but may not tell exactly when sea         Speleothems have received little or no attention in prior
level dropped.                                                     compilations. A thorough review of the results obtained from
    SVSs stop growing when sea level is above their eleva-         the study of Mediterranean submerged speleothems since
tion and restart their deposition when sea level falls below       1978 and their use to reconstruct past sea-level variations has
it (Fig. 1b); thus, they record past sea-level fluctuations in-    been recently provided by Antonioli et al. (2021). Still, a ded-
dicating when the cave was air-filled or invaded by seawater       icated cave deposit database is not currently available to the
(Richards et al., 1994; Moseley et al., 2013). Once the sea        sea-level community. In this context, the present dataset pa-
level falls again, if conditions are suitable, the speleothem      per aims to compile existing results on cave-deposit-derived
may resume its deposition. Hence, the vadose speleothems           sea level during the last interglacial period and make them
can only provide the minimum and maximum age when a                more accessible to the paleoclimatology and oceanography
particular part of the cave became flooded or air-filled, not      community, with the ultimate goal of facilitating research on
precisely when and where the water level was actually lo-          MIS 5 sea level. This work gathers data from previously pub-
cated throughout the bulk of the rise–fall cycle (Richards et      lished studies, each of which describes the samples analyzed,
al., 1994; Surić et al., 2009). Therefore, the growth of vadose   the isotopic ratios and concentrations used to generate the
speleothems is a limiting point, and thus, its relationship with   chronology, and the scientific relevance for interpreting past
the sea-level position must be interpreted correspondingly.        sea-level changes. Section 2 presents the data, including the
The submerged speleothem indicators can be refined by dat-         criteria for the inclusion of each record such as spatial cover-
ing alternating continental and marine biogenic overgrowths        age, the elevation measurements and their uncertainties, and
(serpulid colonies) if they exist and are well preserved (An-      the U–Th methods for their absolute chronology. Section 3
tonioli et al., 2004; Dutton et al., 2009), but since none of      discusses the interpretation of these records and highlights

Earth Syst. Sci. Data, 13, 2077–2094, 2021                                         https://doi.org/10.5194/essd-13-2077-2021
O. A. Dumitru et al.: Last interglacial sea-level history from speleothems 2081
the valuable information they provide for eustatic sea level This database includes a total of 71 speleothems (36 sea-
and the crucial inputs in assessing glacial isostatic adjust- level index points and 37 limiting points) of variable quality.
ment (GIA) models and regional tectonic activity. All the POS records have precisely measured elevations, a
narrow indicative range, and decimetric RSL uncertainties;
2 Data description hence they are excellent sea-level indicators. A guide for
SVS records’ evaluation as terrestrial limiting points can be
The data presented here are part of the World Atlas of found in WALIS’ official documentation (https://walis-help.
Last Interglacial Shorelines (WALIS, https://warmcoasts.eu/ readthedocs.io/en/latest/RSL_data.html; last access: 8 May
world-atlas.html, last access: 12 April 2021), a sea-level 2021). Worth noting is that the ages that are near but outside
database interface developed under the framework of the Eu- the MIS 5 range are not included in the discussion of this pa-
ropean Research Council Starting Grant “WARMCOASTS” per, but, for completeness, they are entered in the database.
(ERC-StG-802414), in collaboration with PALSEA (PALeo
constraints on SEA level; a PAGES-INQUA working group). 2.2 Spatial coverage
WALIS provides a new standardized database and aims to be
the most comprehensive compilation of globally distributed Phreatic carbonate overgrowths on speleothems dating to
(new and old) data on MIS 5 sea-level indicators. The inter- MIS 5 are found in caves along the coasts of Majorca (Vesica
face allows a large range of data and metadata on relative et al., 2000; Fornós et al., 2002; Dorale et al., 2010; Tuccimei
sea-level indicators and associated ages to be inserted into a et al., 2012; Polyak et al., 2018), the northern coast of Cuba
mySQL database. An export tool allows one to download the (De Waele et al., 2017, 2018), and to a lesser extent in Sar-
data inserted by the logged user as a multi-sheet Microsoft dinia (Tuccimei et al., 2007). Submerged vadose speleothems
Excel .xls file. This archive is available open-access as Du- were investigated from Bermuda (Harmon et al., 1978; 1981;
mitru et al. (2020; https://doi.org/10.5281/zenodo.4313860). Wainer et al 2017), the Bahamas (Gascoyne et al., 1979;
We refer the readers to the official documentation of Gascoyne, 1984; Li et al., 1989; Lundberg and Ford, 1994;
the WALIS database at https://walis-help.readthedocs.io/en/ Richards et al., 1994; Smart et al., 1998), the Yucatán Penin-
latest/ (last access: 12 April 2021), where the meaning of sula (Moseley et al., 2013), Croatia (Surić et al., 2009; Surić
each field is explained in detail. These files will be avail- and Juračić, 2010), and Italy (Tuccimei et al., 2007; Bini et
able in WALIS v1.0, which will provide a user-friendly in- al., 2020). Except for the SVSs from the Yucatán Peninsula
terface for quick visualization, extraction, and downloading reported by Moseley et al. (2013) and from Bermuda (Wainer
of the data. We summarize below the major features of the et al., 2017), studies do not report the exact cave location
records which comprise the database in metadata fields that from where samples were collected. Hence, the latitude and
enable easy reuse of the time-series data. In order to ensure longitude for these indicators were determined using Google
high-quality data intended for scientific reuse, only results Earth to match locations from publication maps and noted
published in peer-reviewed literature were considered. accordingly. The geographical distribution shows all sites are
located in the Northern Hemisphere within 20 and 45◦ lati-
2.1 Criteria for record inclusion tude N (Fig. 2).
The use of speleothems as sea-level indicators has been re-
2.3 Elevation measurements and their uncertainties
ported from several places around the world; however, in this
data paper we only present the results that capture sea level The sample elevation is the vertical distance between the in-
during the complete last interglacial (MIS 5; 140–70 ka). The dicator and a vertical datum (i.e., a “zero” reference frame,
discussion is mostly centered around MIS 5e, but also in- representing modern mean sea level) and is a fundamental
cludes results on the sea-level position during MIS 5d, 5c, 5b, property measured in the field. All samples have been re-
and 5a. A number of POSs older or younger than MIS 5 have ported relative to present mean sea level. Several instruments
been published from caves in Majorca (Vesica et al., 2000; with different uncertainties have been used to measure the
Dumitru et al., 2019, 2021), Japan (Miklavič et al., 2018), elevation of the speleothems: barometric altimeter (±0.1 m;
and Mexico (Jenson, 2018), but they are not included in this Moseley et al., 2013), metered tape or rod (±0.5 m; Harmon
paper. Similarly, SVSs (some of which are at much lower el- et al., 1978), and/or inclinometer (±0.05 m; Dorale et al.,
evations than the ones presented here) have been identified in 2010). The uncertainties of Majorcan POS elevation, even
several submerged caves in the Bahamas and Mediterranean, though some of the samples are collected from the same cave,
but their ages are far too old (Richards, 1995; Smart et al., vary depending on the instrument used (e.g., ±0.1 m in Tuc-
2008) or young (Spalding and Mathews, 1972; Beck et al., cimei et al., 2007, and Polyak et al., 2018; ±0.05 m in Dorale
2001; Hoffmann et al., 2010; Arienzo et al., 2015, 2017; An- et al., 2010). The POS belt from Cuba occurs within 0.4 m,
tonioli et al., 2021) to be directly relevant for MIS 5 sea-level more or less corresponding to the average tidal range mea-
reconstruction. sured in the city of Matanzas (< 25 km NE from the cave
site). In some cases, information regarding elevation mea-
https://doi.org/10.5194/essd-13-2077-2021 Earth Syst. Sci. Data, 13, 2077–2094, 20212082 O. A. Dumitru et al.: Last interglacial sea-level history from speleothems
Table 1. Sites included in data product. Location and name of the caves, type of speleothems, and the corresponding references.
Type of
Location Cave name speleothem Reference
Majorca, Spain Cova de Cala Varques A POS Dorale et al. (2010); Polyak et al. (2018)
Cova de Cala Varques B Polyak et al. (2018)
Cova del Dimoni
Cova de Cala Falcó
Cova des Pas de Vallgornera
Cova Genovesa
Cova de s’Ònix
Coves del Pirata
Cova des Serral
Coves del Drac
Cova de sa Tortuga
Sardinia, Italy Grotta di Nettuno POS, SVS Tuccimei et al. (2007)
Italy Infreschi Cave SVS Bini et al. (2020)
Cuba Santa Catalina Cave POS De Waele et al. (2017, 2018)
Bermuda Government Quarry Cave SVS Harmon et al. (1978, 1981)
Bierman Quarry Cave
Crystal Cave
Wilkinson Quarry Cave Wainer et al. (2017)
Yucatán Peninsula Caves in Quintana Roo SVS Moseley et al. (2013)
Krk Island, Croatia U Vode Pit SVS Surić et al. (2009)
Lošinj Island, Croatia Medvjed̄a spilja Cave SVS Surić and Juračić (2010)
Andros Island, Bahamas Blue Hole in South Bight SVS Gascoyne et al. (1979)
Stargate Blue Hole Richards et al. (1994); Smart et al. (1998)
Conch Sound Blue Holes Gascoyne (1984)
Grand Bahama, Bahamas Lucayan Caverns SVS Lundberg and Ford (1994)
Richards et al. (1994)
Sagittarius Cave SVS Richards et al. (1994)
surements and their uncertainties is not reported because the 2.4 Samples
papers are not strictly sea-level studies but indirectly pro-
vide sea-level information, or because the uncertainties re-
lated to local tectonics are much larger than the measure- In the WALIS database, each sample is assigned a sample
ment uncertainty (Surić et al., 2009). Samples reported by ID that is composed of the first two letters of the main au-
Gascoyne (1984) are missing information on their elevation; thor’s last name, followed by the year of publication and a
hence we only report their U-series ages in the database, number code given to each speleothem individually (see Ta-
and they are not considered terrestrial limiting points. How- ble 2 as an example). The analysis ID complements the sam-
ever, we include here the existing elevations of these sam- ple ID by including a distinct number for when two or more
ples found in the McMaster University Speleothem Collec- ages are reported for the same speleothem. Finally, the re-
tion, 2008 (courtesy: Derek C. Ford): samples 81048, 81049, ported ID is the published sample identifier or laboratory ID
81050, and 81052 from ∼ 80 m below sea level; 81054 and offered by the authors in the original paper. Since samples
81055 from ∼ 3 m a.p.s.l.; 76017 from shallower depth; and once collected may end up having several IDs (collection,
78026 and 78027 from between 0 and 9 m below sea level. dating lab, etc.), it is recommended that whenever included
in a database, authors should always use the ID associated
with its first description and when the lab ID is different, this
should also be added. We note that for samples that have a
Earth Syst. Sci. Data, 13, 2077–2094, 2021 https://doi.org/10.5194/essd-13-2077-2021O. A. Dumitru et al.: Last interglacial sea-level history from speleothems 2083
Figure 2. (a) Global map showing the predicted RSL near the end (119 ka) of the modeled MIS 5e (see Fig. 2 of paper: https://doi.org/
10.1016/j.quascirev.2017.06.013; Dendy et al., 2017) to highlight the potential of the samples’ sites to record the behavior of the forebulge
during ice-sheet loading and unloading. Sites where POS and SVS were documented and sampled are indicated by red circles and yellow
squares, respectively.
Table 2. Example to show how samples are coded in the WALIS immersion in the brackish pool (Ginés et al., 2012). They are
database. generally small enough to collect in situ, and larger POSs can
be cored in place. The Cuban POSs investigated by De Waele
Sample ID Analysis ID Reported ID et al. (2017, 2018) in Santa Catalina Cave are rare composite
DO10-001 DO10-001-001 CCVA-1 mushroom-shaped speleothems with caps reaching diameters
DO10-002 DO10-002-001 CCVA-2 > 1 m and balconies present along the walls. In this case, the
DO10-003 DO10-003-001 CDD-1 authors analyzed samples from mushroom stalk or cap, bal-
DO10-004 DO10-004-001 CDD-2 cony, and other associated speleothems. Most of the SVSs in-
DO10-005 DO10-005-001 CCVB vestigated as sea-level indicators are stalagmites, but results
DO10-006 DO10-006-001 CCF-1 from flowstones and stalactites have been reported as well.
DO10-007 DO10-007-001 CCF-2 The caves have unique scientific, recreational, and scenic
DO10-008 DO10-008-001 CPV-1
value; hence, speleothem sampling strategies must be selec-
DO10-009 DO10-009-001 CPV-2
DO10-010 DO10-010-001 CPV-B8
tive and reconcile cave conservation with the scientific goal
DO10-011 DO10-011-001 CPV-B6 (Baeza et al., 2018). For this reason, we emphasize that the
DO10-012 DO10-012-001 CPV-B9 utmost effort should be made to minimize the future im-
pacts of sampling by following the conservation and preser-
vation guidelines. We strongly encourage more sustainable
sampling strategies and, if sufficient material and appropri-
different laboratory ID than the sample identifier (i.e., Mose- ate documentation has been archived by the original authors,
ley et al., 2013) both are included in our reported ID. making them available for future researchers is desirable.
A variety of different speleothems are reported to have Similarly, we recommend preferentially sampling already
recorded past sea levels. Stalagmites grow from the floor up- broken/damaged speleothems whenever the original location
ward in caves, stalactites (dripstones) hang from the ceilings, can be established, as suggested by Frappier (2008). Another
and flowstones are sheetlike deposits that form on walls and sustainable sampling strategy is coring of speleothems rather
floors. The POSs analyzed by Dorale et al. (2010) and Polyak than collecting the entire specimen and patching the drill
et al. (2018) have a different size, shape, and morphology, holes (Spötl and Mattey, 2012).
depending on the vadose support and on the extent of their
https://doi.org/10.5194/essd-13-2077-2021 Earth Syst. Sci. Data, 13, 2077–2094, 20212084 O. A. Dumitru et al.: Last interglacial sea-level history from speleothems
2.5 Sample mineralogy The development of TIMS and then MC-ICP MS in measur-
ing U-series isotopes constituted a major step forward from
The geochemical setting and sample mineralogy may dic- the alpha spectrometric method (Hoffmann et al., 2007). The
tate the susceptibility to alteration. For example, samples that majority of the records compiled here were dated using MC-
show conversion of aragonite to calcite or calcite recrystal- ICP MS, and only a few used or reported alpha spectrometry
lization could have been subjected to uranium loss, which (Harmon et al., 1978, 1981; Gascoyne et al., 1979, Gascoyne,
is an important factor that impacts U–Th ages (Lachniet et 1984; Smart et al., 1998; Vesica et al., 2000; Tuccimei et al.,
al., 2012; Bajo et al., 2016). To allow recognition of dia- 2007) or TIMS results (Lundberg and Ford, 1994; Richards
genetic fabrics, XRD screening is desirable for dating pur- et al., 1994; Tuccimei et al., 2007; Dorale et al., 2010).
poses (aragonite is preferred vs. calcite). In order to make When provided by authors, the database also includes the
the best selection of samples, we encourage the use of pet- initial 230 Th / 232 Th ratios and the decay constants. The cor-
rographic investigation as well. Thin sections can help to rection for the initial non-radiogenic sources (i.e., hydroge-
best identify the speleothem layers just below and above the nous, colloidal, and carbonate or other detrital components;
hiatus for dating purposes, and also, they reveal the internal Richards et al., 2012) of 230 Th incorporated at the time of
structure, and so areas affected by recrystallization can be speleothem deposition is extremely important for age calcu-
avoided while sampling. However, only some of the studies lation and is sensitive for samples that contain very little ura-
compiled here report the mineral assemblage of the samples nium or an abundance of detrital thorium. The 230 Th / 232 Th
by X-ray diffraction (Surić et al., 2009; Surić and Juračić, activity ratio of 0.825 with an arbitrarily assigned uncer-
2010; De Waele et al., 2017, 2018). De Waele et al. (2018), tainty of 50 % found in the mean bulk Earth or upper con-
for example, complemented the screening method with pet- tinental crustal has been commonly assumed for initial 230 Th
rographic investigations (thin sections) and imaging using corrections. However, several studies have shown that this
scanning electron microscopy. We do not exclude the possi- value may not cover all situations. Therefore, laboratories ap-
bility that screening was performed in the other publications, ply different corrections for the non-radiogenic detrital 230 Th
but it has not been reported. For future studies, we strongly fraction through either direct measurement of sediments as-
recommend including information on mineral assemblage, as sociated with speleothems (Hoffmann et al., 2018) or com-
well as diagenetic and crystalline descriptions. puted isochron methods and stratigraphical constraints (Hell-
strom, 2006; Richards et al., 2012). Most POSs included
2.6 U-series methods in this database fulfill the criterion suggested by Hellstrom
(2006) that samples with ratios of 230 Th / 232 Th higher than
Accurate geochronology is essential to these studies. Dut- 300 are considered clean, with very few samples having
ton et al. (2017) provide a template of what information lower ratio values (Tuccimei et al., 2007). However, the use
should be reported for U-series data for geochronology and of this threshold value is arbitrary and depends on the ratio
timescale assessment in the earth sciences. As was found for used for initial Th. We emphasize that this database includes
coral-based sea-level work, the speleothem U-series results the ages as they are reported in the original publications, and
reported often contain insufficient information to completely therefore, it contains two columns: reported ages and cor-
assess the data collected. This ultimately limits the value of rected ages. The latter one represents the ages to which the
the data since often it is not possible to assess or recalcu- original authors applied a correction for detrital Th based on
late a date using the information provided. While it may the a priori estimate of initial Th. We did not apply any fur-
not be practical to recalculate dates from older data, what ther corrections when compiling this database, and we also
is more important is to have data and methods so that deci- did not recalculate the ages. All data contain the minimum
sions can be made to request or recollect samples of inter- required information (as recommended in the Supplement of
est. We include in the database the U-series method used (al- Comas-Bru et al., 2020) to calculate uncorrected ages; how-
pha counting, thermal ionization mass-spectrometry (TIMS), ever, not all of them provide the initial 230 Th / 232 Th activity
multi-collector inductively coupled plasma mass spectrome- ratio to allow the calculation of detritus-corrected ages. The
try (MC-ICP MS)), the decay constants used, and the mea- decay constants for 234 U and 230 Th used to calculate the U–
sured isotopic ratios and concentrations of the sample, all of Th ages have been updated and improved over time (Jaffey
which are required to recalculate U–Th ages and to assess et al., 1971; Edwards et al., 1987; Cheng et al., 2000, 2013).
their robustness. Generally, analyses of well-characterized Most recent papers used the 234 U and 230 Th decay constants
internationally recognized standards or certified reference of Cheng et al. (2000, 2013), but in some papers, especially in
materials are used to demonstrate the reliability of results. the older ones, these values are not provided. It is not likely
Advances in technologies since the mid-1980s have notably that published U–Th dates will be corrected and reported,
increased the analytical precision and reduced age uncertain- but rather that assessment of materials and their U–Th dates
ties, thereby allowing for dating of smaller sample sizes, might be used to make decisions on the need to obtain those
which permits better sampling along single growth layers samples through request or recollect samples from the same
(thicker samples will integrate material of different ages). outcrop or site. Identifying and defining continuous growth
Earth Syst. Sci. Data, 13, 2077–2094, 2021 https://doi.org/10.5194/essd-13-2077-2021O. A. Dumitru et al.: Last interglacial sea-level history from speleothems 2085
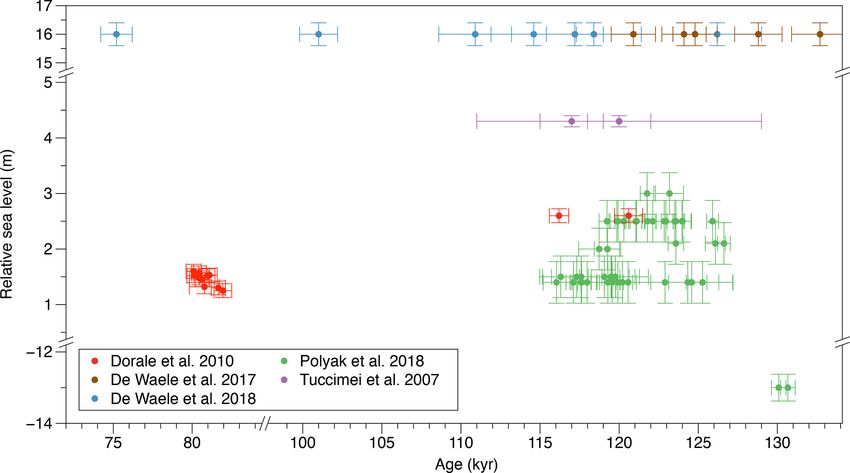
Figure 3. Paleo RSL position recorded by POS. Except for Tuccimei et al. (2007), all U–Th ages are corrected for detrital Th as per the
original publications. No other corrections such as tectonic movement or GIA have been applied.
of vadose speleothems could be helpful to refine minimum or tion, but rather is correlated to it by a quantifiable relation-
maximum sea-level elevations. However, continuous growth ship. This is defined by the indicative meaning, a concept that
is strongly dependent on the reliability and resolution of the needs to be considered when calculating the elevation of pa-
U-series chronology. leo RSL (Hopley, 1986; Shennan, 2015; Hibbert et al., 2016;
The datum for modern reference state of ages reported Rovere et al., 2016a). To define the position of past sea level
is either BP (or 1950 CE) or it is not mentioned, in which over space and time, the sea-level indicators need to provide
case the ages are assumed to be calculated with respect to information on the geographic positioning, elevation with re-
date of analysis. This is usually not considered significant spect to a contemporary tidal datum, age of formation, and
because the errors on MIS 5e ages are generally > 500 years. indicative meaning (Shennan, 2015; Khan et al., 2019). Most
However, with the improvements made using MC-ICP MS records of MIS 5 sea level have come from coral reefs, but
(Cheng et al., 2013), ages on high-quality samples (i.e., arag- the interpretation is hampered by the challenges of finding
onite mineralogy, high U content, insignificant 230 Th cor- pristine and well-preserved corals and the uncertainties re-
rection) of the last interglacial are now possible to uncer- lated to the water depths above the corals. The past sea-level
tainties of ±100 years (2σ ), making how the age is re- position in space and time indicated by speleothems depends
ported more important (i.e., BP). Another reference com- on their type: (i) POSs have the ability to define the discrete
monly used now is yr b2k (years before 2000 CE). Except for position (Fig. 3), whereas (ii) SVSs provide only an upper
Gascoyne (1984) and Gascoyne et al. (1979), where uncer- bound (Fig. 4).
tainties are reported as 1σ , and Harmon et al. (1978, 1981),
who reported standard error, or errors were not mentioned, 3.1 POS define reliable positions of RSL
all ages are reported with 2σ absolute uncertainties. We refer
the reader to the guide on the evaluation of the ages’ qual- POS precipitation was tentatively associated with past sea-
ity, which can be found in WALIS’ official documentation level stands almost 5 decades ago (Ginés and Ginés, 1974),
at https://walis-help.readthedocs.io/en/latest/RSL_data.html but due to advancements in the U–Th dating, only recently
(last access: 8 May 2021). We strongly recommend the use have studies demonstrated their suitability as meaningful sea-
of the term “uncertainty” which is more appropriate in this level index points (Vesica et al., 2000; Dorale et al., 2010;
context than “error”, as suggested by Dutton et al. (2017). Tuccimei et al., 2012; Polyak et al., 2018; Dumitru et al.,
2019, 2021). The most important benefit of using POSs as
sea-level indicators is their unambiguous relationship to sea
3 Discussions level. For example, the indicative range accounts for the ver-
tical extent over which an entire POS forms, and the refer-
The elevation of a sea-level indicator is not always coincident ence water level corresponds to their thickest part, which is
with the position of relative sea level at the time of its forma- the midpoint of the indicative range and the mean sea level.
https://doi.org/10.5194/essd-13-2077-2021 Earth Syst. Sci. Data, 13, 2077–2094, 20212086 O. A. Dumitru et al.: Last interglacial sea-level history from speleothems Figure 4. SVS elevations and U-series ages indicating times when RSL must have been lower, hence providing maximum RSL constraints. Note that continuous growth in some of these speleothems could provide more representative results. None of the data are corrected for GIA or long-term deformation. Hence, they provide a unique opportunity to further enhance at 116.2 and 120.6 ka. Using younger POSs from the same our knowledge on MIS 5 sea-level history, as presented be- and other caves, Dorale et al. (2010) showed that RSL in the low. western Mediterranean was at ∼ 1 m a.p.s.l. during MIS 5a Obtaining 43 new U-series dates on POS from cave sites (∼ 81 ka), challenging the prevailing view of a much lower along the southern and eastern coasts of Majorca, Polyak MIS 5a sea-level position. In summary, POSs are hence reli- et al. (2018) reported an accurate timing of MIS 5e sea- able and accurate indicators able to better resolve RSL during level history, with uncertainties of their U–Th ages better MIS 5. than ±500 years. The external elevation error within each Over 200 large POSs, out of which 24 were recently dated, cave is reported as ±0.25 m and between all of the caves occur in a limited altitudinal range of ∼ 40 cm in Santa used in their study is reported to be ±0.75 m. Their re- Catalina Cave on the northern Cuban coast (De Waele et al., sults show that relative sea level in Majorca was ∼ 2.15 ± 2017, 2018). The authors suggest that the oldest age (126 ka, 0.75 m above present level (m a.p.s.l.) between 126.6 ± 0.4 sample SC2.6a) is the most likely to reflect the chronology and 116 ± 0.8 ka, although centennial-scale excursions can- of the MIS 5e sea-level stand, while the younger ages (which not be excluded due to some small gaps in the POS record show much higher initial uranium activity ratios) reflect re- (Polyak et al., 2018). Similar encrustations were found in crystallization processes. The present-day elevation of these the Grotta di Nettuno, Capo Caccia, area (NW Sardinia, 24 POSs is at 16 m a.p.s.l. (De Waele et al., 2017). These Italy), ∼ 500 km east of Majorca, but only one episode of samples formed during a time interval when the sea level high sea stand at 4.3 m a.p.s.l. was documented (Tuccimei et was the highest, and the authors argue that slow uplift of the al., 2012). Polyak et al. (2018) attributed the discrepancy in coastal area after their formation brought them to this ele- RSL elevation between Sardinia and Majorca to minor differ- vation (De Waele et al., 2017, 2018). Additionally, these 24 ences in glacial isostatic adjustment and/or tectonic move- POSs contributed to the reconstruction of the speleogenetic ment at the two sites. Given the large age uncertainties ob- stages and the local coastal uplift, while also providing infor- tained using alpha counting and TIMS (see Fig. 3), it would mation on the sea-level variations during the last ∼ 400 ka. be worth revisiting the chronology from Grotta di Nettuno and complementing it with more samples. Two POS-derived MIS 5e data from Majorca were also reported by Dorale et al. (2010) at 2.6 m a.p.s.l. in Cova des Pas de Vallgornera Earth Syst. Sci. Data, 13, 2077–2094, 2021 https://doi.org/10.5194/essd-13-2077-2021
O. A. Dumitru et al.: Last interglacial sea-level history from speleothems                                                       2087

3.2   SVS growth intervals – implications for sea-level              including 133–110 and 100–97 ka. These ages were substan-
      upper bound estimates                                          tially improved by an order of magnitude using the TIMS
                                                                     method, and thus, sea level during MIS 5a was constrained
SVSs from submerged caves in tectonically stable areas pro-          to be below −8.5 m (Lundberg and Ford, 1994) and between
vide an additional source of sea-level data, as their growth         −15 and −18 m, as suggested by Richards et al. (1994). The
stops when rising sea levels flood the caves (Richards et al.,       latter study also precisely constrained the termination of MIS
1994). The timing of initiation and cessation of speleothem          5a by determining the age of a sample that started growth
growth is fairly easy to resolve applying U–Th measure-              at 79.7 ± 1.8 ka. More recently, Richards et al. (2012) revis-
ments on carbonate material extracted from above and be-             ited these estimates and applied the correction for non-bulk
low a growth hiatus. The obtained ages will indicate when            Earth initial 230 Th / 232 Th contamination using the isochron
the cave was air-filled and when the cave was submerged              method on samples of stalagmites from the same settings
(Li et al., 1989; Richards et al., 1994). One advantage of us-       (Richards and Dorale, 2003). Stalagmites from a blue hole
ing SVSs is that they allow estimation of past low sea-level         east of Andros Island were also sampled and dated for sea-
stands (lower than today) in both interglacial and glacial pe-       level application. The first set of ages showed that some of
riods. Such information is especially critical in tectonically       these samples deposited during MIS 5; however, they were
stable regions (e.g., Bahamas and parts of the Mediterranean         found to be out of stratigraphic order possibly due to incor-
Basin), where changes in sea level can be directly associated        poration of minor amounts of marine deposits surrounding
with changes in ice-sheet volume, which is a challenging task        the central core (Gascoyne et al., 1979). The authors elim-
for sea-level indicators found in the uplifting coastline re-        inated the age-biasing marine deposits by progressive acid
gions (e.g., Huon, Barbados, Haiti).                                 leaching of crushed samples and analyzed the cleaned calcite
   Submerged speleothems from Bermuda provide strong                 crystals, and the new results showed higher ages document-
sea-level evidence and contribute notably to deciphering the         ing a MIS 6 sea-level lowstand (at least 42 m below present
timing of stillstands during MIS 5. The growth deposition of         level) between 160 and 139 ka (Gascoyne et al., 1979).
stalactites, stalagmites, and flowstones with low 232 Th con-           Subaerial growth periods of speleothems from the Yucatán
tent found in Bermudan caves indicates that sea level stood at       Peninsula provide precise and reliable maximum constraints
∼ 4 to 6 m a.p.s.l. at ∼ 125 ka, it fell below −6.5 m by 120 ka,     for relative sea levels during MIS 5 that contribute to our
and it stabilized for a short time at approximately 8 m be-          understanding of sea level in the western North Atlantic–
low present at ∼ 114 ka (Harmon et al., 1978). A few years           Caribbean region (Moseley et al., 2013). The authors show
later, another study by Harmon et al. (1981) using ages from         that following the MIS 5e highstand, RSL dropped below
submerged speleothems and eolianites showed that sea level           −4.9 m by 117.7 ± 1.4 ka. They also provide maximum sea-
at ∼ 105 and ∼ 85 ka was between −15 and −20 m and at                level stands during MIS 5c and 5a: (i) MIS 5c sea-level high-
least −15 m at ∼ 95 ka. Recent research on a submerged sta-          stand occurred after 107.7±0.9 ka between −11 and −4.9 m
lactite from Wilkinson Quarry Cave, northern Bermuda, in-            and ended by 108.2 ± 4.9 ka, and (ii) sea level peaked dur-
dicates hiatuses starting at 137 ± 5, 106 ± 6, 84.3 ± 1.5, and       ing MIS 5a after 87.6 ± 0.6 ka at an elevation higher than
79.9±0.9 ka (Wainer et al., 2017). These new results provide         −9.9 m, but the length of this highstand is poorly constrained
important constraints suggesting that local sea level might          because of the high detrital Th in the speleothem. Sea level
have peaked above ∼1.5 m a.p.s.l. during MIS 5e, 5c, and 5a.         then dropped below −14.6 m, and the speleothem continued
They also indicate a double highstand during MIS 5a, and             to grow until 61.3±0.4 ka. In addition to the information pro-
while the data are in agreement with other studies from tec-         vided on the maximum RSL, when speleothems with precise
tonically active regions (Surić et al., 2009), given the tectonic   ages are used in conjunction with data from other local sea-
stability of Bermuda, Wainer et al. (2017) interpret the results     level indicators, they can also offer robust chronologies for
as a global event associated with changes in ice-sheet volume        the timing of the relative sea-level fall at the last interglacial
and not a tectonic movement.                                         termination (Moseley et al., 2013).
   A large number of speleothems were collected from the                Constraints on the maximum RSL during MIS 5a in
Bahamian caves from different elevations as mentioned ear-           the eastern Mediterranean basin are provided by Surić et
lier in Sect. 2.1, but only a few of them captured sea-level         al. (2009), who dated two submerged stalagmites from the
stands during MIS 5. Spalding and Mathews (1972) first at-           U Vode Pit on Krk Island, in the eastern Adriatic Sea.
tempted to date SVSs from Grand Bahama Island and were               Their double-highstand MIS 5a sea-level scenario is sup-
followed by Gascoyne et al. (1979), Gascoyne (1984; north-           ported by layers of halite and gypsum associated with hia-
eastern coast of Andros and Lucayan Caverns, Grand Ba-               tuses in speleothem growth probably caused by seawater in-
hama), Richards et al. (1994; South Andros and Grand Ba-             undation. The timing of possible marine incursions was de-
hama), and Smart et al. (1998; South Andros). Li et al. (1989)       termined by dating the layers below and above these growth
first presented ages on a flowstone collected from −15 m be-         hiatuses. Their work was further continued by Surić and Ju-
low modern sea level in Lucayan Caverns, Grand Bahama                račić (2010), who investigated 16 submerged speleothems
Island, and documented hiatuses at a few different intervals         from seven submarine caves and pits along the eastern Adri-

https://doi.org/10.5194/essd-13-2077-2021                                            Earth Syst. Sci. Data, 13, 2077–2094, 2021
2088 O. A. Dumitru et al.: Last interglacial sea-level history from speleothems
atic coast to provide insight into the sea-level changes over ice distribution and the timing of deglaciation (Polyak et al.,
the last 220 kyr. 2018).
Reconstructions of MIS 5e sea-level evolution are also Bermuda is strongly affected by the glacial forebulge that
provided by stratigraphical and geochronological constraints forms due to the presence of the Laurentide Ice Sheet dur-
from Infreschi Cave (Marina di Camerota, Italy). A combina- ing glacial periods (Harmon et al., 1981, 1978; Wainer et al.,
tion of U–Th ages of speleothem deposition phases with ages 2017); hence sea-level markers from this location have the
of calcite in Lithophaga boreholes and with 40 Ar / 39 Ar ages potential to capture the response of the forebulge to glacial
of correlated tephra indicates that sea level fell more than 6 m loading and can be seen as gauges. Based on U–Th ages
before ∼ 120 ka and places the maximum highstand RSL at of SVSs from Wilkinson Quarry Cave, Bermuda, Wainer et
8.90 ± 0.6 m a.p.s.l. (Bini et al., 2020). al. (2017) showed that RSL was higher than 1.5 ± 0.5 m dur-
ing MIS 5e, MIS 5c, and MIS 5a. The results also suggest a
3.3 POS- and SVS-derived sea level provides inputs for
double RSL peak during MIS 5a, indicating rapid sea-level
glacial isostatic adjustment models
variation associated with changes in ice-sheet volume. Test-
ing GIA models against these new constraints, the results re-
The recorded elevations of sea-level indicators reflect a com- inforce the presence of a smaller Laurentide Ice Sheet during
bination of local changes in sea level of a region due to late MIS 5 and a restricted range of Earth viscosity values,
glacial isostatic adjustment that causes land uplift or sub- with higher values of lower-mantle viscosity compared to
sidence, displacing the local sea-level datum relative to the those used in some GIA models (e.g., Creveling et al., 2017).
global mean (Rovere et al., 2016b). Thus, a significant part Wainer et al. (2017) confirm that it is possible to explain a
of the spatial variation in the MIS 5 sea-level record is due wide range of MIS 5c–a relative sea levels observed across
to the diverse response of coastlines to GIA, depending on the western North Atlantic–Caribbean in GIA models, even
the extent of continental or insular shelves, the distance from with a limited range of mantle deformation constants.
former ice sheets, and other variables (Dutton and Lambeck, The Bahamas Archipelago spans the southeastern edge of
2012; Creveling et al., 2015; Dendy et al., 2017). Conse- the peripheral bulge of the ancient Laurentide ice complex,
quently, interpreting local sea-level markers first involves un- and hence this is a region that captures gradients in the GIA
derstanding and correcting for the ongoing effects of GIA. prediction. The majority of reconstructed MIS 5 sea-level es-
Numerical models generally estimate GIA with assumptions timates in the Bahamas use corals (Chen et al., 1991; Thomp-
about the thickness, distribution, extension, and duration of son et al., 2011; Skrivanek et al., 2018; Muhs et al., 2020).
former ice loads as well as the viscoelastic properties of Earth While these records demonstrate the potential of this area for
(Mitrovica and Milne, 2003; Austermann et al., 2017). The sea-level reconstruction, despite the data abundance, the pre-
speleothems from locations such as Majorca, Bermuda, the cision of the inferred water depth and also the open-system
Bahamas, and the Yucatán Peninsula provide an additional U-series behavior of some corals cast uncertainty on exist-
and independent source of sea-level data, which have the po- ing RSL estimates. Undoubtedly, the uncertainties behind
tential to provide valuable information about the deforma- GIA corrections and the models that investigators adopted
tion parameters of the Earth and about the distribution of past also lower the accuracy of the reconstructed sea level. In ad-
ice sheets. Their distance from large pre-existing ice sheets dition to the GIA corrections, the long-term subsidence of
and relatively stable passive margin tectonic setting is what the platform also needs to be considered when assessing the
makes them ideal locations. last interglacial sea-level record. Subsurface drill core data
The high-resolution POS-derived sea-level record from from shallow-water stacked facies indicate that the Bahamas
Majorca was corrected to estimate the ice-equivalent sea is subsiding at rates of several meters per 100 kyr (McNeill,
level by using nine different GIA models (Polyak et al., 2005). None of the Bahamian cave deposits reported so far
2018). The authors’ preferred model showed that in Ma- (Gascoyne et al., 1979; Gascoyne, 1984; Lundberg and Ford,
jorca sea level peaked early in the MIS 5e at 5 m a.p.s.l. due 1994; Richards et al., 1994; Smart et al., 1998) address these
to the proximity to the forebulge of the penultimate glacial corrections, but observations indicate the abundance of this
maximum (PGM) Eurasian Ice Sheet and then gradually de- type of sea-level indicator and its potential to provide addi-
creased and stabilized by 122 ka at 2.15 ± 0.75 m, until the tional data to help decipher the duration and amplitude of last
highstand termination at 116 ka. None of their models sup- interglacial sea level in this region.
port the hypothesis of a second highstand during MIS 5e, Moseley et al. (2013) used SVS growth periods to con-
and their results show no evidence for rapid sea-level fluc- strain maximum elevations of relative sea level, which are
tuations larger than 1 m. They also suggested that the cor- in agreement with GIA models for the near to intermediate
rected sea level is more sensitive to the size and distribu- region of the former North American Ice Sheet. Based on
tion of the Northern Hemisphere PGM ice sheets than to GIA modeling, Lambeck et al. (2012) classified the Yucatán
the one-dimensional Earth model used for other predictions. Peninsula as a near-field site in the western North Atlantic–
This record allowed the authors to test both the sensitivity Caribbean region located on the deformational bulge; thus,
of MIS 5e sea-level stand predicted by GIA models to PGM its MIS 5 sea-level indicators are affected by significant GIA
Earth Syst. Sci. Data, 13, 2077–2094, 2021 https://doi.org/10.5194/essd-13-2077-2021You can also read