INDONESIA CLIMATE RISK COUNTRY PROFILE - World Bank Climate Change Knowledge Portal
←
→
Page content transcription
If your browser does not render page correctly, please read the page content below

CLIMATE RISK COUNTRY PROFILE

       INDONESIA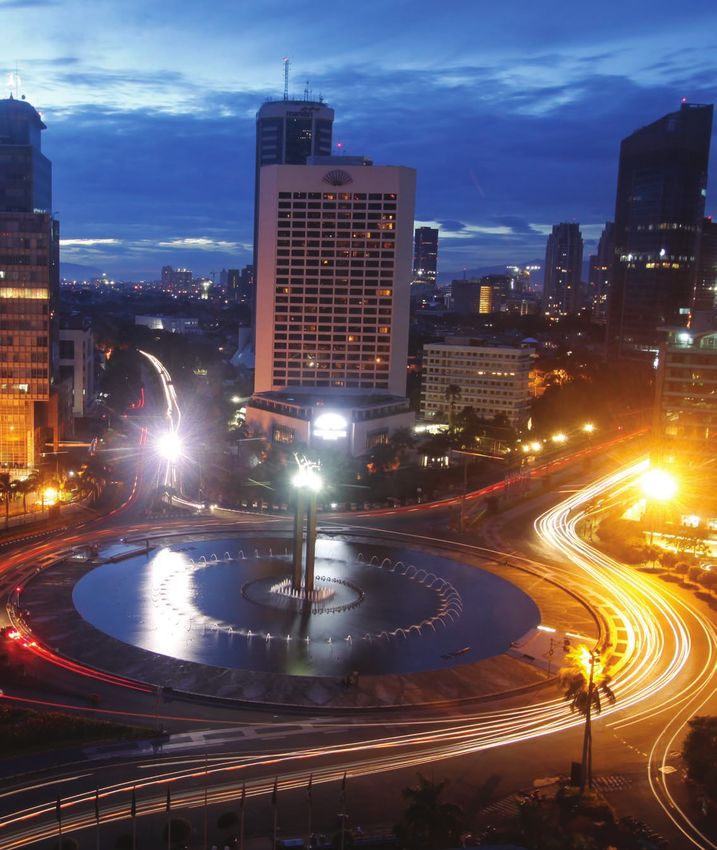
COPYRIGHT
© 2021 by the World Bank Group
1818 H Street NW, Washington, DC 20433
Telephone: 202-473-1000; Internet: www.worldbank.org

© 2021 Asian Development Bank
6 ADB Avenue, Mandaluyong City, 1550 Metro Manila, Philippines
Tel +63 2 8632 4444; Fax +63 2 8636 2444
www.adb.org

This work is a product of the staff of the World Bank Group (WBG) and the Asian Development Bank (ADB) and with external
contributions. The opinions, findings, interpretations, and conclusions expressed in this work are those of the authors’ and do not
necessarily reflect the views or the official policy or position of the WBG, its Board of Executive Directors, or the governments
it represents or of ADB, its Board of Governors, or the governments they represent.

The WBG and ADB do not guarantee the accuracy of the data included in this work and do not make any warranty, express or
implied, nor assume any liability or responsibility for any consequence of their use. This publication follows the WBG’s practice
in references to member designations, borders, and maps. ADB, however, recognizes “China” as the People’s Republic of China
and “Vietnam” as Viet Nam. The boundaries, colors, denominations, and other information shown on any map in this work,
or the use of the term “country” do not imply any judgment on the part of the WBG or ADB, their respective Boards, or the
governments they represent, concerning the legal status of any territory or geographic area or the endorsement or acceptance
of such boundaries.

The mention of any specific companies or products of manufacturers does not imply that they are endorsed or recommended
by either the WBG or ADB in preference to others of a similar nature that are not mentioned.

RIGHTS AND PERMISSIONS
The material in this work is subject to copyright. Because the WB and ADB encourage dissemination of their knowledge, this
work may be reproduced, in whole or in part, for noncommercial purposes as long as full attribution to this work is given. This
work is licensed under the Creative Commons Attribution-NonCommercial 3.0 IGO License. To view a copy of this license, visit
http://creativecommons.org/licenses/by-nc/3.0/igo/ or send a letter to Creative Commons, PO Box 1866, Mountain View,
CA 94042, USA.

This CC license does not apply to WBG or non-ADB copyright materials in this publication. If the material is attributed to another
source, please contact the copyright owner or publisher of that source for permission to reproduce it. WBG or ADB cannot be
held liable for any claims that arise as a result of your use of the material.

Please cite the work as follows: Climate Risk Profile: Indonesia (2021): The World Bank Group and Asian Development Bank.

Any queries on rights and licenses, including subsidiary rights, should be addressed to World Bank Publications, The World Bank
Group, 1818 H Street NW, Washington, DC 20433, USA; fax: 202-522-2625; e-mail: pubrights@worldbank.org.

Cover Photos: © Jerry Kurniawan/World Bank, “City and traffic lights at sunset in Jakarata” March 6, 2011 via Flickr, Creative
Commons CC BY-NC-ND 2.0. © Asian Development Bank, “Indonesia” July 20, 2012 via Flickr, Creative Commons CC BY-NC-
ND 2.0.

Graphic Design: Circle Graphics, Reisterstown, MD.

CLIMATE RISK COUNTRY PROFILE: INDONESIA                                                                                          ii
ACKNOWLEDGEMENTS
This profile is part of a series of Climate Risk Country Profiles that are jointly developed by the World Bank Group (WBG)
and the Asian Development Bank (ADB). These profiles synthesize the most relevant data and information on climate change,
disaster risk reduction, and adaptation actions and policies at the country level. The profile is designed as a quick reference
source for development practitioners to better integrate climate resilience in development planning and policy making. This
effort is co-led by Veronique Morin (Senior Climate Change Specialist, WBG), Ana E. Bucher (Senior Climate Change Specialist,
WBG) and Arghya Sinha Roy (Senior Climate Change Specialist, ADB).

This profile was written by Alex Chapman (Consultant, ADB), William Davies (Consultant, ADB), and Ciaran Downey (Consultant).
Technical review of the profiles was undertaken by Robert L. Wilby (Loughborough University). The draft was substantially
improved from inputs and comments from Mr. Bradley Hiller (Consultant, ADB). Additional support was provided by MacKenzie
Dove (Senior Climate Change Consultant, WBG), Jason Johnston (Operations Analyst, WBG), Yunziyi Lang (Climate Change
Analyst, WBG), Adele Casorla-Castillo (Consultant, ADB), and Charles Rodgers (Consultant, ADB). This Profile was also
reviewed by Indonesia’s Ministry for Natural Development Planning/BAPPENAS and Ministry of Environment and Forestry
(under the Directorate General for Climate Change). This profile also benefitted from inputs of WBG and ADB regional staff
and country teams.

Climate and climate-related information is largely drawn from the Climate Change Knowledge Portal (CCKP), a WBG online
platform with available global climate data and analysis based on the latest Intergovernmental Panel on Climate Change (IPCC)
reports and datasets. The team is grateful for all comments and suggestions received from the sector, regional, and country
development specialists, as well as climate research scientists and institutions for their advice and guidance on use of climate
related datasets.

CLIMATE RISK COUNTRY PROFILE: INDONESIA                                                                                      iii
CONTENTS

FOREWORD  .  .  .  .  .  .  .  .  .  .  .  .  .  .  .  .  .  .  .  .  .  .  .  .  .  .  .  .  .  .  .  .  .  .  .  . 1

KEY MESSAGES .   .   .   .   .   .   .   .   .   .   .   .   .   .   .   .   .   .   .   .   .   .   .   .   .   .   .   .   .   .   .   .   .   .  2

COUNTRY OVERVIEW .   .   .   .   .   .   .   .   .   .   .   .   .   .   .   .   .   .   .   .   .   .   .   .   .   .   .   .   .   .   .  2

CLIMATOLOGY  .   .   .   .   .   .   .   .   .   .   .   .   .   .   .   .   .   .   .   .   .   .   .   .   .   .   .   .   .   .   .   .   .   .                                                                                                         6
   Climate Baseline .  .  .  .  .  .  .  .  .  .  .  .  .  .  .  .  .  .  .  .  .  .  .  .  .  .  .  .  .  .  .  .  .  .  .  .  .  .  .  .                                                                                                                 6
      Overview  .  .  .  .  .  .  .  .  .  .  .  .  .  .  .  .  .  .  .  .  .  .  .  .  .  .  .  .  .  .  .  .  .  .  .  .  .  .  .  .  .  .                                                                                                               6
      Key Trends .  .  .  .  .  .  .  .  .  .  .  .  .  .  .  .  .  .  .  .  .  .  .  .  .  .  .  .  .  .  .  .  .  .  .  .  .  .  .  .  .                                                                                                                 7
   Climate Future .  .  .  .  .  .  .  .  .  .  .  .  .  .  .  .  .  .  .  .  .  .  .  .  .  .  .  .  .  .  .  .  .  .  .  .  .  .  .  .  .                                                                                                                8
      Overview  .  .  .  .  .  .  .  .  .  .  .  .  .  .  .  .  .  .  .  .  .  .  .  .  .  .  .  .  .  .  .  .  .  .  .  .  .  .  .  .  .  .                                                                                                               8

CLIMATE RELATED NATURAL HAZARDS .   .   .   .   .   .   .   .   .   .   .   .   .   .   .   .   .   .   .   .   .   . 12
       Heatwaves .  .  .  .  .  .         .     .     .     .     .     .     .     .     .     .     .     .     .     .     .     .     .     .     .     .     .     .     .     .     .     .     .     .     .     .     .     .     .     .     .    13
       Drought and Fire Risk  .           .     .     .     .     .     .     .     .     .     .     .     .     .     .     .     .     .     .     .     .     .     .     .     .     .     .     .     .     .     .     .     .     .     .     .    14
       Flood .  .  .  .  .  .  .  .  .     .     .     .     .     .     .     .     .     .     .     .     .     .     .     .     .     .     .     .     .     .     .     .     .     .     .     .     .     .     .     .     .     .     .     .   15
       Sea Level Rise .  .  .  .  .        .     .     .     .     .     .     .     .     .     .     .     .     .     .     .     .     .     .     .     .     .     .     .     .     .     .     .     .     .     .     .     .     .     .     .   16
       Cyclones .  .  .  .  .  .  .       .     .     .     .     .     .     .     .     .     .     .     .     .     .     .     .     .     .     .     .     .     .     .     .     .     .     .     .     .     .     .     .     .     .     .    18

CLIMATE CHANGE IMPACTS .   .   .   .   .   .   .   .   .   .   .   .   .   .   .   .   .   .   .   .   .   .   .   .   .   .   .   . 18
   Natural Resources  .  .  .  .  .  .  .  .  .  .  .  .  .  .  .  .  .  .  .  .  .  .  .  .  .  .  .  .  .  .  .  .  .  .  .  .  .  .  . 18
     Water .  .  .  .  .  .  .  .  .  .  .  .  .  .  .  .  .  .  .  .  .  .  .  .  .  .  .  .  .  .  .  .  .  .  .  .  .  .  .  .  .  .  . 18
     Fisheries and Coral  .  .  .  .  .  .  .  .  .  .  .  .  .  .  .  .  .  .  .  .  .  .  .  .  .  .  .  .  .  .  .  .  .  .  .  .  . 19
     Forests and Biodiversity .  .  .  .  .  .  .  .  .  .  .  .  .  .  .  .  .  .  .  .  .  .  .  .  .  .  .  .  .  .  .  .  .  .  . 20
   Economic Sectors  .  .  .  .  .  .  .  .  .  .  .  .  .  .  .  .  .  .  .  .  .  .  .  .  .  .  .  .  .  .  .  .  .  .  .  .  .  .  . 20
     Agriculture .  .  .  .  .  .  .  .  .  .  .  .  .  .  .  .  .  .  .  .  .  .  .  .  .  .  .  .  .  .  .  .  .  .  .  .  .  .  .  .  . 20
     Urban .  .  .  .  .  .  .  .  .  .  .  .  .  .  .  .  .  .  .  .  .  .  .  .  .  .  .  .  .  .  .  .  .  .  .  .  .  .  .  .  .  .  . 22
   Communities  .  .  .  .  .  .  .  .  .  .  .  .  .  .  .  .  .  .  .  .  .  .  .  .  .  .  .  .  .  .  .  .  .  .  .  .  .  .  .  .  . 24
     Poverty and Inequality .  .  .  .  .  .  .  .  .  .  .  .  .  .  .  .  .  .  .  .  .  .  .  .  .  .  .  .  .  .  .  .  .  .  . 24
     Gender  .  .  .  .  .  .  .  .  .  .  .  .  .  .  .  .  .  .  .  .  .  .  .  .  .  .  .  .  .  .  .  .  .  .  .  .  .  .  .  .  .  . 26
     Human Health .  .  .  .  .  .  .  .  .  .  .  .  .  .  .  .  .  .  .  .  .  .  .  .  .  .  .  .  .  .  .  .  .  .  .  .  .  .  .  . 27

POLICIES AND PROGRAMS  .   .   .   .   .   .   .   .   .   .   .   .   .   .   .   .   .   .   .   .   .   .   .   .   .   .   .   . 28
       National Adaptation Policies and Strategies .  .  .  .  .  .  .  .  .  .  .  .  .  .  .  .  .  .  .  .  .  .  .  .  .  . 28
       Climate Change Priorities of ADB and the WBG .  .  .  .  .  .  .  .  .  .  .  .  .  .  .  .  .  .  .  .  .  .  .  . 29

CLIMATE RISK COUNTRY PROFILE: INDONESIA                                                                                                                                                                                                                    iv
FOREWORD
Climate change is a major risk to good development outcomes, and the World Bank Group is committed to playing an important
role in helping countries integrate climate action into their core development agendas. The World Bank Group (WBG) and the
Asian Development Bank (ADB) are committed to supporting client countries to invest in and build a low-carbon, climate-
resilient future, helping them to be better prepared to adapt to current and future climate impacts.
Both institutions are investing in incorporating and systematically managing climate risks in development operations through
their individual corporate commitments.
For the World Bank Group: a key aspect of the World Bank Group’s Action Plan on Adaptation and Resilience (2019) is to help
countries shift from addressing adaptation as an incremental cost and isolated investment to systematically incorporating climate
risks and opportunities at every phase of policy planning, investment design, implementation and evaluation of development
outcomes. For all International Development Association and International Bank for Reconstruction and Development operations,
climate and disaster risk screening is one of the mandatory corporate climate commitments. This is supported by the World
Bank Group’s Climate and Disaster Risk Screening Tool which enables all Bank staff to assess short- and long-term climate
and disaster risks in operations and national or sectoral planning processes. This screening tool draws up-to-date and relevant
information from the World Bank’s Climate Change Knowledge Portal, a comprehensive online ‘one-stop shop’ for global,
regional, and country data related to climate change and development.
For the Asian Development Bank (ADB): its Strategy 2030 identified “tackling climate change, building climate and disaster
resilience, and enhancing environmental sustainability” as one of its seven operational priorities. Its Climate Change Operational
Framework 2017–2030 identified mainstreaming climate considerations into corporate strategies and policies, sector and
thematic operational plans, country programming, and project design, implementation, monitoring, and evaluation of climate
change considerations as the foremost institutional measure to deliver its commitments under Strategy 2030. ADB’s climate
risk management framework requires all projects to undergo climate risk screening at the concept stage and full climate risk
and adaptation assessments for projects with medium to high risk.
Recognizing the value of consistent, easy-to-use technical resources for our common client countries as well as to support
respective internal climate risk assessment and adaptation planning processes, the World Bank Group’s Climate Change Group
and ADB’s Sustainable Development and Climate Change Department have worked together to develop this content. Standardizing
and pooling expertise facilitates each institution in conducting initial assessments of climate risks and opportunities across sectors
within a country, within institutional portfolios across regions, and acts as a global resource for development practitioners.
For common client countries, these profiles are intended to serve as public goods to facilitate upstream country diagnostics,
policy dialogue, and strategic planning by providing comprehensive overviews of trends and projected changes in key climate
parameters, sector-specific implications, relevant policies and programs, adaptation priorities and opportunities for further actions.
We hope that this combined effort from our institutions will spur deepening of long-term risk management in our client countries
and support further cooperation at the operational level.
Bernice Van Bronkhorst Preety Bhandari
Global Director Chief of Climate Change and Disaster Risk Management Thematic Group
Climate Change Group concurrently Director Climate Change and Disaster Risk Management Division
The World Bank Group Sustainable Development and Climate Change Department
Asian Development Bank
CLIMATE RISK COUNTRY PROFILE: INDONESIA 1KEY MESSAGES
• Projections of temperature rise for Indonesia are hindered by the lack of fine resolution modelling. Most
projections suggest that overall warming could be less than the global average. Warming in the range of
0.8°C–1.4°C is expected by the 2050s in Indonesia. Projections should be approached with caution as higher
warming rates could be experienced inland.
• While precipitation projections suggest an increase in average annual rainfall, there is considerable variability
and uncertainty regarding spatial and temporal distribution. For example, western Indonesia is projected to
experience a significantly increased number of dry days by the second half of the 21st century, under the
RCP8.5 emissions pathway.
• Indonesia is ranked in the top-third of countries in terms of climate risk, with high exposure to all types of
flooding, and extreme heat. The intensity of these hazards is expected to grow as the climate changes. Without
effective adaptation, population exposure will also rise. For example, the population exposed to an extreme
river flood could grow by 1.4 million by 2035–2044.
• Indonesia is particularly vulnerable to sea-level rise, with the country ranked fifth highest in the world terms
of the size of the population inhabiting lower elevation coastal zones. Without adaptation, the total population
likely to be exposed to permanent flooding by the period 2070–2100 could reach over 4.2 million people.
• Rice production is particularly vulnerable to climate change as global changes in El Niño patterns are likely to
impact the onset and length of the wet season. Higher temperatures are also projected to reduce rice crop
yields. Alongside other impacts on agricultural production, Indonesia faces multiple threats to its food security.
• Climate change is also likely to have impacts on water availability, disaster risk management, urban development,
particularly in the coastal zones, and health and nutrition, with implications for poverty and inequality.
• While national-level vulnerability indexes, such as the ND-GAIN Country Index, suggest a reduction in overall
national-level climate vulnerability in Indonesia, there is high variation in the potential impacts of climate change
at the regional and local levels. Without well planned adaptation and disaster risk reduction efforts at these
levels, the poorest and most marginalized communities are likely to experience significant loss and damage as
a result of climate change impacts.
COUNTRY OVERVIEW
T
he Republic of Indonesia, herein Indonesia, is the world’s largest archipelagic state, consisting of
more than 17,500 islands with over 81,000 kilometres (km) of coastline, a population of 270.6 million
as of 2019 and the largest economy in Southeast Asia.1 The country’s islands are home to an
extremely varied geography, topography, and climate, ranging from sea and coastal systems to peat swamps
and montane forests.2
1
World Bank (2020). Indonesia – Overview. URL: https://www.worldbank.org/en/country/indonesia/overview
2
Naylor, R., Battisti, D., Vimont, D., Falcon, W., Burke, M. (2007). Assessing Risks of Climate Variability and Climate Change for
Indonesian Rice Agriculture. Proceedings of the National Academy of Sciences of the United States of America. 104. 7752–7.
URL: https://www.pnas.org/content/pnas/104/19/7752.full.pdf
CLIMATE RISK COUNTRY PROFILE: INDONESIA 2Indonesia is highly vulnerable to climate change impacts, including extreme events such as floods and droughts,
and long-term changes from sea level rise, shifts in rainfall patterns and increasing temperature. While rapid
economic growth has led to a reduction in poverty in recent decades, with the poverty rate halving from 24%
in 1999 to 9.78% in 2020,3 high population density in hazard prone areas, coupled with strong dependence on
the country’s natural resource base, make Indonesia vulnerable to the projected climate variability and climate
change (Table 1). These impacts of climate change will be felt across multiple sectors and regions. The Asian
Development Bank (ADB) estimates that by 2100, the impacts of climate change could cost between 2.5–7% of
the country’s gross domestic product (GDP), with the poorest bearing the brunt of this burden.4
TABLE 1. Key indicators
Indicator Value Source
Population Undernourished 5 9.0% (2017–2019) FAO, 2020
National Poverty Rate 6 9.8% (2018) World Bank, 2019
Share of Income Held by Bottom 20%7 6.9% (2018) World Bank, 2019
Net Annual Migration Rate 8 −0.04% (2015–2020) UNDESA, 2019
Infant Mortality Rate (Between Age 0 and 1) 9 1.9% (2015–2020) UNDESA, 2019
Average Annual Change in Urban Population 10 2.27% (2015–2020) UNDESA, 2018
Dependents per 100 Independent Adults 11 47.5 (2020) UNDESA, 2019
Urban Population as % of Total Population12 56.6% (2020) CIA, 2020
External Debt Ratio to GNI 13 37.6% (2018) ADB, 2020
Government Expenditure Ratio to GDP 14 16.3% (2019) ADB, 2020
3
World Bank (2020). Indonesia – Overview. URL: https://www.worldbank.org/en/country/indonesia/overview
4
Orecchia, C., Raitzer, D., Bosello, F., Tavoni, M., Marangoni, G., Nuella, J. (2016). Southeast Asia and the Economics of Global Climate
Stabilization. Asian Development Bank. URL: https://www.adb.org/sites/default/files/publication/178615/sea-economics-global-
climate-stabilization.pdf
5
FAO, IFAD, UNICEF, WFP, WHO (2020). The state of food security and nutrition in the world. Transforming food systems for
affordable healthy diets. FAO. Rome. URL: http://www.fao.org/documents/card/en/c/ca9692en/
6
World Bank (2019). Poverty headcount ratio at national poverty lines (% of population). URL: https://data.worldbank.org/ [accessed
17/12/20]
7
World Bank (2019). Income share held by lowest 20%. URL: https://data.worldbank.org/ [accessed 17/12/20]
8
UNDESA (2019). World Population Prospects 2019: MIGR/1. URL: https://population.un.org/wpp/Download/Standard/Population/
[accessed 17/12/20]
9
UNDESA (2019). World Population Prospects 2019: MORT/1-1. URL: https://population.un.org/wpp/Download/Standard/Population/
[accessed 17/12/20]
10
UNDESA (2019). World Urbanization Prospects 2018: File 6. URL: https://population.un.org/wup/Download/ [accessed 17/12/20]
11
UNDESA (2019). World Population Prospects 2019: POP/11-A. URL: https://population.un.org/wpp/Download/Standard/Population/
[accessed 17/12/20]
12
CIA (2020). The World Factbook. Central Intelligence Agency. Washington DC. URL: https://www.cia.gov/the-world-factbook/
13
ADB (2020). Key Indicators for Asia and the Pacific 2020. Asian Development Bank. URL: https://www.adb.org/sites/default/files/
publication/443671/ki2018.pdf
14
ADB (2020). Key Indicators for Asia and the Pacific 2020. Asian Development Bank. URL: https://www.adb.org/sites/default/files/
publication/443671/ki2018.pdf
CLIMATE RISK COUNTRY PROFILE: INDONESIA 3Due to a combination of political, geographic,
and social factors, Indonesia is recognized as FIGURE 1. The ND-GAIN Index score (out of
vulnerable to climate change impacts, ranked 97nd 100) summarizes a country’s vulnerability to
out of 181 countries in the 2020 ND-GAIN Country climate change and other global challenges
Index. 15 The ND-GAIN Country Index ranks in combination with its readiness to improve
181 countries using a composite score which resilience. It aims to help businesses and the
is calculated based on a country’s vulnerability public sector better prioritize investments for
to climate change and other global challenges a more efficient response to the immediate
(vulnerability index) as well as their readiness to global challenges ahead.
52.5
improve resilience (readiness index). The more 52.5
vulnerable a country is the lower their overall 50
50
country index score, while the more ready a country
is to improve its resilience the higher it will be. 47.5
47.5
Norway has the highest score and is ranked 1st.
Score
45
45
Figure 1 is a time-series plot of the ND-GAIN
Index showing Indonesia’s progress in reducing its 42.5
42.5
overall vulnerability and increasing its readiness to
40
40
climate change in over the past two decades.
37.5
37.5
1995 1997 1999 2001 2003 2005 2007 2009 2011 2013
1995 1997 1999 2001 2003 2005 2007 2009 2011 2013
A significant proportion of the county’s greenhouse
Indonesia
gas (GHG) emissions stem from land use change,
particularly conversion of peatlands into agricultural
plantations as well as from the country’s energy
sector.16 Emissions from land use and land use changes represented 52.3% of total GHG emissions in Indonesia
between 2000 to 2017,17 significantly contributing to the country’s position as a top emitter of GHG emissions.
Emissions from energy constitute approximately one-quarter of the country’s emissions, and are growing.18
The Government of Indonesia is committed to reducing the country’s GHG emissions. Through Presidential
Regulation No. 61/2011, concerning the National Action Plan for Greenhouse Gas Emission Reduction (RAN-GRK),
Indonesia set an emission reduction target of 26%, compared to business-as-usual, with domestic efforts, or up
to 41% with international support under the reference emission level, by 2020. Post-2020 emission reduction
targets have been set at 29% of the reference emission level by 2030, with an unconditional target and up to
41% with international support (conditional target). In support of these efforts, the Indonesian Government has
promulgated relevant legal and policy instruments, including the national action plan on GHG emissions reduction
as stipulated in Presidential Regulation (PERPRES) No. 61/2011 and GHG inventory through Presidential
15
University of Notre Dame (2020). Notre Dame Global Adaptation Initiative. URL: https://gain.nd.edu/our-work/country-index/
16
Republic of Indonesia (2017). Third National Communication to the UNFCCC. URL: https://unfccc.int/sites/default/files/
resource/8360571_Indonesia-NC3-2-Third%20National%20Communication%20-%20Indonesia%20-%20editorial%20refinement%20
13022018.pdf
17
Kementerian PPN/Bappenas (2019). Low Carbon Development: A Paradigm Shift Towards a Green Economy in Indonesia.
URL: https://www.wavespartnership.org/sites/waves/files/kc/09_LCDI_2019.pdf
18
Dunne, Daisy (2019). The Carbon Brief Profile: Indonesia. Carbon Brief. URL: https://www.carbonbrief.org/the-carbon-brief-profile-
indonesia
CLIMATE RISK COUNTRY PROFILE: INDONESIA 4Regulation (PERPRES) No. 71/2011.19 Land use, land-use change and forestry (LULUCF) and energy measures
will play a major role in Indonesia’s climate change mitigation strategies to achieve emission reduction targets.
For climate change adaptation, the country’s medium-term strategy is to reduce risks from climate change on all
development sectors — agriculture, water, energy security, forestry, maritime and fisheries, health, public service,
infrastructure, and urban system by 2030.20
Indonesia’s first national strategy on climate change was developed by the Ministry of Environment in 2007.
Indonesia ratified the Paris Agreement on October 31, 2016 and established its commitment through its
Nationally-Determined Contribution (2016). Indonesia completed its Third National Communication (NC3) in
2017 and its Second Biennial Update Report (2018).
Green, Inclusive and Resilient Recovery
The coronavirus disease (COVID-19) pandemic has led to unprecedented adverse social and economic impacts.
Further, the pandemic has demonstrated the compounding impacts of adding yet another shock on top of
the multiple challenges that vulnerable populations already face in day-to-day life, with the potential to create
devastating health, social, economic and environmental crises that can leave a deep, long-lasting mark. However,
as governments take urgent action and lay the foundations for their financial, economic, and social recovery, they
have a unique opportunity to create economies that are more sustainable, inclusive and resilient. Short and long-
term recovery efforts should prioritize investments that boost jobs and economic activity; have positive impacts on
human, social and natural capital; protect biodiversity and ecosystems services; boost resilience; and advance the
decarbonization of economies.
This document aims to succinctly summarize the climate risks faced by Indonesia. This includes rapid onset and
long- term changes in key climate parameters, as well as impacts of these changes on communities, livelihoods and
economies, many of which are already underway. This is a high-level synthesis of existing research and analyses,
focusing on the geographic domain of Indonesia, therefore potentially excluding some international influences
and localized impacts. The core data presented is sourced from the database sitting behind the World Bank
Group’s Climate Change Knowledge Portal (CCKP), incorporating climate projections from the Coupled Model
Inter-comparison Project Phase 5 (CMIP5). This document is primarily meant for WBG and ADB staff to inform
their climate actions. The document also aims and to direct the reader to many useful sources of secondary data
and research.
19
Republic of Indonesia (2017). Third National Communication to the UNFCCC. URL: https://unfccc.int/sites/default/files/
resource/8360571_Indonesia-NC3-2-Third%20National%20Communication%20-%20Indonesia%20-%20editorial%20refinement%
2013022018.pdf
20
Ministry of Environment and Forestry (2017). Indonesia Second Biennial Update Report (BUR) Under the United Nations Framework
Convention on Climate Change. URL: https://unfccc.int/sites/default/files/resource/Indonesia-2nd_BUR.pdf
CLIMATE RISK COUNTRY PROFILE: INDONESIA 5CLIMATOLOGY
Climate Baseline
Overview
Indonesia’s climate is tropical, with the highest rainfall occurring in its low-lying areas. The mountainous regions
experience cooler temperatures. The wet season occurs between November and April, leaving May through October
typically dry. There is little season-by-season variation in temperature and relatively little variation by elevation
(averaging 23°C in the mountainous areas and 28°C in the coastal areas). There is more variability in precipitation
by elevation: the average annual rainfall in the lowlands around 1,800 millimeters (mm) to 3,200 mm compared with
the mountainous regions, where it can reach up to 6,000 mm.21 The climate of Indonesia is primarily influenced by
the El Niño Southern Oscillation (ENSO), where drier conditions are experienced during El Niño events and wetter
conditions during La Nina events.22
Average monthly temperatures in Indonesia remain constant throughout the year, at approximately 25°C–26°C. In
contrast, there is considerable variation in average monthly rainfall, as shown in Figure 2, which presents the latest
climatology, 1991–2020. The lowest rainfall is found during the dry season, June to September, when average
monthly rainfall in June and July is around 160 mm-180 mm. The months with the highest rainfall, associated
with monsoons, occur between October to May. On average there is 300 mm of rainfall during the May and
November months, approximately twice that of the driest months. Figure 3 shows the spatial variation of observed
temperature and rainfall in Indonesia.
Annual Cycle
FIGURE 2. Average monthly temperature and rainfall in Indonesia (1991–2020)23
26.5ºC 360 mm
26.25ºC 240 mm
Temperature
Rainfall
26ºC 120 mm
25.75ºC 0 mm
Jan Feb Mar Apr May Jun Jul Aug Sep Oct Nov Dec
Rainfall Temperature
21
USAID (2015). Climate Risk Profile: Indonesia Fact Sheet. URL: https://www.climatelinks.org/resources/climate-risk-profile-
indonesia [accessed 20/12/2018].
22
Polade, Suraj & W Pierce, David & Cayan, Daniel & Gershunov, Alexander & Dettinger, Michael (2014). The key role of dry days in
changing regional climate and precipitation regimes. Scientific reports. 4. 4364. 10.1038/srep04364. URL: https://www.nature.
com/articles/srep04364.pdf
23
WBG Climate Change Knowledge Portal (CCKP, 2021). Indonesia URL: https://climateknowledgeportal.worldbank.org/country/
indonesia/climate-data-historical.
CLIMATE RISK COUNTRY PROFILE: INDONESIA 6Spatial Variation
FIGURE 3. (Left) Annual mean temperature(°C), and (right) annual mean rainfall (mm) in
Indonesia over the period 1991–202024
Key Trends
Temperature
Estimates from the Berkeley Earth dataset suggest Indonesia’s mean annual temperature was typically around
0.8°C above the 1951–1980 baseline in the period 2010–2017. Since 1960, hot days and nights have increased
by 88 days and 95 nights per annum, respectively, especially during the summer months of July–September.21
However, observational climate data generally relates to Sumatra and Borneo, with limited data availability for the
country’s archipelago.25
Precipitation
Studies point to an overall decrease in average annual A Precautionary Approach
precipitation.26 Precipitation trends vary across the
country. One study for Kalimantan, Jawa, Sumatra Studies published since the last iteration of
and Papua observed increased rainfall between 1998 the IPCC’s report (AR5), such as Gasser
and 2010, whereas along the western and southern et al. (2018), have presented evidence which
coast of Sumatra, eastern Jawa, southern Sulawesi, suggests a greater probability that earth will
the Maluku Islands, western Papua, and Bali Island saw experience medium and high-end warming
a decrease in rainfall.27 Whilst this study highlights scenarios than previously estimated.28 Climate
differences across the country, the short time period change projections associated with the highest
means it is not possible to infer reliable trend estimates. emissions pathway (RCP8.5) are presented
USAID’s climate risk profile for Indonesia describes a here to facilitate decision making which is
decreased average annual precipitation of 3% during robust to these risks.
1901–2013, but a 12% increase between 1985 and
24
WBG Climate Change Knowledge Portal (CCKP, 2021). Indonesia URL: https://climateknowledgeportal.worldbank.org/country/
indonesia/climate-data-historical.
25
UK Met Office et al. (2011). Climate: observations, projections and impacts. University of Nottingham. URL: http://eprints.
nottingham.ac.uk/2040/13/Indonesia.pdf.
26
Aldrian, E. (2007). Decreasing trends in annual rainfalls over Indonesia: A threat for the national water resource? Geophysics and
Meteorology Agency, Jakarta, Indonesia. URL: https://www.researchgate.net/publication/284944836_Decreasing_trends_in_
annual_rainfalls_over_Indonesia_A_threat_for_the_national_water_resource.
27
As-Saykur, A., Tanaka, T., Osawa, T., Mahendra, M. (2013). Indonesian rainfall variability observation using TRMM multi-satellite
data. International Journal of Remote Sensing. 34(21). DOI: https://doi.org/10.1080/01431161.2013.826837
28
Gasser, T., Kechiar, M., Ciais, P., Burke, E. J., Kleinen, T., Zhu, D., . . . Obersteiner, M. (2018). Path-dependent reductions in CO2
emission budgets caused by permafrost carbon release. Nature Geoscience, 11, 830–835. URL: https://www.nature.com/articles/
s41561-018-0227-0?WT.feed_name=subjects_climate-sciences
CLIMATE RISK COUNTRY PROFILE: INDONESIA 72015. The greatest decreases in rainfall have occurred during the dry season, while the greatest increases in
rainfall have occurred in the north of the country.21
Climate Future
Overview
The main data source for the World Bank Group’s Climate Change Knowledge Portal is the Coupled Model Inter-
comparison Project Phase 5 (CMIP5) models, which are utilized within the Fifth Assessment Report (AR5) of the
Intergovernmental Panel on Climate Change (IPCC), providing estimates of future temperature and precipitation.
Four Representative Concentration Pathways (i.e. RCP2.6, RCP4.5, RCP6.0, and RCP8.5) were selected and
defined by their total radiative forcing (cumulative measure of GHG emissions from all sources) pathway and level
by 2100. In this analysis RCP2.6 and RCP8.5, the extremes of low and high emissions pathways, are the primary
focus; RCP2.6 represents a very strong mitigation scenario, whereas RCP8.5 assumes business-as-usual scenario.
For more information, please refer to the RCP Database.
For Indonesia, these models show a consistent warming trend for all emissions scenarios. However, the projections
in rainfall are less certain and vary by both RCP scenarios as well as models. Projected precipitation trends do
show a likely increase in rainfall for western and southern areas and a reduction in rainfall for the southern islands;
an increase in intensity for extreme rainfall events. Tables 2 and 3 below, provide information on temperature
projections and anomalies for the four RCPs over two distinct time horizons; presented against the reference period
of 1986–2005.
TABLE 2. Projected anomaly (changes °C) for maximum, minimum, and average daily temperatures in
Indonesia for 2040–2059 and 2080–2099, from the reference period of 1986–2005 for all RCPs. The
table is showing the median of the CCKP model ensemble and the 10th–90th percentiles in brackets29
Average Daily Maximum Average Daily Minimum
Temperature Average Daily Temperature Temperature
Scenario 2040–2059 2080–2099 2040–2059 2080–2099 2040–2059 2080–2099
RCP2.6 0.9 0.9 0.9 0.9 0.9 0.9
(0.2, 1.5) (0.2, 1.8) (0.4, 1.5) (0.3, 1.6) (0.4, 1.5) (0.3, 1.5)
RCP4.5 1.2 1.6 1.2 1.6 1.2 1.7
(0.5, 2.0) (0.8, 2.6) (0.7, 1.8) (1.0, 2.5) (0.7, 1.8) (1.1, 2.5)
RCP6.0 1.0 2.0 1.1 2.0 1.1 2.0
(0.3, 1.9) (1.2, 3.0) (0.6, 1.7) (1.4, 2.9) (0.6, 1.7) (1.4, 3.0)
RCP8.5 1.6 3.4 1.6 3.4 1.6 3.4
(0.8, 2.5) (2.4, 4.9) (1.1, 2.3) (2.6, 4.6) (1.1, 2.3) (2.6, 4.6)
29
WBG Climate Change Knowledge Portal (CCKP, 2021). Indonesia Climate Data: Projection. URL: https://climateknowledgeportal.
worldbank.org/country/indonesia/climate-data-projections
CLIMATE RISK COUNTRY PROFILE: INDONESIA 8TABLE 3. Projections of average temperature anomaly (°C) in Indonesia for different seasons
(3-monthly time slices) over different time horizons and emissions pathways, showing the median
estimates of the full CCKP model ensemble and the 10th and 90th percentiles in brackets.29
2040–2059 2080–2099
Scenario Jun–Aug Dec–Feb Jun–Aug Dec–Feb
RCP2.6 0.9 0.9 0.9 0.8
(0.3, 1.6) (0.4, 1.4) (0.3, 1.6) (0.3, 1.5)
RCP4.5 1.2 1.2 1.7 1.6
(0.6, 1.8) (0.6, 1.7) (1.0, 2.4) (1.0, 2.4)
RCP6.0 1.1 1.0 2.1 1.9
(0.5, 1.6) (0.5, 1.6) (1.3, 2.8) (1.3, 2.8)
RCP8.5 1.7 1.6 3.5 3.3
(1.0, 2.3) (1.0, 2.2) (2.6, 4.6) (2.5, 4.4)
Model Ensemble
Climate projections presented in this document FIGURE 4. ‘Projected average temperature
are derived from datasets available through the anomaly’ and ‘projected annual rainfall
CCKP, unless otherwise stated. These datasets anomaly’ in Indonesia. Outputs of 16 models
are processed outputs of simulations performed within the ensemble simulating RCP8.5
by multiple General Circulation Models (GCM) over the period 2080–2099. Models shown
(for further information see Flato et al., 2013).30 represent the subset of models within the
Collectively, these different GCM simulations ensemble that provide projections across
are referred to as the ‘model ensemble’. Due to all RCPs and therefore are most robust for
the differences in the way GCMs represent the comparison.29 Three models are labelled.
key physical processes and interactions within 5
4.5
the climate system, projections of future climate
Average temperature anomaly ( °C)
ipsl_cm5a_mr
4
conditions can vary widely between different GCMs, 3.5
csiro_mk3_6_0
this is particularly the case for rainfall related 3
variables and at national and local scales. The range 2.5 giss_e2_h
2
of projections from 16 GCMs for annual average
1.5 Median,
temperature change and annual precipitation 1 10th and 90th
Percentiles
change in Indonesia under RCP8.5 is shown in 0.5
Figure 4. Spatial representation of future projections 0
–30% –20% –10% 0% 10% 20% 30% 40%
of annual temperature and precipitation for mid Average annual precipitation anomaly (%)
and late century under RCP8.5 are presented in
Figure 5.
30
Flato, G., Marotzke, J., Abiodun, B., Braconnot, P., Chou, S. C., Collins, W., . . . Rummukainen, M. (2013). Evaluation of Climate
Models. Climate Change 2013: The Physical Science Basis. Contribution of Working Group I to the Fifth Assessment Report of the
Intergovernmental Panel on Climate Change, 741–866. URL: http://www.climatechange2013.org/images/report/WG1AR5_ALL_
FINAL.pdf
CLIMATE RISK COUNTRY PROFILE: INDONESIA 9Spatial Variation
FIGURE 5. CMIP5 ensemble projected change (32 GCMs) in annual temperature (bottom) and
precipitation (top) by 2040–2059 (left) and by 2080–2090 (right) relative to 1986–2005 baseline
under RCP8.531
Temperature Changes
Projections of future temperature change are presented in three primary formats. Shown in Table 2 are the
changes (anomalies) in daily maximum and daily minimum temperatures over the given time period, as well as
changes in the average temperature. Figures 6 and 7 display the annual and monthly average temperature
projections. While similar, these three indicators can provide slightly different information. Monthly/annual average
temperatures are most commonly used for general estimation of climate change, but the daily maximum and
minimum can explain more about how daily life might change in a region, affecting key variables such as the viability
of ecosystems, health impacts, productivity of labor, and the yield of crops, which are often disproportionately
influenced by temperature extremes.
Projections for annual average temperature rise for Indonesia from the CCKP model ensemble are less than the
global average: 3.4°C compared to 3.7°C under the RCP8.5 emissions pathway by the 2080s through the end of
the century. Under the same pathway and time-period, the annual averages of maximum and minimum temperatures
are projected to increase at a similar rate average temperature 3.4°C. Warming projections suggest a rise of
ambient temperatures from approximately 26.5°C towards 29°C–30°C, significantly increasing the frequency of
days with temperatures >30°C. However, all these projections are distorted by the inability of current global climate
models to distinguish between ocean and land cover over Indonesia’s smaller islands. The KNMI Climate Explorer,
which can interpolate to finer spatial scales, suggests that significantly higher rates of warming may be experienced
in Indonesia’s inland regions.32 For example, warming by the end of the century under RCP8.5 approaches 4°C
over central regions of Kalimantan and Sumatra. As such, adaptation planning should take account of potential
31
WBG Climate Change Knowledge Portal (CCKP 2021). Indonesia. Climate Data. Projections. URL: https://climatedata.worldbank.
org/CRMePortal/web/agriculture/crops-and-land-management?country=IDN&period=2080-2099
32
KNMI (2019). Climate Explorer: CMIP5 projections. URL: https://climexp.knmi.nl/start.cgi
CLIMATE RISK COUNTRY PROFILE: INDONESIA 10FIGURE 6. Historic and projected average FIGURE 7. Projected change (anomaly) in
annual temperature in Indonesia under two monthly temperature, shown by month,
emissions pathways estimated by the model for Indonesia for the period 2080–2099
ensemble. Shading represents the standard under RCP8.5. The value shown represents
deviation of the model ensemble. Red depicts the median of the model ensemble
RCP8.5 and Blue depicts RCP2.6. The solid with the shaded areas showing the
line represents the median of the model 10th–90th percentile.33
ensemble with the shaded areas showing the 5.5
10th–90th percentile.33 5.0
30.5
4.5
30.0
degreesC
4.0
29.5
29.0 3.5
28.5
3.0
degC
28.0
27.5 2.5
27.0
2.0
26.5 Jan Feb Mar Apr May Jun Jul Aug Sep Oct Nov Dec
26.0
25.5
1980 2000 2020 2040 2060 2080 2100
Year
Historical RCP 2.6 RCP 4.5 RCP 6.0 RCP 8.5
temperatures rises higher than those shown in Tables 2 and 3. As Table 3 and Figure 7 show, there is very little
seasonal variation in temperature changes projected by the CMIP5 ensemble of models under any emissions
pathway and over any time period.
Precipitation Changes FIGURE 8. Boxplots showing the projected
Projections of future rainfall are more uncertain average annual precipitation for Indonesia in
than temperature. The CCKP model ensemble the period 2080–2099.33
suggests increases in median annual rainfall 5000
under all emissions pathways. However, there is 4500
large uncertainty in this estimate (as seen in the 4000
interquartile range shown in Figure 8). This shows 3500
mm
a slight increase in precipitation levels under all
3000
emissions pathways by the 2080s and 2090s. For
2500
example, median annual precipitation is projected
2000
to increase by 7% under RCP6.0 pathway and
1500
11% under RCP8.5 pathway, from the historical Historical RCP 2.6 RCP 4.5 RCP 6.0 RCP 8.5
baseline median of 2,884 mm.
33
WBG Climate Change Knowledge Portal (CCKP, 2021). Indonesia. Interactive Dashboard. URL: https://climatedata.worldbank.org/
CRMePortal/web/energy/oil-gas-and-coal-mining?country=IDN&period=2080-2099
CLIMATE RISK COUNTRY PROFILE: INDONESIA 11While considerable uncertainty clouds projections of local future precipitation changes, some global trends are
still evident. The intensity of sub-daily extreme rainfall events appears to be increasing with temperature, a finding
supported by evidence from different regions of Asia.34 However, this phenomenon is highly dependent on local
geographical contexts and more research focusing on Indonesia is required to understand impacts to the country.
Downscaling studies for Indonesia suggest considerable variability and uncertainty regarding spatial and temporal
distribution. For example, one study points to western Indonesia experiencing a significantly increased number of
dry days by the 2060s through end of the century, under RCP8.5 emissions pathway.35 Another study finds rainfall
trajectories in the 2060s in Lombok and Sumbawa islands to be uncertain between December and February;
decreasing up to 10% between March and May; with little change for other seasons.36
CLIMATE RELATED NATURAL HAZARDS
I
ndonesia is ranked in the top-third of countries in terms of natural hazard risk (59th out of 191) by the 2019
INFORM Risk Index37 (Table 4). In particular, Indonesia has high exposure to flooding, (ranked 17th most at risk
from this natural hazard). Indonesia is similarly highly exposed to tropical cyclones (ranked the 23rd). Despite
this high exposure to natural hazards, Indonesia ranks moderately in terms of its coping capacity and vulnerability,
where it is ranked in the top half (104th and 81st respectively). The section that follows analyses climate change
influences on the exposure component of risk in Indonesia. As seen in Figure 1, the ND-GAIN Country Index
presents an overall picture of a country’s climate vulnerability and capacity to improve its resilience. In addition, the
INFORM Risk Index identifies specific risks across a country to support decisions on prevention, preparedness,
response and a country’s overall risk management.
TABLE 4. Selected indicators from the INFORM 2019 Index for Risk Management for Indonesia.
For the sub-categories of risk (e.g. “Flood”) higher scores represent greater risks. Conversely the
most at-risk country is ranked 1st. Global average scores are shown in brackets.
Lack of Overall
Tropical Coping Inform
Cyclone Drought Vulnerability Capacity Risk Level
Flood (0–10) (0–10) (0–10) (0–10) (0–10) (0–10) Rank (1–191)
8.1 [4.5] 6.1 [1.7] 3.4 [3.2] 3.2 [3.6] 4.5 [4.5] 4.7 [3.8] 59
34
Westra, S., Fowler, H. J., Evans, J. P., Alexander, L. V., Berg, P., Johnson, F., Kendon, E. J., Lenderink, G., Roberts, N. (2014). Future
changes to the intensity and frequency of short-duration extreme rainfall. Reviews of Geophysics, 52, 522–555. URL: https://
agupubs.onlinelibrary.wiley.com/doi/epdf/10.1002/2014RG000464
35
Polade, S., Pierce, D., Cayan, D., Gershunov, A., Dettinger, M. (2014). The key role of dry days in changing regional climate and
precipitation regimes. Scientific reports. 4. 4364. 10.1038/srep04364. URL: https://www.nature.com/articles/srep04364.pdf
36
McGregor, J.L., Nguyen, K.C., Kirono, D.G. and Katzfey, J.J. (2016). High-resolution climate projections for the islands of Lombok and
Sumbawa, Nusa Tenggara Barat Province, Indonesia: Challenges and implications. Climate Risk Management, 12, 32–44.
URL: https://www.sciencedirect.com/science/article/pii/S2212096315000340
37
European Commission (2019). INFORM Index for Risk Management. Indonesia Country Profile. URL: https://drmkc.jrc.ec.europa.eu/
inform-index/Countries/Country-Profile-Map
CLIMATE RISK COUNTRY PROFILE: INDONESIA 12Heatwaves
Indonesia regularly experiences high maximum temperatures, with an average monthly maximum of around 30.6°C.
Indonesia has a very stable temperature regime, with the hottest month, October, experiencing a maximum
temperature of 31.1°C. The current median probability of a heat wave (defined as a period of 3 or more days where
the daily temperature is above the long-term 95th percentile of daily mean temperature) is around 2%.
Indonesia is positioned as one of the most vulnerable countries to extreme heatwaves according to climate model
projections.38,39 Under all emissions pathways, the likelihood of experiencing conditions that would historically
(as based against the baseline period: 1986–2005) class as a heatwave increases dramatically by the 2080s
through the end of the century: approximately 71% under the RCP6.0 pathway and 96% under the RCP8.5
pathway. In their study introducing a new Heat Wave Magnitude Index, Russo et al. (2014) suggest Indonesia
might experience an extreme heatwave as often as once every two years by the end of the 21st century under the
RCP8.5 emissions pathways.40 However, as these indices are in part a reflection of Indonesia’s historically stable
baseline climate, and the continual rise in temperatures away from these conditions, extreme heat should also be
explored through other indicators.
Heat Index is another measure of climate condition,
which better captures the effective temperature FIGURE 9. Boxplots showing historical
experienced by the human body by factoring in (1986–2005) and projected (2080–2099)
relative humidity. A Heat Index of 35°C is often annual number of days with Heat Index > 35°C
highlighted as a threshold beyond which conditions under four emissions pathways.33
become extremely dangerous for human health. 400
Figure 9 shows projections of the number of days 350
with Heat Index >35°C. Under RCP8.5, Indonesia 300
experiences extremely dangerous conditions almost 250
days
200
every day of the year.
150
100
An additional factor for consideration is the potential
50
for marine heatwaves. Research has identified
0
the Western Tropical Pacific and Indonesia seas Historical RCP 2.6 RCP 4.5 RCP 6.0 RCP 8.5
as global hotspots for climate change impacts on
marine heatwaves. Marine heatwaves are projected
to extend their spatial footprint and to grow in duration and intensity.41 Even under lower emissions pathways
(RCP4.5) increases in heatwave duration and intensity are likely to exceed anything experienced by marine ecology
38
Mora, C., Dousset, B., Caldwell, I.R., Powell, F.E., Geronimo, R.C., Bielecki, C.R., Counsell, C.W., Dietrich, B.S., Johnston, E.T., Louis, L.V.
and Lucas, M.P. (2017). Global risk of deadly heat. Nature Climate Change, 7, 501–507. URL: https://tools.niehs.nih.gov/cchhl/
index.cfm/main/detail?reference_id=15041
39
Matthews, T., Wilby, R.L. and Murphy, C. (2017). Communicating the deadly consequences of global warming for human heat
stress. Proceedings of the National Academy of Sciences, 114, 3861–3866. URL: https://www.pnas.org/content/pnas/114/15/
3861.full.pdf
40
Russo, S., Dosio, A., Graversen, R., Sillmann, J., Carrao, H., Dunbar, M., Singleton, A., Montagna, P., Barbosa, P., Vogt, J., (2014).
Magnitude of extreme heat waves in present climate and their projection in a warming world. Journal of Geophysical Research
Atmospheres. 19. 12500–12512. URL: https://agupubs.onlinelibrary.wiley.com/doi/epdf/10.1002/2014JD022098
41
Frölicher, T. L., Fischer, E. M., & Gruber, N. (2018). Marine heatwaves under global warming. Nature, 560(7718), 360–364.
URL: https://www.ncbi.nlm.nih.gov/pubmed/30111788
CLIMATE RISK COUNTRY PROFILE: INDONESIA 13within the recent historical record.42 The consequences of this trend may be serious for marine ecosystems in the
region (and for dependent livelihoods), which are adapted very stable temperature regimes.
Drought and Fire Risk
Two primary types of drought may affect Indonesia, meteorological (usually associated with a precipitation deficit)
and hydrological (usually associated with a deficit in surface and subsurface water flow, potentially originating in
the region’s wider river basins). At present, Indonesia faces an annual median probability of severe meteorological
drought of around 4%, as defined by a Standardized Precipitation Evaporation Index (SPEI) of less than −2.
Naumann et al. (2018) provide a global overview of
changes in drought conditions under different warming FIGURE 10. Annual probability of experiencing
scenarios.43 In comparison to West and Central Asia, a ‘severe drought’ in Indonesia (−2 SPEI index)
South East Asia is less likely to experience extreme in 2080–2099 under four emissions
increases in drought intensity. As Figure 10 shows, pathways.33
changes in the annual probability of experiencing a 2.0
year with a severe drought by the 2090s roughly
1.5
doubles from 4% to 9% under RCP2.6 and RCP8.5
1.0
emissions pathways, respectively. At a national scale,
unitless
there exists few studies on climate change impacts 0.5
on water stress and drought in Indonesia.25 However, 0
droughts are expected to increase in frequency
–0.5
and intensity given the association of accentuated
drought with El Niño events, which are expected to –1.0
Historical RCP 2.6 RCP 4.5 RCP 6.0 RCP 8.5
increase in frequency and intensity through warmer
global temperatures.44,45
Droughts are strongly associated with El Niño Southern Oscillation, which contributes to severe escalation and
extension of manmade fire events in Indonesia, such as those that took place in 1997 and 2015.46 Following
persistent droughts in the dry season from June to November 2019, an increase in forest fires has been observed
42
Oliver, E. C. J., Burrows, M. T., Donat, M. G., Sen Gupta, A., Alexander, L. V, Perkins-Kirkpatrick, S. E., . . . Smale, D. A. (2019).
Projected Marine Heatwaves in the 21st Century and the Potential for Ecological Impact. Frontiers in Marine Science, 6, 734.
URL: https://doi.org/10.3389/fmars.2019.00734.
43
Naumann, G., Alfieri, L., Wyser, K., Mentaschi, L., Betts, R. A., Carrao, H., . . . Feyen, L. (2018). Global Changes in Drought Conditions
Under Different Levels of Warming. Geophysical Research Letters, 45(7), 3285–3296. URL: https://agupubs.onlinelibrary.wiley.com/
doi/epdf/10.1002/2017GL076521
44
Naylor, R., Battisti, D., Vimont, D., Falcon, W., Burke, M. (2007). Assessing Risks of Climate Variability and Climate Change for
Indonesian Rice Agriculture. Proceedings of the National Academy of Sciences of the United States of America. 104. 7752–7.
10.1073/pnas.0701825104. URL: https://www.pnas.org/content/pnas/104/19/7752.full.pdf
45
King, A., Karoly, D., Van Oldenborgh, G.J. (2016). Climate Change and El Niño Increase Likelihood of Indonesian Heat and
Drought. Bulletin of the American Meteorological Society. 97. S113–S117. URL: https://journals.ametsoc.org/doi/pdf/10.1175/
BAMS-D-16-0164.1
46
Field, R.D., Van Der Werf, G.R., Fanin, T., Fetzer, E.J., Fuller, R., Jethva, H., Levy, R., Livesey, N.J., Luo, M., Torres, O. and Worden, H.M.
(2016). Indonesian fire activity and smoke pollution in 2015 show persistent nonlinear sensitivity to El Niño-induced drought.
Proceedings of the National Academy of Sciences, 113(33), pp. 9204–9209. URL: https://www.ncbi.nlm.nih.gov/pmc/articles/
PMC4995960/
CLIMATE RISK COUNTRY PROFILE: INDONESIA 14in the Sumatra region during October.47 Climate change projections point to more frequent and severe droughts
and subsequently more forest fires.48 Furthermore, some studies show that increased fire risk is not only associated
with drought years, but also temperature rise in non-drought years: during the summer months of July to October,
anomalously warmer months increased the probability of fires considerably more than anomalously dry months
during this period.49,50,51 The risks of fire and associated air quality impacts (haze) were underscored by the severe
forest and peatland fires of 2015, which cost the national economy an estimated $16 billion in lost productivity, and
resulted in an estimated 90,600 excess deaths (smoke-related mortality).52 Such events also make very significant
contributions to global greenhouse gas emissions.
Flood
The World Resources Institute’s AQUEDUCT Global Flood Analyzer can be used to establish a baseline level
of exposure to large-scale river flooding.53 As of 2010, assuming protection for up to a 1 in 25-year event, the
population annually affected by flooding in Indonesia is estimated at 1.5 million people and expected annual urban
damage is estimated at $1.4 billion. Development and climate change are both likely to increase these figures.
By the 2030s, climate change is expected to increase the annually affected population by 400,000 people and
increase urban damage by $6.1 billion under the RCP8.5 emissions pathway (AQUEDUCT Scenario B).
Paltan et al. (2018) demonstrate that even under lower emissions pathways consistent with the Paris Climate
Agreement, almost all Asian countries face an increase in the frequency of extreme river flows.54 What would
historically have been a 1 in 100-year flow, could become a 1 in 50-year or 1 in 25-year event in most of South,
Southeast, and East Asia.54 There is good agreement among models about this trend. Wilner et al. (2018)
suggest this increase in flows could lead to an increase in the population affected by an extreme flood by
817,000–2,537,000 people (Table 5).
Muis et al. (2015) explored flood risk and adaptation strategies in Indonesia under increased climate change and
urban expansion. They found high uncertainty around climate change impacts on increased river flood risk but
estimated that climate change could amplify coastal flood risk by 19–37% by 2030 (measured by Expected Annual
47
World Bank (2019). Indonesia Economic Quarterly (December 2019): Investing in People. World Bank Jakarta. URL: https://
www.worldbank.org/en/country/indonesia/publication/december-2019-indonesia-economic-quarterly-investing-in-people
48
Lestari, R.K., Watanabe, M., Imada, Y., Shiogama, H., Field, R.D., Takemura, T. and Kimoto, M. (2014). Increasing potential of
biomass burning over Sumatra, Indonesia induced by anthropogenic tropical warming. Environmental Research Letters, 9(10),
p. 104010. URL: https://iopscience.iop.org/article/10.1088/1748-9326/9/10/104010/pdf
49
Fernandes, K., Verchot, L., Baethgen, W., Gutierrez-Velez, V., Pinedo-Vasquez, M. and Martius, C. (2017). Heightened fire probability
in Indonesia in non-drought conditions: the effect of increasing temperatures. Environmental Research Letters, 12(5), p. 054002.
URL: https://iopscience.iop.org/article/10.1088/1748-9326/aa6884/pdf
50
Risk of Wildfire in Indonesia is shown as high in ThinkHazard! (2019). Think Hazard Risk Analysis, Wildfire. URL: http://thinkhazard.org/
en/report/116-indonesia/WF
51
ThinkHazard! (2019). Think Hazard Risk Analysis, Wildfire. URL: http://thinkhazard.org/en/report/116-indonesia/DG
52
Koplitz, S. N., Mickley, L. J., Marlier, M. E., Buonocore, J. J., Kim, P. S., Liu, T., . . . Myers, S. S. (2016). Public health impacts of the
severe haze in Equatorial Asia in September-October 2015: demonstration of a new framework for informing fire management
strategies to reduce downwind smoke exposure. Environmental Research Letters, 11(9), 94023. URL: http://acmg.seas.harvard.edu/
publications/2016/koplitz_fires_2016.pdf
53
WRI (2018). AQUEDUCT Global Flood Analyzer. URL: https://floods.wri.org/# [Accessed: 22/11/2018].
54
Paltan, H., Allen, M., Haustein, K., Fuldauer, L., & Dadson, S. (2018). Global implications of 1.5°C and 2°C warmer worlds on extreme
river flows Global implications of 1.5°C and 2°C warmer worlds on extreme river flows. Environmental Research Letters, 13.
URL: https://doi.org/10.1088/1748-9326/aad985.
CLIMATE RISK COUNTRY PROFILE: INDONESIA 15You can also read