The impacts of climate change in Canterbury: a summary of the literature - Morag Butler, Justin Cope, Jane Doogue September 2019
←
→
Page content transcription
If your browser does not render page correctly, please read the page content below
The impacts of
climate change in
Canterbury: a
summary of the
literature

Morag Butler, Justin Cope, Jane
Doogue

September 2019

Name                              Date
 Prepared by:          Morag Butler, Justin Cope, Jane   18/08/2019
                       Doogue
 Reviewed by:          Manaaki Whenua Landcare           05/09/2019
                       Research (Nick Cradock-Henry,
                       Nick Kirk, Gradon Diprose)

200 Tuam Street
PO Box 345
Christchurch 8140
Phone (03) 365 3828
Fax (03) 365 3194

75 Church Street
PO Box 550
Timaru 7940
Phone (03) 687 7800
Fax (03) 687 7808

Website: www.ecan.govt.nz
Customer Services Phone 0800 324 636
Climate change impacts for Canterbury: a summary of the literature Executive summary Climate change presents significant challenges, risks and opportunities to Canterbury. These are caused by both the changing climate and the transition to a low-emissions future as NZ contributes to the global effort to keep the global average temperature below 2°C above pre- industrial levels. The projected changes in climate for Canterbury are well known. However there has been no synthesis of the wide-ranging effects on the environment and society from the changing climate. Building an understanding of the direct and indirect impacts will grow our capacity to manage these climate change risks and opportunities to ensure environmental, social, cultural and economic wellbeing in Canterbury. We simplified an existing conceptual framework to summarise the direct and indirect impacts from climate change and transition change for Canterbury from existing literature. These were grouped into the impacts on environmental, economic, social, cultural and governance wellbeing. Climate-driven changes in Canterbury include increasing temperature, hot days (over 25°C), extreme rainfall, sea level rise and storm surges, and decreasing frosts and snow days. These will cause increasing hazards in certain areas such as river flooding, low flow timing, erosion and drought. Transition-driven changes will include changing laws, policies, regulations, innovation and investment. These will likely cause land-use to change, such as conversion of sheep and beef farms to forestry, and changes in transport such as conversion to electric vehicles. Environmental impacts will include land damage and loss, spatial and seasonal changes in freshwater supply and quantity, sub-optimal health of organisms, changing species distribution including pest and disease species and changing food webs. In terms of the built environment, coastal defences, buildings, infrastructure and public amenities are all exposed to sea level rise and storm surges, increasing drought and extreme rainfall. Much of the existing literature covering economic impacts of climate change focus on agriculture, describing the impacts of changing growing seasons, crop cycles, water availability and biosecurity on yields, farm operations and profits. Social impacts of climate change in New Zealand which are applicable to Canterbury include various health-related impacts, increasing social disruption, changing land values and increasing cost of living. Cultural impacts of climate change include changes in the functioning of Te Waihora Lake, inundation of wāhi tapu sites and other culturally significant sites, and potential changes to taonga species and mahinga kai practices. Governance impacts include changing roles and responsibilities, funding stressors, legal liability and legal challenges, managing community expectations about levels of service, compensation demands and livelihood, and adapting planning approaches to consider design- life of land use. Environment Canterbury Technical Report i
Climate change impacts for Canterbury: a summary of the literature

Table of contents
Executive summary ............................................................................................... i

1        How to use this guide ................................................................................ 1

2        Methodology ............................................................................................... 1
         2.1      Literature search ....................................................................................................... 1
         2.2      Climate change impacts: Concepts and terminology ............................................... 2

3        Climate-driven changes............................................................................. 5
         3.1      Changes to temperature ........................................................................................... 5
                  3.1.1 Hot days ....................................................................................................... 6
                  3.1.2 Cold nights ................................................................................................... 6
         3.2      Changes to precipitation ........................................................................................... 6
                  3.2.1 Snow ............................................................................................................ 6
                  3.2.2 Extreme Rainfall ........................................................................................... 6
         3.3      Wind .......................................................................................................................... 7
         3.4      Storms ....................................................................................................................... 7
                  3.4.1 Tropical and ex-tropical cyclones................................................................. 7
                  3.4.2 Extra-tropical/mid latitude storms................................................................. 7
         3.5      Mean sea level pressure ........................................................................................... 7
         3.6      Solar radiation ........................................................................................................... 7
         3.7      Hydrological Changes ............................................................................................... 9
                  3.7.1 River Flooding .............................................................................................. 9
                  3.7.2 Mean Discharge ........................................................................................... 9
                  3.7.3 Mean Annual Low Flow (MALF)................................................................... 9
                  3.7.4 Low Flow Timing .......................................................................................... 9
         3.8      Erosion .................................................................................................................... 10
         3.9      Drought ................................................................................................................... 10
         3.10     Sea level rise .......................................................................................................... 10
         3.11     Oceanic Changes ................................................................................................... 11
         3.12     Certainty and uncertainty ........................................................................................ 11

4        Transition-driven change ........................................................................ 12

5        Cascading impacts .................................................................................. 14
         5.1      Environmental ......................................................................................................... 14
                  5.1.1 Land ........................................................................................................... 14
                  5.1.2 Water (freshwater, estuarine, marine) ....................................................... 14
                  5.1.3 Biological .................................................................................................... 15
                  5.1.4 Ecological ................................................................................................... 16
                  5.1.5 Built ............................................................................................................ 17
         5.2      Economic ................................................................................................................ 18
                  5.2.1 Agriculture .................................................................................................. 19
                  5.2.2 Transport .................................................................................................... 21
                  5.2.3 Forestry ...................................................................................................... 22
                  5.2.4 Tourism ...................................................................................................... 22
                  5.2.5 Aquaculture ................................................................................................ 22

ii                                                                               Environment Canterbury Technical Report
Climate change impacts for Canterbury: a summary of the literature
5.2.6 Insurance ................................................................................................... 23
5.2.7 Banking ...................................................................................................... 23
5.2.8 Energy ........................................................................................................ 23
5.2.9 Manufacturing ............................................................................................ 24
5.3 Social ...................................................................................................................... 24
5.3.1 Health and loss of life ................................................................................. 24
5.3.2 Socio-economic.......................................................................................... 25
5.3.3 Food and water security ............................................................................. 26
5.3.4 Disruption ................................................................................................... 26
5.3.5 Community ................................................................................................. 26
5.3.6 Migration .................................................................................................... 26
5.4 Cultural .................................................................................................................... 27
5.5 Governance ............................................................................................................ 27
6 Gaps and future work .............................................................................. 28
7 References................................................................................................ 29
Environment Canterbury Technical Report iiiClimate change impacts for Canterbury: a summary of the literature
List of Figures
Figure 2.1 Relationship between climate change, impacts and risk (IPCC, 2014). ........................... 3
Figure 2.2 Simplified conceptual framework defining the relationships between climate changes,
transition changes, direct impacts and indirect impacts (adapted from adapted from
Keating et al. (2014)). .................................................................................................. 4
List of Tables
Table 2.1 Definitions of terms used in the conceptual framework. .................................................... 4
Table 3.1 A summary of climatic and extreme weather changes for Canterbury across a range of
emissions scenarios (MfE, 2018). ............................................................................... 8
iv Environment Canterbury Technical ReportClimate change impacts for Canterbury: a summary of the literature
1 How to use this guide
Climate change presents significant challenges, risks and opportunities to Canterbury. The
Council’s role is to support the region and its communities to better understand and proactively
respond to the challenges, risks and opportunities presented by climate change. This
document summarises available literature on climate change impacts for Canterbury.
This document is intended to be used as a guide and initial reference list. While the
robustness of the research is considered, it is up to the reader to decide on the
applicability of the results to their own work area or project. See sections 2 and 6 for
methodology and limitations.
Use this guide to:
• find out how the Canterbury climate could change in the future (Section 3),
• find out how we might transition to a low-emissions economy (Section 4)
• identify potential cascading impacts across environmental, economic, social
and cultural domains relevant to your work area (Section 5)
2 Methodology
2.1 Literature search
A two-step methodology was used to undertake this review. The first step involved
Environment Canterbury staff who reviewed and filtered the literature based on the following
criteria:
o climate change-related risk, impact
o geographic area (Canterbury-specific findings and New Zealand-wide findings
which could be extrapolated to Canterbury)
o peer-reviewed and grey literature (CRIs, reports prepared for government
departments, academic research)
The results from this first step were then supplemented and cross-referenced by researchers
from Manaaki Whenua - Landcare Research (MWLR). The aim of this second step was to
identify any additional literature in academic and scientific databases, also drawing on
researchers’ own knowledge and experience in adaptation and familiarity with the Canterbury
region (e.g. Cradock-Henry et al., 2018, 2019a, 2019b; Kirk et al., 2017; Simon et al., 2019) to
address knowledge gaps and include additional relevant literature. This second step included
reviewing all literature for any statements about certainty/uncertainty and the level of
anticipated impact caused by climate change.
The second step used a ‘systematic review’ process (see Ford et al., 2011). Systematic
reviews are increasingly used in climate change research to review and synthesise existing
knowledge in a structured fashion (Pearce et al., 2018). A document search was performed in
the Scopus database using the following search terms: ‘climate change’, ‘impacts’,
Environment Canterbury Technical Report 1Climate change impacts for Canterbury: a summary of the literature
‘Canterbury’, ‘New Zealand’ in the title, keywords, and abstract fields. A similar search was
performed using the Web of Science database as well. Scopus was selected due to its
availability as one of the most current, powerful, comprehensive and widely used search
engines for peer-reviewed literature. The search did not specify a date range.
To ensure inclusion of grey literature (e.g. research reports, summary and technical reports) a
manual search of the Climate Cloud database (www.climatecloud.co.nz) was also undertaken.
Finally, the MWLR researchers consulted with colleagues to ensure inclusion of any other
additional publications, and to assess completeness of searches.
The various searches retrieved 471 references. Of these, 89 met the criteria outlined in step
one above. These 89 references were cross-referenced with the original search results
obtained from ECan, resulting in 68 additional original references. Abstracts were reviewed
and then each reference was evaluated according to the following criteria and either:
o included in the report if they identified relevant climate change impacts for Canterbury,
or New Zealand that could be extrapolated to Canterbury
o excluded if they detailed old/superseded information or summarised information in
other sources already included.
All references were reviewed for statements about levels of certainty/uncertainty and the scale
of anticipated impacts caused by climate change. Communicating certainty/uncertainty and
the scale of anticipated impacts from climate change is difficult because of the complexity of
the global climate system, the cascading nature of impacts, and the unknown future responses
by human societies (Wilby and Dessai, 2010). Consistent with best practice, MWLR
researchers used guidance for Contributing Authors provided by the IPCC Fifth Assessment
(AR5, 2013) and Sixth Assessment (AR6, 2021) based on Mastrandrea et al., (2010) to
communicate certainty/uncertainty in terms of confidence. High agreement by experts and
robust evidence (including type, amount, quality and consistency) would indicate high
confidence/certainty. For this report if a reference mentioned certainty/uncertainty we
categorised this using three qualifiers – ‘high’, ‘medium’ and ‘low’. ‘High’ indicates robust
evidence and agreement by experts. ‘Medium’ indicates some evidence and some agreement
by experts. ‘Low’ indicates little evidence and limited agreement by experts. If a reference
mentioned scale we categorised this by ‘national’, ‘regional’ and ‘local’, and then ‘major’, ‘minor’
or ‘contingent’ (meaning it depends on future choices). These categorisations were made
based on the statements and evidence provided in each reference.
To ensure the report remains concise MWLR researchers have not provided statements
around certainty/uncertainty and scale of impacts for every single reference. Rather,
references have been aggregated and general summaries of certainty/uncertainty and scale
are provided. Because of the complexity associated with evaluating and communicating
certainty/uncertainty and scale, readers are encouraged to review identified references and
make their own judgements if further information is required.
2.2 Climate change impacts: Concepts and terminology
Climate change impacts are driven by both the physical change in climate and extreme
weather and the socioeconomic processes related to adaptation and mitigation actions. The
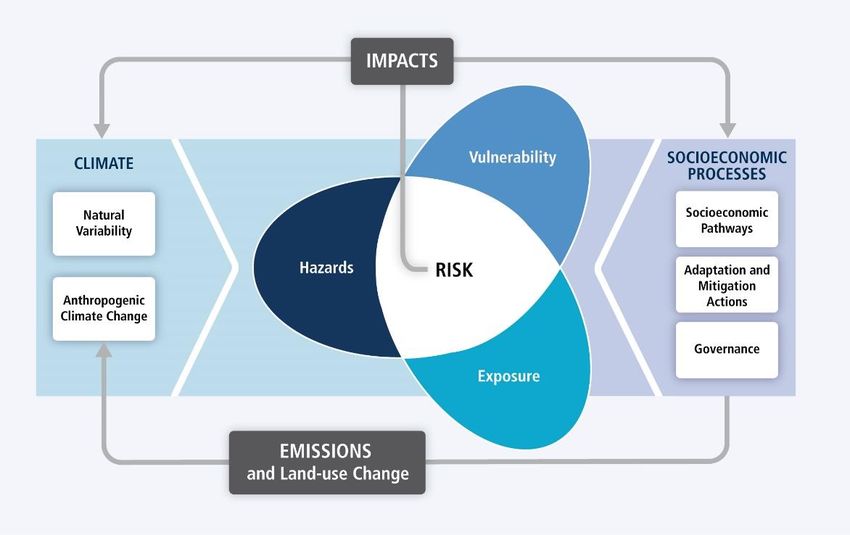
risk of these impacts occurring is a function of (Fig 2.1):
2 Environment Canterbury Technical ReportClimate change impacts for Canterbury: a summary of the literature
o hazards – a potentially damaging event which may cause loss of life or injury,
property damage, social and economic disruption or environmental degradation
(MCDEM, 2019)
o vulnerability – predisposition to be adversely affected. Includes sensitivity to
harm or damage and lack of coping capacity and adaptive capacity (IPCC, 2018)
o exposure – presence of people, livelihoods, species, ecosystems,
infrastructure, or assets in places that could be adversely affected (IPCC, 2018)
Figure 2.1 Relationship between climate change, impacts and risk (IPCC, 2014).
While it is important to understand the hazards caused by climate change, it is also important
to understand the direct and indirect impacts of climate change. These indirect impacts can
propagate as cascades across environmental, social, economic, cultural and governance
systems (Lawrence, Blackett, Cradock-Henry, & Nistor, 2018; Rocha, Peterson, Bodin, &
Levin, 2018). Thus, impacts in this summary are grouped into the four wellbeing’s –
environmental, economic, social and cultural, drawn from section 3 of the Local Government
Act, and governance wellbeing.
Because the terms ‘hazard’, ‘impact’ and ‘risk’ are used inconsistently in the literature we
developed a simplified conceptual framework to ensure consistent framing of these terms and
to distinguish direct from indirect (cascading) impacts (Fig 2.2). Definitions of the terms used
are detailed in Table 2.1.
Environment Canterbury Technical Report 3Climate change impacts for Canterbury: a summary of the literature
Figure 2.2 Simplified conceptual framework defining the relationships between climate
changes, transition changes, direct impacts and indirect impacts (adapted
from adapted from Keating et al. (2014)).
Table 2.1 Definitions of terms used in the conceptual framework.
Term Definition
Climate changes Changes in climate variable(s) such as temperature or rainfall.
Transition changes The process of changing from one state or condition to another
in a given period of time, in this case transitioning to a low-
emissions future (adapted from IPCC (2018)).
Direct impact The outcome (of an event or transition), expressed qualitatively
in terms of the level of impact. Consequences can be
measured in terms of economic, social, environmental or other
impacts (adapted from MfE, 2008).
Indirect impact Indirect impacts are the consequences that flow from the direct
impacts (adapted from Keating et al. (2014)).
Adaptive capacity/ The ability of people, institutions, organisations, and systems,
resilience using available skills, values, beliefs, resources, and
opportunities, to address, manage, and overcome adverse
conditions in the short to medium term (IPCC, 2018).
4 Environment Canterbury Technical ReportClimate change impacts for Canterbury: a summary of the literature
3 Climate-driven changes
This section sets out a brief overview of well-documented changes expected in Canterbury.
The primary sources of regional climate change-related information for Canterbury are Mullan
et al (2016), Ministry for the Environment (2018a)1, Carey-Smith et al. (2018) and Pearce et
al. (2017).
Literature relating to Canterbury specific climate-driven changes take the approach whereby
climate model data from the IPCC Fifth Assessment (IPCC, 2013) has been used to update
climate change scenarios for New Zealand, through both a regional climate model (dynamical)
and statistical downscaling process. The dynamical and statistical downscaling processes are
described in detail in climate guidance material prepared for the Ministry for the Environment
(Ministry for the Environment, 2018a; Mullan et al., 2016).
Climate projections are modelled representations of the future climate for use in exploring the
potential impacts and implications of climate change. They are useful for characterising
changes in key climatic variables (such as temperature and precipitation), and as inputs to
other models (such as biophysical or crop models) to determine implications on productivity or
yield. The models typically indicate expected trends in climate variables (e.g. air and sea
temperatures, rainfall, sea-level rise) under various emissions scenarios, and the quantum of
change over different time periods.
In selecting model parameters it is necessary to consider emissions scenarios known as
Representative Concentration Pathways (RCPs). The reports consider the consequences for
the future New Zealand climate of four concentration pathways from the Intergovernmental
Panel on Climate Change (IPCC) Fifth Assessment (IPCC, 2013) which range from low- to
high. The pathways are abbreviated as RCP2.6, RCP4.5, RP6.0, and RCP8.5, in order of
increasing radiative forcing by greenhouse gases.
The Ministry for the Environment website (2018) presents a summary of Canterbury
projections based on (Table 3.1). The projected changes are calculated for 2031–2050
(referred to as 2040) and 2081–2100 (2090) compared to the climate of 1986–2005 (1995),
across the four RCP scenarios.
NIWA’s Our Future Climate New Zealand website (2019) presents national maps and local
charts for Christchurch of several climate variables using each RCP scenario.
3.1 Changes to temperature
The magnitude of the temperature change projections for Canterbury varies with the RCP and
climate models used.
Future temperature scenarios for 2040 (2031-2050 relative to 1986-2005) show that annual
average temperatures across Canterbury are projected to increase by between 0.7°C (RCP
2.6) and 1.0°C (RCP 8.5). By 2090 (2081-2100 relative to 1986-2005) annual average
temperatures are projected to increase by between 0.7°C (RCP 2.6) and 2.8°C-3.0°C (RCP
8.5). The greatest warming is projected for summer or autumn (depending on the RCP) and
the least warming is projected for spring. A slight acceleration in warming is projected for the
second half of the 21st century compared to the first 50 years under the higher emission
scenarios. Warming is not spatially consistent across Canterbury – inland high elevation areas
tend to warm more than lowland and coastal areas (Pearce et al., 2017).
1 NOTE: This 2018 “2nd Edition” is the same as an original 2016 report (Mullan et al 2016), except for incorporation
of results from a 2018 report on very extreme rainfall – the “HIRDS” report (Carey-Smith et al., 2018)
Environment Canterbury Technical Report 5Climate change impacts for Canterbury: a summary of the literature 3.1.1 Hot days Hot days are defined as reaching temperatures greater than 25°C. Projections of the number of hot days varies across Canterbury depending on the RCP, although overall the number of days increase. Under a lower emission scenario (RCP 2.6) at 2040, the Canterbury Plains and inland areas of Canterbury are projected to experience up to 10-15 more hot days per year. Under RCP 8.5 at 2040, the projection for hot day increases is spatially similar to RCP 2.6, except that inland and higher elevation locations are projected to experience up to 20 more hot days per year than the historical period. By 2090 under RCP 2.6, slightly more hot days per year are projected than in 2040 under the same scenario, with up to 20 more hot days projected for inland areas. However, under RCP 8.5 at 2090 there is a significant increase in the number of hot days projected across much of Canterbury, with most areas projecting an increase of at least 20 more hot days per year (Ministry for the Environment, 2018a; Pearce et al., 2017). 3.1.2 Cold nights Cold nights are defined as nights where temperatures drop below 0°C. Spatial variations also exist for cold nights (i.e. frost) projections, with small decreases in frost frequency projected around the coast and lowland areas (up to 10 fewer frosts per year for these areas at 2040 under RCP 2.6 and 8.5, and 2090 under RCP 2.6). Under RCP 8.5 at 2090 frost frequency declines by ~20 per year for most coastal areas. For colder inland areas, declining frost frequency is much more marked (Ministry for the Environment, 2018a; Pearce et al., 2017). 3.2 Changes to precipitation Precipitation projections for Canterbury show more spatial and seasonal variation than the temperature projections and the magnitude of the projected change will scale up or down with the different RCPs and differs between different climate models (Pearce et al. 2017). The range of variations in rainfall across the range of RCP scenarios and through the seasons, can be seen in Table 3.1. For nuanced regional and seasonal precipitation changes there are detailed regional maps and tables in Ministry for the Environment (2018a) and Pearce et al. (2017). 3.2.1 Snow The number of snow days per year essentially reduces everywhere in Canterbury with the largest reduction in the coldest areas where there are a large number of snow days under present climatic conditions (Pearce et al., 2017). In the Canterbury high country and inland basins, a reduction in the snow season of 30 days is possible by the end of the century under the high emission (RCP 8.5) scenario. 3.2.2 Extreme Rainfall Projections for New Zealand (Ministry for the Environment, 2018a) indicate that moderate and extreme rainfall events are likely to increase across the country, including Canterbury. However, Pearce et al. (2017) indicate that there may be a decrease in extreme rainfall events in eastern areas of Canterbury, particularly for coastal south Canterbury. MfE (2018a) present regional maps of changes in precipitation during high rainfall events per degree of warming. However, they note that Carey-Smith et al (Carey-Smith et al., 2018) found that the large regional variability between climate model simulations does not provide enough 6 Environment Canterbury Technical Report
Climate change impacts for Canterbury: a summary of the literature

confidence in these regional patterns and recommended that until further information suggests
otherwise, climate change rainfall augmentation factors should be assumed to be uniform over
New Zealand. These national augmentation factors are presented in Table 13 of MfE (2018a)
and present estimates in the increase of rainfall for each degree of warming for each event
duration and return period.

3.3     Wind
Extreme daily winds are likely to increase by up to 10% by the end of the century in the high
RCP8.5 emissions scenario. This will be especially noticeable east of the Southern Alps due
to the increased westerly pressure gradient in winter and spring (Pearce et al., 2017). Extreme
winds are predicted to be more frequent in winter but will decrease in summer (Mullan et al.,
2011).

3.4     Storms
3.4.1   Tropical and ex-tropical cyclones

Canterbury is rarely affected in an adverse way by cyclones of tropical origin. These storms
are usually weakened by the time they travel south towards Canterbury, but they can retain
characteristics which have the potential to cause flooding, wind damage and higher-than-
normal wave heights and coastal storm surges. IPCC (2013) projections for tropical cyclones
in the future are that tropical storms making landfall will be stronger but overall, there is
significant uncertainty surrounding projections of tropical cyclones into the future (Pearce et
al., 2017). The frequency with which ex-tropical cyclones and other storms of tropical origin
may reach Canterbury in the future is therefore uncertain.

3.4.2   Extra-tropical/mid latitude storms

There is little regional specific information on mid-latitude low pressure weather systems. IPCC
(2013) say that extratropical storm tracks (such as the low-pressure southerly weather systems
experienced in Canterbury every few days) will tend to shift poleward by several degrees but
the reduction in storm frequency will only be a few per cent. The current consensus is that
future changes in storms are likely to be small compared to natural inter-annual variability
(IPCC, 2013; Ministry for the Environment, 2017b).

3.5     Mean sea level pressure

Mean sea level pressure (MSLP) is projected to increase in summer, resulting in more
north-easterly flow and anticyclonic (“high” pressure) conditions. MSLP is projected to
decrease in winter resulting in stronger westerlies (Ministry for the Environment, 2018a; Mullan
et al., 2016; Pearce et al., 2017).

3.6     Solar radiation
Solar radiation is predicted to decrease in coastal Canterbury during summer (consistent with
increased rainfall) and increase during winter (consistent with decreased rainfall) (Ministry for
the Environment, 2018a; Mullan et al., 2016; Pearce et al., 2017).

Environment Canterbury Technical Report                                                        7
Climate change impacts for Canterbury: a summary of the literature

Table 3.1 A summary of climatic and extreme weather changes for Canterbury across a
range of emissions scenarios (MfE, 2018).
Climate
 Average annual temperatures increase
             o    Annually 0.7 - 1˚C by 2040, 0.7 - 3˚C by 2090
             o    Spring 0.6°C - 2.6°C
             o    Summer 0.6°C - 3.0°C
             o    Autumn 0.7°C - 3.0°C
             o    Winter 0.7°C - 3.3°C

    Rainfall will vary within the region and seasonally
    Spring
       •   0-2% increase in Christchurch
       •   1-2% increase in Hanmer
       •   6-13% increase in Tekapo
    Summer
        •  1-8% increase in Christchurch
        •  0-9% increase in Hanmer
        •  2-5% increase in Tekapo
    Autumn
        •    0-8% increase in Christchurch
        •    0-2% increase in Hanmer
        •    2% decrease to 3% increase in Tekapo

    Winter
        •    12% decrease to 1% increase in Christchurch
        •    10% decrease to 1% increase in Hanmer
        •    6-28% increase in Tekapo

    Snowfall & snowy days will significantly decrease (30 days less per year by 2090)

    Duration of snow cover decreases (particularly at lower elevations)

    Westerly winds increase (particularly in winter & spring)

    NZ sea level rise will be 0.18 - 0.27m by 2040, 0.42 - 0.90m by 2090

Extreme weather
 Hot days increase (max temp exceeds 25˚C) by 6-35 extra days per year
 Frost days decrease 13-38 less days per year
 Extremely windy days increase 2-10% by 2090
 Extreme rainfall events increase. (greater than 2-year average recurrence interval)
 Drought frequency and severity increases
 Extreme wind speed strength increases

8                                                         Environment Canterbury Technical Report
Climate change impacts for Canterbury: a summary of the literature 3.7 Hydrological Changes Several hydrological reports have been prepared for the Ministry for Primary Industry (MPI) and Ministry for the Environment on hydrological modelling of multi-model climate forecasts for agricultural applications, and the effect of climate change on agricultural water resources and flooding (Collins & Zammit, 2016a, 2016b). Although these reports have a national focus some regional analyses are provided, including for Canterbury. The Canterbury specific analyses in Collins and Zammit (2016a, 2016b), have been summarised by Pearce et al., (2017). Collins et al. (Collins & Zammit, 2016b) present an analysis of potential effects of climate change on hydrological conditions at 20 river mouths around New Zealand. The Rakaia River is the only Canterbury river included in this study and was shown to exhibit an increase in all mean flow and extreme flow variables under climate change scenarios. Collins et al. (2012) outline projected changes in river flows for Ashley River, Waimakariri River and Heathcote Stream in Canterbury, noting an increase in variability for all three streams due to climate change. 3.7.1 River Flooding Pearce et al. (Pearce et al., 2017) present a brief synopsis of changes to mean annual flood (MAF) and Q5 discharge (flow threshold exceeded 5% of the time). MAF is projected to either increase or remain about the same across the Canterbury region. There is a tendency for increases to be larger for more extreme emission scenarios, particularly under RCP 8.5 which sees widespread and substantial increases in MAF (Pearce et al., 2017). Canterbury tends to exhibit a west-east pattern in change in Q5 discharge, with slight increases towards the very west, decreases across much of inland Canterbury from north to south as well as Banks Peninsula, and increases along much but not all of coastal and near-coastal Canterbury. Where there are increases, they tend to be larger with the higher emission scenario; the same trend is not apparent for the decreases (Pearce et al., 2017). 3.7.2 Mean Discharge Models show variability in mean discharge throughout Canterbury depending on the time period and emission scenario. Southern coastal Canterbury tends to become wetter, particularly for the higher emission scenario and late-century, and inland Canterbury often becomes drier, but otherwise there is no pronounced pattern in the changes (Pearce et al., 2017). 3.7.3 Mean Annual Low Flow (MALF) Canterbury exhibits a mix of increases and decreases in MALF under climate change. The increases tend to be isolated to southern Canterbury and inland portions of mid-Canterbury, although these decline in extent late-century (Pearce et al., 2017). 3.7.4 Low Flow Timing Low flow conditions tend to be reached sooner after winter across Canterbury except for high alpine areas in the west and areas across Canterbury Plains and Banks Peninsula. Changes in the major alps-fed rivers tend to reflect changes in their source areas, which can differ from the surrounding rivers across the Plains. The Rangitata, for example, reaches low flow Environment Canterbury Technical Report 9
Climate change impacts for Canterbury: a summary of the literature

conditions later while the Waimakariri reaches them earlier. There is no strong dependency on
emission scenarios or time period (Pearce et al., 2017).

3.8    Erosion
Hill country erosion is a significant issue for higher-elevation parts of Canterbury, particularly
those areas used for primary industries such as agriculture, horticulture and forestry. Hill
country erosion has downstream effects including river sedimentation which can affect water
quality and aquatic habitats (Pearce et al., 2017). Climate and erosion are linked through
water movement into and through the soil. Projected increases in extreme rainfalls in some
areas of Canterbury will play a critical role in determining the effect of climate change on
erosion processes. Hillslope erosion processes (e.g. shallow landslides, earthflows, gully, and
sheet erosion) are likely to be influenced by climate change (Pearce et al., 2017).

Basher et al. (2012) studied the effect of climate change on erosion, using projections from the
IPCC’s Fourth Assessment Report. They found that mountain and hill country areas of
Canterbury, including parts of Banks Peninsula are most susceptible to increased landslides,
gully erosion and sheet erosion.

Areas most susceptible to wind erosion are the Canterbury alluvial plains, loess-mantled areas
of Canterbury where vegetation has been depleted by grazing, hill country with shallow soils
and areas that have low soil moistures (Pearce et al., 2017).

A related issue to erosion is greater risk of rock avalanches and landslides as a result of melting
ice retreat from glaciers. However, to date research has not been able to distinguish the effect
of ice retreat from climate change and other influences such as tectonic shifts or general
erosion (Allen et al., 2011).

3.9    Drought
An increase in climatic drought frequency is projected for Canterbury (Pearce et al., 2017).
Drought risk is expected to increase during this century in all areas that are currently drought
prone. For the Canterbury Plains, even very mild future climate changes are expected to shift
this area towards a more drought prone setting.

Under the most likely mid-range emissions scenario the projected increase in percentage of
time spent in drought for Canterbury from 1980-99 levels is about 7-10% for 2030-2050 and
10% for 2070-2090 (Pearce et al., 2017).

3.10 Sea level rise
The most recent national information and guidance on sea level rise (Ministry for the
Environment, 2017a) takes global forecasts (IPCC, 2014) and applies them to the New
Zealand national context. There is a close comparison between global and New Zealand
average historic rates of sea level rise which means that projections of future sea-level rise by
the IPCC which are generated as global means, can generally be adopted for overall use in
New Zealand.

Small local adjustments for significant local vertical land movement may be needed (Ministry
for the Environment, 2017a). For example, historic sea level data from Lyttelton shows that
historic sea level rise over the past 100 years is 2.12mm/yr compared to the NZ long-term
average across 10 tide gauge sites of 1.76mm/yr. The difference is relatively small and in the

10                                                     Environment Canterbury Technical Report
Climate change impacts for Canterbury: a summary of the literature

absence of any more nuanced regional information, any national guidance can be applied to
the Canterbury context.

According to the IPCC Fifth Assessment Report (IPCC, 2013), global sea-level rise will likely
be in the range 0.28-0.98 m by 2100 (lower bound for RCP 2.6, upper bound for RCP 8.5).
However, onset of the collapse of the polar ice sheets could cause global mean sea level to
rise substantially above the likely range during this century. Recent observations reveal a rapid
thinning of glacier regions in Antarctica, which can be attributed partly to warming oceans.
These findings have raised concerns of an accelerated ice loss of the West Antarctic ice sheet
and potential contributions to global sea level rise. Ice loss can occur in the form of melt-
induced (liquid) freshwater discharge into the ocean, or through (solid) iceberg calving
(Schloesser et al., 2019).

MfE (2017a) guidance has been developed on the principle that no one particular or ‘most
likely’ climate future can be determined, due to uncertainty around future global emissions
pathway and the emergence of polar ice sheet instabilities. Therefore, the guidance states that
planning for coastal areas needs to consider several scenarios to cover the range of possible
futures.

Four scenarios have been developed for New Zealand to cover a range of possible sea-level
futures (Ministry for the Environment, 2017a):
   1.   a low to eventual net-zero emission scenario (RCP2.6)
   2.   an intermediate-low scenario based on the RCP4.5 median projections
   3.   a scenario with continuing high emissions, based on the RCP8.5 median projections
   4.   a higher H+ scenario, considering possible instabilities in polar ice sheets, based on
        the RCP8.5 (83rd percentile) projections from research carried out after the release of
        the IPCC 5th assessment report.

The MfE (2017a) guidance presents useful summary tables of decadal increments for
projections of sea-level rise for New Zealand (MfE (2017a), Table 10) and bracketed
timeframes to reach a specific increment of sea-level rise, from the earliest to latest time across
the RCP2.6, RCP4.5, RCP8.5 and H+ scenarios (MfE (2017a), Table 11).

3.11 Oceanic Changes
Literature around oceanic changes under climate change is more general than region-specific.
Law et al., (2016) presents climate change impacts and implications for New Zealand’s
Exclusive Economic Zone with detail regarding likely changes to New Zealand’s marine
environment to 2100, including forecast changes to ocean acidification, sea surface
temperatures and changes to nutrients and the impact on fisheries (see also Office of the Chief
Science Advisor, 2013).

3.12 Certainty and uncertainty

The majority of research cited in Section 3 draws on the most up to date IPCC global climate
models and RCPs. All the references acknowledge climatic and non-climatic variables, where
relevant, that may affect the certainty of projections and impacts. For example, the Ministry for
the Environment (2017b) notes projections are inherently uncertain due to model uncertainty,
New Zealand’s maritime climate and non-climatic socio-economic changes which will influence
emissions pathways, such as changing commodity prices. To manage uncertainty the global

Environment Canterbury Technical Report                                                         11
Climate change impacts for Canterbury: a summary of the literature
climate models and RCPs build in different possibilities to predict a range of plausible future
scenarios. While they incorporate uncertainties, they represent the highest source of robust
data to date with general international agreement. When downscaling these projections to
regional and local contexts, further uncertainties are introduced. For example, the Allen et al.
(2011) and Basher et al. (2011) both acknowledge difficulties projecting landslide changes
under climate change due to uncertainty on how increased rainfall could affect erosion, thus
we classify their research findings as having ‘medium’ certainty. Carey-Smith et al. (2018) used
resampling methods to estimate uncertainty in their rainfall models. Given this, we also classify
this research as having ‘medium’ certainty. Mullan et al. (2016) used the ‘Linked empirical
Modelled and Observed Distribution (LeMOD)’ correction method for bias correction on their
regional climate model. This method helps reduce uncertainties in model projections and given
this we classify the model projections as having ‘medium’ certainty. Despite these
categorisations, to date this research represents the most robust data sources on the direct
impacts of climate change.
For further discussion and insight into uncertainty and climate change impacts and implications
for New Zealand, the reader is referred to Flood and Lawrence (2016).
4 Transition-driven change
Nationally and internationally there is a push to transition to a low-emissions future. Under the
Paris Agreement (ratified in 2016) NZ has committed to having an emissions reduction target,
contributing to the global effort to keep the global average temperature below 2°C above pre-
industrial levels. This has driven the development of the Zero Carbon Bill, now the Climate
Change Response Amendment Bill. The Bill sets targets for NZ for greenhouse gas emissions
reductions by 2050.
Transitioning to a low-emissions future will require changes to the economy and society. The
NZ government has committed to making the process a ‘just transition’ to a low-emissions
future – one that is fair, equitable and inclusive. The NZ Productivity Commission (2018)
identified the following drivers to achieve this change:
• Emissions pricing – this may include changes to structure and coverage of the
Emissions Trading Scheme
• Laws and institutions – including new climate policy
• Regulations and policies – including pricing mechanisms, e.g. rebates to encourage
uptake of electric vehicles, increasing waste disposal levy
• Innovation and investment – including increasing R&D funding for mitigation.
These drivers may cause changes to land-use, transport, electricity, waste and the built
environment (New Zealand Productivity Commission, 2018).
Land-use change may be driven by transition changes, including the emissions price (New
Zealand Productivity Commission, 2018) and societal preferences and worldviews changing
demand for agricultural goods and services (Rutledge et al., 2011). Key interdependencies of
land-use change include future population increase, technological development, skills
shortages, risk aversion, need for new supply chains and infrastructure. Land-use change in
Canterbury could manifest in the following ways:
o Forestry – predicted to significantly increase in Canterbury as modelled in a case
study of the Hurunui. Conversion from sheep and beef and scrubland
(Parliamentary Commissioner for the Environment, 2019)
12 Environment Canterbury Technical ReportClimate change impacts for Canterbury: a summary of the literature
o Bioenergy production - increasing demand for potential bioenergy sources, such
as plantation forestry, perennial grasses, canola, maize and sugar beet, could
drive conversion of unmanaged lands, some existing forestry land, and marginal,
hill country pasture (Rutledge et al., 2011)
o Crop production – increasing demand for more localised food production could
displace pastoral production by crops on remaining suitable soils near urban
areas that remain available for production (Rutledge et al., 2011)
o Horticulture – increasing overseas demand in short term could trigger increase,
most likely via transfers from pastoral uses in areas with existing infrastructure
to support expansion (Rutledge et al., 2011)
o Sheep & beef production – competition for land from bioenergy, horticulture, and
forestry may cause sheep & beef to decline over long term (Parliamentary
Commissioner for the Environment, 2019; Rutledge et al., 2011)
o Dairy – decrease predicted, likely conversion to horticulture (Parliamentary
Commissioner for the Environment, 2019).
In terms of urban land use, the Productivity Commission (2019) notes that there is not a strong
case to use urban planning policies to reduce emissions. This is because advances in low-
emissions transport options may occur more quickly than the significant increase in density
needed from urban planning policies.
In the transport sector a shift to electric vehicles is seen as the most significant opportunity to
reduce emissions. However, a shift to public transport, cycling and walking will also reduce
emissions while having health co-benefits (New Zealand Productivity Commission, 2018).
There are also opportunities to use biofuels for aviation, shipping and heavy vehicles.
There may be increasing costs of electricity production and reduced security of supply with a
push to increase renewable energy sources (New Zealand Productivity Commission, 2018).
New technological options are expected over time, such as tidal, carbon capture and storage,
which have their own co-benefits and trade-offs.
Reducing emissions from solid waste may be achieved through various policy drivers. These
include extending the waste disposal levy and regulating farm dumps through the RMA and
Waste Management Act (New Zealand Productivity Commission, 2018).
The references that outline potential impacts of transition driven change in Section 4 do not
use statistical probabilities of certainty such as those used in assessments of direct impacts
projected by global climate models. Rather, they tend to use behavioural, economic and
optimisation modelling to identify strategies (including regulatory, incentives, behaviour change
etc.) to achieve specified outcomes. Consequently assigning ‘certainty’ to transitional activities
is difficult as they are contingent on future social, cultural, political and economic decisions.
Nevertheless, these references identify and summarise key issues using robust scientific,
economic and social science knowledge to evaluate the benefits and costs of different
decisions. Therefore they are useful for evaluating different decisions related to climate
change.
Environment Canterbury Technical Report 13Climate change impacts for Canterbury: a summary of the literature
5 Cascading impacts
5.1 Environmental
This section details how climate change may affect both the natural (land, water, biological and
ecological) and built environment. The focus is primarily on the cascading indirect effects of
climate change. For biological effects on species used in the agriculture sector, see Economic
impacts section.
5.1.1 Land
Land damage around NZ will include long-lasting salt damage to flooded pastures from
seawater inundation (Ministry of Civil Defence and Emergency Management, 2010), siltation
of pasture and crop land and deposition of gravel, rock and remnants of vegetation (Basher et
al., 2012) as flood management and protection measures are overtopped (Bell, 2001). Soil
loss could increase due to coastal and river erosion and increased landslides, mudslides and
general erosion (Basher et al., 2012). Quilter et al. (2015) note that sea-level rise may lead to
more saturated soils beneath the water table, thereby increasing susceptibility to liquefaction
during an earthquake. Coastal margins in Christchurch may be more vulnerable to liquefaction
risk due to the combined effects of sea-level rise and ground motion due to earthquakes.
Land loss in Canterbury due to sea level rise includes the following Department of
Conservation ecosystem management units:
o Brooklands
o Horseshoe Lagoon
o Opihi River mouth
o Te Waihora
o Wainono (Tait, 2019).
5.1.2 Water (freshwater, estuarine, marine)
Water supply will be directly affected by climate change via decreasing rainfall and indirectly
via decreasing groundwater recharge and drainage from irrigated and un-irrigated land (Bright
et al., 2011). Where surface water is used for irrigation it substantially mitigates the effects of
climate change on groundwater recharge. The lack of a sufficiently reliable source of surface
water for irrigation will limit the size of both the groundwater supplied irrigation area and the
surface water supplied area, to a total area well short of the potentially irrigable area on the
Canterbury Plains (Bright et al., 2011).
Water quality will be affected by changes in climate and extreme weather both directly and
indirectly. Changes in river flow and water temperature are expected to cause declining water
quality in receiving water bodies (Collins et al., 2012) due to stratification limiting the mixing of
oxygen and nutrients through the water column (McGlone & Walker, 2011). For example, Trolle
et al. (2011) found that increasing air temperature, especially in summer would lead to
eutrophication in Lake Ellsemere. Bores near the coast will have an increased risk of saltwater
intrusion (Kouvelis et al., 2010). Areas with increased frequency and durations of very low
river/stream flows may contribute to increased variability of dissolved oxygen and pH regimes
(Kouvelis et al., 2010). This will cause negative impacts on instream ecology which could be
compounded by increased temperatures leading to a higher risk of nuisance algae blooms,
pest fish or other unwanted organisms (Kouvelis et al., 2010).
14 Environment Canterbury Technical ReportClimate change impacts for Canterbury: a summary of the literature
Lake levels of Te Waihora could decrease, leading to reduced frequency and duration of lake
openings (Renwick et al., 2010). It is assumed that the beach barrier height above mean level
of the sea will rise as sea level rises. Projected rising sea levels suggest that the threshold
rules for lake opening will need to be re-assessed in future (Renwick et al., 2010).
Coastal water quality in terms of nutrient levels could be reduced due to a reduction in vertical
mixing/upwelling, coupled with increased freshwater from melting glaciers and increased
precipitation (Office of the Chief Science Advisor, 2013).
The references outlined in sections 5.1.1 and 5.2.2 generally draw on IPCC climate scenarios
which are then downscaled for New Zealand. They therefore use what is considered ‘high’
certainty data to inform the projected impacts. The scale of the impacts is difficult to categorise
though, as these will often depend on future human choices. For instance, future nutrient
concentrations in river outflows and whether increased freshwater will actually reach the coast
is partly contingent on how much water will be used for irrigation due to increasing frequency
of drought. Similarly, the transition to a low-emissions future and the subsequent land use
conversion to forestry could result in decreasing water flows, changing river flow regimes and
increasing water quality due to decreasing sediment loading and nutrient leaching
(Parliamentary Commissioner for the Environment, 2019).
5.1.3 Biological
Environmental change may cause sub-optimal health in some coastal and freshwater species.
For example:
o changes in sediment movement and coastal upwelling of cooler nutrient-rich
ocean waters could have an impact on phytoplankton productivity (Bell, Hume,
& Hicks, 2001)
o ocean acidification could weaken shells of marine organisms and affect the auto-
regulatory systems such as absorption of oxygen and salt balance (Willis et al.,
2007)
o salmon and trout are sensitive to effects on dissolved oxygen and nitrate
concentrations (Collins et al., 2012)
o sea-level rise could increase water levels in wetlands thereby decreasing light
levels and negatively effecting vegetation (Willis et al., 2007)
o increased sediment loads to estuaries could impact ecosystems (Bell et al.,
2001)
o lake stratification causing crowding in the lower layers, where there is less
oxygen, resulting in increased competition for food, and greater susceptibility to
disease transmission (McGlone & Walker, 2011)
o weather extremes (drought and flooding) may cause changes in population
profiles for threatened native species, such as the Kowaro (Canterbury mudfish)
(Meijer et al., 2019).
A key interdependency for coastal species is the influence of freshwater inflows to the coastal
ecosystem, and for freshwater species, is changes in ingress of seawater (Bell et al., 2001).
Other biological impacts of climate change include altering pollinator foraging periods and
behaviour (Howlett, Butler, Nelson, & Donovan, 2013).
Environment Canterbury Technical Report 15Climate change impacts for Canterbury: a summary of the literature
Impacts to physiological functioning of organisms will drive changes in species’ distributions.
For example, terrestrial species’ distributions would move further south, and higher into the
mountains to remain within the same general temperature ranges. Tree species with a wide
tolerance to climate fluctuations, good dispersal capacity, and short generation times could
widen their distribution (Mcfadgen, 2001). However, species populations could also be
threatened where there is little potential for dispersal of suitable species e.g. where sites are
geographically isolated from a native seed source (Mcfadgen, 2001).
Changes in pest and disease species will have flow-on impacts on predator-prey interactions
and biodiversity. For example, an increase in climate suitability (increasing temperatures,
decreasing frosts) could cause increases in:
o Mediterranean fruit fly, particularly in South Canterbury (Kean et al., 2015)
o Pine processionary moth (Thaumetopoea pityocampa) (Watt et al., 2011)
o invasive sub-tropical grass species, particularly on dry, northern slopes in North
Canterbury (Ministry of Agriculture and Forestry, 2010a)
o banana passionfruit (Ministry of Agriculture and Forestry, 2010a)
o Argentine ants (Ministry of Agriculture and Forestry, 2010a)
o fungal diseases affecting P. radiata in New Zealand such as Dothistroma needle
blight and Cyclaneusma needle cast (Watt et al., 2012)
o parasitic diseases like fasciola hepatica affecting sheep, which are predicted to
rise by 186% in Canterbury by 2090 (Haydock et al., 2016).
5.1.4 Ecological
Biological and ecological climate-induced impacts are likely to cause numerous complex
changes throughout food webs (Office of the Chief Science Advisor, 2013). Coastal areas
where freshwater inflows influence the structure or functioning of the coastal ecosystem could
be affected, including significant species and fisheries in these areas (Bell et al., 2001).
Positive impacts on ecosystems could be driven by adaptation planning and an increasing
focus on ecosystem-based management, valuation and measurement of ecosystem services
and ecosystem-based adaptation measures (Rutledge et al., 2011). For example:
• enhancing coastal foredunes which provide natural and cost-effective protection from
coastal erosion, flooding and sea level rise, while maintaining and enhancing the
natural, cultural and amenity values of our beaches (Dahm, Jenks, & Bergin, 2005)
• using native species and habitats in positive ways to build resilience into rural
landscapes (Green, 2014)
• Creating riparian zones using native plants along waterways to reduce nutrient runoff,
reduced in-stream temperatures for native invertebrates, build resilience to flooding
(Green, 2014)
• Restoring wetlands on farmlands to regulate waterflows in times of flood or retaining
it during droughts (Green, 2014).
Provisioning ecosystem services e.g. food, raw materials, and energy are included in the
Economic impacts section.
There are typically ‘high’ levels of certainty for the references cited in Sections 5.1.3 and 5.1.4,
which describe likely interactions and impacts of one-two variables (for example, temperature
increase and pest spread). The level of certainty around impact decreases where two or more
16 Environment Canterbury Technical ReportYou can also read