Sector State of Play: Resource Recovery and Waste - Discussion Document - Infrastructure Commission
←
→
Page content transcription
If your browser does not render page correctly, please read the page content below
Image by Koon Chakhatrakan, Unsplash

                                       Sector State of Play: Resource
                                       Recovery and Waste
                                       Discussion Document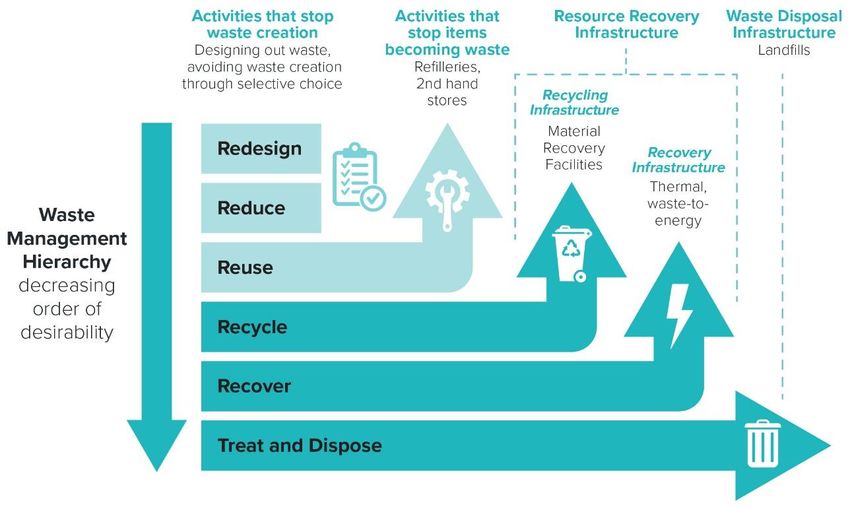
Foreword
Takamua
Our wellbeing depends on our infrastructure
Our way of life depends on infrastructure. Whether it’s moving freight to keep the supermarket
shelves stocked, warming our homes, driving to work or calling our friends, there are few parts
of our lives that don’t rely on the services provided by infrastructure.

Infrastructure decisions have intergenerational impacts, so it is essential that we take a
strategic view of the planning, development and operation of infrastructure in Aotearoa. New
Zealand Infrastructure Commission was formed to give infrastructure this strategic voice, and
the significance of this task is reflected in our Māori name, Te Waihanga, which means
cornerstone.

Our first task is to develop a 30-year strategy for infrastructure - this paper is a part of
this work. It takes a closer look at the current state of play in New Zealand’s resource recovery
and waste sector. By understanding where we are now we can set a course for where we want
to go and the steps we’ll need to take to get there over the next 30 years.

New Zealand faces a range of challenges and opportunities over the next 30 years which will
have significant implications for infrastructure. Our changing climate, rapidly growing cities,
aging population and evolving global technologies will change what we need from
infrastructure in order to maximise the wellbeing of New Zealanders. Each of us has our own
experiences of infrastructure, so we look forward to receiving your feedback to ensure this
State of Play report accurately reflects the current state.

Ross Copland

Sector State of Play: Resource Recovery and Waste                                            Page 2
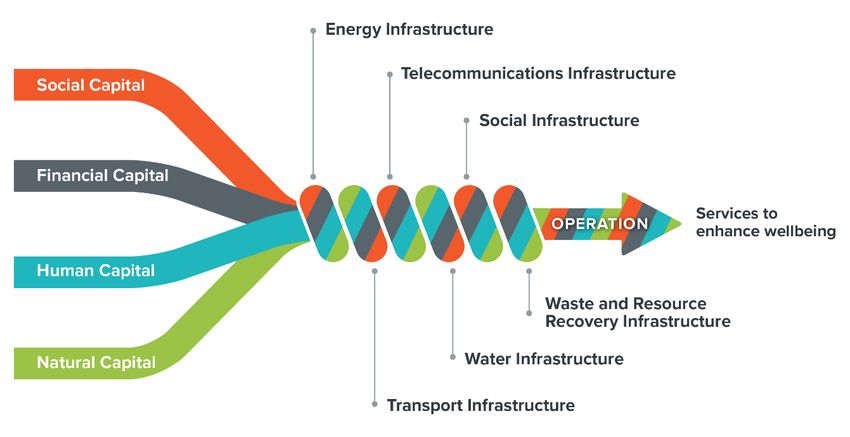
Table of Contents
Ngā Ihirangi
1. Executive Summary .................................................................................................................................................. 7

2. Context ........................................................................................................................................................................ 9

     2.1. Who we are and what we do? ..................................................................................................................................... 9

     2.2. About our sector State of Plays ................................................................................................................................... 9

              2.2.1.         About the Resource Recovery and Waste State of Play................................................................. 10

     2.3. Our next steps ................................................................................................................................................................. 11

     2.4. Have your say .................................................................................................................................................................. 11

3. About the resource recovery and waste system ............................................................................................. 12

     3.1. Waste, resource recovery and the circular economy ....................................................................................... 12

     3.2. He tirohanga Māori i te para me hangarua | Māori views on waste and recycling ............................. 13

     3.3. Physical Infrastructure .................................................................................................................................................. 14

              3.3.1.         Resource Recovery Infrastructure ........................................................................................................... 14

              3.3.2.         Waste disposal infrastructure ................................................................................................................... 18

     3.4. Services .............................................................................................................................................................................. 20

              3.4.1.         Access to resource recovery infrastructure ......................................................................................... 20

     3.5. Wellbeing .......................................................................................................................................................................... 21

              3.5.1.         Economic and environmental potential of resource recovery..................................................... 22

              3.5.2.         Wellbeing impacts of waste disposal .................................................................................................... 23

     3.6. Capitals .............................................................................................................................................................................. 24

              3.6.1.         Resource recovery infrastructure ............................................................................................................ 24

              3.6.2.         Waste disposal infrastructure ................................................................................................................... 24

4. What shapes the resource recovery and waste disposal sector today? ................................................... 26

     4.1. Regulatory environment ............................................................................................................................................. 26

              4.1.1.         Waste Minimisation Act 2008 ................................................................................................................... 26

              4.1.2.         Resource Management Act 1991 ............................................................................................................ 26

              4.1.3.         Other Legislation ........................................................................................................................................... 27

     4.2. Ownership and governance ....................................................................................................................................... 27

              4.2.1.         Ownership of resource recovery and waste disposal infrastructure ......................................... 27

              4.2.2.         Governance of the waste sector .............................................................................................................. 27

     4.3. Market structure and funding .................................................................................................................................. 29

Sector State of Play: Resource Recovery and Waste                                                                                                                                         Page 3
4.3.1.         Waste contracting ......................................................................................................................................... 29

             4.3.2.         Waste Disposal Levy ..................................................................................................................................... 29

             4.3.3.         Waste commodity markets (post collection) ...................................................................................... 30

     4.4. Issues the sector is facing today .............................................................................................................................. 31

             4.4.1.         Lack of quality data....................................................................................................................................... 31

             4.4.2.         Current policy changes and emerging waste streams .................................................................... 32

             4.4.3.         Viable markets for outputs ........................................................................................................................ 33

             4.4.4.         Onshore vs offshore processing of waste ............................................................................................ 34

             4.4.5.         Adaption to climate change and remediation of vulnerable landfills ...................................... 34

     4.5. Waste to Landfill............................................................................................................................................................. 35

     4.6. Resource recovery rates by activity source .......................................................................................................... 36

5. How is the resource recovery and waste sector responding to what might come next? ................... 39

     5.1. Transition to a circular economy ............................................................................................................................. 39

     5.2. Climate change mitigation and adaptation ......................................................................................................... 39

     5.3. Waste-to-energy ............................................................................................................................................................ 40

     5.4. Landfill mining................................................................................................................................................................. 40

6. Conclusion ................................................................................................................................................................ 41

7. Appendix 1: Waste Material Flows ..................................................................................................................... 42

8. Appendix 2: Process, assumptions and limitations ....................................................................................... 48

     8.1. Our process ...................................................................................................................................................................... 48

9. Appendix 3: References ........................................................................................................................................ 49

Sector State of Play: Resource Recovery and Waste                                                                                                                                     Page 4
Figures Ngā Tau Figure 1: Te Waihanga’s definition of infrastructure ........................................................................................................ 10 Figure 2: Waste minimisation hierarchy and resource recovery and disposal infrastructure (Te Waihanga, New Zealand Infrastructure Commission, 2020, adapted from s44 Waste Minimisation Act 2008 and Auckland Council, 2018). ............................................................................................................................................................. 14 Figure 3: Waste (tonnes) disposed of in Class 1 Landfills 2010 - 2019 ..................................................................... 35 Figure 4: OECD Indicator: municipal waste to landfill per capita (kg/pop), 2018 ................................................. 36 Figure 5: Total recovery rate by country ............................................................................................................................... 37 Figure 6: International municipal solid waste recovery rates (2016-2017) compared to New Zealand’s 2015 estimated rate....................................................................................................................................................................... 38 Sector State of Play: Resource Recovery and Waste Page 5
Tables
Ngā Ripanga
Table 1: Onshore processing capacity by waste stream and product ....................................................................... 16
Table 2: Description and number of different landfill types in New Zealand ........................................................ 19
Table 3: Potential extractable materials by key waste type ........................................................................................... 22
Table 4: New Zealand’s estimated 2015 recovery rate by activity source ............................................................... 36

Sector State of Play: Resource Recovery and Waste                                                                                                 Page 6
1. Executive Summary
Whakarāpopototanga
This paper seeks to document the state of play in the resource recovery and waste sector in New
Zealand with a focus on the infrastructure used to manage New Zealand’s waste. This includes landfills,
material recovery facilities, and processing facilities.

New Zealanders dispose of ~15 million tonnes of waste 1 every year.2 This waste comes from a range of
sources including: 3,4

• 1.8 million tonnes (12%) from municipal sources including domestic kerbside and other residential
  sources;
• 3.6 million tonnes (24%) from commercial and industrial sources;
• 4.4 million tonnes (29%) from construction and demolition sources;
• 1.5 million tonnes (10%) from rural sources.

This equates to around 3,200kg of waste per person per year,5 of which only approximately 35% is
recovered.6 The rest is sent to landfill,7 which creates environmental risks and contributes 4.6% of New
Zealand’s gross greenhouse gas emissions profile.8 When compared to other members of the OECD,
there is room for improvement. Of the available international examples, New Zealanders send the most
municipal waste9 to landfill per capita,10 and we have the lowest municipal solid waste recovery rate,11
behind the US, Australia and the UK. This is at least partially due to the location of resource recovery
infrastructure and the cost of transportation. Resource recovery assets are predominantly located in
urban areas, particularly around Auckland, meaning that in many parts of the country it is not cost-
effective to recycle waste.

This could support the conclusion that more recycling infrastructure is needed to divert waste from
landfill, and it has been estimated that between $2.1-2.6 billion of additional capital investment is
needed,12 along with an additional $0.9 billion in operational funding over the next 10 years.13 This

1
  Including Virgin Excavated Natural Material.
2
  Wilson et al., The New Zealand Waste Disposal Levy: Potential Impacts of Adjustments to the Current Levy Rate and Structure
(Eunomia Research & Consulting, 2017), 79.
3
  Ibid, 79.
4
  Other waste activity sources are landscaping, virgin excavated natural materials and special sources.
5
  “Population”, Stats NZ, accessed January 22, 2021, https://www.stats.govt.nz/topics/population
Calculated based on New Zealand’s population in December 2015 to align with 2015 waste data provided in Wilson et al.
6
  Wilson et al., The New Zealand Waste Disposal Levy: Potential Impacts of Adjustments to the Current Levy Rate and Structure.
Eunomia Research & Consulting, 2017, 79.
7
  Including farm dumps.
8
  Ministry for the Environment, New Zealand’s Greenhouse Gas Inventory 1990–2018 (Wellington: Ministry for the Environment,
2020), 349.
9
  The OECD defines municipal waste as waste collected and treated by or for municipalities. It covers waste from households,
including bulky waste, similar waste from commerce and trade, office buildings, institutions and small businesses, as well as yard
and garden waste, street sweepings, the contents of litter containers, and market cleansing waste if managed as household waste.
The definition excludes waste from municipal sewage networks and treatment, as well as waste from construction and demolition
activities.
10
   “Municipal Waste,” OECD, accessed November 10, 2020, https://www.oecd-ilibrary.org/environment/municipal-
waste/indicator/english_89d5679a-en.
11
   Ibid, 3.
12
   Ministry for the Environment, Regulatory Impact Statement: Increase and Expansion of Waste Disposal Levy (Ministry for the
Environment, 2020), 22.
13
   Ibid, 7.

Sector State of Play: Resource Recovery and Waste                                                                            Page 7
potential infrastructure gap could be further exacerbated if changes to local and overseas policy mean
less of our waste can be sent offshore for processing.

However, while resource recovery and waste infrastructure is a current focus of Te Waihanga, it is
important to acknowledge that more processing capacity or capability is not the only way to improve
the different components of the waste hierarchy, which prioritises avoiding waste through redesign,
reduction, and reuse. Mechanisms for achieving this include legislation; improved procurement practices
to incentivise approaches that minimise waste such as prefabrication to avoid construction waste; and
extended producer responsibility such as container return schemes. While these mechanisms are beyond
the scope of this paper, they impact the resource recovery and waste sector, and the infrastructure that
will be required in the future.

Key factors that affect the operation of the resource recovery and waste infrastructure are:

•    Policy and legislation that controls the types of waste that can be created or discarded
•    Price of disposal at a landfill compared to a recycling facility
•    Demand for the recycling outputs either locally or internationally
•    Policy in overseas jurisdictions which sets the types and quality of waste that can be imported.

These factors can change relatively quickly. This means that rigid, long-lived infrastructure assets sit in a
dynamic system. With most new resource recovery and waste infrastructure operated, and at least
partially funded, by the private sector, this uncertainty can result in stalled investment. As such, a
consistent waste policy direction is important for investment certainty and ensuring that recovery
opportunities are desirable to the market.

A further barrier to investment decision-making is the reported lack of consistent, high-quality data at a
national level. While territorial authorities may have good information available locally, there are no
nationally agreed data standards or reporting mechanisms, which means New Zealand lacks information
to support a fulsome national snapshot for policy, planning or performance measurement purposes.

While the importance of the services provided by resource recovery and waste infrastructure to New
Zealander’s wellbeing might seem obvious – removing waste from our homes, businesses, and our
streets – the short and long-term impacts are more complicated. There are environmental, social and
cultural implications associated with how we manage waste today, particularly when we send it to
landfill.

Already, we are dealing with the impacts of decisions made in the past. There are at least 110 closed
landfills around New Zealand that have been reported to be vulnerable to sea level rise, creating
environmental and health risks, as well as ongoing costs for councils.14 The need to respond to climate
change adaptation and mitigation will likely shape the sector in the coming decades.

Finally, if New Zealand is to realise the promise of a circular economy where resources are kept in use for
as long as possible, and reduce the impact on the environment from landfilling, then both the supply of
waste and demand for recycled material will need to change.

 Tom Simonson and Grace Hall, Vulnerable: The Quantum of Local Government Infrastructure Exposed to Sea Level Rise (Local
14

Government New Zealand, 2019), 37.

Sector State of Play: Resource Recovery and Waste                                                                       Page 8
2. Context
Horopaki
2.1. Who we are and what we do?
The New Zealand Infrastructure Commission, Te Waihanga is working to improve New Zealanders’ lives
through better infrastructure. It aims to lift the level at which infrastructure is planned and delivered,
taking a strategic approach so that we maximise the social return on our collective
dollar and stand well prepared in the face of an uncertain future.

Our Māori name, Te Waihanga, means a cornerstone, or to make, create, develop, build, construct,
generate. Te Waihanga reflects the significance of long-term planning in shaping New Zealand’s future.

A major part of this work is the development of a 30-year strategy for infrastructure. The strategy will
look ahead to 2050, and consider how infrastructure might support environmental, social, cultural and
economic wellbeing for all New Zealanders. This will be delivered to the government in September 2021
and will set out how we can make sure our investment in infrastructure delivers what we need, where we
need it and at the right time.

2.2. About our sector State of Plays
We understand that our infrastructure works together - it is a system of systems. Our roads carry pipes
and powerlines, and they connect to homes, workplaces and schools. For this reason, our strategy will
focus on cross-cutting themes rather than infrastructure sectors in isolation. However, we believe it’s
important we understand the infrastructure we have today, why we have what we have, and how it’s
already contributing to New Zealanders’ wellbeing.

The sector State of Plays are structured around the components of Te Waihanga’s working definition of
infrastructure, set out in our discussion document, “Infrastructure Under One Roof”. 15 Our definition
places wellbeing at the core, while recognising commonalities, including the use of capital such as
financial and environmental resources; the interconnectedness of physical structures; and the delivery of
shared services, as well as the wellbeing benefits we get from those shared services. In short, Te
Waihanga defines infrastructure as follows:

     “A system of inter-connected physical structures that employ capital to provide shared services to
                                          enhance wellbeing.”

Figure 1 illustrates the components of our working definition, showing how they are related to one
another in delivering wellbeing services.

15
   NZ Infrastructure Commission, Infrastructure under one roof: Standardising how we think about the shared services around us (NZ
Infrastructure Commission, 2020), 3.

Sector State of Play: Resource Recovery and Waste                                                                           Page 9
Figure 1: Te Waihanga’s definition of infrastructure By defining infrastructure in this way, we have then been able to develop a common framework to think about the integrated management of infrastructure. This considers the relationship between the enabling environment for our infrastructure, the sustainable use of the capitals employed in its development, the investment management process and the wellbeing benefits created by infrastructure services. Our sector State of Plays are the result of desktop research, augmented by insights from our survey of infrastructure asset owners, and engagement with sector experts. These reports will be updated over time. We want to improve the picture as our understanding grows and different elements come in to focus. 2.2.1. About the Resource Recovery and Waste State of Play This State of Play is the first time that New Zealand’s resource recovery and waste disposal sector has been evaluated in New Zealand from an infrastructure perspective. The intention is to characterise how the infrastructure component of the system is contributing to the enhancement of wellbeing for New Zealanders, as well as considering how infrastructure is affected by changing market, regulatory and governance settings. The State of Play provides a summary of what infrastructure currently exists to deal with New Zealand’s waste and how it is performing (to the extent that this information is available). The State of Play also summarises issues the sector is facing in the short and medium, to long-term. The State of Play does not provide a general review of New Zealand’s waste policy and regulatory settings, where those settings do not influence existing infrastructure. Considering this, we would like to acknowledge the Ministry for the Environment’s ongoing resource efficiency work policy work programme aiming to incentivise a circular economy and avoid and minimise waste as well, as the projects funded via the Waste Minimisation Fund. Sector State of Play: Resource Recovery and Waste Page 10
2.3. Our next steps
As well as continuing to build on our picture of the State of Play, next steps include building our
understanding of future trends and likely challenges, including climate change, incorporation of
Mātauranga Māori, demographic change, and the role of technology. We will look at what our way of
life might be 30 years from now. Based on all of this, we will begin to make recommendations as to how
infrastructure might support New Zealand’s future wellbeing.

We’ll share our thinking on what will be included in the strategy, focusing on the cross-cutting themes
that affect all sectors, the opportunities and challenges we can expect in the future, as well as our initial
recommendations and options for consideration.

This will then be followed by a consultation document the engages stakeholders on the critical
questions we face and begin to test recommendations as we develop the draft infrastructure strategy
that will presented to the Minister for Infrastructure.

2.4. Have your say
We’ll share our work as we go and are keen to hear what you think, starting now. Tell us what you think
about our State of Play reports – have we got it right or are there issues, information or problems that
we’ve missed?

You’ll also have the opportunity to comment on the draft strategy. We’ll be continually refining and
assessing our work based on the feedback we get from you and others.

Sector State of Play: Resource Recovery and Waste                                                       Page 11
3. About the resource recovery and waste
   system
E pā ana ki te whakahōu rawa me te
pūnaha para
3.1. Waste, resource recovery and the circular economy
Waste is anything disposed of or discarded. 16 It is the by-product of modern life, a growing population,
economic activity, and increasing consumption. In New Zealand approximately 15 million tonnes of
waste (of all types)17 was disposed of in 2015.18 This waste comes from a range of sources including: 19,20

• 1.8 million tonnes (12%) from municipal sources including domestic kerbside and other residential
  sources
• 3.6 million tonnes (24%) from commercial and industrial sources
• 4.4 million tonnes (29%) from construction and demolition sources
• 1.5 million tonnes (10%) from rural sources.

However, just because something is thrown away does not mean that it is valueless. Many of the
materials that are disposed of in New Zealand have potential value due to their ability to be reused in
their existing state, because their composite raw materials can be extracted through recycling or their
calorific value can be used to displace other fuel sources through waste-to-energy infrastructure.

The ability to extract value from waste is dependent on the processes and infrastructure available.
Recycling and resource recovery relies on proximity and the ability to collect the waste from the point of
creation, as well as the availability of the infrastructure required to sort the waste and process it into
recyclates that can be used in new manufacturing systems. In 2015, 32% of municipal solid waste,21 62%
of industrial and commercial waste, and 28% of construction and demolition 22 was recovered.23 The total
recovery rate on a volume basis was estimated to be 35%.24

Preventing materials from becoming waste, or processing waste to extract the resources within it,
presents economic and environmental benefits, and potentially avoids costs, including:

• Displacing the costs of extracting and manufacturing virgin materials
• Reducing the energy use and carbon emissions associated with the extraction, transportation and
  fabrication of virgin materials

16
   Waste Minimisation Act 2008, s 5.
17
   Including Virgin Excavated Natural Material.
18
   Wilson et al., The New Zealand Waste Disposal Levy: Potential Impacts of Adjustments to the Current Levy Rate and Structure
(Eunomia Research & Consulting, 2017), 79.
19
   Ibid.
20
   Other waste activity sources are landscaping, virgin excavated natural materials and special sources.
21
   Including Domestic Kerbside and other residential sources.
22
   Excluding Virgin Excavated Natural Material.
23
   Wilson et al., The New Zealand Waste Disposal Levy: Potential Impacts of Adjustments to the Current Levy Rate and Structure
(Eunomia Research & Consulting, 2017), 79.
24
   Ibid.

Sector State of Play: Resource Recovery and Waste                                                                           Page 12
• Avoiding the economic and environmental costs (such as leachates and discharges) associated with
  the long-term management of waste in landfills.

Recovering the value which exists within waste is consistent with the circular economy model, which
aims to keep resources in use for as long as possible, extract the maximum value from them whilst in
use, then recover and regenerate products and materials at the end of their service life.25,26 When a
product is designed for the longest use possible, and can be easily repaired, remanufactured, recycled,
or composted, it has a circular lifecycle. Accelerating the adoption of the circular economy is a key
outcome of United Nations Sustainable Development Goal 12: Responsible Consumption and
Development27, which aims to decouple economic growth from environmental degradation, and reduce
waste generation through prevention, reduction, recycling and reuse.

The waste hierarchy sets out an order of preference for the management of waste materials, with (in
descending order of preference):28

• Redesign: avoiding the generation of waste through design
• Reduce: making decisions which minimise waste
• Re-use: further use of products for their original or a similar purpose
• Recycling: reprocessing waste materials to produce new products of similar value. In some cases,
  items will be recycled to a product of higher or lower value. This is referred to as upcycling or
  downcycling respectively
• Recovery: extraction of materials or energy from waste for further use
• Treatment and disposal: processing the waste so that it can be disposed of to land (in landfill) with
  reduced or no significant effect on the environment.29

3.2. He tirohanga Māori i te para me hangarua | Māori views on waste
     and recycling30
The Māori view of resource recovery and waste is consistent with the principles of a circular economy, as
articulated by WasteMINZ:31

          “He tirohanga Māori i te para me te mahi hangarua (Māori views on waste and recycling)
          emphasise whakapapa (genealogical) connections between humans and the natural world.

          The respect for natural resources and the materials made from them is demonstrated by
          maintaining their value for as long as possible before they reach the end of their life, at which
          point they are disposed of in a way that causes the least harm to Papatūānuku. In this way, he
          tirohanga Māori i te para precedes the concept of a circular economy (ōhanga āmiomio) but
          similarly acknowledges the mauri (life force) of natural resources.”

25
   “Circular Economy ‒ Ōhanga āmiomio,” Ministry for the Environment, accessed November 10, 2020.
https://www.mfe.govt.nz/waste/circular-economy.
26
    “What Is the Circular Economy?,” Ellen MacArthur Foundation, accessed November 10, 2020,
https://www.ellenmacarthurfoundation.org/circular-economy/what-is-the-circular-economy.
27
   “Sustainable Development Goals,” United Nations Development Programme, September 2015.
http://www.undp.org/content/undp/en/home/sustainable-development-goals.html.
28
    Auckland Council, Te Mahere Whakahaere me te Whakaiti Tukunga Para I Tāmaki Makaurau 2018 Auckland Waste Management
and Minimisation Plan 2018, (Auckland Council, 2018), 19.
29
    Note that Section 44 of the Waste Minimisation Act 2008 treats treatment and disposal as two separate stages of the Waste
Hierarchy.
30
    Sarah Pritchett and Sunshine Yates, Recommendations for Standardisation of Kerbside Collections in Aotearoa (Wellington:
Ministry for the Environment, 2020), 9-10.
31
    WasteMINZ, or the Waste Management Institute of New Zealand, is the largest representative body of the waste, resource
recovery and contaminated land sectors in New Zealand.

Sector State of Play: Resource Recovery and Waste                                                                      Page 13
3.3. Physical Infrastructure New Zealand’s waste management infrastructure sits across the waste hierarchy: comprising resource recovery (recycling and recovery) infrastructure and waste disposal (treat and dispose) infrastructure. These distinct infrastructure systems sit at different levels of the waste hierarchy, and collectively operate to accept and deal with New Zealanders' waste, as demonstrated in Figure 2. We note that in accordance with the waste hierarchy, recycling is preferable to recovery despite the grouping of these two activities from an infrastructure perspective (as per Figure 2). Figure 2: Waste minimisation hierarchy and resource recovery and disposal infrastructure (Te Waihanga, New Zealand Infrastructure Commission, 2020, adapted from s44 Waste Minimisation Act 2008 and Auckland Council, 2018). This infrastructure is distinct from actions which sit further up the waste management hierarchy, such as redesigning or reducing, which aims to reduce the amount of waste created, or activities to avoid waste being discarded (i.e. refillaries or repair shops). While these activities are incredibly important to reducing the total waste generated in New Zealand, they are most often components in other manufacturing or product systems and sit outside the scope of physical resource recovery and waste infrastructure for this analysis.32 3.3.1. Resource Recovery Infrastructure In this report we have use the term “Resource Recovery Infrastructure” to describe the systems that extract value from materials at the end-of-life. This includes collection, disaggregation into separate waste types, processing and extraction of recyclates or other resources, such as energy. This approach is aligned to the circular economy model. Infrastructure within this system includes: 32 The transition to a circular economy is considered at how is the resource recovery and waste sector responding to what might come next? Sector State of Play: Resource Recovery and Waste Page 14
• Material recovery facilities, which sort and separate recoverable materials
• Processing plants, which extract materials from waste to the point that the recyclates become
  suitable to become the input to other manufacturing systems in place of virgin materials
• Facilities such as waste-to-energy plants which, if there is no other value that can be extracted, can
  recover energy from waste.

Material recovery facilities
Material recovery facilities normally receive waste from municipal sources – typically kerbside and
commercial sources, with some also receiving materials from public place recycling – and construction
sites. They separate recyclables into baled commodities for sale into recycling markets. Material recovery
facilities remove contamination and sort collected materials into types and grades. They can range in
operation from simple manual sort lines, to fully automated facilities. The types of processes required at
each Material Recovery Facility are dependent on the waste collection methodology used, for example, if
the waste is comingled versus collected separately.

For the purposes of this assessment, material recovery facilities are categorised into the two main types
currently operating in New Zealand: recycling material recovery facilities and construction and
demolition material recovery facilities.

Recycling material recovery facilities

There are approximately 15 recycling material recovery facilities of notable size across New Zealand with
wide ranging capacity. The facilities in Auckland and Christchurch manage approximately 70% of the
total national municipal volume (approximately 200,000t per annum). The remaining 13 material
recovery facilities operate at the 1,000-10,000t per annum scale. In 2018, the 15 material recovery
facilities had a combined capacity to process 283,000t of materials from municipal sources, producing an
estimated 225,000t of recycled commodities for sale.33

As part of the Covid-19 Response and Recovery Fund, the Government has committed funding to
improve the sorting ability of existing material recovery facilities in Auckland, Thames, New Plymouth
and Christchurch, and to support new facilities in Hamilton and Napier.34

There is no national data available in the public domain to determine how effective material recovery
facilities are at separating out waste streams; however, it is estimated that material recovery facilities
processing mixed recycling streams have on average 10-15% contamination with other materials,35
although post-Covid, Christchurch City Council has recorded a contamination rate of as much as 42%. 36
Contamination reduces the volume of material recycled, and diminishes the overall return per tonne.

Construction and demolition material recovery facilities

Construction and demolition waste includes broken concrete, glass, plasterboard, disused wood
products, brick, metal, dirt and plastics. It excludes hazardous waste, such as asbestos and
polychlorinated biphenyls. It is estimated that construction and demolition waste makes up about half of
the total waste generated in New Zealand. 37

33
   Duncan Wilson, Lisa Eve, and Andy Grant, National Resource Recovery Project - Situational Analysis Report (Ministry for the
Environment, 2018), 18-20.
34
   “More Action on Waste – Government Funds Recycling Infrastructure, Moves to Standardise Kerbside Collections’,” The Beehive,
August 26, 2020. http://www.beehive.govt.nz/release/more-action-waste-%E2%80%93-government-funds-recycling-
infrastructure-moves-standardise-kerbside.
35
   Duncan Wilson, Lisa Eve, and Andy Grant, National Resource Recovery Project - Situational Analysis Report (Ministry for the
Environment, 2018), 47.
36
   Sally Murphy. “Nearly Half of Christchurch Recycling Contaminated, Heads to Landfill.” RNZ, September 23, 2020,
https://www.rnz.co.nz/news/national/426761/nearly-half-of-christchurch-recycling-contaminated-heads-to-landfill.
37
   “Minimising Waste When Building.” BRANZ Ltd, accessed November 19, 2020

Sector State of Play: Resource Recovery and Waste                                                                        Page 15
Just like municipal waste, construction and demolition waste can be disaggregated to specific waste
streams, which are separated at sorting facilities. There are four construction and demolition waste
sorting facilities in New Zealand, two in Auckland, one in Meremere, and one in Wellington. The
combined capacity of these plants is not available in the public domain, although Green Gorilla
(Auckland), who operate the most comprehensive construction and demolition material recovery facility,
state they divert 75,000t of waste from landfill each year by separating the waste material to allow
recycling, including wood products (which are converted to wood chip and used as a fuel), metals,
aggregate and plasterboard (from which gypsum can be recovered).38

There are also two concrete crushing facilities in Auckland that crush waste concrete into aggregate,
which can be reused in the construction sector, as well freeing the re-bar or steel mesh for recycling.

Processing plants
Processing plants accept disaggregated waste streams and process them to a level which enables them
to be reused as an input in place of (or in addition to) virgin materials in another product system. Each
waste stream requires a different type of infrastructure to process. A more detailed analysis of waste
streams and their treatment is provided in Appendix 1.

Due to the difficulty in collection, and about commercial sensitivity in reporting, there is limited data
about the net onshore capacity of processing plants in New Zealand 39; however a summary of waste
streams, and the infrastructure used to create recyclates in New Zealand is provided in Table 1.

Table 1: Onshore processing capacity by waste stream and product

 Waste Product           End Product                                  Current Processing Infrastructure

 Glass                   Cullet (for use in new glass                 One beneficiation plant in Auckland40
                         products)

                         Fines (for use in aggregates)                Nine glass crushers (3 North Island and 6
                                                                      South Island)

 Paper and               Pulp                                         Two fibre processing plants, in Auckland and
 Cardboard                                                            Hawkes Bay
 (Fibre)

 Plastics41              Plastic 1: polyethylene                      Multiple processors, with more under
                         terephthalate (PET)                          construction

                         Plastic 2: high density                      Multiple processors
                         polyethylene (HDPE)

http://www.level.org.nz/material-use/minimising-waste/
38
   “Waste Processing Facility,” Green Gorilla, accessed November 24, 2020, https://www.greengorilla.co.nz/processing-facility/.
39
   This issue is discussed in fuller detail at ‘Issues the sector is facing today’ section.
40
   Beneficiation is a process where items associated with the sorted glass are removed to stop contamination (i.e. bottle tops,
metals and labels).
41
   For all plastics, there are no processors that accept recyclates and process them into resin as a saleable product to input into
new manufacturing systems in place of virgin materials. All processors that we are aware of integrate recyclate into their
production of new plastic products e.g. Flight Plastics.

Sector State of Play: Resource Recovery and Waste                                                                               Page 16
Waste Product End Product Current Processing Infrastructure
Plastic 5 polypropylene (PP) Multiple processers
Plastics 3, 4, 6, 7: polyvinyl Very limited infrastructure (some small-scale
chloride (PVC), low density processors).
polyethylene (LDPE),
polystyrene (PS), all others
(including composites).
Metals Ferrous metals (steel and iron) Nine scrap metal recycling centres located
throughout the country.
Non-ferrous metals (aluminium, Large quantities of unprocessed waste metal
copper and lead) are exported directly from Material Recovery
Facilities.
Organic Waste Compost, fertiliser or animal There are a large number of facilities that
feed, biogas process organic waste. There is one
anerobic digestion plant under construction
in Reporoa which will produce biogas and
fertiliser.
E-Waste Precious metals, metals, glass, Estimated 19 e-waste processing facilities in
plastics New Zealand
Textiles Textile reuse, rags or recovered There is no widescale onshore processing
fabrics infrastructure for textiles
Tyres and Crumb rubber, tyre-derived fuel There is no processing infrastructure with
rubber the ability to recover waste rubber.
There are two tyre shredders in New
Zealand which shred rubber to enable
processing into end uses (such as tyre-
derived fuel).
Hazardous Limited end uses There is limited wide-scale recycling or
waste recovery processors. However some product
stewardship schemes exist, although these
often depend on final reprocessing offshore.
Sector State of Play: Resource Recovery and Waste Page 17Waste-to-energy infrastructure Waste-to-energy is a type of waste processing infrastructure where waste (or waste derivatives such as landfill gas) are used to generate electricity, as well as potentially other co-products (such as heat or compost). There are two main types of waste-to-energy technology: thermal and non-thermal. Non-thermal waste-to-energy includes anaerobic digestion and hydrolysis technology. This is where biogas is captured from the decomposition of organic material and then used to generate electricity. This type of waste-to-energy facility is under development in New Zealand at present, with New Zealand’s first food waste-to-energy (and compositing) plant currently being constructed in Reporoa. 42 The facility is co-funded by private finance and a NZ$7 million loan from the Provincial Growth Fund, and will be operational from 2022. Landfill gas capture is also used for non-thermal waste-to-energy generation. For example, Waste Management extracts approximately 36 million cubic metres of methane out of Auckland’s Redvale Landfill per year, which generates enough energy to power the equivalent of 14,000 homes.43 Once closed, Redvale Energy Park will continue to generate energy, albeit it at a declining rate, over the following 25 to 30 years. This activity however is not considered ‘recycling’ from a waste hierarchy perspective, due to the gas being a by-product of disposal. Thermal waste-to-energy is the most common form of waste-to-energy technology internationally. Thermal waste-to-energy is a form of recovery which uses combustion, ranging from incineration (direct combustion or mass burn) and coprocessing, to more advanced methods such as pyrolysis and gasification. There are a number of biomass boilers in use across New Zealand that take pellets generated from wood waste as fuel. These are increasingly viewed as part of the solution for transitioning away from fossil fuels, particularly in industrial manufacturing. However, there are barriers to the establishment of thermal waste-to-energy plants that use municipal waste as fuel, including community perception of potential harm to the environment and human health, threats to cannibalising recycling programmes, and the consistency (quality and quantity) of feedstock. 44, 45 Waste-to-energy using municipal solid waste as a feedstock is popular in jurisdictions overseas where there isn’t the space to create landfills, or where it replaces higher carbon intensity energy production, such as coal. Resource recovery centres Often, as a result of lack of access to resource recovery infrastructure, councils and community groups have established facilities to collect materials at the end of their useful life, which are then sorted, assessed for resale (typically onsite or in affiliated an second-hand store), or transferred to processors. There are 21 community-run resource recovery centres in New Zealand, but information on the total capacity of these facilities is not publicly available. 3.3.2. Waste disposal infrastructure Waste disposal infrastructure is used for the treatment and disposal of waste. Its scope includes the collection of residual waste (waste not processed through resource recovery infrastructure) from point of creation, through transfer stations, to the treatment of waste to ensure that it is inert (for example, contaminated soils and hazardous waste) and finally disposal to landfill. 42 RNZ “First Large-Scale Food Waste-to-Bioenergy Facility Construction Begins,” RNZ, August 4, 2020. https://www.rnz.co.nz/news/national/422742/first-large-scale-food-waste-to-bioenergy-facility-construction-begins. 43 PMCSA, Rethinking Plastics in Aotearoa New Zealand (Office of the Prime Minister’s Chief Science Advisor, 2019), 151. 44 Nick Robertson and Merewyn Groom, Waste to Energy: The Incineration Option, (BERL, 2019), 23. 45 Ministry for the Environment, A waste to energy guide for New Zealand (Wellington: Ministry for the Environment, 2020), 10. Sector State of Play: Resource Recovery and Waste Page 18
Disposing of waste requires decades of ongoing management of disposal sites to control environmental
and human health risks, including greenhouse gas emissions, leachates and risks from severe weather
events and sea level rise which can compromise the integrity of landfills.

Landfills
Landfills are divided into classes depending on the types of waste they accept (see Table 2). Most
municipal (Class 1) landfills are owned by territorial authorities, while just five are privately owned and
three are owned by a joint venture between councils and the private sector.

Municipal landfills are operated either by territorial authorities, under contract to a private operator or in
public-private partnership. Other types of landfill are mostly operated by the private sector.

Table 2: Description and number of different landfill types in New Zealand 46

     Class                    Waste Types Accepted                                                           Number

     Class 1 Landfill –       Solid wastes that could discharge contaminants/emissions,                      41
     Municipal Solid          from households as well as commercial, institutional and/or
     Waste Landfill           industrial sources disposed of at facilities that accept
                              household waste.

     Class 1 Landfill –       Solid wastes that could discharge contaminants/emissions,                      14
                              from a range of industrial sources including steel- or
     Industrial Monofill      aluminium-making and pulp and papermaking.

     Class 2 Landfill –       Solid wastes with lower potential for environmental harm,                      22
     Construction &           including rubble, plasterboard and other construction and
     Demolition               demolition materials.
     Landfill

     Class 3 Landfills –      Contaminated but non-hazardous soils and other inert                           56
     Managed Fill             materials (e.g. rubble) that allow the site to be used for a
                              restricted purpose on closure.

     Class 4 Landfills –      Soils and other inert materials with low levels of                             226
     Controlled Fill          contamination relative to receiving environment, which
                              allow the site to be used for an unrestricted purpose on
                              closure.

     Class 5 Landfills –      Virgin excavated natural materials such as clay, soil and                      Unknown
     Clean Fill               rock.

46
     Ministry for the Environment, Reducing Waste: A More Effective Levy (Wellington: Ministry for the Environment, 2019), 25.

Sector State of Play: Resource Recovery and Waste                                                                                Page 19
Farm dumps
It is estimated that there are roughly 47,000, private dumps for disposal on farmland where the waste
comes only from that property.47 These dumps are generally a permitted activity in council plans if they
meet specified criteria (i.e. not on a floodplain, and not containing hazardous substances or sewage).
Historically, farm dumps existed due to geographic boundaries to waste services and the cost associated
with transporting waste off-farm to the correct landfill or recycling facility. Due to the types of waste, it is
possible that farm dumps have a similar, if not greater, collective environmental liability as managed
landfills.
Closed landfills
The exact number of closed landfills is not known, however in 1999 it was estimated that it was in excess
of 1000 (excluding farm dumps).48 In 2014 Tonkin and Taylor, reported that there were approximately
460 closed non-municipal landfills, and another 324 non-municipal landfills which were ‘unknown’ as to
whether they were open or closed.49
3.4. Services
The core service provided by the sector is the collection and management of waste, and in the case of
resource recovery infrastructure, the extraction and processing of materials to enter new product
systems. However, access to these services is not uniform across New Zealand. This section aims to
explore, and characterise, the gaps in service provision through an infrastructure lens.
3.4.1. Access to resource recovery infrastructure
Access to resource recovery services is not standard across the country and can vary between and within
regions. Proximity to urban centres and areas of economic activity currently determine the location of
resource recovery infrastructure. This can create barriers to accessing the services provided by this
infrastructure due to transportation costs, particularly the cost of collection from the point that waste is
created. As a result, rural centres are likely to have greater barriers to accessing resource recovery
services than their urban counterparts.
Municipal collections
Forty-seven percent of New Zealand households have access to co-mingled (where different types of
waste is collected together) recycling services.50 In 2018, 57 council areas provided council-funded
kerbside recycling collection, and 10 had a drop-off or private recycling collection service. Provision of
collection services can create a significant barrier to consumer access to resource recovery infrastructure
compared to waste disposal infrastructure (landfill). 51 For example, Upper Hutt City Council offers a
council waste kerbside disposal scheme to its landfill, but only offers a drop off service for recycling, with
consumers being able to contract with a private (fee paying) kerbside recycling collection service if they
wish.52
47
Ministry for the Environment, Reducing Waste: A More Effective Levy (Wellington: Ministry for the Environment, 2019), 25.
48
Ministry for the Environment, A Guide for the Management of Closing and Closed Landfills in New Zealand (Wellington: Ministry
for the Environment, 2001), 1.
49
Tonkin & Taylor, New Zealand Non-Municipal Landfill Database (Wellington: Ministry for the Environment, 2014), 27.
50
Sarah Pritchett and Sunshine Yates, Recommendations for Standardisation of Kerbside Collections in Aotearoa (Wellington:
Ministry for the Environment, 2020), 13-14.
51
Duncan Wilson, Lisa Eve, and Andy Grant, National Resource Recovery Project - Situational Analysis Report (Ministry for the
Environment, 2018), 71.
52
“Choosing a Waste and Recycling Service,” Upper Hutt City Council, accessed November 10, 2020,
https://www.upperhuttcity.com/Services/Waste-and-recycling/Choosing-a-waste-and-recycling-service.
Sector State of Play: Resource Recovery and Waste Page 20There are further variations in what each council accepts in its recycling collection, which reflects varied access to resource recovery infrastructure. For example, different key councils accept different plastic types, and not all take aerosol cans and aluminium foil. Additionally, there is no standardisation of recycling collection methodology in New Zealand. Councils determine what is collected, how clean the waste must be and whether glass is separated out or not. Co- mingling, especially with glass, tends to lead to higher levels of contamination due to the cost and effort required to separate the component waste streams, and the disintegration of products during collection, which lowers the value of the sorted end product. 53 For example, broken glass mixed with paper/cardboard will damage the fibres leading to a less valuable end product, as well as potentially damaging the machinery at reprocessing plants.54 High levels of contamination of recyclates caused by depositing non-recyclable waste in the wrong bins, either unintentionally or deliberately, or by ‘wish-cycling’55 also decreases the end value of recylcates and the costs of collection and processing. It has been estimated that in Auckland about 12% of each household recycling bin is contaminated.56 This creates an additional burden on the resource recovery sector, making it less economic to deliver services commercially. 3.5. Wellbeing Effective resource recovery and waste disposal systems play a critical role in supporting New Zealanders’ wellbeing by ensuring that waste, once produced, does not accumulate in our homes, streets and unregulated dumps, degrading our environment and health. Resource recovery and waste disposal infrastructure protect environmental, cultural and social wellbeing, as well as potentially creating positive economic outcomes when resources are recovered. Conversely, if our waste management infrastructure is operated sub-optimally, or fails outright, particularly landfills, negative impacts on wellbeing are potentially realised, including: • Environmental: negative impacts on land, water and air – including dust, leachate and greenhouse gas emissions. • Cultural: consequential impacts on the Mauri or health of ecosystems, which negatively impacts cultural wellbeing. Reduced Mauri may be the result of where waste infrastructure is situated, as well as any releases from the infrastructure into the environment. • Social: consequential negative impacts on human health, particularly if waterways or aquifers used for potable water supply are impacted. • Economic: the cost of remediating any incident may have significant financial implications, as well as the loss of potential revenue if resource recovery is sub-optimal. It must be remembered that even though there are environmental, cultural and social implications of the resource recovery and waste disposal system operating in a business-as-usual capacity, these impacts are significantly less than if the infrastructure was not available. Furthermore, negative impacts can be lessened if we move closer towards a circular economy. 53 Auckland Council, “The Cost of Recycling Contamination,” OurAuckland, accessed November 10, 2020, https://ourauckland.aucklandcouncil.govt.nz/articles/news/2020/06/the-cost-of-recycling-contamination/. 54 Duncan Wilson, Lisa Eve, and Andy Grant, National Resource Recovery Project - Situational Analysis Report (Ministry for the Environment, 2018), 47. 55 Wishcycling or aspirational recycling is trying to recycle a waste item that isn’t recyclable in the hope that it will be recycled. 56 Susan Edmunds, ‘“Wishful Thinking about What Can Be Recycled Is an Expensive Mistake.” Stuff, July 28, 2018. https://www.stuff.co.nz/business/105739224/wishful-thinking-about-what-can-be-recycling-is-an-expensive-mistake. Sector State of Play: Resource Recovery and Waste Page 21
You can also read