THE INVESTOR'S GUIDE TO THE NEW ZEALAND SEAFOOD INDUSTRY 2017
←
→
Page content transcription
If your browser does not render page correctly, please read the page content below
THE INVESTOR’S GUIDE TO THE
NEW ZEALAND SEAFOOD INDUSTRY 2017
Part of the New Zealand Food & Beverage Information Project
FINAL REPORT; v1.05; June 2017

STEERING & GUIDANCE                                                                Projected market information, analyses and conclusions contained herein are         Unless otherwise noted, all photos used in this discussion document were
                                                                                   based (unless sourced otherwise) on the information described above and on          provided by the New Zealand Story resource (www.nzstory.govt.nz),
This project would not have been possible without the strong guidance of our       Coriolis’ judgment, and should not be construed as definitive forecasts or          purchased by Coriolis from a range of stock photography providers as
Steering Committee. In particular, we would like to thank Andrew McCallum          guarantees of future performance or results. Neither Coriolis nor its officers,     documented, or are low resolution, complete product/brand for illustrative
of MBIE for his tireless energy in keeping this project on track, while at the     directors, shareholders, employees or agents accept any responsibility or           purposes used under fair dealing/fair use for both “research and study” and
same time pushing us forward.                                                      liability with respect to this document.                                            “review and criticism”. Our usage of them complies with New Zealand law or
                                                                                                                                                                       their various license agreements.
Draft versions of parts of this document were distributed to key firms for         Coriolis wishes to draw your attention to the following limitations of the
comment, addition or correction. This was done in the form of emails and           Coriolis report “New Zealand Seafood Industry 2017“ (the Coriolis Report)           Cover image: New Zealand Story
phone calls. We thank those who helped us in this process for their time and       including any accompanying presentation, appendices and commentary (the
effort. We also thank those who provided their photos.                             Coriolis Commentary):                                                               Where appropriate, this document is Copyright © 2017 Coriolis and MBIE.
                                                                                                                                                                       However, please feel welcome to use, refer to and cite this research.
We are grateful for all of the input we have received, but the report is ours      a. Coriolis has not been asked to independently verify or audit the
and any errors are our own.                                                        information or material provided to it by, or on behalf of the Client, or any of
                                                                                   the parties involved in the project;
Finally, we acknowledge the support of the Ministry of Business, Innovation
and Employment (MBIE), New Zealand Trade and Enterprise (NZTE) and the             b. the information contained in the Coriolis Report and any Coriolis
Ministry of Primary Industries (MPI). It is their funding that has made this       Commentary has been compiled from information and material supplied by
report possible.                                                                   third party sources and publicly available information which may (in part) be
                                                                                   inaccurate or incomplete;
CONSTRAINTS & INHERENT LIMITATIONS
                                                                                   c. Coriolis makes no representation, warranty or guarantee, whether express
This work was commissioned by the Ministry of Business, Innovation and             or implied, as to the quality, accuracy, reliability, currency or completeness of
Employment (MBIE) and prepared by Coriolis. This work is based on                  the information provided in the Coriolis Report and any Coriolis Commentary,
secondary market research, analysis of information available or provided to        or that reasonable care has been taken in compiling or preparing them;
Coriolis by our client, and a range of interviews with industry participants and
industry experts. Coriolis have not independently verified this information        d. the analysis contained in the Coriolis Report and any Coriolis Commentary
and make no representation or warranty, express or implied, that such              are subject to the key assumptions, further qualifications and limitations
information is accurate or complete.                                               included in the Coriolis Report and Coriolis Commentary, and are subject to
                                                                                   significant uncertainties and contingencies, some of which, if not all, are
The report is dated June 2017 and Coriolis accepts no liability for, and has not   outside the control of Coriolis; and
undertaken work in respect of, any event subsequent to that date, which may
affect the report.                                                                 e. any Coriolis Commentary accompanying the Coriolis Report is an integral
                                                                                   part of interpreting the Coriolis Report. Consideration of the Coriolis Report
Key global trade data analysed in all sections of the F&B Information project      will be incomplete if it is reviewed in the absence of the Coriolis Commentary
are calculated and displayed in US$. This is done for a range of reasons:          and Coriolis conclusions may be misinterpreted if the Coriolis Report is
                                                                                   reviewed in absence of the Coriolis Commentary.
-   It is the currency most used in international trade
-   It allows for cross country comparisons (e.g. vs. Denmark)                     Coriolis is not responsible or liable in any way for any loss or damage
-   It removes the impact of NZD exchange rate variability                         incurred by any person or entity relying on the information in, and the
-   It is more comprehensible to non-NZ audiences (e.g. foreign investors)         Recipient unconditionally and irrevocably releases Coriolis from liability for
-   It is the currency in which the United Nations collects and tabulates          loss or damage of any kind whatsoever arising from, the Coriolis Report or
    global trade data                                                              Coriolis Commentary including without limitation judgments, opinions,
                                                                                   hypothesis, views, forecasts or any other outputs therein and any
Anyone should feel free to call the authors if any of the material cannot be       interpretation, opinion or conclusion that the Recipient may form as a result
understood or accessed. We always welcome opportunities to discuss our             of examining the Coriolis Report or Coriolis Commentary.
research with our readers and users.
                                                                                   The Coriolis Report and any Coriolis Commentary may not be relied upon by
                                                                                   the Recipient, and any use of, or reliance on that material is entirely at their
                                                                                   own risk. Coriolis shall have no liability for any loss or damage arising out of
                                                                                   any such use.
TABLE OF CONTENTS

INTRO                  01                   02                     03                     04                      05
Context &              Market               Production             Categories             Growth &                Firms
Conclusions            Overview                                                           Innovation              Performance

Pages 3-10             Pages 11-26          Pages 27-31            Pages 32-40            Pages 41-54             Pages 55+

+ Purpose              + Global situation   + Number of firms      + Segmentation         + Horizons for growth   + Enterprises

+ Situation summary    + Consumption        + Employment           + Key products         + Emerging export       + Employment
                                                                                            stars
+ Drivers of success   + Production         + Yield/productivity   + Exports by product                           + Turnover
                                                                                          + New viable options
+ Investment           + Import demand      + Production                                                          + Ownership
  opportunities                                                                           + Mega-trends driving
                       + Key markets        + Regional activity                             change                + Foreign investors
+ SWOT
                       + Market growth      + Growth upside                               + Innovation & new      + Acquisitions
+ Supply chain                                                                              products
                                                                                                                  + Investments

                                                                                                                  + Firm Profiles
PURPOSE Why did the New Zealand government undertake this project?

  What is the purpose of the project?                 What benefit will this bring to businesses?       How will government use the reports?

   The project presents a comprehensive,               – As support for raising capital                  While the government collects large amounts of
   business-focused overview of the total New          – As a base of market intelligence to enable      industry data, little of this has an investor or
   Zealand food & beverage industry.                     business to be much more targeted in their      industry-driven perspective.
                                                         own market research
   The project pulls together the available            – Reviewing and informing offshore market         This information will provide much greater
   information on the food and beverage industry         development (including export and               insight into the industry, which is useful for a
   into one place, in a form which is familiar and       investment) strategies                          range of policy developments, from regulatory
   useful to business. The reports contain analysis    – Assisting in identifying areas of innovation    frameworks to investment in science and skills
   and interpretation of trends and opportunities        and R&D for the future                          and facilitating access to international markets.
   to materially assist with business strategy and
                                                       – Identifying strategic partners and
   government policy.
                                                         collaborators                                   In particular, a single source of factual
                                                       – Enabling a company to benchmark                 information will enable government agencies to
   The information will be of vital use to               performance with that of its competitors        better coordinate their efforts across the system
   businesses, investors, government, and                                                                and be more responsive to addressing industry
                                                       – Monitoring industry activity
   research institutions as the industry expands                                                         issues.
   and diversifies. This industry view will be very    – Gaining a better understanding of their own
   useful to government, enabling better dialogue        industry sector
                                                       – Identifying internal capability needs or        All project resources are available online at:
   and the opportunity to address issues
   collectively.                                         external inputs                                 www.foodandbeverage.govt.nz

                                                                                                                                                             4
SITUATION SUMMARY: WILD CAPTURE While New Zealand has a large and sustainably managed wild
  catch fishery, there is little likelihood of significant volume or throughput increases going forward

  ALL SEAFOOD: CONSUMERS/MARKETS                                                half of value and the growing Asian market the other     main catch by volume is hoki, followed by mackerel
                                                                                half.                                                    and squid. Rock Lobster are a major export that have
  Per capita consumption of wild capture seafood has                                                                                     shown strong growth on rapidly growing demand
  been flat-to-declining globally, due to overfishing and                       Fresh seafood is a highly perishable product and the     from China.
  population growing faster than capture quantity. This                         highest value products are often those sold fresh
  “deficiency” is being made up for by a massive                                (unlike some other foods). Bulk fish for further         Wild capture fishing is reasonably consolidated, with
  expansion in aquaculture.                                                     processing is also a key channel for NZ.                 a handful of major firms and a range of secondary
                                                                                                                                         firms. Consolidation is more pronounced in deep
  Increased consumer demand for seafood across most                             WILD CAPTURE: NEW ZEALAND                                water fishing, less so in closer waters.
  developed countries is being driven by (1) scientific
  research showing health benefits and (2) changing                             New Zealand has access to a strong set of natural        The industry has mixed ownership, with New Zealand
  diets. At the same time, key seafood consuming                                resources for wild capture fishing. The country is an    Maori tribal interests predominating, but with one
  countries (e.g. South East Asia (SEA), China) are                             isolated island nation in the middle of the South        listed firm (Sanford) and strong private ownership
  experiencing growing incomes leading to increased                             Pacific, 2,100 kilometres from Australia. It has the     and foreign investment (primarily Japanese).
  ability to pay for (or demand) more seafood. This                             ninth largest exclusive fishing zone (EEZ1) and the
  situation has supported prices.                                               tenth longest coastline of any country in the world.     WILD CAPTURE: COMPETITORS

  The majority of fish consumption globally occurs in                           Multiple sources suggest New Zealand’s fisheries are     NZ achieves a 7% share of the temperate Southern
  restaurants   and     other   foodservice   outlets.                          among the most sustainable fisheries in the world (on    Hemisphere (S.H.) wild catch.2         New Zealand
  Supermarkets underperform in seafood (relative to                             a par with Alaska and Iceland). New Zealand uses         competes in the first instance with other colder water
  other proteins); significant sales occur in more                              effectively the same catch management system as          Southern Hemisphere countries, primarily Australia,
  traditional channels (e.g. fishmongers and wet                                Iceland. However sustainable management has led to       Chile, Argentina, and South Africa. Secondarily, this
  markets)                                                                      a decline in total wild capture over the past 15 years   group compete with Northern Hemisphere colder
                                                                                and there is low potential for substantial future        water fisheries, including Norway, Canada, Iceland,
  Demand for sustainable product varies by market.                              growth. Precision Harvesting research over recent        USA/Alaska, UK/Scotland.
  There is increasing demand in Western markets                                 years is driving towards increasing the quality and
  (Europe/North America), for sustainable products                              therefore value of the catch.                            Globally the wild capture seafood industry is
  often driven by retailers (and vocal activists).                                                                                       fragmented with a huge number of medium to small
  However, there is currently low/no demand in Asian                            New Zealand has an efficient, modern seafood             sized firms competing. Around the world in-shore
  and developing markets for sustainability.                                    industry with large modern boats, in particular the      fishing is highly fragmented and primarily local
                                                                                deep sea freezer trawlers. More than 130 species are     around the world. Deepwater fishing is more
  NZ exports seafood to over a hundred countries.                               commercially fished in New Zealand’s EEZ, a similar      consolidated due to capital requirements for large
  Broadly speaking Western markets account for about                            species mix to Australia, Chile, Argentina, etc. The     boats, but still fragmented globally.

1. EEZ = Exclusive Economic Zone; 2. defined as Chile, Argentina, Brazil, South Africa, NZ & AU; Source: Coriolis                                                                                 5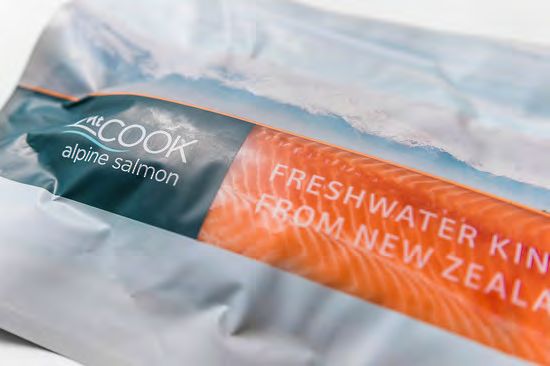
SITUATION SUMMARY: AQUACULTURE Aquaculture has huge theoretical growth potential for New
Zealand, however this is unlikely to be realised in practice

AQUACULTURE: NEW ZEALAND                                     companies, holiday home owners and environmental        AQUACULTURE: COMPETITORS – SALMON
                                                             advocates oppose its growth.
New Zealand has huge theoretical potential in                                                                        Where New Zealand farms King/Chinook Salmon
aquaculture production. New Zealand has the 10th             New Zealand farms three species in any quantity         (Oncorhynchus tshawytscha), effectively all other
longest coastline of any country in the world, more          (mussels, salmon and oysters); these make up ~99%       salmon aquaculture in the world farm Atlantic salmon
than China and 180 other countries on the world.             of the total exports.                                   (Salmo salar), due to its faster growth rates and
Currently only a tiny fraction of this is farmed; the                                                                disease resistance.
total area in New Zealand in aquaculture is similar to       Aquaculture is more consolidated than wild capture;
the area in onions or a single high country sheep farm.      the top five companies account for approximately        Salmon aquaculture is highly consolidated globally.
                                                             three quarters of the industry                          The top 3 firms account for ~40% of global
Aquaculture is a global growth story, supplying                                                                      production (the top 10, ~65%). None of the top 25
growing seafood consumption in the place of flat wild        AQUACULTURE: COMPETITORS – SHELLFISH                    global salmon producers currently operate in NZ.
capture. Globally aquaculture has increased its share        On a global basis, most shellfish are produced and      Consolidation is driven by clear economies of scale in
to about half of total seafood volume. In New Zealand        consumed locally and very little crosses borders. New   production systems, marketing, processing, skills,
it is about a fifth.                                         Zealand produces mussels and oysters in quantity,       genetics and capital.

However, New Zealand’s strong theoretical potential          and smaller amounts of abalone/paua.                    New Zealand biosecurity effectively prevents imports
for aquaculture is unlikely to be fully realised. There is   MUSSELS Globally only about one in eight mussels        of almost all fresh salmon.
often a conflict with the proposed location of               produced crosses a national borders. New Zealand
aquaculture operations and other non-commercial              competes with a wide range of regional players by
uses.                                                        market; Chile is an emerging multi-regional threat.
The fundamental issue is that NZ, as a society, has yet      OYSTERS 1% of global oyster production crosses
to come to a consensus on aquaculture, particularly          borders; global production is flat except for China
salmon, with the proponents arguing for it to become         which is increasing production massively.
a billion dollar industry, while a wide ranging
opposition of recreational fisherman, inshore fishing

                                                                                                                                                                              6
DRIVERS OF SUCCESS New Zealand’s success in seafood has three key drivers

            IDEAL WATER & CLIMATE                                                 EFFICIENT PEOPLE & SYSTEMS                              LOCATION & MARKETS

                                                                                                 Trusted by                                      High share in key
                    Available resource
                                                                                                 consumers                                           products

-   Strong natural resources for wild capture fishing                     -   Long history of seafood production              -   Excellent proximity to East & South-East Asian
                                                                                                                                  markets
-   Resources available for aquaculture                                   -   Industry focused on export for over 100 years
                                                                                                                              -   CER agreement with Australia
-   Substantial exclusive fishing zone (EEZ) available                    -   Large pool of skilled people
    for fishing                                                                                                               -   Excellent market access across Asia
                                                                          -   Strong Quota Management System and support
-   Isolated location protected by natural barriers                           networks                                        -   NZ was the first developed country to sign a free
                                                                                                                                  trade deal with China (2008)
                                                                          -   Well-organised, cohesive industry

Source: photo credit (purchased or creative commons (freenzphotos.com))                                                                                                               7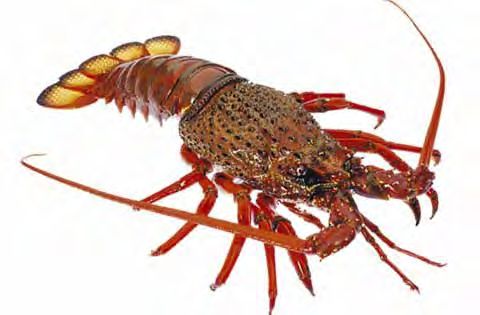
INVESTMENT OPPORTUNITIES There are limited opportunities for new external investment in wild capture;
regulatory change and fundamental drivers create more opportunities in aquaculture

OVERALL There are limited entry vehicles for new          is on-going, but progress is slow due to the ownership      incremental gains in the future. However these are
investors into seafood, as industry ownership of larger   issues discussed above. There are also opportunities        more likely to maintain New Zealand’s relative
firms is locked up by:                                    in value creation through delivering a greater percent      competitiveness (e.g. vs. Chile) rather than translate
                                                          of the catch to the market in a more fresh/less             into dramatically increased profitability.
   -   Maori interests (unlikely to sell),                damaged form (see the Precision Seafood Harvesting
                                                          Primary Growth Partnership programme, which is a            SALMON Theoretically New Zealand has huge
   -   Family businesses (Talleys, United,                                                                            potential in salmon aquaculture; in practice
       Independent, Solander, Vela) unlikely to sell      partnership between industry and the Crown.’).
                                                                                                                      regulations and competing interests will likely
       without generational change.                       There are opportunities for growth and certainly            constrain success. Industry is showing on-going
   -   Cornerstone shareholdings of large global          opportunities to find new markets for by-products and       consolidation. The largest salmon producer – New
       seafood companies (e.g. Nissui in Sealord)         fish species that are not currently processed or            Zealand King Salmon – listed on the NZX/ASX
                                                          retained.                                                   sharemarket in late 2016.
   -   Long-term cornerstone shareholders in both
       publicly-listed firms: Sanford (Amalgamated)                                                                   NEW SPECIES New Zealand scientists are working on
       and New Zealand King Salmon (Oregon                                                                            a wide range of new species, however these are all
                                                          AQUACULTURE The attractiveness of New Zealand
       Group)                                                                                                         highly speculative and unproven commercially to
                                                          aquaculture varies by species:                              date. Only investors with transferable capabilities or
Investors seeking smaller opportunities will find a       OYSTERS Pacific oysters have low growth potential,          strong appetite for risk should participate. Recent
wide range of opportunities among the second tier of      due to risks with potential new viral breakouts and         preliminary success in scampi aquaculture stands out.
interesting and innovative firms, many of which are       global market structure/situation.
seeking capital.
                                                          MUSSELS The industry is mature and consolidating            FURTHER PROCESSING There are opportunities for
                                                          rapidly. Mussels are relatively low value use of space.     investment in further processing of New Zealand bulk
WILD CAPTURE The industry has a strong and                Returns over the past twenty years have been mixed          ingredients (e.g. “white fish”) into consumer ready
effective sustainability management system. This          and cyclical, particularly for smaller operators (driving   products, however this is primarily a greenfields
system implies that New Zealand will have relatively      industry consolidation).                                    opportunity for firms with transferrable skills.
more fish in the future compared with overfished          The SpatNZ Primary Growth Partnership programme
countries and regions.                                                                                                There are clear opportunities for investment in
                                                          is a partnership between industry and the Crown             seafood derived products (e.g. nutraceuticals,
Main source of value creation in wild capture is in       which is supporting selective breeding. The                 supplements, petfood)
cost reductions via consolidation. This consolidation     programme is on target to deliver hatchery grown
                                                          mussel spat and will likely deliver constant

                                                                                                                                                                               8
SWOT ANALYSIS New Zealand has a stable and sustainable position in the global seafood industry

                                     STRENGTHS                                                                             WEAKNESSES
-   Clean water and generally healthy aquatic environment                                 -   Most industry wild capture growth metrics negative (Quota system)
-   Unsubsidised industry                                                                 -   Wild catch volume has fallen since 1998 leading to reduced throughput
-   Early introduction of quota management system prevented collapse of stocks            -   Relatively small producer on a global scale
    through overfishing                                                                   -   Supply fluctuates year-to-year with availability of wild capture fish
-   Stocks generally at sustainable levels or rebuilding                                  -   Mussels and oysters have low value per hectare; salmon development limited by
-   Regularly ranked in top three sustainable regions                                         regulatory challenges
-   Efficient, modern industry with large modern boats, in particular the deep sea        -   Most EEZ space low productivity deep water
    freezer trawlers                                                                      -   Industry is bulk supply driven, rather than specialised/consumer focused
-   Stable, long-term ownership in place across most major firms                          -   Firms primarily small/sub-scale with limited access to capital
-   Only country farming green lipped mussels (Perna canaliculus); others farm a          -   Competing users of coastal space for aquaculture (e.g. holiday houses)
    different green shelled species (perna viridis, etc.) or blue mussels (mytilus sp.)   -   Highly regulated
-   Limited presence of disease in aquaculture species                                    -   No competitive advantage around aquaculture feed production due to low scale
-   Unique access to some bio-secure markets (particularly Australia & Japan)             -   Lack of market integration, not capturing in-market value
-   Parts of domestic industry protected from imports by biosecurity measures             -   Limited in-market knowledge
-   Government support of industry R&D

                                  OPPORTUNITIES                                                                      ISSUES/THREATS/RISKS
-   Consumer perceptions of health benefits of seafood                                    -   New Zealand’s wild capture continues to decline
-   Large amounts of fish body currently going to meal and waste                          -   Other countries “catching up” on sustainability (e.g. Argentina)
-   Use of by-products for nutraceuticals /cosmetics sector                               -   Low cost competitors in low wage/low regulation/higher productivity warm
-   Growing interest by some more wealthy consumers in Western markets for eco-               waters
    labelling and environmental certification (driven by retailers)                       -   NIMBY (not in my back yard) attitudes limiting industry activity
-   Growing middle class in China and SE Asia                                             -   Single issue special interest groups driving domestic regulatory agenda
-   Gradual removal of global fishing subsidies                                           -   Rising costs of airfreight reducing feasibility of fresh exports
-   Ongoing removal of trade barriers and negotiation of new free trade agreements
-   Streamline regulations
-   New/improved supply chain technology

                                                                                                                                                                              9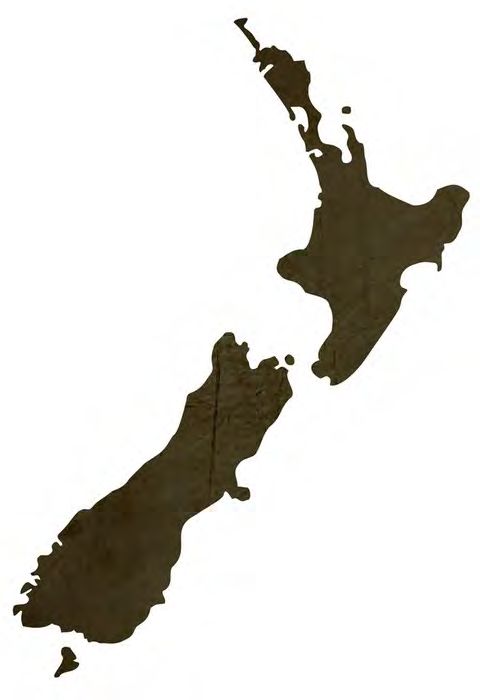
SUPPLY CHAIN New Zealand has a robust seafood supply chain that produces seafood products from wild
capture and aquaculture

SIMPLIFIED MODEL OF NEW ZEALAND SEAFOOD SUPPLY CHAIN
Model; 2017

                                                                                                                                                  International
                                                                                                                                                                                               Supermarkets/
                                                                                                                                                  markets
                                                                                                                                                                                               Fishmongers
  Wild capture
                                                                                                                                                    Secondary
    Non-NZ waters                                                                                                                                                                              Industrial2
                                                                                                                                                    Processing
                                                                                                                                                    (in-market)

    New Zealand                                     Seafood processing                              Seafreight                                      Seafood                                    Foodservice
    waters                                          (wild+aquaculture)                              Airfreight                                      wholesale1
                                                                                                                                                    (in-market)

    Aquaculture                                                                                     Seafood                                         Distributor                                Supermarkets
                                                                                                    wholesale                                       wholesaler

                                                                                                                                                                                               Fishmongers

                                                                                                                                                                                               Foodservice
                                                                                                                                                  Domestic
                                                                                                                                                  market

1. There may be one or more layers of wholesaling, depending on product or market; some wholesale functions maybe captive inside retailers or foodservice operators; 2. Includes product for
housebrands, canners, fish meal manufacturers; Source: Coriolis analysis                                                                                                                                       10
Global
Market Overview
+ Global situation + Import demand
+ Consumption + Key markets
01
+ Production + Market growthFundamental demographic and production shifts have led to the global seafood market experiencing ongoing
changes in both supply and demand
CONSUMPTION - Total global cross-border seafood trade is spread across a wide
range of products
- Global seafood consumption is concentrated in E/SE Asia - White fish (US$38b), processed seafood ($23.9b), salmon ($15.1b)
(particularly China), Europe and the Americas and prawns ($14.7b) stand out for size
- Global per capita seafood consumption (all forms) is showing - Squid, salmon, lobster and processed seafood stand out for their
moderate growth (1.4% per year) growth in demand over the past five years; white fish has shown
slight growth in overall value despite declining volumes
PRODUCTION DEMAND: IMPORT MARKETS
- Global production is 200m tons of seafood - Total global cross-border demand for seafood was US$122b in 2015;
the key markets are Europe ($48.2b), the US ($17.8b), Japan
- Wild capture stalled around 1990, while aquaculture continues to ($11.7b) and China/HK (~$10b)
grow
- Vietnam, Thailand, South Korea, China and a wide range of other
- As a result of the stall in wild capture, particularly of marine fish, the smaller markets stand out for import market growth; Japan and
global production mix is shifting dramatically to aquaculture Russia shrank over the period
production of freshwater fish, aquatic plants and molluscs
- Markets vary in average seafood import price, with Hong Kong, the
- Global seafood production (capture and aquaculture) is USA, Canada and Japan, followed by the “Big 4” Europeans, standing
concentrated in E/SE Asia; New Zealand is a smaller, second tier out as high value markets
producer overall
SUPPLY: EXPORTERS
GLOBAL TRADE
- China is the largest seafood exporter overall; New Zealand is a
- Global cross-border seafood trade volumes are growing (10y CAGR second tier exporter, similar in size to Australia and Argentina
4%) with moderate price gains across the cycle leading to solid - New Zealand is achieving moderate export price gains but no
export value growth (10y CAGR 6%) increase in volume
- Exporters vary in their average seafood export price, driven largely by
DEMAND: PRODUCT CATEGORIES product mix; New Zealand achieves a similar return to the US and
Norway
12Global seafood consumption is concentrated in E/SE Asia (particularly China), Europe and the Americas;
global per capita seafood consumption (all forms) is showing moderate growth (1.4%)
AVAILABLE SEAFOOD SUPPLY BY REGION* 50Y GLOBAL SEAFOOD CONSUMPTION PER CAPITA
Kilograms; millions; food supply quantity; 2013 Kilograms/person; food supply quantity; 1963-2013
816 13,729 16,739 5,113 7,787 10,274 78,370 Total = 132,829
Other E/SE Asia
France 5,798
2,152 20
Indonesia
7,039
Spain Philippines
1,989 3,108 50y
Vietnam CAGR
2,995
USA
Myanmar 1.4%
6,883
2,897
Italy S. Korea
1,529 India 2,600 15
6,310
Japan
Australia
6,179
609
UK
1,316 10
NA/ME/CA
SS Africa
7,787
5,113
Canada
792
10
Other Europe
6,023
Brazil
2,178
China
47,754
Mexico Bangladesh 5
1,280 3,008
New Zealand
112
Peru
672
Russia
Other Americas
3,275
Other S Asia
1,924
Pac. Is.
95
956
Turkey 0
455
1963
1965
1967
1969
1971
1973
1975
1977
1979
1981
1983
1985
1987
1989
1991
1993
1995
1997
1999
2001
2003
2005
2007
2009
2011
2013
Australasia
Americas
NA/ME/CA
SS Africa
Europe S Asia E/SE Asia
* Final supply after processing & trade; * CAGR = Compound Annual Growth Rate; Note: 2013 is latest UN consumption data available as of April 2017; Source: UN FAOStat database; Coriolis analysis 13Global production is 200m tons of seafood; wild capture stalled around 1990, while aquaculture continues to
grow
GLOBAL SEAFOOD PRODUCTION BY TYPE & METHOD 40 YEAR GLOBAL SEAFOOD PRODUCTION BY METHOD
Tonnes; m; landed; greenweight; 2015 Total = 200 Tonnes; million; 1975-2015
94 106
200
3
193
189
181
176
167
163
40y
159
CAGR
156
153
3%
152
40y ABS 40y CAGR
149
44 Freshwater fishes
Aquaculture 101 8%
140
140
136
136
132
129
129
Marine fishes 66
125
123
121
112
108
106
105
103
103
100
98
16 Molluscs
91
88
80
81
78
76
74
74
72
71
7 Crustaceans
68
5 Diadromous fishes*
10 Capture 31 1%
7 29 Aquatic plants
7
2
11 1 Other misc.
1975
1976
1977
1978
1979
1980
1981
1982
1983
1984
1985
1986
1987
1988
1989
1990
1991
1992
1993
1994
1995
1996
1997
1998
1999
2000
2001
2002
2003
2004
2005
2006
2007
2008
2009
2010
2011
2012
2013
2014
2015
Capture Aquaculture
* Diadromous fishes (migrate between fresh and salt water (e.g. salmon, eels) Note: 2015 is latest data available for all countries globally in UN FISHStat as of April 2017; Source: UN database; Coriolis 14As a result of the stall in wild capture (particularly of marine fish), the global production mix is shifting
dramatically to aquaculture production of freshwater fish, aquatic plants and molluscs
40 YEAR GLOBAL SEAFOOD PRODUCTION BY TYPE & METHOD GLOBAL SEAFOOD PRODUCTION SHARE BY TYPE & METHOD
Tonnes; million; 1975-2015 % of tonnes; 1975-2015
200 100% 100% 100% 100% 100%
2%
5%
2%
Aquaculture 40y ABS 40y CAGR 2% 10% 40y ABS
3%
1% 16%
Capture 6%
4%
44 Freshwater fishes +42 9% 1% 22% Freshwater fishes +20%
7%
5%
4%
4% 5% 5% 8%
152
3% 3%
4%
16 Molluscs +15 6% 8% Molluscs +6%
5% 9%
3%
24
6%
125 6%
29 Aquatic plants +28 8% 4% 15% Aquatic plants +12%
12
13 3% 5%
8 14 5%
7 16 Other aquaculture +16 9% 8% Other aquaculture +7%
4%
9
91 3 2%
6 8
4 10 Freshwater fishes +6 2% 5% Freshwater fishes -1%
2 7
3 7
1 7 Molluscs +4 2% 4% Molluscs -1%
5 5
6 75%
5 4 7 Crustaceans +4 3% 3% Crustaceans -0%
68 3
4 70%
21 4 Other capture +1 1% 2% Other capture -2%
2 3
0
4
3 58%
2
2
46%
72 70
64 66 Marine fishes +15 1% 33% Marine fishes -42%
51
1975 1985 1995 2005 2015 1975 1985 1995 2005 2015
Source: UN FAOStat database; Coriolis analysis 15Global seafood production (capture and aquaculture) is concentrated in E/SE Asia; New Zealand is a smaller,
second tier producer overall
GLOBAL SEAFOOD PRODUCTION BY KEY COUNTRIES & REGION GLOBAL SEAFOOD PRODUCTION BY KEY REGION
Tonnes; million; 2015 Tonnes; million; 1975-2015
1.6 21.3 18.0 6.3 7.7 15.0 129.7 Total = 200 200
Norway
USA 3.8
New Zealand
5.5
0.5
40y ABS 40y CAGR
79 China +74 7%
Iceland 152
1.3
Canada
1.1 China
Spain 79.4
1.3 India
10.1
UK
Australia
125
0.9 52
0.2
Peru
Denmark
4.9
0.9
NA/ME/CA
France
SS Africa
0.7 33 22 Indonesia +21 7%
6.3
7.7
91 7
4
Chile 9
Other Europe Japan 28 Other E/SE Asia +10 1%
3.2 2
4.6 4.7 25
S Korea 22
3.3 68
24
Mexico 5
Pac. Is.
1 7 10 15 S. Asia +12 4%
0.8
1.7
Indonesia
4
Bangladesh
22.2 4 5
Brazil 18 5 6 NA/ME/CA +5 3%
2
3.7
6
1.3 3
8 SS Africa +4 2%
Russia 3 20
Viet Nam 2 17
Other Americas
3.8 4
6.2 25 18 Europe -5 -1%
Philippines
3.7
4.5
Other S Asia
Myanmar 23
3.0 22 21
1.3
Turkey Other E/SE Asia
14 15 C/S America +8 2%
0.7 6.5
7
Australasia
Americas
Europe
NA/ME/CA
SS Africa
S Asia
E/SE Asia 7 7 7 North America +3 1%
4 7
0 1 1 2 2 Australasia +1 3%
1975 1985 1995 2005 2015
Note: 2015 is latest data available for all countries globally in UN FISHStat as of April 2017; Source: UN database; Coriolis analysis 16Global cross-border seafood trade volumes are growing (10y CAGR 3%) with moderate price gains across the
cycle leading to solid export value growth (10y CAGR 6%)
GLOBAL EXPORT VOLUME GLOBAL AVERAGE EXPORT PRICE GLOBAL EXPORT VALUE
KG; b; 2005-2015 US$/kg; actual; 2005-2015 US$; b; 2005-2015
35.0 $5.00 $160
10y
10y
10y CAGR
CAGR
CAGR 6%
3% $4.50
3% $140
30.0
$4.00
$120
25.0
$3.50
$100
$3.00
20.0
X =
$2.50 $80
15.0
$2.00
$60
$1.50
10.0
$40
$1.00
5.0
$20
$0.50
- $0.00 $0
2005
2006
2007
2008
2009
2010
2011
2012
2013
2014
2015
2005
2006
2007
2008
2009
2010
2011
2012
2013
2014
2015
2005
2006
2007
2008
2009
2010
2011
2012
2013
2014
2015
Note: data is as reported sender FOB; Source: UN FAO database; Coriolis classification and analysis 17Global cross-border seafood trade is spread across a wide range of products, though white fish (US$38b),
processed seafood ($23.9b), salmon ($15.1b) and prawns ($14.7b) stand out for size
GLOBAL SEAFOOD EXPORT VALUE BY PRODUCT CLASS/TYPE
US$; b; FOB; 2015
$1.8 $56.6 $11.7 $22.4 $29.4 Total = $121.8
Fish, dry/salt
Lobster $3.7
$3.6
Fish oils & fats
$1.7
White fish
$38.0
Squid, etc.
$9.4
Prawns
Live fish $14.7
$1.8
Processed seafood
$23.9
Tuna
$3.5
Salmon Scallops
$15.1 $1.4
Other Crustaceans
$4.1
Oysters
$0.3
Mussels
$0.5
Live fish Fish Molluscs Crustaceans Processed
Note: “Squid, etc.” uses trade codes under HS03047-03079; Note: 2015 is latest available globally; data is as reported sender FOB; Source: UN Comtrade database; Coriolis analysis 18Squid, salmon, lobster and processed seafood stand out for their growth in demand over the past five years;
white fish has shown slight growth in overall value despite declining volumes
5Y GROWTH MATRIX: 5Y VOLUME VS. 5Y CAGR VALUE VS. VALUE 2015 BY PRODUCT
T; b; % of US$; US$b; FOB; 2010 vs. 2015
8%
Lobster
5Y CAGR
value Squid, etc.
US$; 10-
15 7% Fish oils & fats
6%
Other Crustaceans
5%
Salmon
Oysters
4%
Scallops Processed seafood
3% Mussels
2% White fish
Tuna
1% Bubble size is proportional to seafood export
Live fish $3
value in 2015; a bubble this size is US$3b
0% Fish, dry/salt
-600 -400 -200 0 200 400 600 800
5Y Change in volume (t) of exported; 10-15
Note: 2015 is latest available globally; data is as reported sender FOB; Source: UN Comtrade database; Coriolis analysis 19Total global cross-border demand for seafood was US$122b in 2015; the key markets are Europe ($48.2b),
the US ($17.8b), Japan ($11.7b) and China/HK (~$10b)
GLOBAL SEAFOOD IMPORT VALUE BY RECEIVING COUNTRY/REGION
US$; b; FOB; 2015
$1.8 $24.3 $48.2 $3.6 $2.7$0.7 $40.5 Total = $121.8
France Vietnam
$6.1 $4.4
Egypt
$0.6
Thailand
$2.6
Spain Malaysia
$5.8 $1.0
Sri Lanka
Singapore
$0.3
$1.1 Other SE Asia
UAE $1.2
$0.6
Italy
South Korea
$5.5
$4.8
Australia
USA
$1.4
$17.8
Saudi
Germany
$0.5
$5.2
SS Africa
$2.7
United Kingdom Japan
$4.1 $11.7
Other NA/ME/CA
Other S Asia
Hong Kong SAR
$0.4
$4.3
$1.9
Other Europe
New Zealand
Canada $19.7
$0.2
$2.6
China
Brazil
$6.6
$1.1
Other Pacific
Mexico
$0.8
Chile
$0.3
Colombia
$0.3
Venezuela
$0.3
Other$0.0
Americas Russia
Other E Asia
$1.3 $2.8
Turkey
$1.4
$0.2
NA/ME/CA
SS Africa
Australiasia Americas Europe S Asia E/SE Asia
Note: 2015 is latest available globally; data is as reported sender FOB; Source: UN Comtrade database; Coriolis analysis 20Vietnam, Thailand, South Korea, China and a wide range of other smaller markets stand out for import market
growth; Japan and Russia shrank over the period
5Y GROWTH MATRIX: 5Y VOLUME VS. 5Y CAGR VALUE VS. VALUE 2015 BY RECEIVING COUNTRY/REGION
T; b; % of US$; US$b; FOB; 2010 vs. 2015
20% Vietnam
Sri Lanka
5Y CAGR
value US$;
10-15
Thailand
15%
Chile
Colombia Other E Asia
10%
Turkey
UAE
Other SE Asia
Other Americas
Malaysia Mexico
Singapore China
USA S Korea
5% SS Africa
Hong Kong SAR UK Other NA/ME/CA
Saudi Egypt Other Europe
Other S Asia
Canada Germany
Australia
Brazil
Italy
New Zealand
0%
Japan
France
Spain
Bubble size is proportional to seafood import $3
value in 2015; a bubble this size is US$3b
-5% Russia
-200 -100 0 100 200 300 400 500 600
5Y Change in volume (t) of imported; 10-15
Note: 2015 is latest available globally; data is as reported sender FOB; Source: UN Comtrade database; Coriolis analysis 21Markets vary in average seafood import price, with Hong Kong, the USA, Canada and Japan, followed by the
“Big 4” Europeans, standing out as high value markets
TOTAL GLOBAL SEAFOOD IMPORT VOLUME VS. AVERAGE IMPORT PRICE BY KEY MARKET
KG; millions; US$/kg; actual; 2015
$9.99
Average
import
value per
kilogram
US$/kg
2015
$7.28
$6.25
$6.00
$5.67
$5.54
$5.45
$5.38
$5.33
$5.33
$4.86
$4.31
$4.15
$4.10
$3.97
Weighted average $4.13
$3.78
$3.75
$3.64
$3.37
$3.26
$3.21
$3.03
$2.99
$2.69
$2.62
$2.58
$2.50
$2.52 $2.49
$2.36
$2.08
$2.08
$1.79
$1.65
$1.63
Hong Kong SAR
USA
Canada
Other E Asia
Japan
Australia
Singapore
Italy
France
UK
Germany
Vietnam
Spain
UAE
Venezuela
Mexico
Brazil
Saudi
South Korea
Malaysia
Other NA/ME/CA
Russia
Sri Lanka
Colombia
Other SE Asia
Other Americas
Chile
Thailand
Other Pacific
Other S Asia
Turkey
Egypt
Other Europe China SS Africa
Proportional to import volume in 2015
Note: therefore area under chart is proportional to import value (volume x $/kg); Source: UN Comtrade data; Coriolis analysis and classifications 22China is the largest seafood exporter overall; New Zealand is a second tier exporter, similar in size to Australia
and Argentina
GLOBAL SEAFOOD EXPORT VALUE BY SENDING COUNTRY/REGION
Total = $121,840
US$; b; FOB; 2015
$2,660
$2,346
$2,323 $23,893 $42,364 $5,336 $42,917
Thailand
$5,424
Norway
USA $9,078
$5,751
Vietnam
New Zealand
$6,573
$1,105
Spain
$3,645
Indonesia
Canada Denmark $3,609
$5,063 $3,221
Japan
$1,902
Netherlands
$3,377
India
$4,818
NA/ME/CA
SS Africa
$2,660
$2,346
Sweden
$3,668
Chile
$4,456
China
$19,758
Australia
$1,066
Ecuador
$3,533 Other Europe
$15,590
Argentina
$1,445
Peru Hong Kong SAR
$1,193 $760
Mexico Belarus
Other Pacific
$986 $258
Other E/SE Asia
$152
Russia Other S Asia
Other Americas $519 $4,891
$2,824
$1,465 Turkey
$704
NA/ME/CA
SS Africa
E/SE Asia
Australasia Americas Europe S Asia
Note: 2015 is latest available globally; data is as reported sender FOB; Source: UN Comtrade database; Coriolis analysis 23New Zealand’s seafood trade share is drifting lower, similar to other Southern Hemisphere cool water peers
other than Chile (which has a strong aquaculture sector)
GLOBAL EXPORT MARKET SHARE: KEY SOUTHERN HEMISPHERE COOL WATER SEAFOOD EXPORTERS
% of value; US$; 2005-2015
4.0%
3.9%
3.8% 3.8%
10Y Change
3.7% 3.7%
Chile 0.0%
3.5% 3.5%
3.3%
3.2%
2.8%
1.6%
1.4%
1.4%
1.3% 1.3% 1.3%
1.3%
1.2% 1.2% 1.2% Argentina 0.0%
1.2% 1.1% 1.2% 1.1%
1.1% 1.1% 1.1%
1.0%
1.0% 1.0% 1.0% 1.0%
1.0% 1.0%
0.9% 0.9%
0.9% 0.9% 0.9% New Zealand -0.4%
0.8% 0.8% 0.9%
0.8% Australia -0.5%
0.6%
0.5%
0.5% 0.5%
0.5%
0.4%
0.3% 0.3% 0.3% 0.3%
0.3% South Africa -0.3%
2005 2006 2007 2008 2009 2010 2011 2012 2013 2014 2015
Note: 2015 is latest available globally; data is as reported sender FOB; Source: UN Comtrade database; Coriolis analysis 24New Zealand is achieving moderate export price gains but no increase in volume
5Y GROWTH MATRIX: 5Y VOLUME VS. 5Y CAGR VALUE VS. VALUE 2015 BY EXPORTING COUNTRY/REGION
T; b; % of US$; US$b; FOB; 2010 vs. 2015
18% Belarus
Ecuador
15%
5Y CAGR Turkey
India
value US$;
10-15
Hong Kong SAR
10%
Chile
China
Mexico
Indonesia
Sweden
Russia
Peru Vietnam
5%
USA
Canada Denmark Netherlands
Argentina
Spain
New Zealand
Norway Other Europe
0% NA/ME/CA
Other E/SE Asia
Japan
Other Americas
-5% Thailand
Bubble size is proportional to seafood import
SS Africa $3
value in 2015; a bubble this size is US$3b
Other S Asia
-10%
-450 -400 -200 0 200 400 600 750
5Y Change in volume (t) of exported; 10-15
Note: 2015 is latest available globally; data is as reported sender FOB; Source: UN Comtrade database; Coriolis analysis 25Exporters vary in their average seafood export price, driven largely by product mix; New Zealand achieves a
similar return to the US and Norway
SEAFOOD EXPORT VOLUME VS. AVERAGE EXPORT PRICE ACHIEVED BY EXPORTING COUNTRY/REGION
KG; millions; US$/kg; actual; 2015
$16.15
Rock
Lobster
Average
export
value per
kilogram
US$/kg
2015
$7.54
$7.55
$6.99
$5.51
$5.21
$5.09
$4.98
$5.01
$4.60
$4.61
$4.45
$4.39
$4.30
$4.05
$4.13
$4.13
$3.89
$3.87
Weighted average $4.13
$3.54
$3.48
$3.42
$3.26
$3.27
$3.66 $3.59
$2.94
$2.83
$2.78
$2.40
$2.04
Australia
Hong Kong SAR
Mexico
Canada
Turkey
Vietnam
Ecuador
Sweden
Other Americas
Indonesia
Belarus
Denmark
Thailand
New Zealand
Japan
Spain
Other S Asia
Netherlands
SS Africa
Argentina
Other Pacific
NA/ME/CA
Other E/SE Asia
Peru
India China Chile Other Europe USA Norway Russia
Proportional to export volume in 2015
Note: therefore area under chart is proportional to import value (volume x $/kg); Source: UN Comtrade data; Coriolis analysis and classifications 26New Zealand
Seafood Production
+ Number of firms + Production
+ Employment + Regional activity
02
+ Yield/productivity + Growth upsideNew Zealand produces sustainable quantities of seafood through wild capture and aquaculture
- New Zealand has the 10th largest coastline of any country and 6.7m km2 of controlled ocean space - the
ninth largest claimed ocean space of any country – however most of this claim is deep water with low
productivity
- New Zealand produces significant amounts of seafood under both wild capture and aquaculture
- Wild capture volumes have benefited from the increase in the allowed Hoki (Blue Grenadier) catch, while
aquaculture production has achieved long-term growth
28New Zealand has the 10th largest coastline of any country and 6.7m km 2 of controlled ocean space - the ninth
largest claimed ocean space of any country – however most of this claim is deep water with low productivity
LIMIT OF NEW ZEALAND EXCLUSIVE ECONOMIC ZONE (EEZ) AREA OF NEW ZEALAND EEZ BY WATER DEPTH
Area; depth; 2017 km2; m; % of area; 2017
Defined as 200
nautical miles from Less than 200m
coastline deep
22%
200-1,000m deep
6%
More than 1km
deep
72%
TOTAL = 6.7m square kilometres of EEZ
LENGTH OF COAST BY TOP 20 COUNTRIES TOP 20 EXCLUSIVE ZONES (EEZ) BY CLAIMED AREA*
Km; 2017 km2; million; 2017 or most recent available
Canada 202,080 France 11,691,000
Indonesia 54,716 United States 11,351,000
Greenland 44,087 Australia 8,505,348
Russia 37,653 Russia 7,566,673
Philippines 36,289 United Kingdom 6,805,586
Japan 29,751 Indonesia 6,159,032
Australia 25,760 Canada 5,599,077
Norway 25,148 Japan 4,479,388
United States 19,924 New Zealand 4,083,744
New Zealand 15,134 Chile 3,681,989
China 14,500 Brazil 3,660,955
Greece 13,676 Kiribati 3,441,810
United Kingdom 12,429 Mexico 3,269,386
Mexico 9,330 Micronesia 2,996,419
Italy 7,600 Denmark 2,551,238
Brazil 7,491 Papua New Guinea 2,402,288
Denmark 7,314 Norway 2,385,178
Turkey 7,200 India 2,305,143
India 7,000 Marshall Islands 1,990,530
Chile 6,435 Portugal 1,727,408
* Sovereign states including dependent territories; Note: a nautical mile is 1,852 metres; Source: CIA World Fact Book; FAO; Seaaroundus.org; Sealord; Coriolis analysis 29New Zealand produces significant amounts of seafood under both wild capture and aquaculture
TOTAL NZ WILD CAPTURE SEAFOOD PRODUCTION AQUACULTURE PRODUCTION PER KILOMETRE OF COAST
Tonnes; 000; 1950-2015 Tonnes; actual; 1950-2015
97-08
700 CAGR 10
-3.2%
9
600 76-97 08-15
CAGR CAGR 8
11% -0.6%
500 7
6
400
5
300 50-76
CAGR 4
3%
200 3
2
100 UNCLOS 1982
EEZ 200nm 1
0 -
1950
1952
1954
1956
1958
1960
1962
1964
1966
1968
1970
1972
1974
1976
1978
1980
1982
1984
1986
1988
1990
1992
1994
1996
1998
2000
2002
2004
2006
2008
2010
2012
2014
1950
1952
1954
1956
1958
1960
1962
1964
1966
1968
1970
1972
1974
1976
1978
1980
1982
1984
1986
1988
1990
1992
1994
1996
1998
2000
2002
2004
2006
2008
2010
2012
2014
NZ WILD CAPTURE PER PERSON SHARE OF TOTAL SEAFOOD PRODUCTION BY TYPE
KG/capita; actual; 1950-2015 % of tonnes; 1950-2015
200
100%
180
90%
160
80%
Wild capture
140 70%
120 60%
100 50%
80 40%
60 30%
40 20%
Aquaculture
20 10%
- 0%
1950
1952
1954
1956
1958
1960
1962
1964
1966
1968
1970
1972
1974
1976
1978
1980
1982
1984
1986
1988
1990
1992
1994
1996
1998
2000
2002
2004
2006
2008
2010
2012
2014
1950
1952
1954
1956
1958
1960
1962
1964
1966
1968
1970
1972
1974
1976
1978
1980
1982
1984
1986
1988
1990
1992
1994
1996
1998
2000
2002
2004
2006
2008
2010
2012
2014
Note: 2015 data latest available as of April 2017; Source: UN FAO FishStat database; MFish/MAF/MPI; Coriolis analysis 30Wild capture volumes have benefited from the increase in the allowed Hoki (Blue Grenadier) catch, while
aquaculture production has achieved long-term growth
TOTAL WILD CAPTURE BY SPECIES GROUP TOTAL AQUACULTURE PRODUCTION BY KEY SPECIES
Tonnes; 000; 1975-2015 Tonnes; 000; 1975-2015
117
649
648
112
112
111
110
108
105
105
600
589
100
570
557
97
553
551
546
545
94
92
92
91
Abalone
Oyster
495
87
86
85
477
470
453
453
444
443
442
440
77
437
76
433
433
430
75
425
70
386
Other
352
316
Silver warehou
53
Orange roughy
52
51
Blue mackerel
277
49
Mussel
Oreo dories nei
Ling
Arrow squid
241
Snoek
208
208
203
Southern blue whiting
196
169
167
Mackerels nei
29
28
154
27
117
19
98
17
78
69
Hoki
12
63
11
10
7
Pacific salmon
3
3
3
3
2
2
1
1975
1976
1977
1978
1979
1980
1981
1982
1983
1984
1985
1986
1987
1988
1989
1990
1991
1992
1993
1994
1995
1996
1997
1998
1999
2000
2001
2002
2003
2004
2005
2006
2007
2008
2009
2010
2011
2012
2013
2014
2015
1975
1976
1977
1978
1979
1980
1981
1982
1983
1984
1985
1986
1987
1988
1989
1990
1991
1992
1993
1994
1995
1996
1997
1998
1999
2000
2001
2002
2003
2004
2005
2006
2007
2008
2009
2010
2011
2012
2013
2014
2015
Note: 2015 data latest available as of April 2017; Source: UN FAO FishStat database; MFish/MAF/MPI; Coriolis analysis 31New Zealand
Category Performance
+ Segmentation
+ Key products
03
+ Exports by productNew Zealand has a solid position in select seafood products where it has real strengths
OVERVIEW BY CATEGORY
- New Zealand has a stable wild seafood catch, is a leader in
rock lobster and is innovating in mussel and salmon
products - WILD CAPTURE Thanks to pioneering quota management
systems, New Zealand has a long-term, sustainable supply of
~450k tonnes of wild capture seafood available
- Exports are spread across six categories
- ROCK LOBSTER* New Zealand has a long-term, sustainable
- however wild capture (54%), rock lobster (20%), and
supply of rock lobster available; export value growing strongly,
mussels (14%) are the largest
with almost all volume now going to China/Hong Kong
- Export value is growing across the cycle
- MUSSELS New Zealand has a strong position in green shelled
mussel aquaculture, producing a third of global green supply;
- Average export price varies by category, with rock lobster export value growing strongly
standing out for dramatically higher prices and wild capture
accounting for the bulk of export volume
- SALMON New Zealand is the global market leader in
King/Chinook Salmon aquaculture, a small but premium
- Mussels, salmon, oysters and lobster are shifting to value species; there is potential for further strong growth
(higher prices at lower volumes), while wild capture is
experiencing falling volumes and price pressure
* Rock Lobster: While rock lobster is a “wild capture” seafood in New Zealand, this project considers it separately, due to its significance and growth 33New Zealand has a stable wild seafood catch, is a leader in rock lobster and is innovating in mussel and
salmon products
KEY HIGH-LEVEL CATEGORIES
WILD CAPTURE ROCK LOBSTER MUSSELS SALMON
Stable Major Global Pioneering Farmer & Exporter #1 Global Farmed
Supply Exporter Unique Species Chinook/King Salmon
- Stable, predictable, secure long term - Well managed fishery - Modern and consolidated industry - Highly consolidated and at scale
supply of fish
- Stable supplies - Proven supply chain, track record in in- - Effectively only global supplier of
- NZ pioneering of wild catch quota store merchandising systems farmed Chinook; others hampered by
management has prevented collapse of - One of two major global suppliers of disease
fish stocks (unlike competitors) spiny red rock lobster (rest of world - Recently implemented breeding
primarily clawed lobster) program driving productivity gains - Lack of key salmon diseases (e.g. ISA)
- Growing strongly into China and wider - Huge potential for growth (5x/10x)
Asia
Source: photo credit (purchased, courtesy of firms or fair use; low resolution; complete product/brand for illustrative purposes); Coriolis classifications and analysis 34Exports are spread across six categories, however wild capture (54%), rock lobster (20%), and mussels
(14%) are the largest; exports are growing across the cycle
NEW ZEALAND SEAFOOD EXPORT VALUE BY SEGMENT NEW ZEALAND SEAFOOD EXPORT VALUE BY SEGMENT
US$; m; 2015 US$; m; 2005-2015
Salmon
$36 Oysters $1,242 $1,236
$1,218
3% $14 $1,187
1% $129 $96
$131
$115 $13 $1,105
Mussels $12 $30
$153 $37 $15
$1,033 $15 $44 $90 Processed seafood
14% Processed $42
$14 Oysters
seafood, $90 , $949 $104 $150 $206 $36 Salmon
8% $144
$907 $167
$83 $12
$873 $875
$853 $52 $153 Mussels
$95 $12
$77 $30 $83
$79 $181
$11 $12 $119
Lobster $19 $26 $10 $205 $223
$12 $142 $36 $174
$214 $27
20% $113 $126 $214 Lobster
$114 $124
$163
$80 $89 $128
$82
$116
Wild capture
$598 $733
54% $673 $678 $668
$574 $583 $598 Wild capture
$539 $559 $554
$505
2005 2006 2007 2008 2009 2010 2011 2012 2013 2014 2015
NOTE: “processed seafood is seafood relevant global trade codes under HS 1603-1605 (see page 80 for details); oysters includes wild catch and export (inseparable at source); Source: UN
Comtrade database (from NZ Customs data); Coriolis classifications and analysis 35Average export price varies by category, with rock lobster standing out for dramatically higher prices and wild
capture accounting for the bulk of export volume; mussels, salmon, oysters and lobster shifting to value
(higher prices at lower volumes), while wild capture is experiencing falling volumes and price pressure
GROWTH MATRIX: 5Y # VS. 5Y CAGR $/KG VS. $/2015
NEW ZEALAND EXPORT VOLUME VS. AVG $/KG: BY SEGMENT Kg; US$/kg; US$; 2010-2015
KG; millions; US$/kg; actual; 2015
10%
$68.67 5Y CAGR of
Average average NZ
NZ export export value
value per per kilogram
kilogram US$/kg 10-
Mussels Bubble size is proportional to
US$/kg 15 export value in 2015; a $100
2015
8% bubble this size is US$100m
Oysters
6%
Salmon
4%
Lobster
Weighted average $2.84
2%
$10.30
$9.25
$7.94
0%
$5.35 Wild capture
$2.52
Processed seafood
-2%
Lobster
Salmon
Oysters
Processed
Mussels Wild capture
-10 -5 0 5 10 15 20
5Y growth in export volume; kg; m; 2010-2015
Proportional to NZ export volume in 2015
NOTE: Oysters includes wild catch and export (inseparable at source); Source: UN Comtrade database (from NZ Customs data); Coriolis classifications and analysis 36WILD CAPTURE Thanks to pioneering quota management systems, New Zealand has a long-term,
sustainable supply of ~450k tonnes of wild capture seafood available
WILD CAPTURE OF SEAFOOD IN NZ WATERS NZ WILD CAPTURE SEAFOOD EXPORTS
T; 000; 1950-2015 US$m; 2005-2015
10Y CAGR 10Y ABS
$598
Other Crustaceans 3% +$5
$574 $20
$1 Scallops -11% -$1
600 $15
$2 $39 Squid, etc. -11% -$87
$32 Tuna 6% +$14
$126
500
$18
400
Hoki
300
$505 White fish 2% +$93
$412
200
Other marine
100
Live fish
Squid $1 $2 6% +$1
- Other
2005 2015
1950
1953
1956
1959
1962
1965
1968
1971
1974
1977
1980
1983
1986
1989
1992
1995
1998
2001
2004
2007
2010
2013
Source: US FishStat database; UN Comtrade database; photo credit (CC BY-SA 1.0); Coriolis classifications and analysis 37ROCK LOBSTER New Zealand has a long-term, sustainable supply of rock lobster available; export value
growing strongly, with almost all volume now going to China/Hong Kong
NEW ZEALAND SPINY RED ROCK LOBSTER CATCH VOLUME GLOBAL CHILLED ROCK LOBSTER EXPORT VALUE BY REGION
T; 000; 1950-2015 US$m; 2005 vs. 2015 10Y CAGR 10Y ABS
$862
12
10 CAGR
9%
$521 Australia 11% +$338
8
6
$351
4
Other
$183
Europe $212 New Zealand 11% +$136
2
15%
$76
$42 South Africa 5% +$16
0 $26
$66 $87 Other 3% +$21
1950
1952
1954
1956
1958
1960
1962
1964
1966
1968
1970
1972
1974
1976
1978
1980
1982
1984
1986
1988
1990
1992
1994
1996
1998
2000
2002
2004
2006
2008
2010
2012
2014
2005 2015
EXAMPLE PRODUCTS: KIWI LOBSTER
NZ CHILLED/FROZEN LOBSTER EXPORT VALUE BY DESTINATION 2017
US$m; 2005-2015
CAGR $214
10% $1 Other
$163
$8
$213 China/HK
$80
$19 $155
$61
2005 2010 2015
Source: US FishStat database; UN Comtrade database; Coriolis classifications and analysis 38MUSSELS New Zealand has a strong position in green shelled mussel aquaculture, producing a third of global
green supply; export value growing strongly
NEW ZEALAND MUSSEL EXPORT VALUE NZ MUSSEL AQUACULTURE PRODUCTION
US$m; 2005-2015 Tonnes; 1950-2015
CAGR
10Y CAGR 10Y ABS
2%
France 100
$182
6%
$156 80
60
$112
$151 Mussels (not-live) 3% +$40 40
Other 20
Europe
15%
$1 0
1950
1952
1954
1956
1958
1960
1962
1964
1966
1968
1970
1972
1974
1976
1978
1980
1982
1984
1986
1988
1990
1992
1994
1996
1998
2000
2002
2004
2006
2008
2010
2012
2014
$1 Mussels, live 5% +$1
$43
$29 Mussels, prepared -4% -$14
2005 2015
EXAMPLE PRODUCTS: SEALORD
NZ SHARE OF GLOBAL MUSSEL EXPORT VALUE BY TYPE 2017
% of US$; share of tonnage; 2015
48.1%
NZ Share of
world trade
% of US$;
2015
0.9% 0.7%
Mussels (not-live) Mussels, prepared Mussels, live
Proportional to cross-border volume in tonnes in 2015
Source: US FishStat database; UN Comtrade database; photo credit (courtesy Sealord); Coriolis classifications and analysis 39SALMON New Zealand is the global market leader in King/Chinook Salmon aquaculture, a premium species
produced by aquaculture in New Zealand
NEW ZEALAND SALMON EXPORT VALUE AGGREGATE GLOBAL SALMON EXPORT GROWTH
US$m; 2005 vs. 2015 US$b; 2005 vs. 2015
$44 10Y CAGR 10Y ABS
$9.5
CAGR CAGR
9% 12%
$26 Salmon, chilled whole 9% +$15
CAGR
$19 CAGR 5%
$3.2 11% CAGR
5% $2.9
$11
$13 Salmon, frozen whole 10% +$8 $1.6 $1.8
$1.1
$0.6 $0.7
$5 2005 2015
$4 Salmon, smoked 5% +$2
$3 Other
$0 $1 11% +$0 Salmon, chilled whole Salmon, smoked Salmon, frozen whole Other salmon
2005 2015
AVERAGE EXPORT PRICE: WHOLE CHILLED SALMON: NZ & PEERS EXAMPLE PRODUCTS: MT COOK ALPINE SALMON
US$/kg; FOB; 2016 2017
New Zealand $11.10
United Kingdom $8.26
Australia $7.61
Canada $7.35
Norway $7.17
Chile $6.66
USA $5.84
Source: UN FishStat database; UN Comtrade database; photo credit (courtesy the great people at Mt Cook Salmon); Coriolis classifications and analysis 40New Zealand
Growth & Innovation
+ Horizons for growth + Mega-trends driving change
+ Emerging export stars + Innovation & new products
04
+ New viable optionsNew Zealand firms continue to develop a range of innovative new seafood products
THREE HORIZONS OF GROWTH HORIZON 3: NEW, VIABLE OPTIONS
- Beyond its mature core export products (Horizon 1), New Zealand - In Horizon 3, New Zealand is creating and nurturing a wide range of
has both a strong range of emerging export stars (Horizon 2) and viable options for future export success
continues to innovate and produce new, viable export options
(Horizon 3) - Four broad global consumer mega-trends are driving growth and new
product development in the food & beverage industry
HORIZON 2: EMERGING EXPORT STARS
- New Zealand seafood products succeeding on-shelf in export
- In Horizon 2, New Zealand is building a range of emerging export markets are aligned with these trends
products
- These trends drive new product development, through (1) packaging,
- Two seafood products emerge as “growth stars” – fish extracts and (2) product, (3) category and (4) channel innovation; success,
whole salmon – from an evaluation of ten years of product-level trade however, often comes down to implementation and execution
growth
- New Zealand seafood firms are delivering on…
- Fish extract exports are growing and the product plays to New
Zealand strengths in nutraceuticals - Packaging-driven innovation
- New Zealand whole chilled salmon exports are growing, with the US - Product-driven innovation
market as the key success, having grown from US$2m to US$15m in
a decade
- Category and channel innovation
42You can also read