Barriers and opportunities to workforce development to support housing and construction: a focus on affordable housing supply in the Mid North ...
←
→
Page content transcription
If your browser does not render page correctly, please read the page content below

Barriers and opportunities to workforce development to
support housing and construction: a focus on affordable
          housing supply in the Mid North Coast

               Report to the Australian Government,
    Department of Education, Employment and Workplace Relations

                            June 2013
Mid North Coast Affordable Housing Report
Acknowledgements
Regional Development Australia Mid North Coast (RDA MNC) acknowledges the Department
of Education, Employment and Workplace Relations (DEEWR) for the funding provided to
undertake this project. We would also like to acknowledge and thank the many participants
who donated their time and valuable insights during the focus groups held as part of this
research project. Furthermore, we would like to thank all the stakeholders who have shared
their knowledge and ideas into this process outside of the focus group sessions. For a full
list of all stakeholders consulted during this project, please refer to Appendix 1.
Acknowledgements are also made to the research and support team involved with this
project, namely:
Research team
o Todd Green (Research & Policy Officer, RDA MNC)
o Matthew Harrison (Project Research Officer, RDA MNC)
o Cassie Crompton (Project Research Assistant, RDA MNC)
o Professor Andrew Beer (Director, Centre for Housing Urban and Regional
Planning, Adelaide University) – Project Consultant
Support team
o Peter Tregilgas (Executive Officer, RDA MNC)
o Jenni Kew (Office Manager, RDA MNC)
o Tim Welsh (Communications & IT Officer, RDA MNC)
DISCLAIMER
This publication is produced by Regional Development Australia Mid North Coast based on information
available at the time of publishing. All opinions conclusions or recommendations are reasonably held or made
as at the time of its compilation, but no warranty is made as to accuracy, reliability or completeness. Regional
Development Australia Mid North Coast does not guarantee the accuracy of the data included in this
publication and accepts no responsibility for any consequences of their use.
Page 1 of 84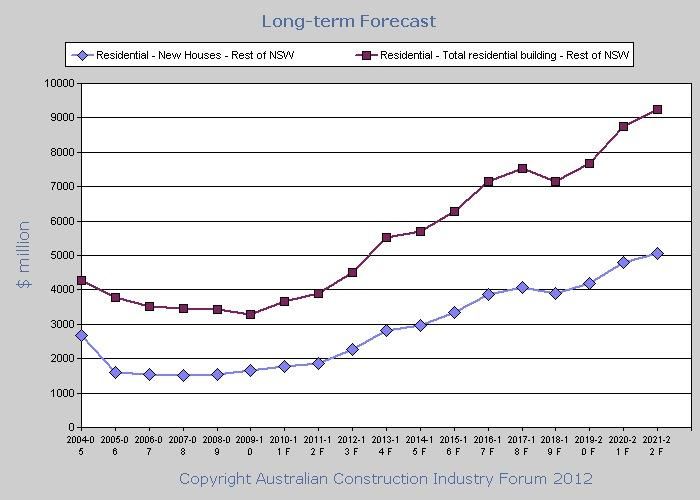
Mid North Coast Affordable Housing Report
Executive Summary
This is the final report in a research project that has been undertaken for the Department of
Education, Employment and Workplace Relations (DEEWR) by Regional Development
Australia Mid North Coast to build knowledge and understanding of issues related to the
supply of additional affordable housing in the New South Wales Mid North Coast which can
support additional training and employment outcomes for the region in addition to
increasing housing supply. Funding for this project was provided through the Flexible
Funding Pool (FFP) to support the activities of Local Employment Coordinators in priority
employment areas and the Building Australia’s Future Workforce strategy.
The Mid North Coast of NSW has an older population, especially when compared with the
rest of NSW. This contributes to lower average incomes in the region, which in turn
represents a challenge for the housing construction sector and the effective supply of
affordable housing. On the other hand, while older Australians tend to have lower incomes
when compared with the rest of the population, they also have greater wealth holdings and
strategies should be considered that mobilise this wealth for investment in the region’s
housing stock.
The findings highlighted in relation to workforce development opportunities and barriers to
support construction in the Mid North Coast are:
One opportunity to increase employment and economic activity in the building and
construction sector within the region is to further examine import replacements, as
current import levels support 357 jobs outside of the region.
To increase the number of local businesses involved in larger scale projects, a
consortium of local businesses could work together to bid on these larger projects
and undertake group buying of materials to reduce costs for smaller operators.
Additional promotion of construction as a rewarding career to new and existing
entrants to the workforce. Stimulating the housing construction industry has strong
Page 2 of 84
Mid North Coast Affordable Housing Report
potential to boost employment in the region and through this the Mid North Coast
can offer a great career and lifestyle package.
For the stimulus of the housing construction market on the Mid North Coast in the
current softening labour market, particular focus should be given to targeting
existing support programs and the development of new programs where needed, to
meet the specific needs of the industry.
There are significant non-residential construction projects currently in the region, or
projects which have been awarded funds and yet to commence (including Pacific Highway
upgrade, upgrades to the Port Macquarie and Kempsey Hospitals, regional airport upgrades,
Charles Sturt University campus e.t.c). Although this does not address affordable housing,
increases in construction in the region supports the regional economy and skills
development. There is concern among local industry of the over utilisation of external
companies and employees for large projects and that options to increase local supply
include:
Supporting the formation of local consortiums where businesses team up to work
together as a group to take on big scale projects that would normally go to
companies from outside the region
Group buying of construction materials to reduce costs for smaller operators, and to
promote collaboration
Opportunity for filtering tenders through local industry companies to help local
businesses apply and keep on track with what tenders are available.
The findings highlighted in relation to identifying potential models and projects within the
affordable housing sector which are appropriate to the Mid North Coast are:
working with the Indigenous community and the Local Aboriginal Land Councils in
the region to identify and develop affordable housing;
Page 3 of 84
Mid North Coast Affordable Housing Report
Discussions be held with all relevant parties in regards to the collaborative model
proposed which utilises available land from the Department of Housing, churches or
local aboriginal land councils in combination with a collective of local builders;
Realising the potential of the older population in the Mid North Coast region to
stimulate investment in housing – both in the redevelopment of some housing stock
and in the development of new investment strategies for the region’s older
population;
Increasing the local supply of inputs into the Residential Construction sector in the
region. The sector currently imports $146 million (2010-2011 financial year) which
supports 357 jobs outside of this region. This could reduce costs of materials as well
as increase employment opportunities and boost the regional economy.
Unlocking the ability of local government to deliver affordable housing through both
new and established mechanisms; and,
Attracting new participants into the housing and land development industries in the
Mid North Coast region. Such additions have the potential to both add investment
to the sector and encourage innovation amongst existing participants.
Page 4 of 84
Mid North Coast Affordable Housing Report

Contents
Acknowledgements................................................................................................................................. 1
Executive Summary................................................................................................................................. 2
Introduction ............................................................................................................................................ 6
Affordable Housing on the Mid North Coast .......................................................................................... 7
   Key Points............................................................................................................................................ 7
   Introduction ........................................................................................................................................ 8
   Demand for Affordable Housing ......................................................................................................... 9
       Regional Demographics ................................................................................................................ 10
   Supply of Affordable Housing ........................................................................................................... 23
       Barriers to Supply .......................................................................................................................... 23
   Stakeholder Plans and Government Programs ................................................................................. 32
   Target Groups for Housing Developments on the Mid North Coast ................................................ 36
Workforce Development ...................................................................................................................... 39
   Key Points.......................................................................................................................................... 39
   Introduction ...................................................................................................................................... 40
   Training Volumes .............................................................................................................................. 41
   Issues and Completion Rates ............................................................................................................ 42
   Pathways into Construction .............................................................................................................. 46
   Employment Opportunities and Outcomes ...................................................................................... 47
Models and Project ideas for the Mid North Coast .............................................................................. 55
   Affordable Housing Models and Financing ....................................................................................... 55
   Potential Projects for the Mid North Coast ...................................................................................... 60
       Consortium of Local Builders ........................................................................................................ 60
       Local Aboriginal Land Councils ...................................................................................................... 61
       Collaborative Model with NSW Department of Housing .............................................................. 62
       Taking Advantage of Demographic Opportunities ....................................................................... 66
       Mobilising Local Government Potential........................................................................................ 67
       Seeking New Participants in the Housing and Development Industry ......................................... 69
Conclusions and Recommendations ..................................................................................................... 70
References ............................................................................................................................................ 73
Appendices............................................................................................................................................ 77

                                                                    Page 5 of 84
Mid North Coast Affordable Housing Report
Introduction
This is the final report in a research project that has been undertaken for the Department of
Education, Employment and Workplace Relations (DEEWR) by Regional Development
Australia Mid North Coast. The purpose of this research project is to identify:
The common issues, barriers, gaps and opportunities of affordable housing
development in the Mid North Coast
Workforce development opportunities and barriers to support construction in the
Mid North Coast
Potential models and/or projects within the affordable housing sector which are
appropriate to the New South Wales Mid North Coast.
The methodology used for this research project was a combination of desktop research and
analysis, the use of focus groups with key stakeholders and discussions with relevant parties
in regards to potential housing models. Desktop research and analysis was used to:
detail current issues/trends and regional data relevant to affordable housing,
construction, skills and employment,
analyse construction related apprenticeships and traineeships volumes and
completions in the region, and
explore financing mechanisms for affordable housing and available government
support programs.
The desktop research and analysis was complemented with two focus group sessions with
stakeholders involved in housing and construction in the Mid North Coast region. Focus
group participants involved representation from Real Estate Agents; Lenders; Trainers;
Housing and Construction industry bodies (HIA, MBA, CPSISC); Local Aboriginal Land
Councils; local builders and developers, Local Council planners and others. The sessions
were used to gather stakeholder input on major issues and potential solutions and
opportunities for affordable housing development in the region.
Page 6 of 84Mid North Coast Affordable Housing Report
Affordable Housing on the Mid North Coast
Key Points
Regional demographic pressures are adding to the demand for increased affordable
housing, including:
o A high percentage of elderly in the region (21%, 65 years and over) compared
with NSW (14.7%, 65 years and over).
o The median Mid North Coast income represents 67% of the NSW median
income and 29% of people over 15 years in the Mid North Coast earn less
than $299 per week compared with only 2.7% in NSW.
o A high proportion of the population identifying as Aboriginal or Torres Strait
Islander – 5.1% of the region compared with 2.5% of NSW.
o Rents and mortgages are increasing at a higher rate than incomes in the
region. Between 2006 and 2011, incomes have increased 3.4% per annum.
However, rents have increased 6.7% per annum and mortgage repayments
4.8% per annum.
o There is overcrowding present in many dwellings in the region, for example
105 households report more than 3 people living in a one bedroom dwelling
and 52 dwellings in one council area have 5 people or more living in 2
bedroom accommodation.
The residential construction sector is currently very soft and the majority of work in
this region is on alterations and additions to existing buildings, that is not new builds.
The Residential Construction sector on the Mid North Coast has declined 6.7% in
total turnover from the 2009-10 to the 2010-11 financial year.
The current stock of housing on the Mid North Coast includes only 4.3% of dwellings
committed as State Housing/housing co-operatives, community or church group
housing and there are significant waiting times for general community housing
applicants.
The main barriers to the supply of affordable housing include: expenses/financial,
planning and regulations.
Page 7 of 84Mid North Coast Affordable Housing Report
Median rental yields in the region do not exceed 4.8%. Unattractive rental yields
and current market confidence are barriers to encouraging private investment into
the housing market.
Introduction
Housing is a central component to stability of one’s life. The importance of housing is not
represented by the current affordability and accessibility of the housing market. In
particular the housing market of the Mid North Coast is under pressure to provide more
affordable housing to the local population.
This pressure within the housing market is related to particular demographics that represent
a demand for a larger proportion of affordable housing to be present in the region. A higher
percentage of elderly are concentrated in the region (21%, 65 years and over) compared
with NSW as a whole (14.7%, 65 years and over). Furthermore the Mid North Coast has a
much higher percentage of people both earning less than the NSW median income as well
as a higher percentage of people earning in the low income bracket (29.2% of people aged
over 15 in the Mid North Coast earn less than $299 a week compared with 2.7% in NSW) .
There have been a number of reports which further replicate the need for affordable
housing in the Mid North Coast.
Key points addressed in the foreword of the 2010 report ‘Going nowhere, how the planning
system and development levies are ruining NSW’ provide an adequate understanding of
why the affordable housing issue is of high importance in the Mid North Coast. Mentioned
in the foreword is the concern found by BIS Shrapnel which includes but is not limited to;
the concern that NSW is poorly prepared to deal with the challenges of an aging population.
The Mid North Coast has 36.6% of its population over 55 compared with 26.3% overall in
NSW. This suggests that if NSW as a whole has concerns regarding caring for the aging
population then the Mid North Coast in particular needs to consider the findings. These
Page 8 of 84Mid North Coast Affordable Housing Report
findings include determining the current state of the housing and construction market on
the Mid North Coast which has been described as ‘poor, slow and bad’ by stakeholders
within the region.
The demand for housing has slowed in the region and is represented by the decline in
residential construction. The Residential Construction sector on the Mid North Coast had
turnover of $775.977 million (financial year 2010-11), this represents a decline of 6.7% from
the previous financial year and this decline is on par with the New South Wales
results. Further, the Residential Construction sector maintains 2.1% of jobs in the Mid North
Coast region and the broader construction industry supports 6.5% of jobs in the region
(REMPLAN 2006). Affordability of housing has a direct impact on the construction industry
and one in which shifts employment, capital and growth in the region.
The state of the housing industry across Australia is in a slump and has been for some time
now. For the Mid North Coast this has been reflected in a slowing of the housing and
construction industries. Stakeholders within the community described the current state of
the housing and construction market as ‘bad’ but recognised that it is ‘still not as bad as
other parts of Australia’ (Focus Group Attendant 2012). Maintaining an employee in the
region is described to be ‘difficult’ as most of them left to ‘chase the dollars in the mines’
(Focus Group Attendant 2012). For the small amount of construction that is happening in
the region and that is dedicated to housing, the overall opinion was that any housing that is
being produced is not servicing the affordable housing market.
Demand for Affordable Housing
Affordable housing is described to be where no more than 30% of a household’s weekly
income is dedicated to housing costs and the household’s weekly income is in the bottom
40% of the earning population (Disnay 2007). This benchmark is to allow for other basic
needs of the household to be met. Although this is a generally accepted benchmark
Page 9 of 84Mid North Coast Affordable Housing Report
definition for ‘affordable housing’, the scope of this project is not limited to a strict
definition and has wider objectives of identifying ways to increase housing
supply/construction activity and the employment outcomes.
Regional Demographics
The demand for housing in the Mid North Coast can be exemplified by a number of cases.
Quantitative analysis of the economic conditions of the region, in particular incomes,
mortgages, rent, housing costs and demographics have an impact on the needs of the Mid
North Coast. Table 1 shows the breakdown of median rent by local government area on the
Mid North Coast and calculates the affordability of rental housing.
Table 1. Rental affordability on the Mid North Coast
Median Median Weekly % of % of local
Weekly Household income government area
Local
rent Income spent on earning below the
Government
rent income bracket that
Area ($) ($)
holds the median
household income
Port Macquarie 250 838 30% 32.5%
Taree 200 770 26% 22.7%
Bellingen 220 785 28% 35%
Coffs Harbour 255 900 28% 29.9%
Kempsey 190 752 25% 23.5%
Nambucca 195 702 28% 25.3%
Source: ABS Census of Population and Housing 2011
Page 10 of 84Mid North Coast Affordable Housing Report
The rental figures alone suggest that rental housing on the Mid North Coast is affordable to
anyone who earns the median weekly income or above. The last column in Table 1 identifies
the proportion of the population that earns a weekly household income below the median
income identified in column 3 – for example, Port Macquarie has 32.5% of its households
earning less than $800-$999 a week.
The affordability of rental properties is also skewed by the 16% of rental properties that are
managed by the State or Territory housing authority or is classified as a housing co-
operative, community or church group housing. These groups provide lower cost renting for
a proportion of those in the low income bracket. This brings down the median cost of
weekly rent for the Mid North Coast. According to Disnay (2007) the provision of this service
is falling with a 30% decrease in the opportunity to rent social housing having occurred over
the last decade.. This decrease is equivalent to an extra 100,000 social housing dwellings
today if the rate of supply had been maintained by the Australian government (Disnay
2007).
The 2012-2013 NSW budget supplied some changes that will impact affordability of housing
at various levels. The Building the State package plans to deliver $561 million towards
funding infrastructure. This intends to accelerate housing construction in NSW (NSW State
Government 2012). The benefits of this funding include first homebuyers of new homes.
The scheme identifies this group as being up to $19,245 better off once purchasing their
new home since the release of the new budget. This concentration of funding supplied to
those who are purchasing new homes plans to stimulate new home construction in NSW
(NSW State Government 2012).
Figure 1 below indicates the Mid North Coast has a large proportion of the population in the
mature age bracket. It also indicates the low proportion of 20-30 year olds in the region.
Page 11 of 84Mid North Coast Affordable Housing Report
Figure 1. Population distribution by age for Mid North Coast (2011)
Population distribution by age Mid North Coast
(2011 Census)
85 years & over 2.9%
75-84 years 7.2%
70-74 years 5.2%
65-69 years 6.5%
60-64 years 7.5%
55-59 years 7.3%
50-54 years 7.5%
45-49 years 6.8%
40-44 years 6.1%
35-39 years 5.3%
30-34 years 4.3%
25-29 years 4.1%
20-24 years 4.7%
15-19 years 6.3%
10-14 years 6.6%
5-9 years 6.0%
0-4 years 5.8%
0.0% 1.0% 2.0% 3.0% 4.0% 5.0% 6.0% 7.0% 8.0%
Source: using data from ABS Census of Population and Housing 2011
The population distribution graph is representative of the areas of concern in the region for
both affordable housing and work force development. Having such a high proportion of
elderly in the region demands particular services. Furthermore the concave nature incurring
the 20-34 year age group identifies a lack of young adults in the region. Qualitative findings
on the desires the population have in regards to their financial and lifestyle circumstance
should also be considered. Foremost, consideration of the financial status of the population
of the Mid North Coast identifies the demand for affordable housing.
Page 12 of 84Mid North Coast Affordable Housing Report
NSW incomes have had a 3.1% increase per annum between 2006 and 2011. Incomes in the
Mid North Coast have risen by 4% per annum between 2001 and 2006 and a further 3.4%
per annum between 2006 and 2011. Data reveals that although incomes in the Mid North
Coast have risen an extra 0.3 % points per annum (2006-2011) compared with NSW as a
whole, Mid North Coast income is still largely below the median income for NSW. The 2011
census data revealed the Mid North Coast median income represents only 66.8% of the
median NSW income.
In context, rent has increased 5.9% per annum between 2001 and 2006 and 6.7% per
annum between 2006 and 2011 in the Mid North Coast. Mortgage repayments have also
increased in the region from 6.1% per annum between 2001 and 2006 as well as a further
4.8% per annum between 2006 and 2011. Therefore adding to the affordability challenge is
rent and mortgage repayments increasing at a higher rate than income levels. This increased
cost of mortgages is causing a larger proportion of the region to rent as oppose to purchase
a house. Table 2 shows the breakdown of tenure type over a period of time. This identifies
the proportion of the population owning outright, repaying a mortgage and renting. It also
shows a comparison between the Mid North Coast region and NSW.
Table 2. Tenure type* of dwellings in the Mid North Coast and New South Wales
Owned with a
Owned outright mortgage Rented
Area 2001 2006 2011 2001 2006 2011 2001 2006 2011
Mid North Coast 46.6% 41.3% 39.9% 20.7% 25.8% 26.1% 27.2% 26.4% 27.4%
NSW 41.1% 33.2% 31.9% 23.3% 30.2% 31.9% 28.8% 28.4% 29.1%
Source: using data from ABS Census of Population and Housing 2011
* Figures do not equal 100% as there is a small portion of the population not stating tenure type or living in an
‘other’ tenure type.
Page 13 of 84Mid North Coast Affordable Housing Report
Table 2 demonstrates the largest decline has occurred in the proportion who own their
home outright. There has been an increase in both the percentage of the Mid North Coast
and NSW who own their home with a mortgage. Rental properties have remained similar.
This identifies that a larger proportion of the population has the potential to be placed in
housing stress. The proportion of outright home ownership has declined in the region by
6.7% points between 2001 and 2011. The process of purchasing a house is a large financial
commitment and one in which unfortunately a proportion of the Mid North Coast cannot
manage affordably.
Table 3 below advises the loan amounts that are affordable based on the median weekly
incomes in the Mid North Coast. Table 3 also indicates the median amount households in
the Mid North Coast are paying towards rent. This demonstrates that based on the actual
median mortgage repayments all areas in the Mid North Coast are paying a mortgage that
exceeds 30% of median income.
Page 14 of 84Mid North Coast Affordable Housing Report
Table 3. Affordable Mortgage in the Mid North Coast considering interest rates and median household incomes
30 year repayment period
6% interest 6.5% interest 7% interest
rate rate rate
Median weekly 30% 30% of Mortgage Mortgage Mortgage Actual
family income Income Monthly serviceable serviceable serviceable median
($) Weekly Income ($) based on 30% based on 30% of based on 30% Mortgage
($) of median median weekly of median Repayments
weekly family family income weekly family ($)
Area
income income
Coffs Harbour 1,097 329.10 1,426.10 237,500 225,500 214,400 1,575
Port Macquarie 1,008 302.40 1,310.39 218,500 207,300 197,000 1,650
Taree 930 279.00 1,209.00 201,700 191,300 181,700 1,300
Kempsey 902 270.60 1,172.59 195,500 185,500 176,200 1,300
Nambucca 853 255.90 1,108.90 184,900 175,300 166,600 1,200
Bellingen 938 281.40 1,219.39 203,400 193,000 183,300 1,300
Source: ABS Census of Population and Housing 2011
Page 15 of 84Mid North Coast Affordable Housing Report
Table 4 compares the median house sale price in 2011 on the Mid North Coast with an
affordable mortgage based on a 6% interest rate. This indicates that for every local
government area in the Mid North Coast the median house price exceeded the affordable
mortgage amount. The largest differences between median house prices and an affordable
mortgage level occur in Coffs Harbour, Port Macquarie, Nambucca and Bellingen local
government areas.
Table 4. Median house prices in the Mid North Coast compared with affordable mortgages
Median House prices 2011 Affordable Mortgage
calculated on a 6% interest
rate using 30% median
Local Government Area family income
Coffs Harbour 366,750 237,500
Port Macquarie 388,500 218,500
Taree 229,500 201,700
Kempsey 207,500 195,500
Nambucca 300,500 184,900
Bellingen 360,000 203,400
Source: Real Estate.com.au (Median house prices 2011)
Housing stress can be largely a financial concern, however there are other forms of housing
stress which are equally important and should be considered. Overcrowding in many
dwellings reiterates the need for more affordable housing in the Mid North Coast. The 2011
ABS census data reports that there are 105 households in the Mid North Coast where more
than 3 people are living in a one bedroom dwelling. In particular 17.8% of these households
are found in Coffs Harbour. Furthermore, Kempsey has 52 dwellings where 5 people or
Page 16 of 84Mid North Coast Affordable Housing Report
more are living in a 2 bedroom household. Overcrowding in houses can be an indication of
the limited affordable houses available.
The concern about the lack of affordable housing is widely spread with “nine out of ten
Australians worried about a lack of infrastructure and affordable housing given the growing
and aging population” (Advertiser 2010). The aging population is evident in NSW with a
rising median age from 35 in 2001 to 38 in 2011. The Mid North Coast has a median age of
45.6 years as of 2011; which is 7.6 years older than the state average.
These demographics influence the demand for particular housing structures. Age structure
and family composition impact what type of dwelling is needed. The construction of houses
to meet these needs will require innovative ideas surrounding what a home needs to be.
The national housing supply council has created a projection of the household arrangement
changes from 2010-2030. It projects that two-parent families will decrease from 31.4% of
households to 27.4%. Furthermore the report finds that lone households will increase from
26% to 31.6% (NHSC 2011). This will create a substantial increase in demand for different
types of dwellings with an estimated 42.7% increase in households living in flats as well as a
41.7% increase in households living in semidetached dwellings. The Australian Construction
Industry Forum reported that there will be an increase in improvements of existing housing
over the next decade.
Figure 2 replicates these projected shifts with a sharper increase in 2013 for total residential
building compared with the increase in new houses. This total residential building
represents alterations on existing houses including extensions and additions.
Page 17 of 84Mid North Coast Affordable Housing Report
Figure 2. Long Term Forecast Residential building construction in the rest of NSW
(i.e. excluding capital cities)
Source: The Australian Construction Industry Forum 2012
Further, the Australian Construction Industry Forum forecasts indicate that by 2022,
alterations and additions will be valued in today’s dollars at over $70 billion. This will
surpass new home development at $25 billion, and units and townhouses at $26 billion
(ACIF 2012).
The demand for a shift in the dwelling types available in the Mid North Coast is evident with
a 0.8% increase per annum from 2006 to 2011 in separate dwelling structures compared
with a 1.7% increase per annum from 2006 to 2011 in semi-detached or terrace houses. This
could be related to a number of factors including the above shift in dwelling occupancy.
Secondly, smaller dwellings are often a more affordable option. Thirdly many people are
opting to live closer to urban areas as opposed to moving to outer suburbs. To counter the
Page 18 of 84Mid North Coast Affordable Housing Report
demand for urban living higher density housing is being built in the urban areas. This higher
density housing is described as urban infill. The Australian Construction Industry Forum
(2012) indicated this urban infill will cause many older single dwelling structures to be
removed in order to make space for higher density living. In regards to the housing needs of
the Mid North Coast consideration of dwelling types is important in catering for the large
proportion of mature aged persons living in the region.
The Mid North Coast has 36.6% of its population over 55 compared with 26.3% overall in
NSW. Having such a high percentage of elderly persons within the population of the Mid
North Coast creates specific demand issues for both affordability and dwelling type.
Research suggests that by 2021 four in every ten households will be occupied by at least one
older person, with a majority living alone or in a couple (AHURI 2004). Those living alone will
not only be dominated by an older population but a shift to single person households in all
age groups is expected. This shift is being driven by a falling marriage rate, low birth rates
and high rates of divorce and separation.
Previously home ownership for those 65 years and over has been 73% with another 6%
close to home ownership (AHURI 2004). However research by the Australian Housing and
Urban Research Institute finds that the absolute number of people entering old age as
renters will increase and a larger proportion will be in the private rental market. The Mid
North Coast will need to increase the availability of affordable housing and dwellings that
are appropriate for an aging population. At present housing construction is dominated by
family housing and has not yet adjusted to the social trends. Stakeholders in the Mid North
Coast identified that builders were encouraging their clients to build more affordable
housing that can be used for a range of purposes other than family housing. This makes for a
more affordable build as well as a good opportunity to sell off or rent out.
Alterations and additions have been one option greater numbers of households have turned
to in response to the challenge of securing affordable housing. Alterations and additions on
Page 19 of 84Mid North Coast Affordable Housing Report
existing houses have risen between 2008 and 2011. The 2007-2008 data reveals there were
976 applications for development approval for alterations and additions and in 2010-2011
this had increased to 1,229 in the Mid North Coast region. Stakeholders within our region
verified this trend with builders discussing a much larger proportion of their work is
dedicated to smaller building works, alterations and additions than in previous years.
Residential alterations and additions comprised 40% of all approvals in 2010-2011 (NSW Dpt
Planning and Infrastructure 2011). Alterations and additions are allowing children to stay in
the home for a longer period of time. Other options include secondary dwellings and granny
flats of which increased 11% from 2009-2010 to 2011 (NSW Dpt Planning and Infrastructure
2011).
State or Territory authority dwellings, housing co-operatives, community and church group
housing provide housing to those on a low income. The Mid North Coast has 4.26% of
dwellings committed as State or Territory housing/ housing co-operatives, community or
church group housing. This percentage in regards to the total amount of dwelling structures
on the Mid North Coast has had minimal change since 2001. In 2001 State or Territory
housing/housing co-operative, community or church group housing made up 4.54% of
dwellings in the Mid North Coast. This had further declined by 2006 to make up 4.30% of
dwellings on the Mid North Coast.
In addition to the social and community housing stock in the region representing only 4% of
dwellings, there are significant pressures from large waiting lists for social/community
housing in the region (Table 5) which further support the demand for affordable housing.
The majority of locations have waiting times which exceed 5 years for certain dwelling types
and several locations that have an over 10 year wait.
Page 20 of 84Mid North Coast Affordable Housing Report
Table 5. Expected wait times for general social and community housing applicants in the
region (as at 30 June 2012)
Dwelling size
Location Studio 1 bedroom 2 bedroom 3 bedroom 4 bedroom
Taree n/a 2-5 years 2-5 years 5-10 years 2-5 years
Port Macquarie 2-5 years 2-5 years 5-10 years 10+ years 10+ years
Kempsey n/a 2-5 years 2-5 years 2-5 years 2-5 years
Macksville n/a 5-10 years 5-10 years 5-10 years 5-10 years
Bellingen n/a 5-10 years 5-10 years 2-5 years 5-10 years
Dorrigo n/a 5-10 years 10+ years 5-10 years 10+ years
Coffs Harbour n/a 2-5 years 5-10 years 10+ years 5-10 years
Laurieton n/a 2-5 years 10+ years 5-10 years 5-10 years
Wauchope n/a 2-5 years 2-5 years 2-5 years Up to 2 years
Woolgoolga n/a 5-10 years 10+ years 5-10 years Up to 2 years
Crescent Head n/a 2-5 years Up to 2 years 10+ years n/a
Wingham n/a 5-10 years 10+ years 10+ years 10+ years
Nambucca n/a 5-10 years 5-10 years 5-10 years 2-5 years
Urunga n/a 5-10 years 5-10 years 2-5 years Up to 2 years
Source: NSW Government Family and Community Services, Housing NSW, Housing
Pathways waiting times. Shaded cells on the table illustrate waiting times in excess of 5
years.
The seriousness of the housing market in Australia has been identified by global
organisations. The United Nations Human Rights Council Geneva report identified Australia
as being in the grip of a ‘serious national housing crisis characterised by reductions in public
housing.... an acknowledged housing affordability crises and no real reductions in the
number of homeless’ (Kothari 2007). The report identifies 9% of indigenous peoples as
being homeless. The Mid North Coast has 5.1% of its population identifying as Aboriginal or
Torres Strait Islander compared with 2.5% of NSW’s population in 2011 (Figure 3). The high
rate of indigenous homelessness on a national level, in conjunction with this regions higher
than state average indigenous population adds to the concern regarding the issue of
accessibility and affordability of housing in the region.
Page 21 of 84Mid North Coast Affordable Housing Report
Figure 3. Proportion of population identifying as Aboriginal or Torres Strait Islander
Aboriginal and Torres Strait Islander Population
Growth
6.0%
5.0%
4.0%
3.0%
2.0%
1.0%
0.0%
2001 2006 2011
Mid North Coast NSW
Source: ABS Census of Population and Housing 2011
In addition to the current and trending demographics of the Mid North Coast adding
pressures to the demand for affordable housing, there is a considerable amount of
construction activity committed for the region which will also increase the need for
accommodation for additional workforce required during the construction phases and the
increases in employment post construction. For example, the demand on the health sector
in the Mid North Coast region could add 2,000 workers over the next five years. Some of
the key construction projects in the region include:
Upgrades to Port Macquarie Hospital ($110 million)
Upgrades to Kempsey Hospital ($80 million)
Upgrades to Port Macquarie, Kempsey and Taree airports
Pacific Highway upgrades
Construction of Charles Sturt University Port Macquarie campus
Page 22 of 84Mid North Coast Affordable Housing Report
Supply of Affordable Housing
The supply of affordable housing is not adequate for the demand identified in the Mid North
Coast Region. The stakeholders involved in the affordable housing market from both the
supply and demand side identify planning, regulatory and financial barriers as being the
most significant causes of not meeting the demand.
Barriers to Supply
Consideration of literature resulted in consultation, through focus groups, with a number of
stakeholders involved in the housing market asking ‘What are the main barriers to the
supply of affordable housing?’ The discussion returned similar answers that mirrored the
literature:
Expense/finance- related to levies, land costs and contributions. ‘The cost for a
developer to develop land can be up to $30,000 per block... which is a large financial
commitment for developers when the housing market is so slow’ (Focus Group
Attendant 2012).
Planning- including complexities, continued changes and mentions that ‘a good
amount of knowledge of planning is needed before entering the market’ (Focus
Group Attendant 2012).
Regulations- including legislations and timeframes in relation to both planning and
regulatory processes and quantity of legislative bodies.
Expense and Financial Barriers
One stakeholder identified that ‘The expense of housing compared with the incomes in
particular areas of the Mid North Coast region makes purchasing a house often
unattainable... this is reflected by the main industries of employment in the region’ (Focus
Group Attendant 2012). There is a considerable amount of employees in the region
employed on a casual basis and/or within seasonal sectors – in particular the Tourism sector
Page 23 of 84Mid North Coast Affordable Housing Report
supports 7.5% of jobs in the Mid North Coast and the Retail Trade sector supporting 14.9%
of jobs (REMPLAN 2006).
Financial barriers to supply of affordable housing are a large concern for all parties involved
in the housing industry. The obvious concern would be the personal finance of the party
wishing to invest in housing either through renting, purchasing for private use or using the
housing industry as a way to generate investment. However stakeholders identified the
large financial contribution builders are outlaying whilst lowering their profit margins to
maintain employment. Many of the stakeholders involved in the consultation process
identified the costs that builders are absorbing to keep the residential construction industry
afloat have been growing. Growth in the industry will prop up expenditure in the region and
encourage further construction.
Low rental prices can be a cause of insufficient private investment into the housing market.
Evidence of this can be viewed in the calculated rental yields of each local government area.
Rental yield according to the InvestEd group (2006) is a measure of the percentage of
income you receive back from a housing asset. Literature suggests private investment into
the housing market is an important component to improving the state of affordable
housing.
Table 6 examines the rental yield based on the median house prices and median rental cost
for each Mid North Coast local government area in 2011. For investment purposes an
attractive rental yield would be around 5.8%-6.5% and according to InvestEd Group (2006)
any yield below this would not usually be an attractive investment. First home buyers are
being encouraged to purchase through the First Home Owners Scheme. Australia has seen a
drop of first home owners as a percentage of all purchases from 21.8% in 1996 to only
17.5% in 2007 (Hill & Tiley 2010). The NSW Government Building the State package is a
stimulus to encourage first home owners to enter the market. In particular the package
Page 24 of 84Mid North Coast Affordable Housing Report
encourages first home owners to build new homes which will boost the residential
construction industry.
Table 6. Rental Yield Comparisons for the Mid North Coast
Local Median Median Rental Yield
Government House Annual
Australia prices 2011 Rent 2011
Port Macquarie 388,500 13,000 3.3%
Bellingen 360,000 11,440 3.2%
Kempsey 207,500 9,880 4.8%
Nambucca 300,500 10,140 3.4%
Taree 229,500 10,400 4.5%
Coffs Harbour 366,750 13,260 3.6%
Source: ABS Census of Population and Housing 2011
Planning and Regulation Barriers
The Australian Housing and Urban Research Institute (AHURI) have identified planning
system complexity as a concern that contributes to the affordability of houses. The
Weekend Australian (2012) reported that affordability issues are “largely the result of
planning and regulatory complexities and costs” (Studdert, 2012, p.6). The planning and
regulation systems in place on the Mid North Coast vary between local government areas.
This is identified in the region and is noted in the Port Macquarie Hastings Council’s
affordable housing strategy where it states ‘‘opportunities to streamline the development
assessment process should be explored” (SGS Economics and Planning 2006, p. 17).
Page 25 of 84Mid North Coast Affordable Housing Report
Streamlining this process would make the entire procedure more efficient for those
involved.
Section 94 contributions are one such difference between councils in the region. Additions
to existing dwellings such as granny flats involve different contributions depending on the
local government area the dwelling is located. Some council’s assume the contribution
based on the building cost and others classify it as an addition which requires a smaller
contribution fee.
The section 94 contributions also identify inconsistencies with planning systems which can
add to the financial uncertainty of developments. Section 94 or 94a contributions can be at
the discretion of councils in relation to the type of development and the impact the
development will have on community resources. This makes it difficult for costs related to
the planning process to be factored into financial planning. Stakeholders in the local region
described section 94 contributions as a factor that impacts the way in which land is utilised.
One stakeholder described this in reference to building duplexes, which are often a more
affordable option for consumers as well as making greater use of the available land.
However, the section 94 contribution incurs a higher fee for the construction of duplexes on
a single block of land; for a developer that means incurring a larger initial outlay. As the
stakeholders advised at the focus group sessions, many developers are waiting for the
market to pick up before continuing any further development and the prospect of a greater
outlay for duplexes to be built in an uncertain environment is a significant risk. The term
used by many of the stakeholders was ‘sitting on their hands’ in reference to waiting for the
market to pick up (Focus Group 2012). The supply of construction and housing services is
ready and prepared to start building for when the market demand returns.
AHURI identifies uncertain development application timeframes as a barrier to the supply of
affordable housing. Holding cost is identified by the Australian government as one such
supply side barrier. Holding costs refer to the financial cost incurred due to the lengthy
Page 26 of 84Mid North Coast Affordable Housing Report
timeframes it can take for development and purchasing to pass through the systems in place
(FAHCSIA 2012). The Housing Affordability Fund is a direct result of the government’s
attempt to lower these holding costs. Timeframes can vary depending on a range of factors.
The uneven distribution of development application timeframes on the Mid North Coast
illustrates this variance. Table 7 shows the average amount of time it takes to get
development application approval in the local government areas of the Mid North Coast.
Table 7. Average amount of days for development application processing in the Mid North
Coast by local government area 2010-2011
Mean gross Mean gross Mean gross Mean gross
time for DA days for new days for days for new
determined single alterations second
2010/2011 dwelling DA and occupancy DA
determined additions DA determined
2010/2011 determined 2010/2011
2010/2011
Local Government Area
Bellingen Shire Council 91 89 71 129
Coffs Harbour City Council 73 61 35 92
Greater Taree City Council 82 74 48 55
Kempsey Shire Council 41 39 26 53
Nambucca Shire Council 69 49 50 93
Port Macquarie-Hastings 81 62 61 130
Council
Mid North Coast 72.8 62.3 48.5 92
Source: Local Development Performance Monitoring spreadsheet 2010-2012, NSW
Department of Planning and Infrastructure
Page 27 of 84Mid North Coast Affordable Housing Report
The average number of days for a development approval on the Mid North Coast is 72.8
days which compares with an average of 59.3 days for NSW. The Mid North Coast had only
2% of all development applications refused in 2011, suggesting that the approval of
development applications is not the concern rather the timeframe it takes to gain approval.
AHURI also identifies a lack of adequate resources at the local government level as one
explanation to the timeframes associated with planning regulations. One impact on
planning regulation timeframes is the amount of staff available to process applications.
There has been a decrease of staff on the Mid North Coast allocated to development
application processing from 2007-08 to 2010-11 (Table 8).
Table 8. Distribution of equivalent full time staff allocated to Development Applications on
the Mid North Coast and equivalent change in timeframes for determination
Full time equivalent Full time equivalent % change in mean
staff 2007-2008 staff 2010-2011 time for DA
determined
2007/2008-
Local Government Area 2010/2011
Bellingen 3.5 3 -11%
Coffs Harbour 16 8.5 9%
Greater Taree 6 9 17%
Kempsey 3 2.75 -59%
Nambucca 3 3 -44%
Port Macquarie 6 6 11%
Mid North Coast 37.5 32.25 -18%
Source: Local Development Performance Monitoring Spreadsheet 2007/2008-2010/2011,
NSW Government Department of Planning and Infrastructure
Page 28 of 84Mid North Coast Affordable Housing Report
Table 8 shows the variation of staff allocations across the Mid North Coast and the increase
or decrease that has occurred, between 2007-2008 and 2010-2011, in the amount of time it
takes to process an application. The changes are exemplified when compared with the
changes in staff in the particular government areas. Changes are evident in the 17% increase
in days it takes to receive development approval in the Greater Taree area considering there
has been an increase in staff (6 to 9 FTE’s). Further changes are found with the 11% increase
in time it takes to receive development application approval in the Port Macquarie and
Hastings area as staff allocations remain the same. These cases represent the
inconsistencies mentioned in regards to planning processes. There has been an overall 18%
decrease in the amount of time it takes to receive development approval in the Mid North
Coast over the period 2007-08 to 2010-11. Further indications include the volume of
development applications that are being determined in the Mid North Coast (Table 9).
Table 9. Number of development applications processed in 2007-2008 and 2010-2011
Number of DA Number of DA % change in number
determined determined of DA's determined
Local Government Area
2007-2008 2010-2011 ‘07/’08- ‘10/’11
Bellingen Shire Council 347 269 -22%
Coffs Harbour City Council 906 1,044 15%
Greater Taree City Council 788 541 -31%
Kempsey Shire Council 310 280 -10%
Nambucca Shire Council 289 219 -24%
Port Macquarie-Hastings Council 572 576 1%
Mid North Coast 3212 2,929 -9%
Source: Local Development Performance Monitoring 2007/2008-2010/2011, NSW
Department of Planning and Infrastructure
Page 29 of 84Mid North Coast Affordable Housing Report
Table 9 identifies that there has been a 9% decrease in the number of development
applications that were determined on the Mid North Coast between 2007-2008 and 2010-
2011. Combining this data with the data presented in Table 2 allows further comparisons to
be drawn. Previously it was noted that Greater Taree has had a 33.3% increase in the
number of staff allocated to development application processing and their timeframe for
development application approval had increased by 17%, while processing 31% less
applications. The Local Development Planning Monitor 2010-2011 (NSW Dpt of Planning and
Infrastructure) identifies that it takes an average of 56 days for applicants to return further
information required to process the application. Improving these time delays would allow all
applications to be processed faster. The amount of development applications determined
can represent the amount of construction occurring/planned for the region. An increase in
development applications would be representative of an increase in planned construction. A
positive change in the timeframes associated with the development application process may
encourage further development in the Mid North Coast.
Regulation of the housing industry falls subject to different levels of government. The
National Affordable Housing Agreement identifies the responsibilities of different areas of
government when it comes to the delivery of services in relation to the housing and
homelessness sector – this is summarised in Figure 4. The housing industry is highly
regulated and a recent regulation, for example energy efficiency, is an added cost for people
building a new home (COAG 2009). Any regulatory change, such as energy efficiency, that
affects the housing industry has an impact on housing affordability. Cost effective regulation
needs to be considered in order to maintain an industry that is affordable to more of the
population.
Page 30 of 84Mid North Coast Affordable Housing Report
Figure 4. Responsibilities and roles of government for affordable housing
Source: Council of Australian Governments 2009, National Affordable Housing Agreement
Comments from the focus group identified what the stakeholders argued were measures to
make the regulation more affordable. One attendant suggested ‘doing away with the
decorations (kerb and guttering, pathways and tree lined streets)’ on developments and
letting the market maintain this area (Focus Group 2012). Another respondent suggested
this kind of approach may cause areas to be segregated by those who care for aesthetics
and those who don’t.
The regulatory governments employ policies which have a positive impact on housing
affordability when it comes to financial assistance. The federal government offers rent
assistance and home purchase assistance which are crucial to supporting a proportion of the
Page 31 of 84Mid North Coast Affordable Housing Report
population in achieving affordable housing (FAHCSIA 2012). At present none of the 6
councils within the Mid North Coast employ any affordable housing policies. Port Macquarie
Hastings Council put together a strategy in 2006. Following a discussion with Port Macquarie
Hastings Council it was identified that at present no policies have been implemented from
this strategy. All are aware of the affordable housing issues in our region and many are
working towards developing such policies to contribute to easing the housing stress on the
Mid North Coast. Some of the councils include affordable housing plans into their Local
Environmental Plans (LEP) and Development Control Plan (DCP) documents.
Stakeholder Plans and Government Programs
The Mid North Coast has a number of organisations and individuals working on strategies
relating to affordable housing. Stakeholders identify that affordable housing is of high
priority in the region. The pre-existing strategies vary in their approach from research based
strategies to hands on allocation of affordable housing. What was identified in the research
and engagement components of this project was that the region is under catered for when
it comes to affordable housing, as is much of Australia.
The Mid North Coast has particular demographics that exemplify the demand for affordable
housing in the area; a higher percentage of elderly are concentrated in the region (21%, 65
years and over) compared with NSW as a whole (14.7%, 65 years and over), and a much
higher percentage of people both earning less than the NSW median income as well as a
higher percentage of people earning in the low income bracket (29.2% of people aged over
15 in the Mid North Coast earn less than $299 a week compared with 2.7% in NSW).
One particular strategy that is in place in the region is the Mid North Coast Regional
Homelessness and Housing Working Party Forum. The party identifies the need for the
community to work more collaboratively as a region to improve outcomes for homelessness
and housing on the Mid North Coast (MNCRCSD 2012). This particular strategy aims to:
Page 32 of 84Mid North Coast Affordable Housing Report
Improve homelessness and housing outcomes for the region,
assist in furthering the aims of the state and North Coast action plans,
act as a regional body to identify challenges and generate positive solutions to these
challenges,
strengthen regional and whole of system collaboration and
act as a conduit between regional homelessness, housing services and the North
Coast Regional Homelessness Action Plan Committee and other macro committees
(MNCRCSD 2012).
Port Macquarie Hastings Affordable Housing Strategy (2006) aims to minimise the amount
of housing stress within the region. The ‘breadth of impact arising from housing stress
illustrates the need for a holistic policy response to the issue’ (SGS Economics & Planning
2006). The Port Macquarie Hastings Affordable Housing Strategy aims to leverage such a
response whilst monitoring the results within the community. The benchmark for this
strategy is to decrease the proportion of the region that is in housing stress.
The current policy settings are largely based on the assumption that pre-existing trends will
continue (AHURI 2004). Stakeholders in the Mid North Coast identified they were unhappy
with the current planning situations which limited their ability to implement affordable
housing strategies in the region. The proposed changes for the planning process as outlined
in the NSW Government ‘Green Paper’, if implemented, should make for a better
environment for those wishing to work on affordable housing to plan for future trends.
The Australian and New South Wales Governments have a number of programs in place to
assist with the affordability of housing. These programs relate to both rental properties and
home purchases in particular first home owners and encouraging construction of new
residential houses. Table 10 identifies these schemes, strategies and programs.
Page 33 of 84You can also read