SYNTHESIS OPTMIZATION OF ENERGY SYSTEMS MAXIMIZING REGIONAL PROFIT
←
→
Page content transcription
If your browser does not render page correctly, please read the page content below
INTERNSHIP REPORT

SYNTHESIS OPTMIZATION OF
ENERGY SYSTEMS MAXIMIZING
REGIONAL PROFIT

 Leonardo Teodoro Ferreira Nascimento (s1670301)

 MSc SET, CTW, University of Twente

 Internship Supervisor

 Michael Narodoslawsky, TU Graz

 Academic Supervisor

 Maarten Arentsen, University of Twente

TECHNOLOGY UNIVERSITY OF GRAZ

DEPARTMENT OF PROCESS AND PARTICLE ENGINEERING

GRAZ, AUSTRIA

15-08-2016 TO 04-11-2016
ABSTRACT

The energy sector plays an important role in the mitigation of climate change impacts. Renewable energy
technologies have been increasing their market share but there are still much to be improved in order to assure
better acceptance of these technologies. Several solutions can be investigated; this work assumes that the best
strategy for a successful energy transition is based on a bottom-up approach and that there is need to make
projects more attractive for local stakeholders. Also, it is assumed that, in order to make renewable energy
projects more attractive, they need to be more sustainable.

Sustainability is analyzed considering the triple-bottom line framework. The environmental dimension is
already contemplated by the nature of the projects. Therefore, there is need to include the social and financial
spheres. The social, due to its subjective facet, is included qualitatively in the decision making process during
the development of the project. The financial is included in the model by seeking the maximization of the
profit. Therefore, the attractiveness problem can be defined as the design of a renewable energy system that
can simultaneously maximize the profit for a certain region and respect the local economy/community.

The energy system is analyzed as a process network and optimized considering a synthesis approach based on
well-established tools. The theoretical background is presented and a case study performed over a Brazilian
region in order to assess if the results obtained can help the proposal of more attractive renewable energy
projects. The region was considered isolated from the surroundings and there was no heat requirement.
Therefore, the focus was the production of electricity to fulfill the internal demand. At all stages, it was
assumed that no change in the current regional agriculture practices is desired as a way to englobe the social
dimension. The initial scenario is based on the use of the regional agriculture streams in order to produce
electricity from biomass.

It was concluded that the tool can help the identification of solutions that give the region a higher level of
profit when compared with the current situation. Even though the initial scenario was not able to produce
enough electricity to fulfill the internal demand, the approach enables the identification of alternatives for the
expansion of the electricity production and its impacts. Furthermore, it enables the identification of critical
aspects of the project that could be overlooked if only the technical perspective was considered.

This work supports the concept that renewable energy projects need to be approached from a socio-technical
perspective. It is possible to couple a technical optimum design respecting the regional practices with an
enhanced profit for the region. Considering that these projects enhance stakeholder satisfaction they are more
likely to be successfully implemented than project based only in a technological design. Also, since the
methodology of this work is not time consuming it can be used as a first assessment of the region’s
possibilities. It enables the design of better interconnected systems and also the maximization of the profit.

 Page | 1

TABLE OF CONTENTS

Abstract .................................................................................................................................................... 1
Table of Contents ..................................................................................................................................... 2
List of Figures and Tables ......................................................................................................................... 4
List of Abbreviations ................................................................................................................................. 6
Introduction.............................................................................................................................................. 7
 1.1. Purpose ................................................................................................................................... 7
 1.2. Significance ............................................................................................................................. 7
 1.3. Research Question .................................................................................................................. 8
 1.4. Assumptions............................................................................................................................ 8
 1.5. Report Structure...................................................................................................................... 9
Literature Background............................................................................................................................ 10
 2.1. Energy transition in a multi-level perspective ...................................................................... 10
 2.2. Energy systems as a process system..................................................................................... 11
 2.3. Algorithms for PNS application ............................................................................................. 12
 2.4. Final remarks ........................................................................................................................ 15
Method ................................................................................................................................................... 17
 3.1. P-graph framework............................................................................................................... 17
 3.2. Region choice ........................................................................................................................ 17
 3.3. RegiOpt Conceptual Planner ................................................................................................. 18
 3.4. PNS Studio ............................................................................................................................. 20
 3.5. Research Methodology ......................................................................................................... 21
Data Collection ....................................................................................................................................... 23
 4.1. Region ................................................................................................................................... 23
 4.2. Preliminary information ........................................................................................................ 24
 4.3. Sugar Cane ............................................................................................................................ 26
 4.4. Corn ....................................................................................................................................... 29
 4.5. Overview of production chain ............................................................................................... 31
 4.6. Investment costs ................................................................................................................... 33
 4.7. Input data for base scenario ................................................................................................. 34
Results .................................................................................................................................................... 37
 5.1. RegiOpt results...................................................................................................................... 37
 5.2. Base scenario results............................................................................................................. 38
 5.3. Scenario definition ................................................................................................................ 40
 5.4. Scenario results ..................................................................................................................... 42
 5.5. Summary ............................................................................................................................... 47
Discussion ............................................................................................................................................... 49
Conclusions............................................................................................................................................. 52
 7.1. Conclusions ........................................................................................................................... 52
 7.2. Limitations ............................................................................................................................ 53
 7.3. Aspects for further research ................................................................................................. 53
References .............................................................................................................................................. 55
Appendix 1 – Map with urban area boundaries .................................................................................... 58

 Page | 2
Appendix 2 – Deatailed Operating Unit Definitions ............................................................................... 59
Appendix 3 – Maximal and optmum Structure ...................................................................................... 60
Appendix 4 – Solar PV Scenario Problem Definition .............................................................................. 61
Appendix 5 – Optimum Tilt Angle Tool .................................................................................................. 62

 Page | 3
LIST OF FIGURES AND TABLES
Figure 1 A dynamic multi-level perspective on TT [7] ............................................................................................ 10
Figure 2 Visualization of P-graph framework ......................................................................................................... 11
Figure 3 Example of energy system as a p-graph ................................................................................................... 12
Figure 4 Summary of algorithms for the determination of the optimum structure .............................................. 13
Figure 5 Graphic representation of problem definition ......................................................................................... 13
Figure 6 Maximal structure of example ................................................................................................................. 13
Figure 7 Subnetworks δ1({C,D,I)} (left) and δ2({C,D,I)} (right)................................................................................. 15
Figure 8 RegiOpt procedure scheme [18] ............................................................................................................... 19
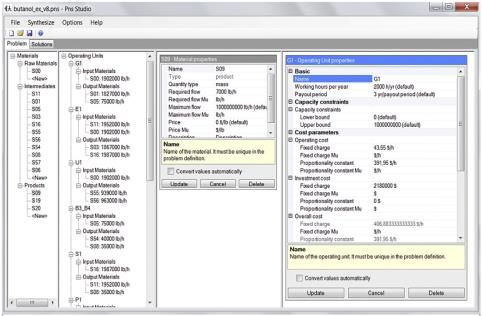
Figure 9 Tree view and properties edition [20] ...................................................................................................... 20
Figure 10 PNS Studio solution view [20]................................................................................................................. 21
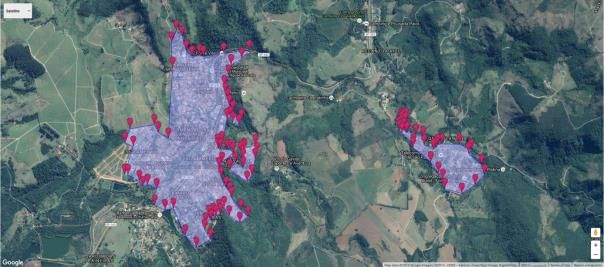
Figure 11 Land use distribution .............................................................................................................................. 23
Figure 12 Simplified production chain – Sugar Cane .............................................................................................. 26
Figure 13 Simplified production chain – Corn ........................................................................................................ 30
Figure 14 Overview production chain (Sugar Cane + Corn) ................................................................................... 32
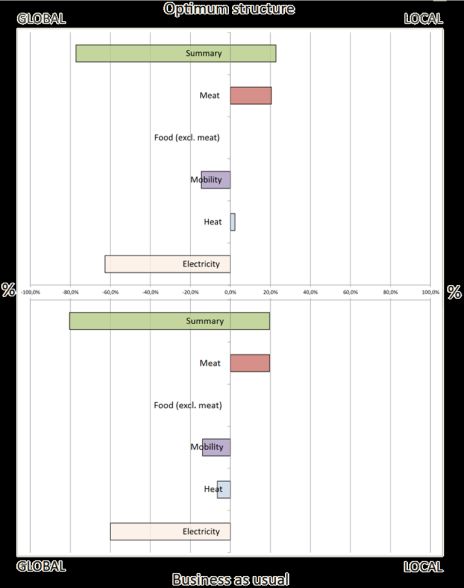
Figure 15 Comparison Optimum structure vs Business as usual – RegiOpt........................................................... 37
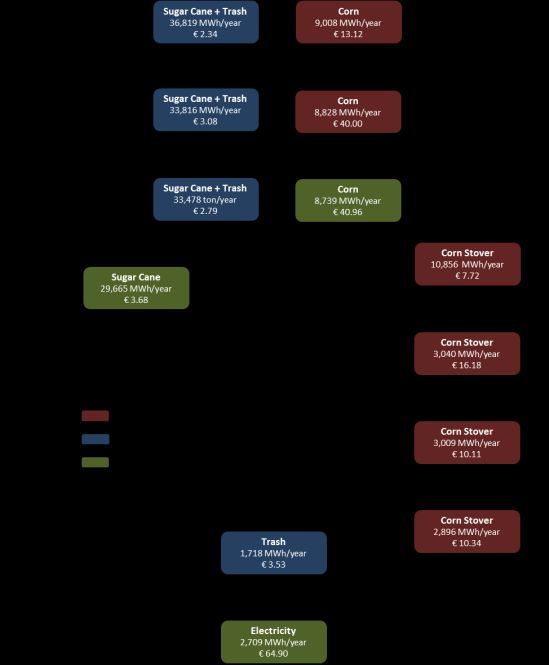
Figure 16 Optimum technology network ............................................................................................................... 39
Figure 17 Profit composition .................................................................................................................................. 40
Figure 18 Temporal series - Corn price oscillation related to the average ............................................................ 45
Figure 19 Electricity prices ...................................................................................................................................... 46
Figure 20: Angles of the irradiation on the several planes .................................................................................... 62
Figure 21: Triangles for the horizontal en module irradiation ............................................................................... 62
Figure 22 Input information – Tilt angle tool ......................................................................................................... 63
Figure 23 Output optimum tilt angle tool .............................................................................................................. 64
Table 1 Summary of land use information ............................................................................................................. 24
Table 2 RegiOpt input ............................................................................................................................................. 25
Table 3 Summary of raw materials – Sugar Cane ................................................................................................... 26
Table 4 Summary of harvesting efficiency ............................................................................................................. 27
Table 5 Summary of treatment efficiency .............................................................................................................. 28
Table 6 Summary of flows – Ethanol production ................................................................................................... 29
Table 7 Input High Heating Values (HHV) – Sugar Cane ......................................................................................... 29
Table 8 Summary of raw materials – Corn ............................................................................................................. 30
Table 9 Summary of harvesting efficiency ............................................................................................................. 30
Table 10 Input High Heating Values (HHV) – Corn ................................................................................................. 31
Table 11 Summary of investment costs ................................................................................................................. 34
Table 12 Input information – materials and products ........................................................................................... 35
Table 13 Input information – operating units ........................................................................................................ 35
Table 14 Financial information ............................................................................................................................... 38
Table 15 Scenario D3 - Results ............................................................................................................................... 43
Table 16 Scenario D4 – Extra information .............................................................................................................. 44
Table 17 Scenario D4 - Results ............................................................................................................................... 44
Table 18 Scenario D5 – Results ............................................................................................................................... 45
Table 19 Scenario D6 – Results ............................................................................................................................... 46
Table 20 Scenario D7 – Results ............................................................................................................................... 47
Table 21 Scenario S8 – Input information .............................................................................................................. 47
Table 22 Summary Results...................................................................................................................................... 48
Table 23 Financial results for the base scenario .................................................................................................... 49
Page | 4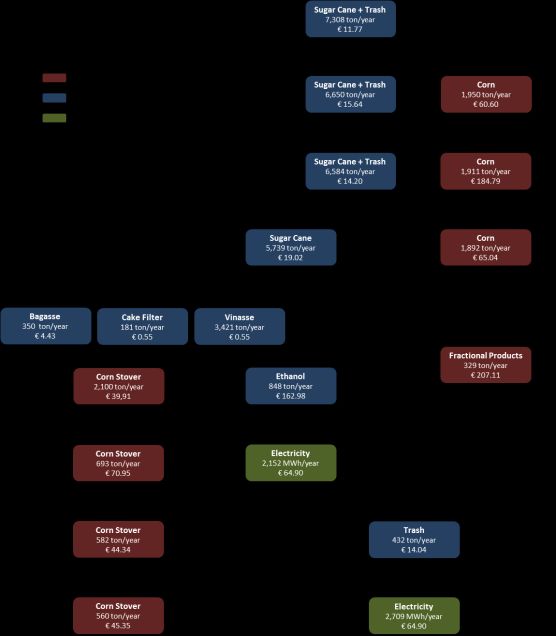
Table 24 Scenarios to fulfil electricity demand ...................................................................................................... 50

 Page | 5
LIST OF ABBREVIATIONS

ABB Accelerated Branch-and-Bound

GHG Green House Emission

MSG Maximal-Structure Generation

NIMBY Not In My Backyard

PNS Process Network Synthesis

PV Photovoltaic

SSG Solution-Structure Generation

TBL Triple Bottom-Line

TT Technological Transition

 Page | 6
INTRODUCTION This chapter aims to give an overview of the motivation and structure of the following work. In section 1.1 the purpose of the work is described followed by its significance in the current climate change context, in section 1.2. This leads to the research question presented in section 1.3. Finally, some main assumptions valid throughout the development of the project are presented in section 1.4 and the report structure in 1.5. 1.1. Purpose As a part of the curriculum of the master in Sustainable Energy Technology (SET) of the University of Twente a mandatory internship is required. The purpose of this report is to describe the results of a three-month internship in the Institute of Process and Particle Engineering located in the TU Graz, Austria. The institute consists of five independent research areas, each committed to high-level basic and applied research [1]: Pharmaceutical Engineering and Particle Technology, Mechanical Process Engineering, Process Evaluation, Energetic Biomass Utilization, and Zero Emissions Techniques and Systems. The area of Process Synthesis and Evaluation, within this institute, has been active in the field of optimal technology networks for regional and urban context [2]. That is the field of development of this internship project, which is interdisciplinary considering the five research areas. The main purpose of the internship is to get acquainted with the tools used by the research group focusing on the Optimal Technology Networks for Regional and Urban Utilization of Renewable Resources (RegiOpt) and PNS Studio. After the tools are comprehended with sufficient depth, the internship shifts to a more practical vies; the actual planning of a technology network for a chosen region. 1.2. Significance One of the current challenges faced by humanity is climate change. This worldwide effect has impacted many regions, causing changes on temperature levels and hydrological systems [3], for example. These effects already can impact both wild life and human activities. And, it has been shown that anthropogenic greenhouse gas (GHG) emissions have increased when compared to the pre-industrial era. After greenhouse gases are emitted they take a long time to disperse from the atmosphere. Therefore, their concentration has increased together with the magnitude of the greenhouse effect, which is very likely to be the dominant cause for the warming of the world since the 20th century [3]. Between the years of 2000 and 2010, the annual GHG emissions have increased drastically; around 47% of this increase is due to energy supply [4]. Therefore, actions in the energy sector have an important role in the mitigation of climate change impacts. One of the strategies that have been growing in the past years is the introduction of renewable sources for energy generation. This introduction aims to change the current technological regime and this cannot be done without a proper macro-strategy due to the complexity of such systems. Several methods can be used in order to execute energy transition but it is clear that purely technical or purely social approaches are not efficient enough. On one hand, without the technical approach it is impossible to plan systems that will effectively fulfil energy demands. But, on the other, these technical systems impact directly society and human relationship with the environment. Therefore, people’s perspectives must be taken into consideration during the design. Another way to phrase this is to state that technical systems must be attractive to the stakeholders. Page | 7
1.3. Research Question

The climate change challenge is huge and there is no attempt to find a unique solution for it. Nevertheless, a
broad question that needs to be answered is,

 How is it possible to make renewable energy solutions more attractive to stakeholders?

This question raises several others like, for example, who are the important stakeholders or which types of
variables can be used to influence behavior; the answers generate infinite ramifications. Due to that, certain
assumptions are made to narrow down the scope of this work and to arrive in a more feasible research
question.

First of all, it is assumed that the best approach for energy planning is to make it locally, and change will
emerge for several decentralized locus. Also, it is considered that instead of making the solutions attractive to
all stakeholders, there is only need to make it interesting for a key player. That could be a municipality or a
company with enough influence over a region, for example. Furthermore, it is considered that in order to make
a solution attractive there is need for it to be sustainable. Here, we define being sustainable based on the triple
bottom-line framework. The TBL is an accounting framework that includes environmental and social
dimensions to measure corporate performance, instead of only a financial one [5]. To be sustainable is to be in
equilibrium among these three dimensions.

I posit that shifting to renewable energy is already a step towards the environmental dimension and in order to
make it more attractive to stakeholders it is necessary to include the other two dimensions as well. The social
dimension is included qualitatively; during the design decisions should be made trying to impact the least the
local economy. Therefore, changes should try to cause few to none impact in the current habits of the
population; merging with the current scenario instead of disrupting it. One requirement is that it has to be
combined with existing structures, since it is unfeasible to build the energy sector from scratch and also respect
natural limitations of the region. The financial dimension can be included quantitatively. For example, by asking
which solution, among a manifold of possibilities, maximizes the financial return.

Therefore, considering that natural resources are material of a process network, energy is a product and the
technological network is composed by a set of operating units. Thus, the following research question can be
formulated:

 Given an amount of natural resources and a demand that needs to be met; what is the technological network that will
 maximize the revenue function for a certain region, while respecting the local economy?

Obviously, there is no unique answer for this question since the technological network is always dependent on
the constraints of each region. So, in order to answer this question for a broader range of cases, it was decided
to investigate tools that will provide the answer for any set of materials, products and operating units. The
project purpose may seem excessively specific, due to the fact that it is about understanding tools, but it is
directly related to a broad and complex problem of resource management in rural or urban areas. To assess if
these tools are effective to answer the research question a case study is performed based on a Brazilian region.

 1.4. Assumptions

The main assumptions of this work are related to the modelling of the energy system of the Brazilian region.
First, it was assumed that the region has interest in becoming electricity neutral. The Brazilian energy market is
structured in a way that cities are not allowed to produce electricity for their own use. Therefore, all electricity
has to be sold to the grid. Thus, the concept of being electricity neutral; the region produces the same amount
of electricity it needs to supply the current demand.

 Page | 8
Also, the decision maker or key player, hereafter named as the region, is a fictional entity that owns all the land
available within the borders of the city. It means that issues of land ownership are not discussed in this work,
the obstacles that can be possible faced when dealing with this are considered out the scope of this project.
Furthermore, it is assumed that this is the player that will decide to implement or not the project. Therefore,
the revenue is maximized based on the region perspective, which may result in not optimum situation for other
players.

Furthermore, it is assumed that there are no practical limitations for the financial resources of the region. All
monetary flows are calculated in euros. If the reference for investment costs, for example, is in US$ or BRL the
value is converted to euros based on the exchange rate from 17/08/16.

 1.5. Report Structure

Chapter 2 gives an overview on the literature background needed for the development of this project. This
chapter also englobes the theoretical part of the project, which regards the understanding of the underlying
mechanisms of the software used for the optimization of regional systems. On chapter 3 the research method
is outlined, the tools described and the region’s choice justified. Finally, in chapter 4, the application of the
theory and tools in a region starts with data collection. This chapter provides information used in both tools
used in the project, RegiOpt and PNS Studio, indistinctively. After the information is collected, the tools are
used and the results presented in chapter 5, together with several scenarios used to complement the research.
The results are discussed in chapter 6 and main conclusions of the research summarized in chapter 7.

 Page | 9
LITERATURE BACKGROUND This chapter aims to give an overview of the background theory used during the development of this project. In section 2.1, the technological transition to renewables will be presented as an innovation spur from decentralized systems. After that, in section 2.2, the theory of Process Network Synthesis is presented in order to provide a framework for the modeling of energy systems. In section 2.3, the algorithms used to solve the PNS problem are described. Finally, in section 2.4, some final remarks regarding the literature are made. 2.1. Energy transition in a multi-level perspective As posited before, one of the great challenges of the 21 st is climate change mitigation. Since energy represents a big role in the emissions of GHG it is important to shift from a fossil fuel to a renewable based energy production. There are different strategies to execute this transition; some researchers even work on simulating energy costs of energy transition and climate change damage as a function the cooperation between agents in a global scale [6]. But another way to understand energy transition is using a multilevel perspective on technological transitions (TT). There are three levels considered by [7] in this perspective are: Landscape: it provides an external structure or environment for stakeholders’ interaction. They consist in a set of deeper trends that are strongly embedded in society. Regime: this environment is related with the routine based behavior of the stakeholders of a certain field. Technological regimes result in technological trajectories and also create stability since they work on incremental improvement on these trajectories. Niche: these are the smaller and protected structures responsible for the generation of radical innovations in TT. Figure 1 A dynamic multi-level perspective on TT [7] Page | 10
TT occurs when there are linkages between multiple levels. Radical innovations spur from the niches when the
regime and the landscape provide an opportunity [7]. The diagram in Figure 1, developed by Geels [7], presents
an illustration of the dynamic of technological transition.

The main idea for this discussion is that, through time, technological niches can evolve and become part of the
socio-technical regime and that there are factors that differentiate these successful niches from the ones that
culminate in failed innovations. Another point of interest is that this approach shifts the agent of change. The
niches, which are local units, are the ones responsible for radical innovations. Therefore, under this
perspective, until renewable energies are an established regime, energy transition has a local nature. TT does
not happen because of a complete regime shift, but through a step by step process of reconfiguration [7].

Nevertheless, it is important to identify mechanisms that enable agents to break from the niche to the regime
level. Geels [7] proposes two main mechanisms:

 i. Ride along another market growth: New technologies break out of niches by using the trends of other markets.
 ii. Add-on and hybridization: This means that new technologies are physically linked with old ones and do not
 compete head on;

The first mechanism is very pertinent in the case of renewable energies. The low oil prices, around USD 35 by
January 2016, compared with over USD 100 per barrel in the first half of 2014 to has meant lower exports and
revenue for several countries. The ongoing reform in the energy pricing and the inclusion of renewables gives
an opportunity of further reducing the dependence of region’s economy and energy sector on fossil fuels [8].
The current environment is favorable for emergence of renewable energy niches to the regime level. The
second mechanism is not dependent on the environment only, but needs planning to be realized. In this case
there is need for local planning of energy systems that considers the existence of other technologies, including
ones depending on fossil fuels, and merge them with new technologies.

 2.2. Energy systems as a process system

One way to interpret energy planning is seeing the energy system as a process system. This means that a set of
raw materials, e.g. biomass or solar irradiation, is used to produce certain products, e.g. heat or electricity by
the use a number of operating units. The design of the underlying structure of a process system is called
process synthesis [9]. The mathematical programming to achieve this design has two steps: the generation of
the model that describes the network and the solution of this model [10]. The application of process synthesis
strategies to design networks is named process-network synthesis, or PNS.

The main goal of PNS is to identify the optimum process network. The method used in the assignment to solve
the two steps mentioned above is based on the P-graph framework. This method was introduced because
previous strategies were only able to solve the first step (model generation) for homogeneous networks and
the second (model solution) for relatively small synthesis problems [10]. The P-graph method is based on a
graph theoretical approach; these are bipartite graphs with nodes, representing materials and operating units
and arcs connecting them [11], as depicted in the picture below:

 Figure 2 Visualization of P-graph framework

 Page | 11
The materials shown above can be raw materials (1), intermediates (2) or products (3). The definitions are
straightforward. Raw materials are only inputs for operating unit, intermediates are both inputs and outputs
and products are only outputs. To illustrate the use of this approach for energy system, consider a solar power
plant that possesses both concentrator solar power and photovoltaic panels. It is possible to visualize the
system using exactly the structure presented in the diagram above.

Assume that the raw material is solar irradiation. Following the right-hand side of the diagram the first
operating unit can be a steam generator that converts that solar irradiation into steam, which is an
intermediate in this process. Steam is then an input for another operating unit, for example a steam turbine,
which converts it into electricity and a byproduct, heat. On the other hand, following the left-hand side, PV
panels are used directly to produce electricity from solar irradiation.

 Figure 3 Example of energy system as a p-graph

The first step in solving the optimum network the framework problem is to build the maximal structure. The
maximal structure includes all the possible solutions to provide a certain amount of products based on a given
set of raw materials [9]. This is a combinatorial problem since there is need to assess all feasible solutions,
therefore there is need to establish a set of axioms [11] to guarantee the existence of a solution:

 i. Every demand is represented in the structure.
 ii. A material represented in the structure is a raw material if and only if it is not an output from any operating unit
 represented in the structure.
 iii. Every operating unit represented in the structure is defined in the synthesis problem.
 iv. Any operating unit represented in the structure has at least one directed path leading to a product.
 v. If a material belongs to the structure, it must be an input to or output from at least one operating unit
 represented in the structure.

This approach enables the use of a mathematical model to build process structures [12]. Each part of the
solution will be described in the next section through the definition of the algorithms used by the tools to solve
the process-synthesis problem.

 2.3. Algorithms for PNS application

Considering the five axioms presented above and the graphic representation it is possible to write algorithms
to model and solve the process-network problem [9]. Three algorithms are well established and have been
developed for around 20 years [11]. The first one is MSG (Maximal-Structure Generation) and is responsible for
the generation of the maximal structure. After the maximal structure is obtained, all possible solutions will be
calculated with the use of the algorithm SSG (Solution-Structure Generation). When the feasible solutions are
obtained, there is need to find the one that minimizes an objective function of choice. The algorithm used for
this is the ABB (Accelerated Branch-and-Bound). The diagram below represents the path followed to find the
solution:

 Page | 12
Figure 4 Summary of algorithms for the determination of the optimum structure
MSG
This algorithm enables the obtention of solution networks by decision-mapping of the maximal structure, due
to the fact that the solution is a subset of a maximal- or superstructure [10]. The complexity of this algorithm
grows only polynomially with the size of the process [10], which enhances the efficacy of this algorithm for
huge process systems. Using the axioms presented beforehand, the system finds all feasible solutions building
the maximal structure. By doing this the algorithm already exclude unfeasible solutions, which accelerates the
optimum solution search.
The example [12] below intends to make the functioning of the algorithm clear. First, there is the problem
definition. The definition is done considering the fact that the materials and operating units are defined as
mathematical sets.
Products = P = {D}
Raw materials = R = {A,B,F,H,J,K}
Materials = M = {A,B,C,D,E,F,G,H,I,J,K}
Operating units = O = {({A,B}{C}),({C}{D,E}),({C,F}{G}),({H}{I}),({E,J}{C}),({I}{D})} = {O1,O2,O3,O4,O5,O6}
The graphic representation of this example is presented below:
Figure 5 Graphic representation of problem definition
This is still only user input in a graphic representation. The software assembles structure based on the input
and also on the axioms. The final structure is given in the maximal structure below:
Figure 6 Maximal structure of example
Page | 13Some important remarks help to understand how the software works. First, since raw material K is not an input
or output to any operating unit it is not included in the maximal structure (axiom v.). Also, operating unit 3 is
only producing the material G, that is not an input for any other operating unit the produced the product D. It
has no path leading to a product. Therefore, it is also not included in the structure (axiom iv.) together with the
materials produced and the raw materials used only by it. The result of this step is a maximum structure with
all feasible combinations among the operating units and material defined by the user.
SSG
SSG is a recurrent algorithm that generates each and every solution once and only creates solution-structures
[10]. Usually the set of solution generated by this algorithm is huge, due to the combinatorial nature of the
problem; nevertheless, it is an efficient algorithm that produces results for fairly complex networks in seconds.
The algorithm uses decision mapping in order to find all possible solutions. It starts mapping all operating units
that can produce a certain material. After this is done the software create all possible combinations of
operating units that will provide a certain product. To illustrate we recur to the example used before. The
materials used in the maximal structure are:
M = {A,B,C,D,E, H,I,J }
Therefore, there is need to identify which operating units can produce these material and map them. This is
done creating mathematical sets, as before. The maps will be denoted with the Greek letter α; the map α(A)
represents all the operating units that can produce the material A. The first remark is that raw material are not
created by operating units, therefore their map is an empty set.
α(A) = α(B) = α(H) = α(J)= { Ø }
α(C) = {O4,O1,O5}
α(D) = {O6,O2}
α(E) = {O2}
α(I) = {O4}
With the maps defined the algorithm progresses to the creation of subnetworks. In order to do this, it builds
active sets; active sets are materials that are going to be produced by the use of the subnetwork. With an
active set the algorithm builds the networks that can generate those materials without violating the axioms.
These networks, which are possible solutions, are going to be denoted by the Greek letter δ. The solution
δ1({C,D,I}) is one network that produces simultaneously the material C and I, and the product D. Considering
the example, there are two possible variations that for δ({C,D,I}).
δ1({C,D,I}) = {(C,{O4}),(D,{O6}),(I,{O4})
δ2({C,D,I}) = {(C,{O1}),(D,{O2},{O6}),(I,{O4})
By creating active sets and finding all structures that can produce those materials the algorithm generates all
possible solutions for the problem; the maximal structure is among the solutions. In the case of the problem
presented, 7 other maps are possible and defined below:
δ3({C,D,E}) = {(C,{O1},{O5}),(D,{O2}),(E,{O2})}
δ4({C,D,E}) = {(C,{O1}),(D,{O2}),(E,{O2})}
δ5({C,D,E}) = {(C,{O5}),(D,{O2}),(E,{O2})}
δ6({C,D,E,I}) = {(C,{O1},{O4},{O5}),(D,{O2},{O6}),(E,{O2}),(I,{O4})}
δ7({C,D,E,I}) = {(C,{O1},{O4}),(D,{O2}),(E,{O2}),(I,{O4})}
δ8({C,D,E,I}) = {(C,{O4},{O5}),(D,{O2},{O6}),(E,{O2}),(I,{O4})}
Page | 14 δ9({C,D,E,I}) = {(C,{O4},{O5}),(D,{O2}),(E,{O2}),(I,{O4})}
Map δ6({C,D,E,I}) is the maximum solution found by MSG. The diagram below shows the graphic representation
of two of these subnetworks:
Figure 7 Subnetworks δ1({C,D,I)} (left) and δ2({C,D,I)} (right)
ABB
When all the subnetworks are created the algorithm explores the structural nature of the problem by initiating
the process of ´search for best solution´ in the bottom of a decision tree and moves upwards asking at each
branching step which operating unit or units should be used [11]. This three is built asking how the desired
product can be produced. In this case, D can be produced from operating unit {O2}, from operating unit {O6}
and also from a combination of them, {O2,O6}. Each one of these options may have several subnetworks or
variations, δi.
The objective function used to find the optimum solution can be defined based on what suits the designer
better, ranging from financial variables, like cost or profit, to environmental impact, like carbon footprint. After
choosing an objective function the algorithm finds the subnetwork that is closest to the optimum, or maximizes
the desired function. At the bottom of the decision tree there is the desired product, in the example, D. There
are three possible ways to move up the decision tree. The algorithm will ask which one maximizes the revenue,
for example. We can assume path {O2} is the one that maximizes this variable.
Considering only subnetworks that produce D through the operating unit {O2}, the set of possible solution is
already smaller. Now, only five options are available, δ3, δ4, δ5, δ7 and δ9. The algorithm asks the same question
again and arrives to the solution that maximizes the overall revenue.
2.4. Final remarks
By looking at technology transition in the energy sector through the lens of a multi-level perspective it is
possible to recognize the importance of regional initiatives in the global context. The current environment is
promising for the introduction of renewable energies but there is need for better local planning in order to
make the solutions more appealing to local communities. By using the process-network synthesis framework it
is possible to design systems that are, on one hand, more environmentally friendly due to the use of renewable
sources and, on the other hand, also financially appealing since the revenue can be maximized.
The construction of the maximum technological structure is the most important step for the user of the
method. Since the algorithms are well established, the process of optimization revolves around the definition
of the problem. This involves the definition of the availability of resources, the demand that needs to be met
and the performance of the operating units. After the constraints of the process are defined there is need to
define the operating units. For that, the inputs and outputs for each operating unit have to be chosen, together
Page | 15with the rates of consumption and production of these materials. Also, the cost function is required. With these parameters the operating unit is well defined and the problem is fully described [9]. The use of this framework enables the determination of the technological network that maximizes the revenue. Therefore, this method is ideal to answer the specific research question presented in the introduction: Given an amount of natural resources and a demand that needs to be met; what is the technological network that will maximize the revenue function for a certain region, while respecting the local economy? From a problem defined considering all the alternatives the user wants, it is possible to find the one combination that maximizes the revenue of the region. If keen choices are made during the modelling regarding how this will impact the local economy, it is possible to design systems that are attractive to the key stakeholders since they enhance the regional situation in the three dimensions of sustainability. Therefore, they rank higher in the TBL. Page | 16
METHOD

In order to successfully design the technological network that maximizes the revenue for a certain region the
research is conducted first with a more theoretical approach. This is done in order to obtain proper background
to answer the research question and also to identify if the tools are sufficient to do so. A brief discussion,
complementing the literature background, is presented in section 3.1. Then, the research shifts to a practical
approach. In section 3.2, a region is chosen in order to apply the tools in a real context. In section 3.3, one of
the tools used during this project, RegiOpt Conceptual Planner, is described. In section 3.4, the less
standardized tool, PNS Studio, is also presented. To conclude, section 3.5, outlines the plan for the
development of the research combining the tools.

 3.1. P-graph framework

As discussed previously, one of the strategies to fight climate change is by the regional introduction of
renewable energies. To do that, it is important to make project attractive to local institutions; it is assumed that
making projects financially beneficial is the strategy to make the transition more sustainable. The P-graph
framework is chosen due to its practicality.

For small regions, the algorithms described in the previous chapter provide results in less than one second. This
gives the user the freedom to experiment with the network and material flows. This can be done due to the
smart combination of the axioms and the algorithms, MSG, SSG and ABB. Since the construction of the maximal
network, unfeasible networks are eliminated from the solution. When the combinatorial step starts, in SSG, the
number of possibilities is already lower. And, again, in this step only networks that produce the desired product
are considered. Together with the strategy of asking in every branch which one maximizes the objective
function in ABB, the process is extremely efficient. Thus, it is considered as a very adequate tool for the
simulation of process-network synthesis.

Also, considering the conversion nature of energy systems, seeing them as network processes is natural. Raw
materials are input and products are outputs of operating units. The physical planning of an energy system is to
assess which operating units should be used in a certain region and, equally important, what is the relationship
among them. The P-graph framework enables all that while maximizing the revenue of the region, which
proves its efficacy for the purpose of this work.

 3.2. Region choice

Only a theoretical understanding of the algorithms and concept is not enough to assess if the results of such
framework is successful. Therefore, it was decided to make a case study of a region. The first requirement was
for the region to be in Brazil. This is done to avoid reuse of information. The research group has been working
extensively in the European context. Since the goal was to apply the framework to its full extent it is considered
better to apply it from scratch. Instead of working on the optimization of a ready-to-use maximal structure, in
this research, the maximal structure will be built considering the reality and constraints of the region.
Therefore, it was decided to apply the theory to a region where no work has yet been done.

Brazil is chosen due to its high commitment to sustainable energy. Brazil was in 2012 the third biggest producer
of renewable electricity in the world [13]. By the end of 2015, 80% of electricity production came from
renewable sources [14]. Furthermore, a prospect from Bloomberg estimates that until 2040 Brazil will receive
more than US$ 200 MM only in solar, wind and biomass electricity generation [15]. Therefore, the country has
high potential for projects like the one to be designed in this work.

Nevertheless, the concept of local energy initiatives is not popular in the country. Therefore, it is assumed that
a prospect project would be easier implemented in a region that has high financial resources, imports all its

 Page | 17
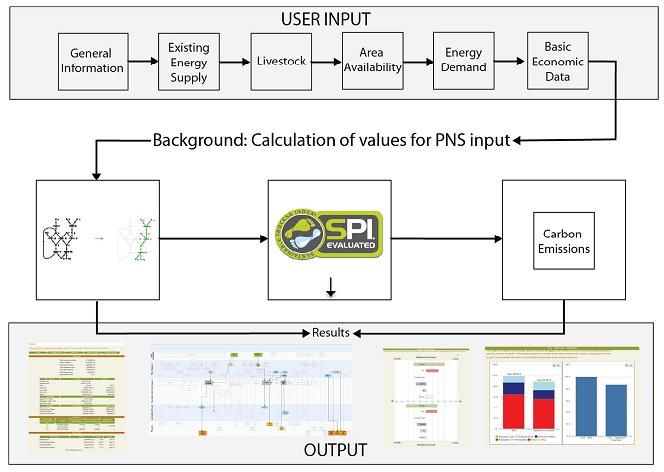
electricity and is not big, so the project could be considered an experiment. Furthermore, since the project is
being developed from Austria, it is better to work with a region that has enough online content so the model
can be as accurate as possible.

Based on these criteria the city of Águas da Prata – SP is chosen. The city is located in the state with the highest
GDP of the country, owns no energy production systems and has only 8,065 inhabitants. Nevertheless, it
possesses a considerable amount of area available and the state has a good database for agriculture and
energy information. More information about the city will be presented in chapter 4.

 3.3. RegiOpt Conceptual Planner

RegiOpt in an online tool that supports decision making process in energy planning by providing optimized
technology systems based on the locally available resources. This optimized technology system is evaluated
economically and ecologically (through the calculation of the corresponding ecological footprint using the
Sustainable Process Index method as well as with the Carbon Footprint) [16]. It can be assessed through the
link regiopt.tugraz.at/. In this website, it is possible to find background information about the method and also
the tool (prior authorization from the system administrators may be needed). One of the advantages of
RegiOpt is that it can be handled by users without technical knowledge since the calculations are all performed
in the background [17].

By changing the quantity and type of input resources (raw materials) and altering several parameters, the tool
can calculate the required output products (energy, heating, etc.) and create different scenarios which are
useful for example for policy makers, local or regional governments, utilities companies, etc. The procedure to
use the tool is described in the following paragraphs: the first step is to fill a user-friendly questionnaire about
the size of the region/settlement, availability of resources, required amount of output products and economic
data. The accuracy and validity of the results are bound by the consistency and reliability of this data. The user
has to input information in six different steps provided by the interface, these are:

 1. General Information:
 o On this step the user is invited to provide basic information about the region and
 consumption of the inhabitants.
 o Input data: Number of inhabitants, yearly solar irradiance, meat and electricity demands,
 living space, individual mobility fuel consumption and maximum investment volume
 available.
 2. Existing Energy Supply:
 o The user can fill all existing technologies for energy generation available in the region.
 o Input data: There is the option to define existing technologies based on the input or output of
 the system. Technologies that can be added are: biomass burners, ORC, wood gasifiers,
 biogas plant (with CHP), biogas plant, biodiesel plant with gas cleaning, biodiesel plant,
 bioethanol plant, photovoltaics, solar thermal, wind power, and hydro power.
 3. Livestock:
 o Requires data to determine the necessary agricultural area to support livestock and also the
 degree of self-sufficiency in meat production. The values are also used to estimate possible
 biogas production.
 o Input data: Number of animals (cattle, sheep, goat, pig, and poultry)
 4. Area Availability:
 o The user provides the distribution of land use in the region.
 o Input data: Available productive agricultural and forestry area, percentage of forestry and
 agricultural area.

 Page | 18
5. Energy Demand:
 o In this section, the heat provision is detailed considering efficiency and type of buildings.
 o Input data: percentage of non-residential buildings, climate zone. Percentage of old, new,
 low-energy and passive buildings. Current heat provided by renewables or district heating,
 and industrial heat demand.
 6. Basic Economic Data:
 o The user needs to provide costs for materials and products used in the system. Also,
 transportation costs can be added for each one of the pertinent materials.
 o Input data:
 i. Materials include: Corn silage, barley, wheat, rapeseed, sunflower, corn grains,
 miscanthus, shortrotation, sugar beet, manure from livestock, other oil seeds, other
 biomass for burning, other biomass for biogas, other cereals, grass silage, natural
 gas, diesel, CaCO3, methanol and KOH.

 ii. Products include: Pallets, biogas manure, biodiesel, ethanol, vegetable oil, upgraded
 biogas, ash, K3PO4, district, individual and industrial heat, electricity from biogas, PV,
 biomass and wind.

Not all the information above needed to be provided, since there are some default values that can be used
when information is unknown. Furthermore, other values that are calculated automatically can be further
specified if the user has more detailed information about the system. After this information is provided the tool
will use the theory described in the previous chapter to find the optimum network considering the given
constraints.

 Figure 8 RegiOpt procedure scheme [18]

 Page | 19
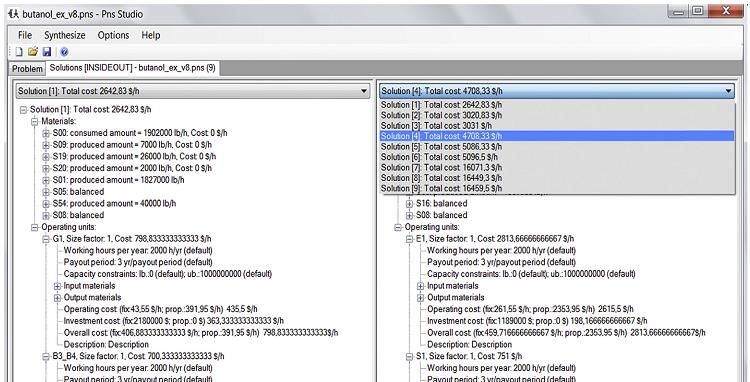
Then the tool enters this data into a pre-defined PNS network, which has been previously fed with information
and data of conventional and renewable energy technologies. The obtained solution serves as the most
economically feasible technology pathway for the region/settlement based on the available raw materials.

In the final step, the tool calculates the ecological footprint of the selected solution using the Sustainable
Process Index (SPI) method. This user-friendly tool allows changing in an easy way the input parameters in
order to create different scenarios and technology networks which are valuable tools for the decision-making
process in energy planning tasks. In figure 8 a scheme of the described process is shown.

 3.4. PNS Studio

The previously explained algorithms were also implemented in the software PNS Studio which is free and
available on the web [19] to solve process network synthesis problems. This software is basically composed of a
solver and a model analyzer. Easily allows constructing process network synthesis models using a “tree-view”
and also editing the properties and units of the materials and operating units, as can be seen in the figure
below:

 Figure 9 Tree view and properties edition [20]

To define the raw materials it is important to define the price and some constraint regarding the flow. For
example, regarding crops, the maximum flow can be the maximum production of the region considering the
area harvested. The definition of the operating units is of extreme importance since they are the ones that
contain the relationships among materials and products and they represent a considerable part of the annual
costs of the solution.

After implementing the PNS problem, the solver module generates the maximum possible structure following
the combinatorial rule of the specific problem and generates optimal and suboptimal solutions taking into
account cost minimization or profit maximization. If the rates of required product are defined, the solver will
minimized the overall cost to achieve the goal otherwise if the rate of the available materials (with the
corresponding price or production cost) is defined then the profit is maximized (if the optimal cost is negative
then the solution is profitable). In the following below the solver and solution analyser can be seen.

 Page | 20
It is important to notice that no sustainability impact tool is already embedded in this software. If an
assessment of the impact is needed an outside tool should be used in parallel with PNS Studio. Nevertheless,
this tool presents much more flexibility to model the system. And it demands a smaller amount of factual
information about the regional current condition but it demands more research regarding possible solutions
since it requires building the maximal structure and building the links among operating units and materials
manually.

 Figure 10 PNS Studio solution view [20]

 3.5. Research Methodology

In order to comprehend the use of the P-graph framework for energy planning the following strategy was
employed. First, all the theoretical background should be collected and studied to make adequate decision
throughout the development of the project. Then, a locality is chosen to build a case study in order to assess
less a less idealized scenario. After that, the preliminary data collection starts; the main goal is to collect macro
information to be used in RegiOpt, but this is also information that will be used in the more accurate modeling
using PNS Studio.

At this moment the research dismembers into two main branches, one using RegiOpt and another PNS Studio.
RegiOpt is used first due to its more standardized nature. It is considered better to use this tool in order to
understand the requirements and limitations of the region. If the results from RegiOpt are considered relevant
for the region they will be used as an input for PNS Solution. This means that the results could work as
guidelines for a more precise model for the energy system. On the other hand, if the results are proven
unrealistic the optimization using RegiOpt will be abandoned and the modelling with PNS Studio will not
consider the output provided by the web based tool.

Nevertheless, the modelling using PNS studio requires a more detailed data collection regarding the production
chains that are going to be used. So, there is a second round of data collection that is defined after a careful
analysis of RegiOpt solution. After enough information is obtained, the actual modelling of the system starts
with the construction of a base scenario. For this scenario several assumptions are made to consider the social
dimension of sustainability:

 1. The base scenario will be constructed based on the use of biomass resources currently available in the region;
 2. No change in the current agriculture practices can be assumed;
 3. The region is limited to the physical borders of the city;
 4. No neighboring cities participate in the energy system;
 5. The main goal is to make the region electricity neutral.

 Page | 21
You can also read