Wind Energy in NSW: Myths and Facts
←
→
Page content transcription
If your browser does not render page correctly, please read the page content below
Wind Energy in NSW:
Myths and Facts

                      1
INTRODUCTION

Wind farms produce clean energy, generate jobs and income in regional areas and have
minimal environmental impacts if appropriately located.

Wind farms are now increasingly commonplace and accepted by communities in many parts
of the world, but they are quite new to NSW.

To increase community understanding and involvement in renewable energy, the NSW
Government has established six Renewable Energy Precincts in areas of NSW with the best
known wind resources.

As part of the Renewable Energy Precincts initiative, the NSW Department of Environment,
Climate Change and Water (DECCW) has compiled the following information to increase
community understanding about wind energy. The technical information has been reviewed
by the Centre for Environmental and Energy Markets, University of NSW.

The Wind Energy Fact Sheet is a shorter and less technical brochure based on the Wind
Energy in NSW: Myths and Facts. The brochure is available for download at
www.environment.nsw.gov.au/resources/climatechange/10923windfacts.pdf.

For further renewable energy information resources, please visit the Renewable Energy
Precincts Resources webpage at
http://www.environment.nsw.gov.au/climatechange/reprecinctresources.htm.

                                                                                           2
CONTENTS

CONTENTS ...............................................................................................................3
WIND FARM NOISE ..................................................................................................4
WIND TURBINES AND SHADOW FLICKER ...........................................................11
WIND TURBINE EFFICIENCY AND COST EFFECTIVENESS ...............................12
WIND POWER AND THE ELECTRICITY GRID.......................................................16
WIND POWER AND GREENHOUSE GAS REDUCTION ........................................20
STRENGTH OF WIND RESOURCES IN NSW........................................................25
WIND FARM CONSTRUCTION...............................................................................27
WIND FARMS AND COMMUNITIES .......................................................................29
WIND FARMS AND BIRDS AND BATS ...................................................................34
WIND FARMS AND CULTURAL HERITAGE...........................................................35
WIND FARMS AND VISUAL IMPACTS ...................................................................36
WIND FARMS AND LIVESTOCK.............................................................................37
WIND FARMS AND AIRCRAFT...............................................................................38
WIND TURBINES AND ELECTROMAGNETIC INTERFERENCE ...........................39
WIND FARMS AND PROPERTY VALUES ..............................................................40
WIND FARM SAFETY .............................................................................................42

                                                                                                                            3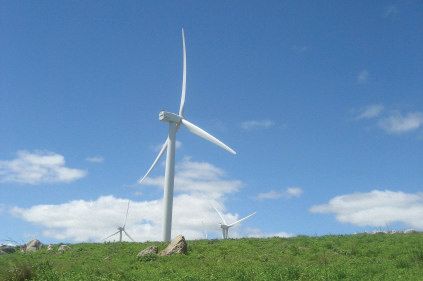
WIND FARM NOISE

Claim: Wind farms are noisy.

Fact: As with most mechanical plant, wind turbines produce noise – but
modern turbine designs have reduced the noise levels. Noise at
residential locations can be managed to acceptable levels with effective
planning and turbine location.

Wind turbines produce noise through the interaction of the blades with air and
through mechanical noise emitted by the motor and gears.
Improvements in modern turbine technology have significantly reduced the noise
produced from the blades and the mechanical components, due to better noise
insulation of components and turbine blade design. Noise represents lost energy and
therefore is something turbine manufacturers are continually working to minimise.
The experience of noise is highly subjective and may vary significantly between
people. Impacts may relate to the volume, timing and/or character of the noise
produced, but the potential impacts can be mitigated through effectively locating and
operating turbines. As discussed below, the NSW Government regulates wind farm
noise according to strict guidelines to ensure that noise impacts are maintained
within acceptable limits.

Claim: NSW does not effectively regulate noise impacts from wind
farms.

Fact: Current noise controls for wind farms in NSW are amongst the
strictest in the world.1

The NSW Government assesses potential noise impacts of a wind farm using the
South Australian Environmental Protection Authority – Wind Farms Environmental
Noise Guidelines (2003) (the ‘SA Guidelines’).2 The SA Guidelines are amongst the
strictest in the world, with more stringent requirements than European and North
American standards.
Noise at the receiver is measured in decibels (dB); this is usually adjusted to
approximate the sensitivity of the human ear and presented in A-frequency weighted
decibels, or dB(A). Under the SA Guidelines, the predicted equivalent noise level
over ten minutes (LAeq,10min) should not exceed:
•   35 dB(A)
•   the background noise (LA90,10min) by more than 5 dB(A) whichever is greater, at all
    relevant ‘receivers’ (where the noise is heard) for each integer wind speed from
    cut-in to rated power of the Wind Turbine Generator.

1 Acoustic Consulting Report (Prepared for the Ontario Ministry for the Environment) Wind Turbine Facilities Noise
    Issues 2007, See pg 26, Table 3.1 Comparison of Noise Regulations,
    [https://ospace.scholarsportal.info/bitstream/1873/13073/1/283287.pdf].
2 South Australian Environment Protection Authority 2003, Environmental Noise Guidelines: Wind Farms.

                                                                                                                     4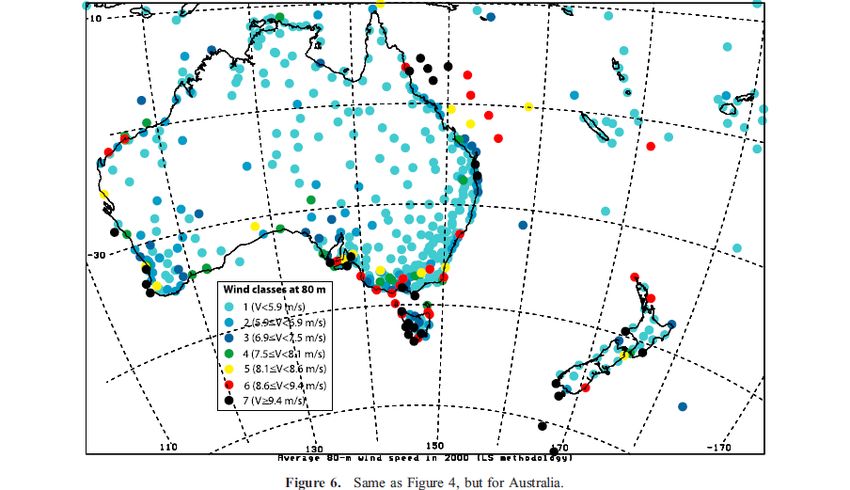
Background noise is relevant because high ambient noise levels tend to mask noise
from a particular source; the same level of noise from a particular source, say a
passing truck, is likely to cause greater annoyance in a quiet environment than in a
busy noisy environment.
A unique characteristic of wind farms is that the noise level from each wind turbine
generally increases with increasing wind speed, but the background noise will also
often rise with increasing wind speed.
Figure 1 illustrates the noise level of common sounds relative to the baseline NSW
noise limit for wind farm noise.

Figure 1: The level of common sounds3
In effect, this means that in quiet rural environments [i.e. with a background noise
below 30 dB(A)], the guidelines require that wind turbine noise should not exceed 35
dB(A) at a position outside neighbouring residences. In cases where there is higher
background noise [i.e. above 30 dB(A)], wind turbine noise should not increase
existing background noise levels by more than 5 dB(A). Different criteria may apply at
different wind speeds because the background noise may vary with changing wind
speed.
In the case of cumulative or staged wind farm development, the SA Guidelines state
that noise generated by an existing wind farm should not be considered as part of the
background noise in determining criteria for subsequent development.

3 NSW Department of Environment, Climate Change and Water 2010, Noise Guide for Local Government.

                                                                                                    5
Figure 2 provides an example of noise limits at residences/receivers in the vicinity of
the Capital Wind Farm, which commenced operating in 2009. The noise limits
increase slightly at higher wind speed levels, as the background noise levels are
greater at higher wind speeds.

Figure 2: Example of Wind Farm Noise Limits from Capital Wind Farm Project Approval

Claim: NSW does not monitor wind farms to ensure compliance with
noise limits.

Fact: NSW has processes in place to ensure wind farms are complying
with noise limits in the development approval.

In the event a proposed wind farm project is granted planning approval, wind farm
operators must carry out noise compliance monitoring as a Condition of Approval.
This usually occurs within three months of the commissioning of the wind turbines.
The results must be provided to the NSW Department of Planning (DoP), which may
request further monitoring. DoP requires noise compliance monitoring and
assessment to be undertaken in accordance with procedures in the SA Guidelines.
DoP also employs a compliance team to undertake independent noise monitoring at
wind farms.
If the noise limits are being exceeded, the operator must submit a proposal to
manage or mitigate noise. Solutions to exceeded noise limits may include sector
management (i.e. strategic shutting down of particular turbines) or double glazing
affected residents’ windows.
Complaints about noise should be made to DoP (by phoning 02 9228 6333) or
contacting the relevant local council, if the wind farm was approved by local council.
DoP may require further monitoring by the wind farm operator or carry out
independent noise monitoring.

                                                                                          6
Claim: Conventional noise measurement of wind turbines
underestimates actual noise (the ‘Van den Berg’ effect).
Fact: Various factors (e.g. atmospheric stability, local topographic
conditions and land use) make wind farm noise assessment complex,
but they are addressed by the SA guidelines or Draft National Wind
Farm Guidelines.
Traditional wind farm assessment approaches measure all wind speeds at 10m
above ground level. The corresponding hub height wind speed is determined using a
standard equation.
Studies by Van den Berg in an area of Germany found that this empirical relationship
did not apply well in stable atmospheric conditions, where the near-ground wind
speed and hub height wind speed differed significantly to the wind speed measured
at 10m above ground level. The result was that under stable atmospheric conditions,
the near-ground wind speed and background noise was lower than predicted but the
hub height wind speed and turbine noise emissions were higher than predicted,
which could lead to higher noise impacts than predicted.4
The current Draft National Wind Farm Development Guidelines (July 2010)5, which
adopt the recently released Australian Standard 4959-2010, propose updated noise
assessment techniques designed to address potential inaccuracies in conventional
wind farm noise assessments. Updated techniques include the use of hub height
wind speed for correlation with background noise monitoring, the use of a day and
night assessment period, and consideration of atmospheric stability. These additional
noise assessment techniques will be considered by the DoP when considering any
changes to the current noise assessment guidelines for NSW.
Van den Berg also noted that landscape features and topographical conditions such
as rocky or hilly terrain may cause near-ground wind speeds (and hence background
noise) to be low. The SA guidelines and Draft National Wind Farm Guidelines ensure
that the impact of wind turbine noise relative to background noise is well understood
for all locations, by carefully considering the selection of background noise
monitoring locations.
4 Van den Berg GP 2004, Effects of the Wind Profile at Night on Wind Turbine Sound in Journal of Sound and
Vibration; G.P van den Berg 2005, The Beat is Getting Stronger: The Effect of Atmospheric Stability on Low
Frequency Modulated Sound of Wind Turbines in Journal of Low Frequency Noise, Vibration and Active Control.
5 Environment Protection and Heritage Council 2010, Draft National Wind Farm Guidelines,
[www.ephc.gov.au/sites/default/files/DRAFT%20National%20Wind%20Farm%20Development%20Guidelines_J
ULY%202010_v2.pdf]
7Claim: Noise and vibrations from wind farms make people sick (‘wind
turbine syndrome’ or ‘vibroacoustic disease’).
Fact: There is currently no peer reviewed scientific evidence to
substantiate claims that wind farm noise and vibrations make people
sick.
The National Health Medical Research Centre issued a public statement in July 2010
stating ‘there is no published scientific evidence to support adverse effects of wind
turbines on health.6
Wind Turbine Syndrome
‘Wind Turbine Syndrome’ is said to be a series of symptoms, such as sleep
problems, headaches, dizziness and tinnitus, that are caused by wind turbines.
The syndrome appears to be based on two hypotheses:
a) Low levels of airborne infrasound from wind turbines, at 1 to 2 Hz, directly affect
the vestibular (inner ear) system
b) Low levels of airborne infrasound from wind turbines at 4 to 8 Hz enter the lungs
via the mouth and then vibrate the diaphragm, which transmits vibration to the
viscera, or internal organs of the body.
The combined effects of these infrasound frequencies is claimed to send confusing
information to the position and motion detectors of the body, which leads to
symptoms such as the ones listed.7
The World Health Organisation has concluded ‘There is no reliable evidence that
sounds below the hearing threshold produce physiological or psychological effects.8
There is no credible, peer-reviewed scientific evidence that demonstrates low levels
of wind turbine sound will directly affect the vestibular system.9 In fact, the body itself
generates sounds at this level (e.g. heartbeat).10 Acousticians who have studied
physiological responses to low frequency noise have found it takes high levels of
exposure to trigger any health problems, such as those experienced inside a
spacecraft. Indeed, scientific studies indicate that external sounds below 80Hz do not
cause chest vibration.11
6 Government National Health and Medical Research Council Public Statement 2010, Wind Turbines and Health
[www.nhmrc.gov.au/_files_nhmrc/file/publications/synopses/public_statement_wind_turbines_and_health.pdf].
7 Wind Turbine Sound and Health Effects, An Expert Panel Review, December 2009, (prepared for the American
Wind Energy Association and the Canadian Wind Energy Association),
[www.awea.org/documents/AWEA_CanWEA_SoundWhitePaper_12-11-09.pdf].
8 World Health Organization 2004, Energy, sustainable development and health. Background document for the
Fourth Ministerial Conference on Environment and Health, 23-25 June 2004, Geneva.
9 Wind Turbine Sound and Health Effects, An Expert Panel Review, December 2009, (prepared for the American
Wind Energy Association and the Canadian Wind Energy Association)
[www.awea.org/documents/AWEA_CanWEA_SoundWhitePaper_12-11-09.pdf]; The Acoustic Ecology Institute,
AEI Special Report: Wind Energy Noise Impacts 2009, [www.acousticecology.org/srwind.html]; National Health
Service, United Kingdom, Are wind farms a health risk?, 3 August 2009,
[www.nhs.uk/news/2009/08August/Pages/Arewindfarmsahealthrisk.aspx].
10 Wind Turbine Sound and Health Effects, An Expert Panel Review, December 2009, (prepared for the American
Wind Energy Association and the Canadian Wind Energy Association),
[www.awea.org/documents/AWEA_CanWEA_SoundWhitePaper_12-11-09.pdf].
11 Wind Turbine Sound and Health Effects, An Expert Panel Review, December 2009, (prepared for the American
Wind Energy Association and the Canadian Wind Energy Association),
[www.awea.org/documents/AWEA_CanWEA_SoundWhitePaper_12-11-09.pdf].
8Vibroacoustic Disease
There have also been claims that vibrations from wind farms cause vibroacoustic
disease. Vibroacoustic disease can be described as changes to the structural
component of tissue as a result of excessive exposure to low frequency noise.
This is a recognised disease, but there is no evidence that it is caused by exposure
to wind farm noise.12 Vibroacoustic disease only occurs from high levels of exposure
to levels of vibration such as found in the environment for aircraft technicians,
commercial and military pilots and disc jockeys.
The American Wind Energy Association (AWEA) and Canadian Wind Energy
Associations (CanWEA) established a scientific advisory panel in early 2009 to
conduct an extensive review of current peer-reviewed literature available on claims of
health effects of wind turbines. The multidisciplinary panel included medical doctors,
audiologists, and acoustical professionals from the United States, Canada, Denmark,
and the United Kingdom. Each panel member contributed expertise in audiology,
acoustics, otolaryngology, occupational/ environmental medicine, or public health.
The objective of the panel was to provide an authoritative reference document for
legislators, regulators, and anyone who wanted to make sense of the conflicting
information about wind turbine sound.
The panel reached consensus on the following conclusions:
• There is no evidence that the audible or sub-audible sounds emitted by wind
turbines have any direct adverse physiological effects
• The ground-borne vibrations from wind turbines are too weak to be detected by,
or to affect, humans.
• The sounds emitted by wind turbines are not unique. There is no reason to
believe, based on the levels and frequencies of the sounds and the panel’s
experience with sound exposures in occupational settings, that the sounds from
wind turbines could have direct adverse health consequences.
Claim: Wind turbines have special noise characteristics (in particular, low
frequency sound and infrasound) that have damaging health impacts.
Fact: The noise from wind farms is not significantly different from other
sources of noise in our day-to-day environment. Specific noise characteristics
are included in the planning assessments of wind farms in NSW.
Some special audible characteristics are a source of annoyance separate to
‘loudness’. They include amplitude modulation, infrasound, low frequency noise
and tonality.13
The SA 2003 noise limit has been set to address the inherent characteristics of wind
farm noise, including amplitude modulation (varying sound levels over time). The
amplitude modulation in wind farm noise is often described as a ‘swoosh’ noise,
caused by the wind turbine blades passing interrupted airflow near the tower.
Low frequency pressure vibrations are typically categorised as low frequency
sound when they can be heard near the bottom of human perception. Natural
12 Wind Turbine Sound and Health Effects, An Expert Panel Review, December 2009, (prepared for the American
Wind Energy Association and the Canadian Wind Energy Association),
[www.awea.org/documents/AWEA_CanWEA_SoundWhitePaper_12-11-09.pdf].
13 South Australian Environment Protection Authority 2003, Environmental Noise Guidelines: Wind Farms.
9sources of low frequency sound include wind, rivers and waterfalls at both audible
and non-audible frequencies. Other sources include road traffic, aircraft and industrial
machinery. Although uncertainty remains around the level of low frequency sound
produced by wind turbines, the available evidence indicates that, if present, low
frequency noise is not a health risk.14
Infrasound refers to the low frequency pressure vibrations that are below the
common limit of human perception.15 Infrasound can manifest as a rattle in
lightweight materials such as glass.16
We are all exposed to infrasound in our everyday lives. Infrasound is always present
in the environment and stems from many sources including ambient air turbulence,
ventilation units, household equipment, and traffic. Infrasound circulates further (i.e.
with lower levels of dissipation) than higher frequencies. Low frequency pressure
vibrations (i.e. low frequency sound and infrasound) are perceived as a mixture of
auditory and tactile sensations.17
Infrasound was a characteristic of some early wind turbine models with blades
downwind of the main tower; however, modern designs generally have blades
upwind of the tower. The SA Environment Protection Agency conducted an extensive
literature search for its 2003 guidelines and found no evidence of infrasound as a
result of modern wind farm operation.18 Subsequent literature has also indicated that
infrasound from wind turbines with upwind blades is not a legitimate concern.19, 20
Tonal noise is defined as ‘noise containing a discrete frequency component’ such as
the screeching sounds from poorly maintained equipment or the beeping some
vehicles make when reversing. The consensus is that modern wind farms are highly
unlikely to exhibit tonal noise. If they did, it would be a consequence of mechanical
failure or wear and tear which would be managed through maintenance or repair.
Summary
In summary, recent studies show that the types of sound produced by wind turbines
are not unique or different to other sound types experienced in our environment.
These studies have been reviewed by Australian (the National Health Medical
Research Council) and international health authorities (the World Health
Organisation) who have concluded that sound from wind turbines does not present a
risk to human health.
14 Wind Turbine Sound and Health Effects, An Expert Panel Review, December 2009, (prepared for the American
Wind Energy Association and the Canadian Wind Energy Association),
[www.awea.org/documents/AWEA_CanWEA_SoundWhitePaper_12-11-09.pdf].
15 Dr Rodgers A 2006, Wind Turbine Acoustic Noise, White Paper prepared by the University of Massachusetts.
16 South Australian Environment Protection Authority 2003, Environmental Noise Guidelines: Wind Farms.
17 Dr Rodgers A 2006, Wind Turbine Acoustic Noise, White Paper prepared by the University of Massachusetts.
18 South Australian Environment Protection Authority 2003, Environmental Noise Guidelines: Wind Farms.
19 Levanthall G 2006, Infrasound from Wind Turbines – Fact, Fiction or Deception, Canadian Acoustics, 34(2).
20 Jakobsen J 2005, Infrasound Emission from Wind Turbines in Journal of Low Frequency Noise, Vibration and
Active Control, 24, p145-155.
10WIND TURBINES AND SHADOW FLICKER
Claim: Wind turbines will create significant shadow flicker on nearby
residences.
Fact: Shadow flicker can be managed by appropriate location and
operation of wind turbines so that there are no significant impacts on
neighbouring properties.
At certain times of day, the sun may pass behind the rotors of a rotating wind turbine
and cast a flickering shadow over nearby houses.
Any potential effects of shadow flicker can be mitigated through effectively locating
wind turbines, implementing screening such as vegetation or by stopping the turbine
during the brief period that the shadow flicker is caused. These management
approaches were noted by the NSW Rural Wind Farms Inquiry Committee which
concluded that the level of concern associated with shadow flicker is not supported
by the evidence. 21
In NSW, shadow flicker is taken into consideration during the development
assessment process for wind farms.
21 Legislative Council General Purpose Standing Committee No. 5, Rural Wind Farms Inquiry 2009, p 128.
11WIND TURBINE EFFICIENCY AND COST
EFFECTIVENESS
Claim: Wind turbines are inefficient
Fact: Large wind turbines convert wind into energy more efficiently
than coal and most gas plants in NSW
Here it is important to distinguish between efficiency and capacity factor:
Efficiency: the proportion of the primary energy source input (e.g. wind, coal, gas)
converted into electricity.
• The maximum theoretical achievable efficiency for wind turbines is 59.3%; this is
called the Betz limit. In practice, wind turbines convert around 45% of the wind
passing through the blades into electricity – approaching 50% peak efficiency22
• NSW coal-fired power stations convert into electricity between 29%–37% of the
energy available in the coal they consume
• NSW gas plants convert into electricity between 32%–50% of the energy
available from gas. 23
Capacity factor: this is the average operating output of a generator over time. It is
calculated by dividing the total output (megawatt hours, MWh) by the rated power
(megawatt, MW) and then multiplying by the number of hours in a year.24 The rated
power of an electricity generator is the amount of electricity the generator produces
over an hour, when operating at maximum performance – for example, if a wind
turbine has a rated power of 1 MW, then that turbine will produce 1 MW of energy per
hour of operation when running at full capacity.
No power station operates at 100% capacity factor, in part because they need some
time for maintenance and repairs, and in part because sometimes their full output is
not required by the electricity market.
• Coal-fired generators have capacity factors around 85%
• Gas-fired generators can vary from as high as 85% (for base load plant) to less
than 10% (for peaking plant)25
• The average capacity factor for a large solar plant that produces electricity during
daylight hours is around 20–25%26
• The average capacity factor for a wind farm in Australia is around 35% - and can
range from around 25% to 45%.
22 Efficiency and Performance, Wind Energy Fact Sheet 14, UK Department for Business, Innovation and Skills
[www.berr.gov.uk/files/file17821.pdf], Manwell JF, McGowan JF and Rogers AL 2009, Wind Energy Explained,
Theory, Design and Application.
23 Acil Tasman 2009, Fuel resource, new entry and generation costs in the NEM, Final Report to AEMO, April.
24 From [www.awea.org/faq/wwt_basics.html].
25 Diesendorf M 2007, (on behalf of New South Global Consulting), ‘The Short-Term Potential for Renewable Energy
and Demand Reduction to provide Base-Load Power in New South Wales’.
26 Denholm P &Margolis R 2006, Very Large-Scale Deployment of Grid-Connected Solar Photovoltaics in the United
States: Challenges and Opportunities, National Renewable Energy laboratory,
[http://www.nrel.gov/pv/pdfs/39683.pdf].
12Wind capacity factors are lower than coal and base load gas plants - mostly because
they only operate when sufficient wind is available – but they generally use their
energy source more efficiently. The capacity factors of Australian wind farms are
typically higher than for wind farms in numerous other countries in the world, such as
Germany, that have significant wind generation.
Claim: Wind power is expensive and not cost-effective
Fact: 1. Wind power is one of the most cost-proven renewable energy
technologies
A distinction needs to be drawn between:
1. the longer-term full economic cost of a generating plant (known as the Long
Run Marginal Cost, or LRMC)
2. its operating costs (known as the Short-Run Marginal Cost, or SRMC)
3. the electricity market price that the plant receives.
Wind energy from existing wind farms in Australia is typically being produced for a
LRMC27 of around $80–$100/MWh and up to around $130/MWh for sites with lower
wind speeds.
The expanded national Renewable Energy Target (RET) legislation mandates a
yearly increase in electricity supplied from renewable energy, increasing by 20% to
45,000 gigawatt hours (GWHs).
Wind is one of the lower cost options of the currently available renewable energy
technologies in Australia and is predicted to contribute the largest share of the target.
For example, modelling commissioned by the Australian Government forecast wind
would supply 17,000 of the required 45,000 gigawatt hours of electricity from
renewable sources (or 37% of the RET).28
2. The costs associated with wind energy are presently comparable to
coal-fired plants (taking into consideration environmental externalities)
The direct LRMC of a new coal or gas-fired plant in NSW is currently significantly
lower than wind. For example, ACIL Tasman (2009) estimated the LRMC of a new
coal-fired plant in NSW is between $50–55/MWh and a new efficient combined cycle
gas-fired plant is between $51–64/MWh.
However, these estimates (and market prices) do not include some of the key
environmental externalities associated with their operation. An externality is a cost or
benefit that a market transaction imposes on other external parties - meaning the
market price does not represent the true cost of the transaction. For example, a key
externality for fossil fuel generators in Australia at present is their greenhouse gas
emissions. Other external costs from fossil fuel generators include impacts on
regional air quality (sulphur oxides, nitrogen oxides, particulates).
All of these have negative impacts on ecosystems, built environment and human
health but these ‘costs’ are not reflected in the market price of fossil fuel-based
27 Defined here as the ‘the cost of an incremental unit of generation capacity, spread across each unit of electricity
produced over the life of the station.” Acil Tasman 2009.
28 MMA 2009, Benefits and Costs of the Expanded Renewable Energy Target, Report to the Department of
Environment, Climate Change and Water.
13electricity generation. Another example is that many coal-fired generators in Australia
are heavy users of water for cooling, but do not appear to pay the market value of the
water or other land-use impacts. Estimating the externality cost of greenhouse gas
emissions is highly controversial. The Stern Review on the Economics of Climate
Change (produced for the United Kingdom Treasury)29 estimated the externality cost
of greenhouse gas emissions alone to be $US75/tonne of CO-2e30.
For a NSW coal-fired generator, this would increase operating costs by
approximately $70/MWh, making the true economic cost of coal-fired generation
greater than current wind farms in Australia.
3. Wind energy is likely to be cost effective in electricity markets in the
future if a carbon price is implemented
The Australian Government has proposed the Carbon Pollution Reduction Scheme
(CPRS) as the primary mechanism for addressing climate change. The CPRS is an
emissions trading scheme which prices greenhouse gas emissions by requiring
emitters such as power stations to obtain a permit for each tonne of CO-2e they emit.
Leading energy modellers project that good wind sites will be competitive in
electricity markets against coal-fired plants, if the Australian Government implements
the most conservative of its proposed targets (5% less than 2000 levels by 2020) for
the CPRS (Figure 3).
Figure 3: Long-Run Marginal Costs for New Generation, Carbon Pollution Reduction
Scheme, 2020/5% Target
Figure 4 illustrates that even the lower wind sites are likely to be competitive against
coal-fired plants under a 15% target reduction by 2020.
29 From [http://www.hm-treasury.gov.uk/stern_review_report.htm].
30 CO2-e is a measurement for the relative global warming potential of a greenhouse gas compared with carbon
dioxide. It is calculated by multiplying the weight of gas (methane, for example) by its global warming potential
(21 for methane).
14
Figure 4: Long-Run Marginal Costs for New Generation, Carbon Pollution Reduction
Scheme, 2020/15% Target
The Australian Government has said Australia will unconditionally reduce its
emissions by 5% below 2000 levels by 2020, and by 15% or 25% by 2020 depending
on the level of international agreement to reduce greenhouse gas emissions.31 The
Australian Government has set an aspirational target of a 60% reduction in national
greenhouse gas emissions, compared to 2000 levels by 2050.
Wind energy seems almost certain to be a competitive option in electricity markets
with fossil-fuels in the future, if the emissions reduction targets being considered by
the Australian Government are implemented.
31 Australia’s Quantified economy-wide emissions targets for 2020, [http://unfccc.int/home/items/5264.php].
15WIND POWER AND THE ELECTRICITY GRID
Claim: Wind power threatens the reliability and security of the electricity
network because wind is an intermittent energy source
Facts: Wind power is being successfully integrated into the electricity
grid and market in Australia, and the National Electricity Market (NEM) is
well positioned to absorb future growth in wind farms
To date, integrating wind energy into the NEM has been successful. This suggests
the market design should be able to facilitate higher wind penetrations than those
currently experienced. For example, South Australia, has one of the highest
penetrations of wind energy in the world (meeting around 15% of SA electricity
demand in 2008–09).32 South Australia regularly reviews its arrangements to ensure
that wind is being effectively integrated.
The former National Electricity Market Company Operator (NEMCO) and the South
Australian Electricity Supply Industry Planning Council (ESIPC) found that within
South Australia there were only modest impacts on system operations for up to
500MW of wind. Further technical standards were required for 800–1000MW of wind;
these have been successfully implemented in South Australia and now across the
NEM.
In addition, a review of international evidence conducted for the ESIPC stated:
‘Our conclusion is that there is no firm technical limit to wind evident in international
33
experience to date, provided market arrangements are modified appropriately.’
The growing proportion of wind power does present integration challenges, but these
can be suitably managed by the electricity grid and market for the following key
reasons:
1. The electricity grid is designed to handle variability
The NEM must deal with significant variation in both the demand and supply of
electricity each day due to variables concerning human activities, temperature
fluctuations and unexpected natural events and supply-side events (e.g. the loss of a
generator).
These short-term variations in demand and supply are balanced every five minutes
within the spot market. Generators right across the NEM, all the way from the north
of Queensland down the east coast as far as Tasmania and across to South
Australia, make offers to supply electricity to the grid in five-minute increments.
Furthermore, there are a series of so-called ancillary services markets to deal with
unexpected variability within five minute dispatches.
32 South Australian Government 2010, [http://www.climatechange.sa.gov.au/index.php?page=renewable-energy-in-
sa]. Swift, D 2009, Discussion with the Energy Consumers Council, EGM Corporate Developm ent, AEMO,
[http://www.dtei.sa.gov.au/__data/assets/pdf_file/0007/44638/AEMO_presentation_with_Vince_Duffy_re_wind_
power_etc_2_Dec_09.pdf].
33 Electricity Supply Industry Planning Council 2005, Planning Council Wind Report to Essential Services
Commission of South Australia,
http://www.esipc.sa.gov.au/webdata/resources/files/Planning_Council_Wind_Report_to_ESCOSA.pdf].
16Essentially, current power system operation and market management processes are
designed to be robust to large and fast changes in circumstances, including wind
variability.
2. Existing and new market arrangements are successfully integrating
wind energy into the NEM
The electricity market operator runs a centralised dispatch process for ‘scheduled’
generators that attempt to solve the most efficient ‘secure’ dispatch of available
generators to meet demand. Traditionally, wind farms in the NEM have been non-
scheduled34 and only subject to central power system operator control (the market
operator or network service provider) at times when system security was at risk.
However, as wind farms become more common, large and unexpected swings in
output could impact on network security if not managed. Consequently, the NEM has
been bringing wind farms more formally into market dispatch operations.
A few years ago, South Australia imposed the requirement that new wind farms in the
state register as scheduled generators, meaning they have to operate subject to the
same market arrangements as conventional coal and gas fired plant. A number of
wind farms have successfully participated in the NEM under these arrangements.
A set of rules for ‘semi-scheduled’ generators, specifically designed for intermittent
generation greater than 30MW, have been in force in the NEM since March 2009.35
Under these rules, wind generator output can be controlled downwards to manage
electricity market constraints.36
3. Increasing dispersion of wind farms throughout the NEM and significant
improvements in the forecasting of wind energy will also assist in
integration
Variability in wind generation makes it more difficult to schedule other generators
and, in the longer-term, forecast the ‘firm’ contribution they can make to system
reserves and meeting demand peaks. This assessment is important, as it guides new
investment.
However, as more wind farms are connected to the grid, the increased geographic
distribution of wind farms helps smooth out variability in wind speed and output
across different areas and generators.37Distributing wind farms through the NEM into
regions with different weather systems where there is limited wind generation (such
as NSW) assists in managing wind generation by comparison with placing more wind
generation in low demand regions which already have high levels of wind energy
such as coastal South Australia.
The Australian Wind Energy Forecasting System (AWEFS)38 (funded by the
Australian Government) is improving the ability of grid and market operators to
34 Effectively, non-scheduled generators have been treated as ‘negative load’ (ie output from wind generators was
subtracted from the load the market operator needed to balance with generation).
35 For details, see [www.aemo.com.au/electricityops/140-0091.html].
36 Increasingly, wind farms are subject to ‘causer-pay’ arrangements for costs they place on the electricity industry to
maintain system reliability and security (e.g. frequency control ancillary services, FCAS). At present, FCAS
costs are low by comparison with wholesale spot market revenue. Work on the NEM suggests that the impacts
of increased wind are unlikely to be very significant under present arrangements. See Barker F, Clem ents D,
Outhred H & Thorncraft, S 2008, ‘Market-Based Ancillary Services in the Australian National Electricity Market
for Increased Levels of Wind Integration’, Wind Engineering, Vol 32, No. 1, pp. 1-12.
37 Diesendorf M., 2007, (on behalf of NewSouth Global Consulting) ‘The Short-Term Potential for Renewable Energy
and Demand Reduction to provide Base-Load Power in New South Wales’.
38 For an overview see [www.aemo.com.au/electricityops/0260-0006.pdf].
17predict wind output. The AWEFS is being integrated into the Australian Energy
Market Operator’s (AEMO’s)39 forecasting processes from the five-minute despatch
process to the two-year medium-term system adequacy projections.
Further adjustments will be needed over time, but the existing power system
operation and market management processes represent a solid foundation for the
integration of larger quantities of variable electricity sources.
The NSW Rural Wind Farm Inquiry Committee concluded that wind power is being
effectively integrated into the grid and the NEM. The Australian Energy Market
Commission Review of Energy Market Frameworks in light of Climate Change
Policies (2009) also suggested that there were straightforward opportunities to
improve the capability of the NEM to incorporate significant wind generation.
Claim: Wind power reduces the quality of power
Fact: Increased levels of wind generation will not reduce the quality of
power if appropriate technical standards are set
The South Australian ESIPC found the improved technical capabilities of wind
turbines and high quality network arrangements demonstrated that power quality
would not be adversely affected by wind generation.40 As is the case with any other
type of generator, appropriate technical requirements and network guidelines are in
place to ensure the quality of power.
Claim: Wind turbines do not produce power at peak times of high
demand
Fact: Output from a group of wind farms is similar across peak and
non-peak periods
An analysis of 30-minute output data from South Australian wind farms shows a high
level of variability. Figure 5 illustrates that there is only a modest variation in average
generation levels, at times of higher demand relative to times of lower demand.41
This is illustrated in Figure 5, which shows the level of electricity demand for every
half hour interval arranged from highest to lowest (dark blue line), with the
corresponding total SA wind output for each half hour period (grey crosses).
Wind farm output ranges from zero (occasionally) to around 600MW, and on
average, a little less than one third of the installed wind capacity was generating at
any time (as illustrated by the dotted line). Additionally, there is only a modest
variation in average generation levels at times of higher demand relative to times of
39 The AEMO was called NEMMCO.
40 Electricity Supply Industry Planning Council, 2005, Planning Council Wind Report to Essential Services
Commission of South Australia,
[www.esipc.sa.gov.au/webdata/resources/files/Planning_Council_Wind_Report_to_ESCOSA.pdf].
41 Cutler N, MacGill I & Outhred H., 2009, The Integration of Wind Generation within the South Australian Region of
the Australian National Electricity Market, CEEM/EERH Working Paper,
[www.ceem.unsw.edu.au/content/userDocs/SAWindPowerEffectOnNEM_workingPaper_10Nov09.pdf].
18lower demand (see Figure 5) – illustrating the contribution wind farms make during
peak periods.42
Figure 5: The South Australian demand duration curve for 2008-9 with the
corresponding total wind power and moving average total wind power
It is also important to keep the variability of wind farm output in context. As noted
earlier, no generating plants can provide 100% assurance they will be available to
generate at times of peak demand, and secure operation of the NEM requires the
availability of additional supply or demand options at times of peak demand to guard
against such contingencies.
42 Cutler N, MacGill I & Outhred H., 2009, The Integration of Wind Generation within the South Australian Region of
the Australian National Electricity Market, CEEM/EERH Working Paper,
[www.ceem.unsw.edu.au/content/userDocs/SAWindPowerEffectOnNEM_workingPaper_10Nov09.pdf].
19WIND POWER AND GREENHOUSE GAS REDUCTION
Claim: Wind power does not reduce greenhouse gas emissions or
displace fossil-fuel generation
Fact: Under all but extraordinary circumstances, every unit of wind
power sent into the electricity grid will reduce greenhouse gas
emissions to meet any given level of market demand
Secure power system operation requires that electricity generation precisely meet
demand at all times and locations in the network. Additional wind power injected into
the network must therefore displace an equivalent amount of power from other
sources for any given level of demand. Calculating the greenhouse gas savings from
wind farms requires detailed analysis of which generators are displaced by their
output.
In NSW, a study by McLennan Magasanik Associates (MMA) (one of the consultants
that undertook the modelling for the Australian Government on the CPRS and RET)
found that wind farms ‘almost exclusively’ replace the output of NSW coal or gas
generators, or coal generators in Queensland or Victoria. The greenhouse savings
for a 150MW wind farm, a 500MW wind farm and a 3000MW wind farm are shown at
Figure 6.
Figure 6: Greenhouse Gas Emissions abated, 150 MW, 500 MW and 3000 MW Wind
Capacity, NSW
A 150MW wind farm (around the average size for wind farms being planned for
NSW) sends enough electricity into the grid on average to power around 60,000 to
2065,000 homes, saving on average 360,000 tonnes of greenhouse gas emissions
annually.43
If a carbon price is introduced, the greenhouse savings will be lower as gas plants
start replacing coal plants (due to their lower greenhouse gas emissions). Therefore,
a 150MW wind farm would save between 160,000 to 400,000 tonnes of CO-2e
annually as they would displace a greater proportion of output from gas plants.
Over 3000MW of wind farms are in operation, approved or under assessment for
NSW. If 3000MW of wind farms were to be installed in NSW, they would reduce
greenhouse gas emissions by 8.5 million to 9.2 million tonnes (before the introduction
of a carbon price) and 6.7 million to 7.4 million tonnes (after the introduction of a
carbon price).44 To put this in context, total greenhouse gas emissions from electricity
generation in NSW were 63 million tonnes CO2-e in 2008.45
Claim: Wind generation does not reduce greenhouse gas emissions by
displacing coal-fired generation because coal-fired power stations are
far less efficient when operating below rated output
Fact: Reducing the output of a coal-fired power station only leads to
minor losses in efficiency which does not negate the savings in
greenhouse gas emissions from turning down the plant to
accommodate wind energy
Coal-fired power stations can typically operate at outputs as low as 45–50% of rated
capacity. Whilst some coal plants in Australia may operate at close to 100% of rated
capacity, others will adjust output over daily and weekly cycles.
There is typically a loss in efficiency as a coal-fired plant operates below rated
capacity. However, analysis by MMA found a brown coal power station can reduce its
output by at least 20% with little change in efficiency.46 For a typical black coal-fired
plant, halving generation output to 50% of rated capacity might only reduce
greenhouse gas emissions by around 40–45% reflecting the lower thermal efficiency.
Wind generation has zero operating emissions, hence a substantial net reduction in
emissions is achieved by replacing coal-fired generation with wind.47
43 The estimate of 60,000 to 65,000 homes is based on a 150MW wind farm, producing approximately 456,000
megawatt-hours. Based on an average NSW household electricity consumption of 7.3 MWh annually
[http://www.savepower.nsw.gov.au/get-the-facts/power-use-in-nsw.aspx] a 150MW wind farm would power
between 60,000 to 65,000 homes depending on the location of the wind farm. For more information and to
calculate the power produced and greenhouse gas savings from wind farms in NSW please visit the ‘NSW wind
farm greenhouse gas savings tool’,
[http://www.environment.nsw.gov.au/climatechange/greenhousegassavingstool.htm].
44 McLennan Magasanik Associates, June 2010, Estimating Greenhouse Gas Emissions Abatement from Wind
Farms in NSW.
45 Australian National Greenhouse Accounts 2008, [http://www.climatechange.gov.au/climate-
change/~/media/publications/greenhouse-acctg/state-territory-inventory-2008.ashx]
46 See, for example, the Power Station Heat Rate (GJ/MWh) versus Output (MW) for Hazelwood Power Station in,
MMA 2006, The Assessment of Greenhouse Gas Abatement from Wind Farms in Victoria.
47 See, for example, Australian Government, Generator Efficiency Standards Report 2006.
21Claim: Wind power does not reduce greenhouse gas emissions because
it is an intermittent power source that requires conventional coal or gas
plants to be running as a back-up
Fact: Wind does not require coal or gas plants as a back-up because the
electricity grid is already equipped to handle fluctuations in both
demand and supply
Wind farms have low operating costs, so when the wind is blowing they will generally
displace output from other generators. If the wind is not blowing in a particular place
at a particular time, the market operator will dispatch other generating plant to meet
demand.
Electricity supply and demand must be precisely balanced at all times and all
locations within the network. For these reasons, power systems are operated to
effectively manage small ongoing variations (regulation services) and ‘survive’ large
unexpected events such as the loss of major transmission connections or the largest
generator in the system (contingency services).
In all but a few circumstances, the market can adjust to meet unexpected changes,
be they variation in demand, loss of a major plant or wind variability. Bids are
received to supply electricity in five-minute increments.
For unexpected events within these five-minute dispatches, there are eight
Frequency Control Ancillary Services (FCAS) markets that are intended to address
large contingencies. In practice, back-up services in the NEM include partially
dispatched conventional plant, fast-start hydro generation and the capacity to shed
loads at large industrial plants (such as aluminium smelters).
The amount of back-up required is typically set by the largest possible sudden
change in electrical output within a region over that time. In NSW at present, there is
only around 185MW of wind farms installed whilst the largest coal-fired units are over
660MW.48 In this sense, it could be argued that it is the large coal-fired plants that
require the most additional generation backup.
The NSW Rural Wind Farm Inquiry Committee examined the evidence and
concluded the claim that wind power did not reduce greenhouse gas emissions
because it required additional back-up to be running was false.
Claim: Wind farms cannot generate large-scale energy and governments
should be promoting other types of clean energy
Fact: 1. Wind power is growing very rapidly around the world
Since 2000, the global capacity of wind energy has grown on average around 30%
annually to just under 122,000 MW in 2008. In the US, 40% of new generation
capacity installed in 2008 was from wind farms. 16 nations (including Australia) now
have more than 1000MW of installed wind capacity.49 Globally, this still represents
less than 2% of generation capacity but as Figure 7 illustrates, wind energy is now
playing a significant and growing role in leading jurisdictions.
48 Cullerin Range (30 MW), Capital Wind Farm (141 MW), Crookwell Wind Farm (4.8 MW), Blayney Wind Farm (9.9
MW).
49 International Energy Association 2009, Wind Energy: Technology Roadmap, http://www.iea.org
22Figure 7: Wind penetration (by contribution to annual generation) for selected
countries around the world at end 2008 (NREL, 2008 Wind Technologies Market Report,
July 2009).
2. Wind power appears to be the best currently available renewable
energy technology for providing large-scale additional electricity
generation in Australia
Within Australia, hydro power is currently the most significant renewable electricity
source but there are limited options for expansion.
Although there is considerable potential for expanding bio-energy, there are limits to
what might be achieved and potentially considerable competition for feed stocks
including liquid fuel production.
Hot rock geothermal, concentrating solar power (CSP), wave and tidal power are still
not commercially proven. Some analysts forecast the commercial viability of
geothermal power between 2015–2020, though others consider this forecast
optimistic. The NSW Pre-Feasibility Study for a Solar Power Precinct found large-
scale solar power stations are not likely to become independently commercially
viable until 2025-30.50 Although all these technologies show considerable promise,
they cannot yet be relied upon for major deployment in the short to medium term.
Solar PV is technically proven but, at present, considerably more expensive than
wind energy.
There is an important role for governments to facilitate the development of a portfolio
of renewable energy technologies through research, development and
demonstration. Until this is achieved, wind is the least cost renewable energy
technology that is proven and capable of generating large-scale, renewable electricity
in Australia.
50 AECOM 2010, Pre-Feasibility Study for a Solar Power Precinct, Prepared for the NSW Department of
Environment, Climate change and Water,
[www.environment.nsw.gov.au/resources/climatechange/PreFeasibilityStudy.pdf].
233. Wind power appears certain to play a large role in any global and
Australian effort to effectively tackle climate change
Wind energy seems certain to be key in addressing climate change. For example, the
International Energy Agency (2008) has undertaken scenario studies for achieving
major global emission reductions by 2050 (Figure 8). These scenarios suggest that
wind energy might play a far more significant role than carbon capture and storage
(CCS), nuclear power or other renewable energy options.
Figure 8: IEA scenarios for optimal annual investment in different clean energy options
to 2050 for its ACT and BLUE emission reduction scenarios.
Note: BLUE represents reductions to achieve 450ppm greenhouse gas atmospheric
concentrations in 2050. This is widely held to be a minimum level of reductions if the
world is to avoid highly dangerous and destabilising warming.51
As previously mentioned there are no insurmountable technical barriers to integrating
substantial amounts of wind power into Australia’s electricity grids and associated
electricity markets.
Electricity accounts for around 35 per cent of Australia’s greenhouse gas emissions.
Significant action must take place in the next decade if the threat of dangerous
climate change is to be addressed.
Growing wind power is therefore one of the most important ways in which we can
address the threat of dangerous climate change.
For these reasons, state-wide planning reforms and the establishment of the REPs
are being implemented to facilitate appropriately sited wind farms.
51 International Energy Association 2008, Energy Technology Perspectives.
24STRENGTH OF WIND RESOURCES IN NSW
Claim: NSW does not have good wind resources, and wind will never make a
significant contribution to meeting our energy needs
Fact: NSW has a large range of potential sites with excellent wind speeds –
generally better than European wind farms
Average annual wind speeds of around seven metres/second are currently considered
suitable for low-cost wind power generation.52 However, improvements in wind turbine
technology mean that increasingly wind farms may be established in areas with lower wind
speeds.
There are a significant number of sites in NSW with estimated speeds of seven
metres/second or greater at 80 metres, which is the hub height of modern wind turbines
(Figure 9).
53
Figure 9: Estimated wind speeds at 80 metres.
The former Sustainable Energy Development Authority carried out wind speed monitoring
and mapping in NSW to identify areas likely to have appropriate sites for wind farms (Figure
10). There are a number of sites along the Great Dividing Range as well as on the southern
coastline that have strong average wind speeds of 6–7 metres/second.
52 Archer CL & Jacobson MZ, ‘Evaluation of global wind power’, Journal of Geophysical Research, Vol 110, 2005, D12110.
53 Archer CL & Jacobson MZ, ‘Evaluation of global wind power’, Journal of Geophysical Research, Vol 110, 2005, D12110.
25You can also read