DronePrint: Acoustic Signatures for Open-set Drone Detection and Identification with Online Data
←
→
Page content transcription
If your browser does not render page correctly, please read the page content below
DronePrint: Acoustic Signatures for Open-set Drone Detection and
Identification with Online Data
HARINI KOLAMUNNA, The University of Sydney
THILINI DAHANAYAKA, The University of Sydney
JUNYE LI, University of New South Wales
SURANGA SENEVIRATNE, The University of Sydney
KANCHANA THILAKARATNE, The University of Sydney
ALBERT Y. ZOMAYA, The University of Sydney
ARUNA SENEVIRATNE, University of New South Wales
With the ubiquitous availability of drones, they are adopted benignly in multiple applications such as cinematography,
surveying, and legal goods delivery. Nonetheless, they are also being used for reconnaissance, invading personal or secure
spaces, harming targeted individuals, smuggling drugs and contraband, or creating public disturbances. These malicious or
improper use of drones can pose significant privacy and security threats in both civilian and military settings. Therefore, it
is vital to identify drones in different environments to assist the decisions on whether or not to contain unknown drones.
While there are several methods proposed for detecting the presence of a drone, they have limitations when it comes to low
visibility, limited access, or hostile environments. In this paper, we propose DronePrint that uses drone acoustic signatures to
detect the presence of a drone and identify the make and the model of the drone. We address the shortage of drone acoustic
data by relying on audio components of online videos. In drone detection, we achieved 96% accuracy in a closed-set scenario,
and 86% accuracy in a more challenging open-set scenario. Our proposed method of cascaded drone identification, where a
drone is identified for its ‘make’ followed by the ‘model’ of the drone achieves 90% overall accuracy. In this work, we cover 13
commonly used commercial and consumer drone models, which is to the best of understanding is the most comprehensive
such study to date. Finally, we demonstrate the robustness of DronePrint to drone hardware modifications, Doppler effect,
varying SNR conditions, and in realistic open-set acoustic scenes.

CCS Concepts: • Computing methodologies → Feature selection; Neural networks.

Additional Key Words and Phrases: Drones, Acoustic fingerprinting, LSTM, Drone Audio Dataset

ACM Reference Format:
Harini Kolamunna, Thilini Dahanayaka, Junye Li, Suranga Seneviratne, Kanchana Thilakaratne, Albert Y. Zomaya, and Aruna
Seneviratne. 2021. DronePrint: Acoustic Signatures for Open-set Drone Detection and Identification with Online Data. Proc.
ACM Interact. Mob. Wearable Ubiquitous Technol. 5, 1, Article 20 (March 2021), 31 pages. https://doi.org/10.1145/3448115

Authors’ addresses: Harini Kolamunna, The University of Sydney, harini.kolamunna@sydney.edu.au; Thilini Dahanayaka, The University of
Sydney; Junye Li, University of New South Wales; Suranga Seneviratne, The University of Sydney; Kanchana Thilakaratne, The University of
Sydney; Albert Y. Zomaya, The University of Sydney; Aruna Seneviratne, University of New South Wales.

Permission to make digital or hard copies of all or part of this work for personal or classroom use is granted without fee provided that
copies are not made or distributed for profit or commercial advantage and that copies bear this notice and the full citation on the first
page. Copyrights for components of this work owned by others than ACM must be honored. Abstracting with credit is permitted. To copy
otherwise, or republish, to post on servers or to redistribute to lists, requires prior specific permission and/or a fee. Request permissions from
permissions@acm.org.
© 2021 Association for Computing Machinery.
2474-9567/2021/3-ART20 $15.00
https://doi.org/10.1145/3448115

 Proc. ACM Interact. Mob. Wearable Ubiquitous Technol., Vol. 5, No. 1, Article 20. Publication date: March 2021.

 20
20:2 • Kolamunna et al.

1 INTRODUCTION
Drones are becoming ubiquitous and are no longer limited to military use. They are finding many commercial
and commodity applications in the likes of last-mile goods delivery, agriculture, surveying, emergency response,
and cinematography in addition to their recreational uses [2]. The global drone market is expected to reach 13
billion US dollars by the end of 2025, which is a staggering 200% projected growth over a period of 5 years [78].
While a limited number of countries have entirely banned the sale and the use of drones, in many countries
purchasing a drone is quite straight forward, and drone usage is permitted given a set of guidelines are followed
by the pilots [35].
 Such wide availability of drones also gives rise to potential misuse of drones in illegal activities as well as to
cause public disturbances. In last few years, we have seen reports of increasing volumes of such activities in the
likes of using drones for drug smuggling, invade private spaces, or even intentionally flying into no-fly areas to
create havoc. For instance, in late 2018 and early 2019, departures at the London Gatwick and Heathrow airports
were temporarily suspended for several hours after reports of possible drone sightings over the airfields [51, 52].
In 2015, a drone carrying crystal meth crashed into a parking lot in Tijuana, a Mexican city close
 to the US-Mexican border [50]. Multiple incidents reported unauthorized drones recording public events and
occasionally crashing on to the spectators or participants creating injuries or damaging landmarks [14, 73, 80].
Also, there have been attempts to weaponize commercial drones. For example, in 2018 in Caracas, Venezuela, two
DJI M600 drones carrying explosives detonated in the proximity of an outdoor setting where the Venezuelan
president was delivering a speech [43]. In many of those instances, the authorities failed to provide a timely
response to control the unauthorized drone, finding the perpetrating pilot, or in some cases even to establish the
fact that a drone was actually present. The drone-related incidents also resonate with the growing concerns
raised by the general public and drone pilots [9, 79, 84, 85, 88], calling for technological and regulatory actions to
offer protection from unauthorized drones.
 As identified by Lykou et al. [44], unauthorized drones launched near critical sites require rapid identification
and response. The authors also mentioned the intention of authorities to develop an identification system for
civilian drones to assist airspace segregation and compliance management. Such scenarios motivate a defensive
system that could be deployed within or around critical facilities, capable of obstruction-robust, close proximity
drone detection (i.e. detecting the presence of a drone in proximity), identification (i.e. identifying the exact make
and model of the drone), and neutralization (i.e. carefully take down or divert away unauthorized drones) to
counteract both intentional and unintentional threats posed by them.
 In this work, we focus on drone detection and drone identification. Drone detection is important in detecting an
unauthorized entry to a no-fly zone. The additional step of drone identification plays an important role in multiple
scenarios. For example, if the specific drone model can be identified, one may find specific ways to neutralize the
drone by using known vulnerabilities in communication or firmware. Also, in case of managing a fleet of drones,
where we know the sound profiles of our drones, the drone identification process allows detecting something out
of the ordinary. Moreover, there are instances where it is allowed to fly drones over populated areas, subject to
some conditions on weight and size. In such instances, drone identification can assist the process of distinguishing
between complying and non-complying drones.
 Multiple studies demonstrated the feasibility of detecting and identifying drones using various forms of data
such as video [59, 77], RF [24, 25], thermal imaging [77], radar [12, 87], and acoustics [58, 66]. Many of these
technologies are still nascent, and they have their own advantages and disadvantages. Our focus in this paper is
to build an acoustics-based drone detection and identification system. Acoustics offer some unique advantages
compared to other methods such as the feasibility to detect drones under low visibility and the ability to detect
drones at lower altitudes compared to radar-based methods [57, 72].

Proc. ACM Interact. Mob. Wearable Ubiquitous Technol., Vol. 5, No. 1, Article 20. Publication date: March 2021.
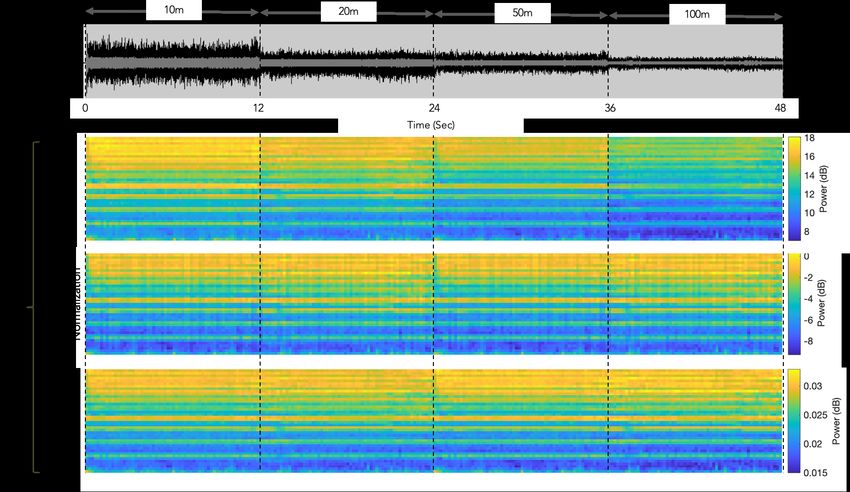
DronePrint: Acoustic Signatures for Open-set Drone Detection and Identification with Online Data • 20:3

 While there are some existing studies in acoustics-based drone detection and identification, they are either; i)
drone decision systems making a binary decision whether or not a drone is present using acoustics [3, 7, 67, 75] or ii)
focus on identifying a limited number of drones [1]. Only a few studies looked into the feasibility of open-set drone
detection and identification (i.e. detecting and identifying drone sounds when the input can be any sound) [58].
Moreover, the feasibility of such methods was shown only in limited settings such as working only with drones
without hardware modifications/defects. This is understandably due to the limitations of collecting large volumes
of data covering different drone models. To this end, in this paper, we propose an acoustics-based open-set drone
detection and identification system, DronePrint, that can identify over 13 drone models by sourcing real-world
data as well as data collected from online platforms. More specifically, we make the following contributions.

 • We explain the identification of prominent and distinguishable features of drone sound. For this, we study
 the sound generation mechanism of drones and characterize the frequency spectrum of drone sounds. We
 show that the majority of the signal energy remains in the range of 0-8kHz and there are equally spaced
 prominent energy peaks at the range of 0-2kHz where the first peak is in the range of 150Hz-400Hz. We
 show that these are the prominent features of the drone sounds that can also be used to distinguish them
 from other common mechanical sounds. Thus, we suggest placing more emphasis on lower frequencies in
 feature extraction, such as Mel-frequency cepstral coefficients (MFCC) in the range of 0-8kHz.
 • To address the lack of drone acoustics samples, mainly driven by the practical limitations of getting access
 to all available drone models and the restrictions of experimentally collecting data, we propose to source
 data from online drone videos and extract the audio component. We show that such data can be combined
 with real-world collected data without any performance impact. The models that are trained and validated
 with the online extracted data can be effectively used in real world testing. To the best of our knowledge,
 ours is the first study to show this feasibility.
 • We nullify the effect of differences in signal strengths with the distances to the drone emanating the
 sound and the most common hardware modification of low-noise propellers with the use of time-domain
 amplitude normalization. This avoids the necessity of training the model with different sound signal
 strengths. Also, in the feature space, we normalize each feature vector to unit length by dividing by its 2
 norm to minimize the effect of instantaneous noise such as birds’ sounds.
 • We propose an LSTM-based open-set drone detection and identification system, DronePrint, that can first
 classify a given sound belongs to a drone or not and subsequently identify the make and the exact model
 of the drone. We used two techniques to address the open-set problem. First, we use a background class
 where we train a binary classifier that differentiates drone sounds from non-drone sounds. To avoid the
 training time data requirement of non-drone sounds, we propose classwise-OpenMax, which is a modified
 version of the OpenMax method [5], initially proposed for open-set image classification.
 • We compare our methods with previous work and show that both the proposed methods outperform them
 by over 15% in accuracy in both open-set drone detection with unseen signals and subsequent drone make
 and model identification.
 • Finally, we evaluate the robustness of DronePrint’s detection and identification models under different
 operational conditions such as when using low-noise propellers, with Doppler effect, and under varying
 signal-to-noise-ratio (SNR) conditions. Also, we evaluated DronePrint’s drone detection performance for
 an extended period through emulation by replaying various natural and artificial sounds. We show that
 DronePrint still detects and identifies drones with different hardware modifications and under the Doppler
 effect without the need for re-training. We show that by augmenting the training set with a portion of
 noise incorporated samples, DronePrint’s detection and identification rates remain minimally affected even
 at SNR conditions as low as 1dB. Next, we demonstrate that DronePrint provides 81% open-set accuracy in
 realistic scenarios of ever-changing various natural and machinery sounds for an extended time period.

 Proc. ACM Interact. Mob. Wearable Ubiquitous Technol., Vol. 5, No. 1, Article 20. Publication date: March 2021.
20:4 • Kolamunna et al.

 The rest of the paper is organized as below. In Section 2, we present the related work. Section 3 presents our
dataset and explain the drone sound generation mechanism and frequency characteristics. Section 4 presents the
DronePrint pipeline. Section 5 presents the results of DronePrint detection and identification models followed by
the analysis of models’ robustness in Section 6. In Section 7, we discuss the limitations and possible extensions of
our work. Section 8 concludes the paper.

2 RELATED WORK
Our focus in this paper is on drone detection and identification. As we describe below, most of the existing related
work involved only drone detection, and only a few works have focused on the drone identification, and that was
also in limited settings and did not consider the more practical requirement of open-set drone detection [72]. We
present related work under four broad categories; i) radar-based methods, ii) computer vision-based methods, iii)
radio-frequency (RF) signature-based methods, and iv) acoustics-based methods.
Radar-based methods use reflected radar signatures to detect and classify drones. Zhang and Li [87], considered
the problem of detecting drones when the received radar signal is superimposed by micro-Doppler features
of multiple drones. By leveraging the Cadence Frequency Spectrum (CFS) features and a k-means classifier,
authors tried to distinguish the presence of various combinations of three drone types; quadcopter, helicopter, and
hexacopter, in a closed world setting. Authors achieved over 90% accuracy in all the scenarios they tested. Ritchie
et al. [62] used micro-Doppler radar centroid and radar cross-section with a naive Bayes classifier to classify
drones with different payload weights and achieved above 95% accuracy. Church et al. [12] evaluated Lidar for
drone detection, achieving about 90% of detection rate up to 200m range within 30 deg Field-of-View. Other
comparable works include [36, 46, 86]. Radar-based methods have the advantage of not requiring line-of-sight
and also can assist drone localization in addition to detection. However, they may have limited use when it comes
to drones with smaller surface area or low altitudes [57].
Vision-based methods rely on cameras for data acquisition and process the images in order to identify drones.
For example, Unlu et al. [77] employed 2-dimensional Generic Fourier Descriptor (GFD) features to train a neural
network that can differentiate drones from birds. The authors achieved an accuracy of around 85% and showed
that their method could outperform CNNs when less data is available. Peng et al. [59] considered the problem of
detecting drones in a given image (i.e. coming up with the bounding boxes surrounding the drones). To address the
problem of lack of labelled drone data in standard object detection datasets, the authors used the Physically Based
Rendering Toolkit (PBRT)1 to synthesize photo-realistic drone images. Then, the authors used the synthesized
data to fine-tune a pre-trained Faster R-CNN [61] and showed that an Average Precision (AP) of ∼80% could be
achieved on real drone images. Other similar studies include [41, 71]. Vision-based methods can achieve high
accuracy with high-resolution cameras under strict line-of-sight. Nonetheless, such hardware is expensive, and
vision-based methods may fail drastically in adverse weather conditions such as rain, mist, or fog [72].
RF signature-based approaches sense the wireless transmission between the controller and the drone (i.e.
control frames, data frames, or both), and detect and identify drones accordingly. Ezuma et al. [24, 25] implemented
a drone detection and identification system using the energy-transient statistical features of the RF signal such
as mean, skewness, and variance measured in both indoor and outdoor settings. At higher SNRs, the authors
achieved 95% accuracy for drone detection and 90% accuracy for identification of 17 drones, using a Markov model
and a kNN classifier, respectively. However, when the SNR is lower than 12dB, the identification performance
deteriorated significantly by about 10% per dB loss in SNR. Nyugen et al. [53] leveraged the unique RF patterns
caused by physical body shift and vibration of drones to detect and identify drone movements and drone types.
Two independent detection algorithms were employed for drone body vibration and body shifting detection
1 https://www.pbrt.org/

Proc. ACM Interact. Mob. Wearable Ubiquitous Technol., Vol. 5, No. 1, Article 20. Publication date: March 2021.
DronePrint: Acoustic Signatures for Open-set Drone Detection and Identification with Online Data • 20:5

using STFT features followed by an evidence-based identifier to achieve above 90% detection accuracy even at
long distances. For identification, authors achieved above 80% accuracy with eight drone types in a closed-set
setting. When evaluated over an unknown dataset, the model was able to identify only 64% of the unknown
drone classes. Shi et al. [68] conducted a similar study.
 RF signature-based drone detection and identification methods require active communication between the drone
and its controller, making them inept for autonomous drones. Moreover, they might suffer from long distance
and signal interference from other RF transmissions that is common especially in the unlicensed frequency bands
used by commercial and recreational drones.
Acoustics-based methods generate signatures from drone sounds using feature representations such as Linear
Predictive Cepstral Coefficients (LPCC), Mel-Frequency Cepstrum Coefficients (MFCC), Short-Time Fourier
Transform (STFT) coefficients, or spectrograms. Then the signatures are matched using simple similarity measures
or by training machine learning models. For instance, Sedunov et al. [66] showed that there were two unique
frequency components on the audio spectrum generated by two groups of drone motors (4300 and 4700 RPM)
and that feature alone yields a 92% detection accuracy.
Drone detection - Uddin et al. [75] used investigated Independent Component Analysis (ICA) and MFCC features
of drone acoustic signals to build an SVM classifier that achieved 98% accuracy in simulation setting where data
was sourced from online databases. Anwar et al. [3] compared MFCC and LPCC features with SVM classifier for
drone detection from environmental sounds of birds, aeroplane and thunderstorm, and concluded that MFCC
with SVM outperforms LPCC with SVM by about 20%, achieving overall 96.7% detection accuracy. It is unclear the
number and the make of the drones used in this study. Shi et al. [67] implemented an SVM-based drone detection
using MFCC that achieved above 85% accuracy. However, the detection algorithm was not evaluated against other
unknown sounds, rather only with different levels of environmental noise. Jeon et al. [34] compared Gaussian
Mixture Models (GMM), Convolutional Neural Networks (CNN), and Recurrent Neural Networks (RNN), for
drone sound detection and showed that the RNN models achieved the best detection performance with an F-Score
of 0.8009 for the known sounds. When evaluated with unknown drone sounds, the RNN model maintained an
F-score of 0.6984. Similarly, Cabrera-Ponce et al. [7] used microphone arrays mounted on a patrolling drone to
detect nearby intruding drones by treating the spectrograms of the acoustics signals as images and training a
CNN on Inception v.3 architecture [13]. The authors did not evaluate the system with unknown drone sounds,
and only used one drone in the training.
Drone identification - Ibrahim et al. [29] designed a lightweight model that uses the acoustic feature of MFCC
with SVM to detect drone with/without payload at, and a more computational-intensive model to classify the
payload weight classes. In a more comprehensive study, Pathier [58] used MFCC with SVM to identify the drones,
each with unique manufacturing defects in their motors. Overall, 54 motors and 11 drones of the same make were
used for evaluation, achieving above 99% accuracy in an experiment carried inside a sound booth with stationary
drones. The authors also evaluated the model by marking a fraction of the drones as ‘other’ and reached an
average accuracy of 90.8% for the known ‘other’ drones. Al-Emadi et al. [1] tested a simple two-class drone
classification with CNN, RNN, and CRNN (Convolutional-Recurrent Neural Network). The authors found that the
CRNN, which also had a significantly lower complexity and was easier to train, produced the best performance
of 92% accuracy.
 Acoustics-based methods can work without line-of-sight and also can facilitate other related application
scenarios such as localization and payload detection. They have limitations in terms of range and how they might
perform under noise. However, acoustics-based methods have some advantages over other methods, such as no
Line-of-Sight requirement in contrast to visual methods, which are critical in countering drones from within a
critical facility such as an airport [44]. Therefore, acoustic-based detection and classification system is going
to be part of holistic drone detection and classification frameworks that deploy multiple methods. However,

 Proc. ACM Interact. Mob. Wearable Ubiquitous Technol., Vol. 5, No. 1, Article 20. Publication date: March 2021.
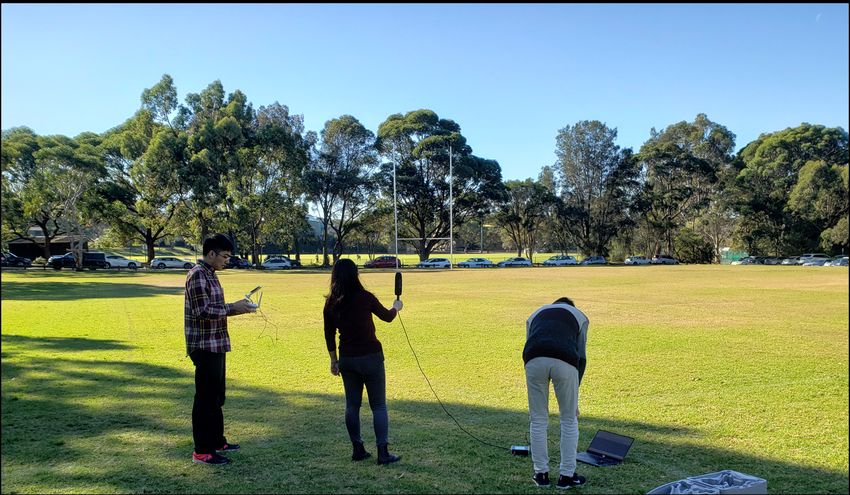
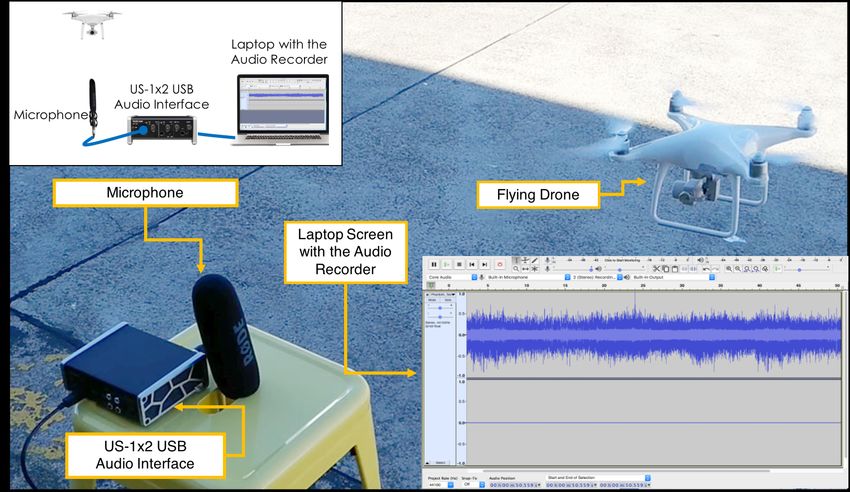
20:6 • Kolamunna et al.

 (a) Data collection in the field (b) Experimental setup

 Fig. 1. Experimental data collection

acoustics-based classification of drones is not yet been thoroughly studied, as relevant studies mostly suffer from
insufficient data in terms of drone classes and the amount of data available.
 In contrast to existing work in acoustics-based drone detection and identification, we present an acoustic-
based open-set drone detection and subsequent identification system that can identify over 13 drone models.
We demonstrate that the expansion to the real-world collected data can be done by scraping from online
videos without any performance impact. Kolamunna et al. [38] introduced the usage of online sourced data.
However, in this work, we demonstrate a system solely trained with available online data, and we propose
feature normalization methods to address distance effects and instantaneous noise. Also, we conduct multiple
experiments to demonstrate the robustness of DronePrint.

3 DATASETS & DRONE SOUND CHARACTERISTICS
We categorize the data we collected into three datasets; 1) DS1: Drone acoustic samples that are experimentally
collected and online scraped (from YouTube videos and other online sources), 2) DS2: Mechanical and natural
background noise samples, 3) DS3: Drone and noise samples that are unknown to DronePrint for open-set
evaluation. In this section, we describe how we built these datasets, followed by acoustic analysis of drone sounds.
We make available our datasets to the research community through our GitHub page [22].

3.1 Data Collection
DS1: We experimentally collected data in a park in three sessions over two days when there is not much
other activity happening, using the setup illustrated in Figure 1. In particular, we captured the acoustic signals
emanating from the drone sampled at 44.1kHz, using a high-quality directional microphone (RODE NTG4), when
the drones were flying at around 20m above the ground and within a 50m radius. The directional microphone
has a Supercardioid polar pattern, which picks the front and sides and rejects 150 degrees to the rear. However,
since we are holding the microphone up-right at 1m above the ground level, we do not miss any drone sound of
interest coming from any of the directions. We collected 3-4 minutes of data at each session for five classes of
drones; Parrot: Bebop 2 [56], DJI: Spark [21], DJI: Mavic Pro [19], DJI: Matrice 100 [18], and DJI: Phantom 4 Pro
[20].
 Since it is not possible to obtain all popular drone models for experimental data collection, we also used data
from online sources. First, we focused on YouTube videos of people flying the drones for drones reviewing
and noise level testing purposes. We downloaded the audio component of these YouTube videos using the 4K

Proc. ACM Interact. Mob. Wearable Ubiquitous Technol., Vol. 5, No. 1, Article 20. Publication date: March 2021.
DronePrint: Acoustic Signatures for Open-set Drone Detection and Identification with Online Data • 20:7

 Table 1. Details of the DS1

 No. of traces (Duration)
 Data type Source
 Training (150s) Validation (50s) Testing (50s)

 Parrot: Bebop 2 8 (10s-40s) 2 (15s & 35s)
 DJI: Spark YouTube (Training & 9 (5s-27s) 4 (10s-20s)
 DJI: Mavic Pro Validation); 8 (10s-25s) 3 (10s-20s) 3 (10s-20s)
 DJI: Phantom Pro 4 Experimental (Testing) 9 (6s-25s) 2 (20s & 30s)
 DJI: Matrice 100 4 (5s-70s) 1 (50s)
 Autel: EVO 5 (5s-100s) 3 (10s-30s) 3 (12s-20s)
 DJI: Inspire 2 3 (40s-60s) 3 (11s-23s) 3 (8s-24s)
 DJI: Mavic Air YouTube 7 (8s-45s) 4 (9s-16s) 3 (5s-25s)
 Feima Robotics: J.ME 3 (all 50s) 2 (25s each) 2 (10s & 40s)
 Parrot: Anafi 10 (5s-70s) 2 (25s each) 3 (10s-25s)
 Parrot: Bebop
 Online dataset [1] 150 (all 1s) 50 (all 1s) 50 (all 1s)
 Parrot: Membo
 MikroKopter: MK-Quadro Online dataset [70] 3 (all 50s) 1 (50s) 1 (50s)

 Table 2. Details of the DS2

 No. of traces (Duration)
 Data type Source
 Training (270s) Validation (90s) Testing (90s)

 Busy Road Noise
 Airplane
 Hair Dryer
 YouTube 3 (all 90s) 1 (90s) 1 (90s)
 Raining
 Birds
 Human Talking
 Calm Environment Experimental 3 (all 90s) 1 (90s) 1 (90s)

Video Downloader software.2 In addition to collecting extra data samples for the five drone classes we covered
in our experimental data collection, we were able to collect data for five additional drone classes, as shown in
Table 1. We manually removed the signal with audible background noise from the audio file to get audio samples
with minimal amount of background noise. Second, we used two publicly available data sets for three more
drone classes; Parrot: Membo and Parrot: Bebop [1], and MikroKopter: MK-Quadro [70]. These are experimentally
collected audio data for research purposes that were released publicly.
 Finally, we split DS1 into three parts; 60% (150s) for training and 20% (50s) each for validation and testing sets.
To ensure the generalizability of the subsequent classifier we build, we ensured that the data used in training,
validation, and testing are from different sources.
DS2: We built DS2 to capture various possible background sounds that are to be used in training and testing
of DronePrint. We captured the acoustic signal of calm environment that has no audible noise in an indoor
environment, by using the above data capturing setup in five different sessions. In addition, we scraped audio
2 https://www.4kdownload.com/

 Proc. ACM Interact. Mob. Wearable Ubiquitous Technol., Vol. 5, No. 1, Article 20. Publication date: March 2021.
20:8 • Kolamunna et al.

 Table 3. Details of the DS3

 No. of traces (Duration)
 Data type Source
 Testing (30s)

 Drones
 AIrHogs: DR1FPV Race
 Blade: NanoQX
 ZeroZero: Falcon
 DJI: Inspire1 Soundsnap 3 1 (30s)
 DJI: MavicMini
 DJI: Phantom3
 Syma: X5SW
 Non-drone mechanical sounds
 Helicopter
 Motorcycle
 Lawn Mover YouTube 1 (30s)
 Air Blower
 Car
 Natural background noise
 Slight Breeze
 YouTube 1 (30s)
 Bees Humming

signals from YouTube videos for busy road noise, air plane sounds, hair dryer, rain, bird sounds, and human speech.
Here also we split these audios into three parts; 60% (270s) for training and 20% (90s) each for validation and
testing sets. We collected five YouTube traces (90s each) for each class of sound. Similar to DS1, we ensured that
the data used in training, validation and testing are from different sources. As such, we used three of them for
extracting the training samples, and one each for extracting validation and testing samples. Details of DS2 are
shown in Table 2.
DS3: We built DS3 for open-set evaluation consisting of both drone and non-drone sounds. We scraped acoustic
signals for seven drone classes that are not included in DS1 from soundsnap, which is an online database for
various sounds.3 Also, we scraped acoustic signals from YouTube for five other non-drone mechanical sounds
and two natural sounds. Details of DS3 are shown in Table 3.

3.2 Drone Sound Characteristics
Next, we analyze acoustic patterns generated by drones, their sources, and signal characteristics that indicate the
possibility of fingerprinting drones based on acoustic signatures.
Sources of the drone sounds. According to the principle of aerodynamics, drones fly by pushing the air close
to the propellers downwards as the propeller blades spin at very high speeds. The audio noise generated from
drones is primarily due to its propellers, motors, and the mechanical vibration of the body. Among these sources,
propeller noise is significant due to the air drifting with their high-speed motion. This rapid contact of blades
and air results in a chopping or buzzing sound, which is heard as noise in the human audible range. The motor
3 https://www.soundsnap.com

Proc. ACM Interact. Mob. Wearable Ubiquitous Technol., Vol. 5, No. 1, Article 20. Publication date: March 2021.
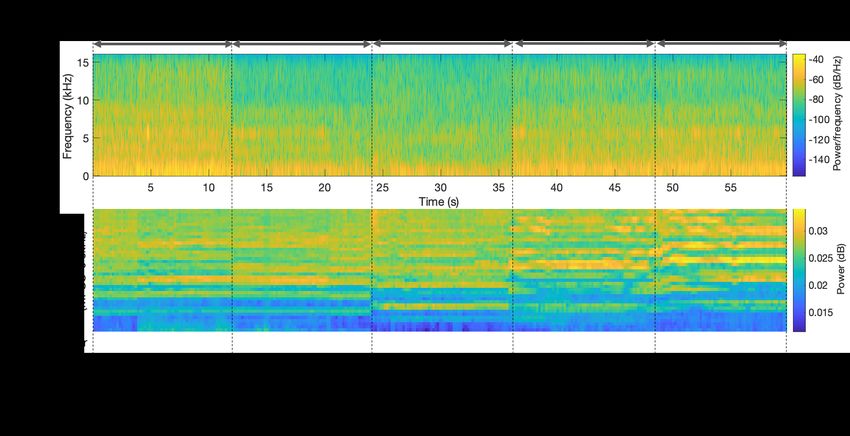
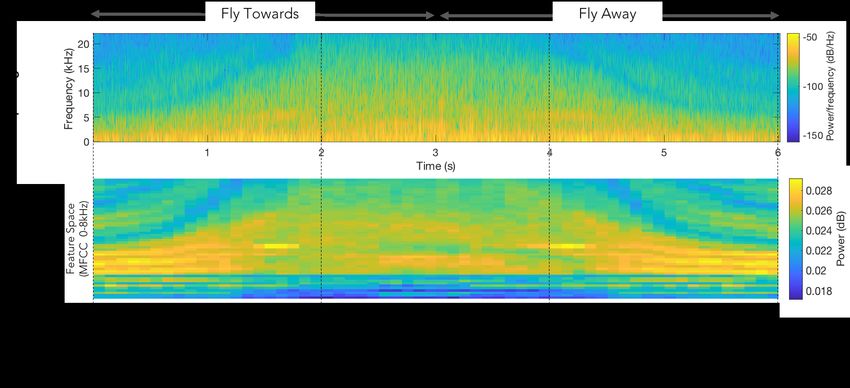
DronePrint: Acoustic Signatures for Open-set Drone Detection and Identification with Online Data • 20:9

 Fig. 2. Power spectrum of a drone (DJI Inspire 1) sound.

contributes to the noise in terms of a whining tone. Nonetheless, its intensity is significantly less compared to
the propeller noise. The propellers and motors transmit vibrations through the arms into the drone frame. This
results in generating the noise due to the mechanical vibration of the drone body [37].
Frequency characteristics of the drone sounds. The spinning of air with multiple propellers results in a
fundamental frequency and its higher-order harmonics in the range of 0-2kHz [74]. This fundamental frequency
is defined by the KV rating of the stepper motors of these drone propellers. KV rating is the ratio of the motor’s
unloaded revolutions per minute (rpm) to the battery voltage. The KV rating multiplied by the drone battery
voltage provides the rpm value, and when this value is divided by 60, that results the fundamental frequency in
Hz. For most of the commercial drones, the fundamental frequency is at the range of 150-400Hz depending on
their motor specifications [37]. The drone body is relatively a small area with many fixed pointsand it vibrates at
a frequency around 3000-4000Hz, and the intensity of this noise may not be prominent for smaller drones [37].
Different models of drones have different KV ratings for the stepper motors that alter the fundamental frequency
and its harmonics. Also, different drone sizes and physical shapes differentiate the body vibration frequency.
These changes are perceived as distinguishable sounds in different drone models.
 Figure 2 shows the power spectrum of the DJI Inspire 1 drone. As can be seen from the figure, the fundamental
frequency of the propellers generated sound is at 136 Hz. Also, the higher peaks after the fundamental frequency
show the harmonic response. The small peak in the frequency plot at approximately 3660Hz is due to the
mechanical vibration of the drone body. This DJI Inspire 1 uses the DJI 3510H motor having the KV rating of
350rpm/V, and has the drone battery voltage of 22.2V [17, 23]. These results in the fundamental frequency at
129.5Hz and its harmonics. However, the frequency response can be slightly deviated specifically due to the
Doppler effect, which is a result of the drone’s movements and the wind. According to the frequency spectrum
in Figure 2, the fundamental frequency of 136Hz has a 5% difference to the calculated fundamental frequency
(129.5Hz). This is a result of the Doppler effect as the drone is flying towards the observer.
 Figure 3 shows the power spectrums of a few other mechanical sounds, and Figure 4 shows the power
spectrums of a few most common natural sounds. All of these sound signals have prominent energy components
in the frequency range where the drone sound is also prominent (0-8kHz). However, we observe that there
are finer level frequency characteristics that all the drone sounds generally have yet not so common among
other mechanical and natural sounds. These prominent features of drones include equally spaced energy peaks
representing the harmonics of a fundamental frequency in the range of 0-2kHz (as the operating rpm of the
motors attached to propellers are different from drones) and a considerable amount of energy in the range of

 Proc. ACM Interact. Mob. Wearable Ubiquitous Technol., Vol. 5, No. 1, Article 20. Publication date: March 2021.
20:10 • Kolamunna et al.

 (a) Airplane (Jet Engine) (b) Helicopter

 (c) Washing Machine (d) Hair Dryer

 Fig. 3. Power spectrum of different mechanical sound.

 (a) Bees Buzzing (b) Birds Sound

 (c) Calm Environment (d) Human Talking

 Fig. 4. Power spectrum of different natural sound.

0-8kHz. None of these other mechanical sounds considered here have these features as the operating rpm of
the motors are different from drones. Also, when compared to the buzzing sound of bees, which is one of the
closest sound to the drone sound, the prominent differences are present in the lower frequencies 200Hz-500Hz
[32]. However, classifying sound by characterizing the power spectrum can lead to ambiguities and may not
guarantee the best performance. On the other hand, features obtained from Mel-Frequency Ceptral Coeffienents
(MFCCs) that models the human auditory perception have proven performance in audio classification. Therefore,
in DronePrint we extract the MFCC features and train neural networks to artificially create the environment of
how a human classifies these sounds.

4 DRONEPRINT SYSTEM
In this section, we present the DronePrint system architecture. The schematic overview of the training and testing
pipeline of DronePrint is illustrated in Figure 5. After pre-processing data, we train classifiers for drone detection,
drone make and model identification. We describe each primary step involved in the remainder of this section.

Proc. ACM Interact. Mob. Wearable Ubiquitous Technol., Vol. 5, No. 1, Article 20. Publication date: March 2021.
DronePrint: Acoustic Signatures for Open-set Drone Detection and Identification with Online Data • 20:11

 (a) Training (b) Testing

 Fig. 5. System Architecture

4.1 Data Augmentation
Even in an environment with minimal noise, the microphone capturing acoustic signals for the same drone type can
vary with different operational conditions, e.g., different manoeuvres; different distances to the microphone; and
hardware modifications such as inserting low noise propellers and carrying additional weight. These differences
are reflected in the power spectrum with frequency alterations and/or different power levels.
 To incorporate the variations of the frequency due to the differences in the drones’ operation conditions in the
DronePrint training, we augment the training and validation samples in DronePrint using frequency warping, a
technique that has shown good results in comparable audio applications [11, 31, 33, 60]. Each acoustic sample of
the training and validation dataset is re-sampled such that = . We selected the value ranging from 0.8 to
1.2 with 0.02 steps. Therefore, each sample goes through the re-sampling process 21 times, which gives 21 fold
increment to the dataset. In general, data augmentation is done with both amplitude scaling (incorporate the
different power levels) and frequency warping techniques [11]. However, in DronePrint, we do not perform the
common practice of augmenting the data with amplitude scaling. Instead, we effectively nullify the amplitude
variations by performing time-domain peak-normalization detailed in Section 4.2.

4.2 Peak Normalization
The various power levels in the samples can be addressed by augmenting the training samples with amplitude
scaling. However, including the whole span of the amplitude differences is impossible and will prohibitively
increase the augmented dataset size. We eliminate the need of having training samples with different time-domain
amplitudes by nullifying this amplitude dependency in the signals with peak normalization. We normalize all
the samples to the maximum amplitude sample within the selected time frame. To the best of our knowledge,
none of the similar types of work has replaced the need for augmenting data using amplitude scaling with
time-domain amplitude-normalization. We select a frame size of 200ms with no overlap. We assume that the
external factors such as distance do not change much within such a short time. Also, we consider no overlap
because frame overlap is majorly important in applications such as speech recognition. In these applications,

 Proc. ACM Interact. Mob. Wearable Ubiquitous Technol., Vol. 5, No. 1, Article 20. Publication date: March 2021.
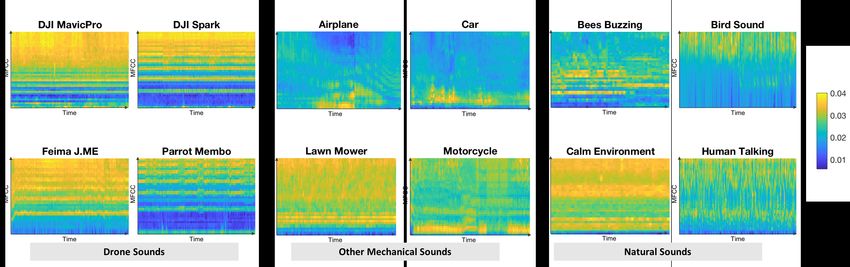
20:12 • Kolamunna et al.

 Fig. 6. Example feature matrices of different sounds

frame shift determines the particularity of information about speech dynamics where the lower the frame shift,
the more details we can retrieve about speech dynamics. In our application of drone sound analysis, we do not
need to analyze the dynamics of the sound, and therefore, uses non-overlapping windows. We perform peak
normalization for each frame. We describe the impact of peak normalization in the features in Section 4.4.

4.3 Feature Extraction
For each frame, we calculated Mel-Frequency Cepstral Coefficients (MFCC) that are commonly used in audio
analysis. As detailed in Section 3.2, the majority of the signal energy for drones remain in the range of 0-8kHz,
and therefore, we focused on 0-8kHz. Specifically, we used the commonly used Mel-scale in audio analysis to
capture the comparatively higher energy in lower frequencies compared to higher frequencies in the range and
calculated 40 MFCC features.
 In Figure 6, we show the calculated MFCC for some drones, other mechanical sounds, and some common
sounds. The prominent differences of drones with other sound are i) periodic high energy levels in specific MFCC
coefficients (as highlighted by horizontal lines), and ii) higher values in higher MFCC coefficients. The horizontal
lines represent the propeller sound that consists of the fundamental frequency and its harmonics (cf. Section 3.2).
Next, the higher values in higher coefficients are results of both the harmonics and also the high energy in higher
frequencies that are generated by the mechanical vibration of the drone body. As shown in Figure 3 and 4, many
of the considered sounds (e.g., airplane, bees buzzing, bird sound, human talking) have prominent energy in the
frequency range of 0-8kHz. However, the calculated MFCCs of drones have the above distinguishable patterns to
them.

4.4 Feature Vector Re-scaling
Figure 7 shows two signal frames that were recorded at a distance of 10m and 50m. In one case, there was minimal
background noise, whereas in the other case there is an instantaneous noise (bird sound). As shown in Figure
7, when there is minimal noise, peak normalization (cf. Section 4.2) brings the time-domain signal frames into
similar/comparable range. To observe the impact of time-domain peak normalization in the feature space, we
calculate the vector of element-wise distances in the two feature vectors of the same class. Each element of
the distances vector is calculated by taking the absolute difference between the elements at a particular index
of the two feature vectors and represented as a percentage to the element in the first feature vector. Then we
calculate the average and the standard deviation of the elements of the distances vector and shown under each

Proc. ACM Interact. Mob. Wearable Ubiquitous Technol., Vol. 5, No. 1, Article 20. Publication date: March 2021.
DronePrint: Acoustic Signatures for Open-set Drone Detection and Identification with Online Data • 20:13

 Fig. 7. Feature vector re-scaling.

feature space in Figure 7. The average element-wise difference indicates how sparse the two feature vectors are.
Higher the average element-wise difference is, more sparse the two feature vectors are. MFCC calculations with
time-domain peak normalization have only 0.14% ± 0.19% distance between the two feature vectors where the
default MFCC has 17.9% ± 1% distance. Therefore, the time-domain peak normalization reduces the difference
between the two feature vectors.
 However, time-domain peak normalization technique will still be problematic when there are instantaneous
and high peak noise such as birds sound is present, since the peak normalization of the frame with high noise
can result in even more significant difference in the feature vectors. We show an example case in Figure 7 where
there is instantaneous noise. In this case, MFCC with time-domain peak normalization provides much a larger
difference as 76.6% ± 16.2% where the default MFCC calculations provide 13.5% ± 3.7%. This is because that the
time-domain peak normalization makes the drone sounds in the two frames more sparse, and therefore, the drone
sound features are less prominent in the feature vector. As a solution, we re-scale the feature vector where we
represent the feature vectors as unit vectors. Unit vector scaling re-scales the cepstral coefficients feature vector
 ′
by dividing by its Euclidean norm, i.e., 2 norm; = /|| ||. Though feature vector re-scaling is generally used for
efficient training of machine learning models, to the best of our knowledge it is not used for a targeted objective
like this in any of the acoustic-based classification models. We observe that when instantaneous noise is present,
the least element-wise distance between feature vectors is given by MFCC with unit vector scaling and without
time-domain peak normalization. However, this is different with minimal noise where the least distance is given
with the time-domain peak normalization. To explain this, next we describe the MFCC calculation procedure and
how the time-domain peak normalization gives adverse effect with instantaneous peaks.
 Assume that the two signals in two different frames are 1 ( ) and 2 ( ) where the first signal is recorded
when the drone is far away than the second signal. With minimal noise conditions, the first signal’s time-domain
amplitude is multiplied by a constant to get the second signal. i.e. 2 ( ) = ∗ 1 ( ). As the first step in
MFCC calculation, the Fast Fourier Transform (FFT) is applied to the time-domain signal and calculate the
frequency spectrum. Since FFT is linear, the frequency domain representations, 1 ( ) and 2 ( ) can be expressed

 Proc. ACM Interact. Mob. Wearable Ubiquitous Technol., Vol. 5, No. 1, Article 20. Publication date: March 2021.
20:14 • Kolamunna et al.

as 2 ( ) = ∗ 1 ( ). In the second step, Mel filterbanks are applied to the frequency spectra and sum the energy
in each filter. Assume these calculated filterbank energy vectors are 1 [ ] and 2 [ ]. The linear relationship
will still be preserved between the energy vectors such that 2 [ ] = ∗ 1 [ ]. The final step of the MFCC
calculation is taking the logarithm of the filterbank energies and take the Discrete Cosine Transform (DCT) to
get the feature vectors. Assume the feature vectors for the two signals are 1 [ ] and 2 [ ]. Although the DCT is
a linear transformation, because of the logarithmic function, the final step of MFCC calculation is not linear as
shown in (1). Since 1 [ ] ≠ ∗ 2 [ ], the unit vector scaling will not nullify the effect of , and the distance
between the vectors is higher with higher values.

 2 [ ] = ( 10 ( 2 [ ])) = ( 10 ( ∗ 1 [ ])) = ( 10 ( ) + 10 ( 1 [ ])) ≠ ∗ 1 [ ] (1)
 Since there is no prominent noise energy in the minimal-noise scenario, the time-domain peak normalization
makes the signal in two frames comparable (minimizes the values), and hence, the distance between the two
feature vectors is minimal. Therefore, performing both time-domain peak normalization and unit vector scaling
when there is minimal or constant and persistent noise provides the minimal distance between the feature vectors.
However, in the example of instantaneous and prominent noise, the time-domain peak normalization makes the
 value higher, and hence, makes the two feature vectors more distant. Therefore, when there is instantaneous
and prominent noise, the sole operation of unit vector scaling provides the minimal distance between the feature
vectors.
 In machine learning algorithms, highly diverse data within a particular class affects the performance and
decreases the ability to make accurate predictions. However, zero diversity among the samples make them
duplicated and duplicated samples in training and validation makes the variance of parameter estimates improperly
small. Therefore, our goal here is to minimize the diversity in the samples, while not producing duplicate samples
with zero diversity.

4.5 Classifier
4.5.1 LSTM Model. We used a Long Short-Term Memory (LSTM) network as our classifier since it has shown
promising results in audio signal classification tasks with both speech [27] and non-speech [10] data as well as
other time-series data [49]. The LSTM architecture we used as illustrated in Figure 8 consists of 10 time steps,
two stacked LSTM layers. We used a hidden state size of 32.
 We trained the model using the Adam optimizer with a learning rate of 0.0001 for 500 epochs. The validation
dataset is used to evaluate the performance of the trained model on that validation dataset at each epoch.
Furthermore, we select the trained model having the lowest validation loss. At the inference time, we average
three predictions of three consecutive windows that cover a total duration of 6 seconds. Then we select the class
having the highest predicted probability. All three classifiers, X, Y, and Z have the same architecture and followed
the same training procedure.
4.5.2 Drone Detection in Open-set Scenarios. Our drone detection classifier (Classifier X ) detects whether the
input acoustic signal is from a ‘Drone’ or ‘Non-Drone’. We used two techniques to design this classifier; Background
Class and Modified OpenMax where we further improved the performance of OpenMax method initially proposed
for image classification in [5]. Under background class, we train a binary classifier that differentiates drone
sounds from non-drone sounds. We used samples from other mechanical sounds such as vehicle sounds in a busy
road, Airplane, Hair dryer; and common non-mechanical sounds such as human voice, Raining sound, and Birds
sound as training samples for the background class.
 However, as the performance of the background class method is restricted by the availability of samples
from non-drone signals at training time, we next explored OpenMax method proposed by Bendale and Boult,

Proc. ACM Interact. Mob. Wearable Ubiquitous Technol., Vol. 5, No. 1, Article 20. Publication date: March 2021.
DronePrint: Acoustic Signatures for Open-set Drone Detection and Identification with Online Data • 20:15

 Softmax
 prediction

 Fully Connected
 Hidden Unit layer
 Size = 32

 LSTM LSTM LSTM …… LSTM

 LSTM LSTM LSTM …… LSTM
 40 MFCC
 features

 ……

 Window size:10 (0.2s x 10 = 2s)

 Fig. 8. LSTM model.

which does not require samples from non-drone signals at the training time [5]. OpenMax is based on the
intuition that the values from the penultimate layer (layer before softmax) of a deep neural network are not
just independent per-class score estimates, but provide a distribution of how classes are related to each other.
Accordingly, OpenMax uses the concept of meta-recognition on the scores from the penultimate layer to estimate
if a given input is far from known training data. Since the classification task we consider here is binary, and
OpenMax does not use open-set data at training time, we used a simple closed-set classifier that classifies 13
drone classes as the underlying deep learning model used by OpenMax.
 At inference time, for each sample, OpenMax will output a vector of + 1 elements which represent the
probabilities of the sample belonging to one of the + 1 classes ( known drone classes and the non-drone class).
At the final step of the original OpenMax model, if the model is confident enough about the prediction; i.e. if
the probability of the predicted class is higher than a predetermined threshold, the prediction from the model is
accepted as it is. If the model is not confident about the prediction and if the probability of the predicted class is
less than the predetermined threshold, the sample is considered to be from an unknown class.
 In order to further improve the performance of the OpenMax method, we assign a separate threshold value for
each known class. The intuition behind this choice is that as the distribution of the output from OpenMax varies
for different drone classes, it is possible for samples for some classes to have relatively high probability values
corresponding to the most probable class while samples from other classes have relatively lower probability
values and hence, having class-wise thresholds that suits the distribution of the probability value for the most
probable class for each class would be more effective. At the inference time, we sum the prediction probabilities
of all the drone classes and consider as the prediction probability of being a drone.
4.5.3 Drone Identification. If a sound is detected as a drone by Classifier X, it is then passed to drone identification
classifiers to identify its make and the model subsequently. First, we use the Classifier Y to identify the drone by
its make, e.g., DJI, Parrot, Autel, Femia, MicroKopter. Next, we use Class-wise Classifiers 1 ,..., for each class of
drone make identified in Classifier Y. These classifiers identify the drone model. All these classifiers in the drone
identification are multi-class classifiers.

 Proc. ACM Interact. Mob. Wearable Ubiquitous Technol., Vol. 5, No. 1, Article 20. Publication date: March 2021.
20:16 • Kolamunna et al.

 Fig. 9. Usage of datasets

 In Figure 9 we show a summarized view of how we use our three datasets to build various classifiers in the
DronePrint pipeline. For instance, the drone detection classifier with the background class is trained and validated
with training and validation data of known drone sounds and background sounds, and tested with testing data of all
three datasets. The drone detection classifier with OpenMax is trained and validated with training and validation
data of known drone sounds, and tested with the testing samples of known drone sounds and unknown sounds.
Finally, drone identification classifier is trained and validated and tested with training, validation and testing data
of known drone sounds.

5 RESULTS AND ANALYSIS
In this section, we present the performance results of DronePrint’s drone detection and identification models. We
also compare the performance of DronePrint with other similar work.

5.1 Evaluation
Drone Detection: We compare DronePrint detection models with three other similar work that use MFCC
for the features and use a background class to enable open-set detection. The implementation details of these
models are shown in Table 4. Machine Learning features used in DronePrint is different from other methods as
we implement MFCC with time-domain peak normalization and feature vector re-scaling where other methods
implement default MFCC. We re-implemented all the models using the given details. We performed two sets of
testing, 1) known classes (closed-set scenario), and 2) unknown classes (open-set scenario). The closed-set scenario
is tested with testing samples of known (DS1), and background (DS2) datasets in background class method, and
testing samples of known (DS1) in OpenMax method. The open-set scenario is tested with testing samples of
unknown (DS3) in both methods of drone detection.
Drone Identification: As detailed in Section 4.5, DronePrint performs the drone identification in two stages;
drone make identification followed by the drone model identification. The 13 drones in our dataset are from five
different drone makes, Autel, DJI, Femia, MikroKopter, and Parrot. As shown in Table 1, DJI and Parrot have six
and four drones, respectively, and other classes have only one drone. Hence, the augmented dataset (cf. Section
4.1) is not balanced for the five classes of drone makes. Therefore, to get a balanced dataset in this stage, we
augmented the training and validation samples of each drone type differently. Specifically, each sample was scaled
differently along in the time axis; 8 times for the 6 drones in DJI ; 12 times for the 4 drones in Parrot; and 48 times

Proc. ACM Interact. Mob. Wearable Ubiquitous Technol., Vol. 5, No. 1, Article 20. Publication date: March 2021.
DronePrint: Acoustic Signatures for Open-set Drone Detection and Identification with Online Data • 20:17

 Table 4. Comparison with related work.

 Details DronePrint Anwar et al. [3] Jeon et al. [34] Al-emadi et al. [1]
 MFCC with time-domain
 peak normalization and MFCC MFCC MFCC
 Features
 feature vector scaling
 0-8kHz (40 Filter-banks) 0-20kHz (13 Filter-banks) 0-1.5kHz (40 Filter-banks) 0-8kHz (40 Filter-banks)
 Not Specified (used 200ms
 Frames 200ms with no overlap 240ms with no overlap 100ms with 10% overlap
 with no overlap)
 LSTM with 2 Layers SVM with Cubic Kernal LSTM with 2 Layers CRNN
 Classifier
 10 time-steps - 1 time-step 101 time-steps

 Accuracy F1-score Accuracy F1-score

 0.98
 0.97

 0.97
 0.96

 0.96
 0.96

 0.96

 0.96
 0.95
 0.94

 1 1

 0.88
 0.86

 0.86
 Accuracy/ F1-Score

 0.85
 Accuracy/F1-Score

 0.76

 0.76
 0.71
 0.69
 0.8 0.8

 0.68
 0.56
 0.6 0.6

 0.4 0.4

 0.2 0.2

 0 0
 DronePrint DronePrint Anwar Jeon Al-emadi DronePrint DronePrint Anwar Jeon Al-emadi
 (Background (Modified et al. et al. et al. (Background (Modified et al. et al. et al.
 Class) OpenMax) Class) OpenMax)

 (a) Known Classes (b) Unknown Classes

 Fig. 10. Performance of Drone Detection Model

for Autel, Feima, and MikroKopter. Also, only a part of the testing data is used from each of the DJI and Parrot
drones to have a balanced testing dataset.
 Next, in the drone model identification, the drone make classes that have two or more drone models are
classified. Therefore, the signals identified as DJI or Parrot are passed to this classification. Two separate models
are trained with the six drone models in DJI, and four drone models in Parrot with the data augmentation detailed
in Section 4.1.
Performance Metrics: We use the two most commonly used performance evaluation metrics in classification
models, Accuracy and F1-score [8]. In the multi-class classification model in drone identification, we treat all
classes equally where we have an equal number of per class samples in training and also in testing. Therefore, we
compute the macro-averages of Accuracy and F1-score. The Accuracy per each class is calculated independently
and then take the average to compute the macro-averages of Accuracy. Therefore, Accuracy in the multi-class
classification is calculated as the sum of the main diagonal elements in the confusion matrix divided by the sum
of all the elements. F1-score is the harmonic mean of the precision and recall varying between the best score
at 1 and worst score at 0. Similar to average accuracy, we compute the macro-average of F1-score using the
macro-averages of precision and recall.

5.2 Drone Detection
Figure 10(a) shows that all models equally performs for known classes, i.e. closed-set scenarios. Accuracy for
all the models is in the range of 94% to %97 and F1-score is in the range of 0.96 to 0.98. However, a drone
detection model is realistic when it can perform better not only with previously seen classes but also with unseen

 Proc. ACM Interact. Mob. Wearable Ubiquitous Technol., Vol. 5, No. 1, Article 20. Publication date: March 2021.
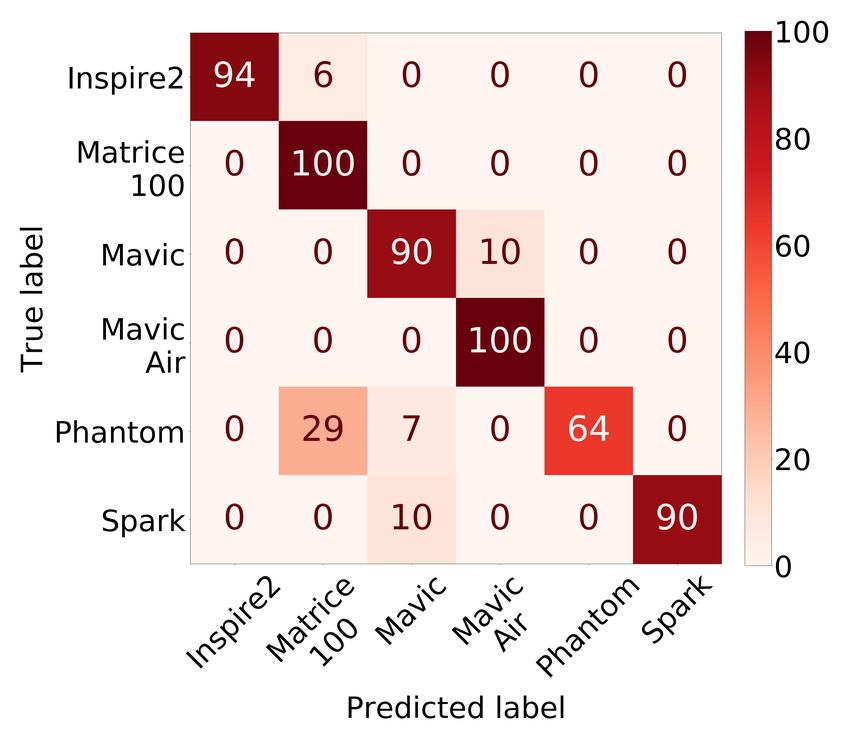
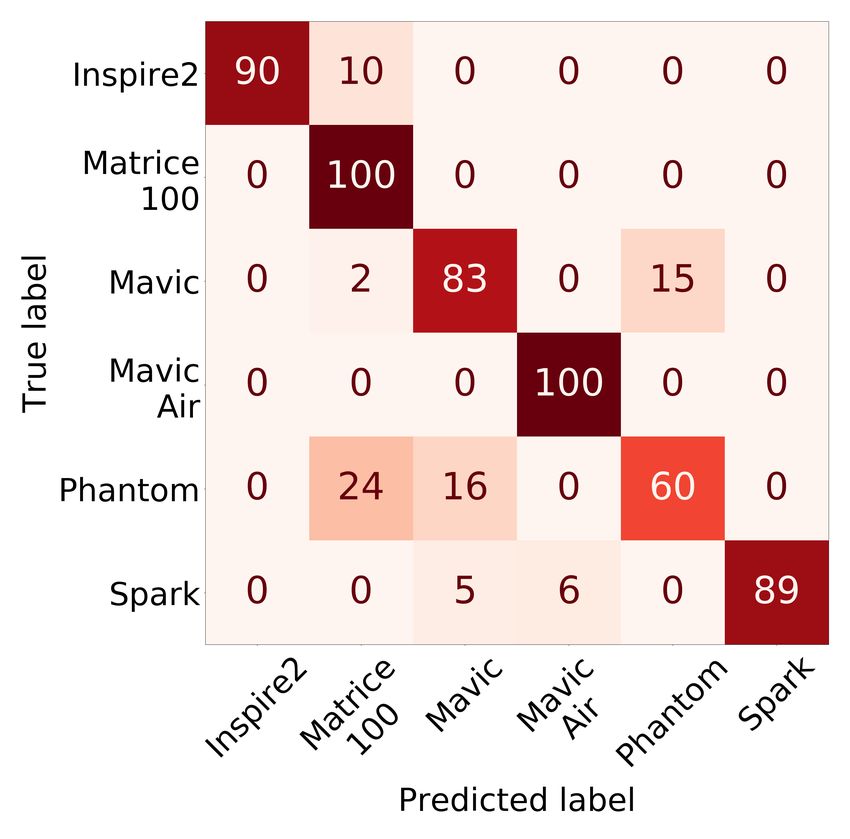
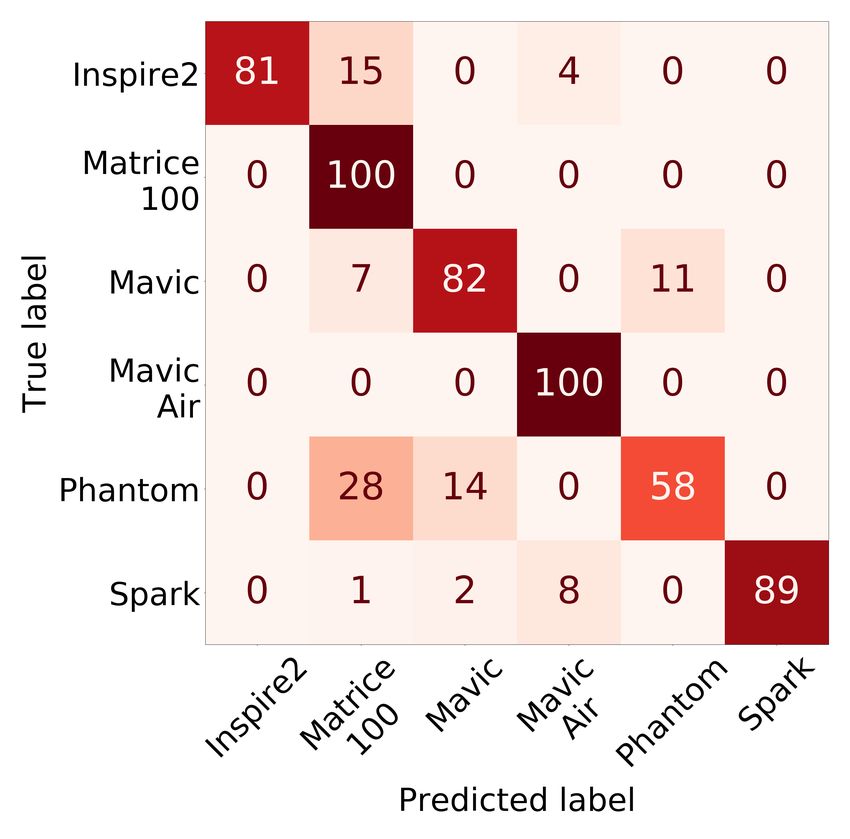
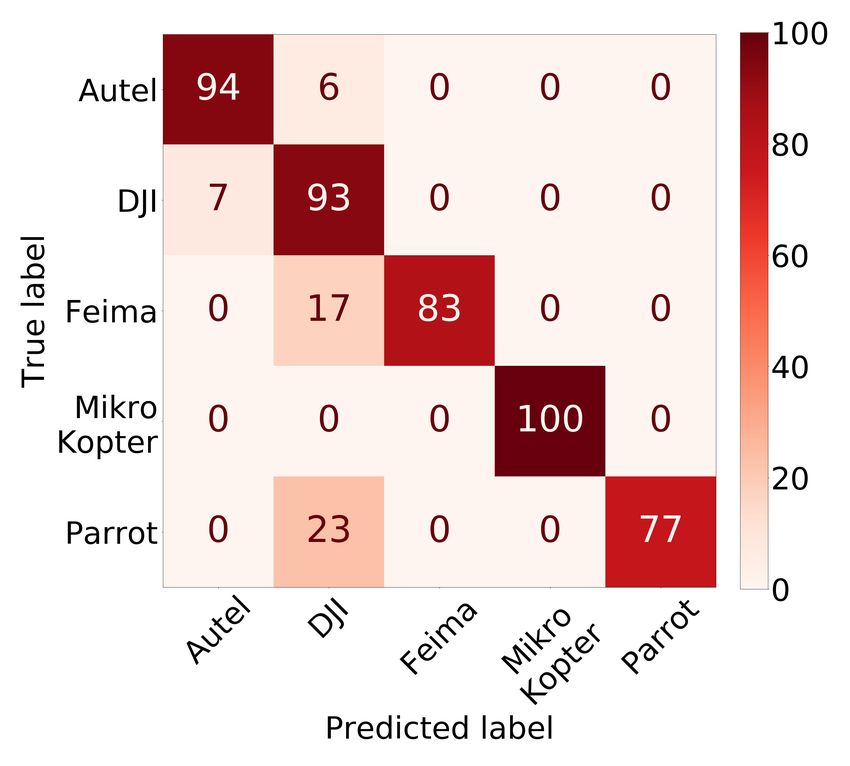
20:18 • Kolamunna et al.

 (a) Classifier Y (b) Classifier Z: DJI (c) Classifier Z: Parrot

 Fig. 11. Confusion Matrices of Drone Identification

classes. Otherwise, the models’ real-world use is limited. Therefore, we evaluate the open-set classification
performance of the models. The two proposed DronePrint models well outperform the related work models in
open-set identification as shown in Figure 10(b). Modified OpenMax method provides marginal improvement
over Background class method with Accuracy of 86% vs 85% respectively and F1-score of 0.88 and 0.86 respectively.
All the models detect the presence of an unknown drone sounds correctly where the recall is high in value.
However, the unknown non-drone sounds are also detected as drone in other methods, and therefore, having
lower Accuracy and F1-score. We observe that the lowest performance is provided by the SVM based method
whereas all the other methods implement LSTM based methods. The detection performance for the known
classes is comparable with the reported results in the respected work [1, 3, 34]. However, the performance for
the unknown classes are reported only in [34], and those results are also comparable to the results we get in
these tests. Overall in the drone detection, DronePrint with modified OpenMax achieves 92% Accuracy and 0.94
F1-score; and DronePrint with Background class achieves 91% Accuracy and 0.93 F1-score. Also, our experimental
results show that the performance of the original method of OpenMax is improved with our modifications in
DronePrint. Specifically, the accuracy is improved by 5% and the F1-score is improved by 0.06.

5.3 Drone Identification
Figure 11(a) shows the confusion matrix of the Classifier Y, i.e. drone make identification. The percentage of
the instances in the class are shown in each row of the confusion matrix. The overall Accuracy is 95%, and
F1-score is 0.95. For each class, more than 90% are in the diagonal in the confusion matrix. We also tested feature
concatenation with combining time-domain (Zero Crossing Rate, Energy, and Entropy of Energy) and spectral
features (Spectral Centroid, Spectral Spread, Spectral Entropy, Spectral Flux, and Spectral Rolloff ). However, despite
the marginal improvements in certain classes, overall accuracy was reduced to 82% and 74% respectively for
temporal and spectral features concatenation.
 Figure 11(b) and 11(c) depict the results of individual drone identification with Classifier Z for two manufacturers.
For DJI, most of the drone models are classified with 100% accuracy, except for Phantom and Spark drone models.
For DJI, the overall Accuracy is 95%, and F1-score is 0.96. On the other hand, all models were correctly identified
for Parrot as shown in Figure 11(c).
 In the cascaded multi-stage drone identification, the performance of classifying a drone as the correct make in
Classifier Y is multiplied by the performance of classifying a drone as the correct model in Classifier Z to get the
final performance of the particular drone model identification. As such, the calculated overall Accuracy is 90%,

Proc. ACM Interact. Mob. Wearable Ubiquitous Technol., Vol. 5, No. 1, Article 20. Publication date: March 2021.
You can also read