An interactive Lifelog Search Engine for LSC2018 - Degree's Thesis Telematics Engineering
←
→
Page content transcription
If your browser does not render page correctly, please read the page content below
An interactive Lifelog Search Engine
               for LSC2018

                   Degree’s Thesis
               Telematics Engineering

                           By:

                    Adrià Alsina Torra

                      Supervised by:

          Cathal Gurrin and Xavier Giró-i-Nieto

        Universitat Politècnica de Catalunya (UPC)
               Dublin City University (DCU)

                        May, 2018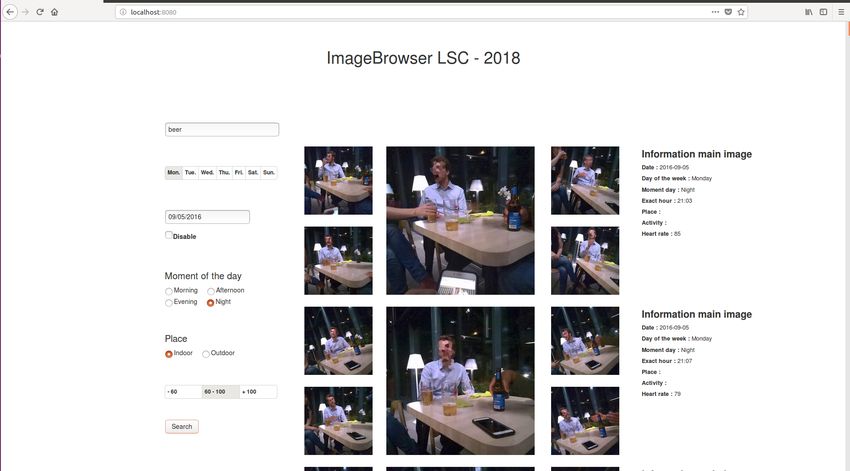
Abstract
   This thesis consists on developing an interactive lifelog search engine for the LSC 2018 search
challenge at ACM ICMR 2018. This search engine is created in order to browse for images from
a given lifelog dataset and display them along with some written information related to them and
four other images providing contextualization about the searched one.

    First of all, the work makes an introduction to the relevance of this project. It introduces the
reader to the main social problems affronted and the aim of our project to deal with them. Thus,
go ahead with the scope of the project introducing to the main objectives fixed. Also, the work
is gone by the actual state of the same kind of prototypes that already exist to let the reader see
the differences that our project presents.

   After the project approach is done, it begins a travel trough the methodology and creation
process, going deep in the main aspects and the explanation of every election and decision, also
remarking the limits of the current prototype.

    Additionally, the project concludes with a result section where the system is tested with six
users. They are asked to find three specific images using the search engine. This test is divided
in two sections: first, a qualitative section where the user is asked to test the system and fill out
a survey to see how comfortable it is for him. And a second section, more quantitative, where
they value the speed of our system.

   Finally, the project concludes going through the actual and future ethics of lifelogging in
general and with a final conclusion further investigation and future improvement.

1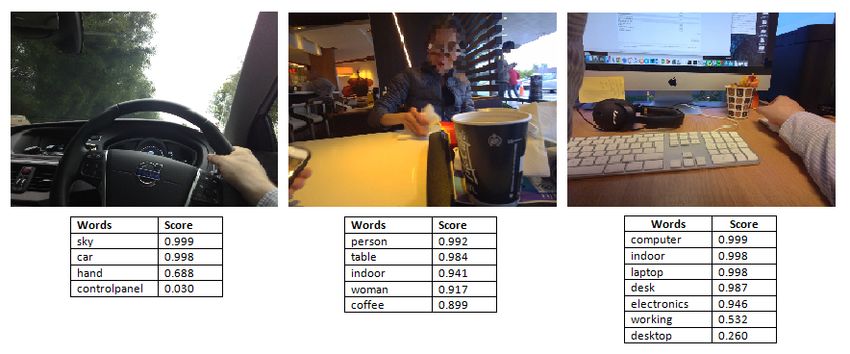
Resum
   Aquesta tesi consisteix a desenvolupar un sistema interactiu de cerca ”lifelogging” per la com-
petició LSC 2018 que té lloc al ACM ICMR 2018. Aquest sistema de cerca ha estat creat per tal
de buscar imatges dins d’una base de dades ”lifelog” donada per tal de ser mostrades juntament
amb informació escrita relacionada amb aquestes. Juntament amb les imatges buscades quatre
imatges més són mostrades per tal d’oferir contextualització sobre la principal.

   Primer de tot, el treball ens introdueix sobre la importància d’aquest projecte. Ho fa introduint-
nos els principals problemes socials i com el projecte pretén afrontar-los. Aixı́, ens presenta l’abast
del projecte plantejant-nos els principals objectius fixats. A part, el treball ens parla sobre l’estat
actual dels sistemes que existeixen actualment, d’aquesta manera permetent a l’usuari veure les
principals novetats que introdueix el projecte.

   A més a més, un cop el plantejament del projecte està fet, comença un viatge a través de la
metodologia i el procés de creació aprofundint en els aspectes principals i la raó de cada elecció
i decisió, sempre remarcant, també, els lı́mits que presenta.

    Addicionalment, el projecte conclou amb la secció de resultats on el sistema és testejat amb
sis usuaris diferents. Aquests són demanats que cerquin tres imatges diferents amb el sistema de
cerca. El test està dividit en dues seccions.

  Una secció qualitativa on els usuaris són preguntats en forma d’enquesta per tal de veure la
comoditat del sistema per ells.

    I una qualitativa, on s’estudia la rapidesa del sistema.

   Finalment, el projecte conclou presentant-nos les ètiques actuals i futures sobre el lifelogging
i una conclusió final a on es subratllen les futures millores.

2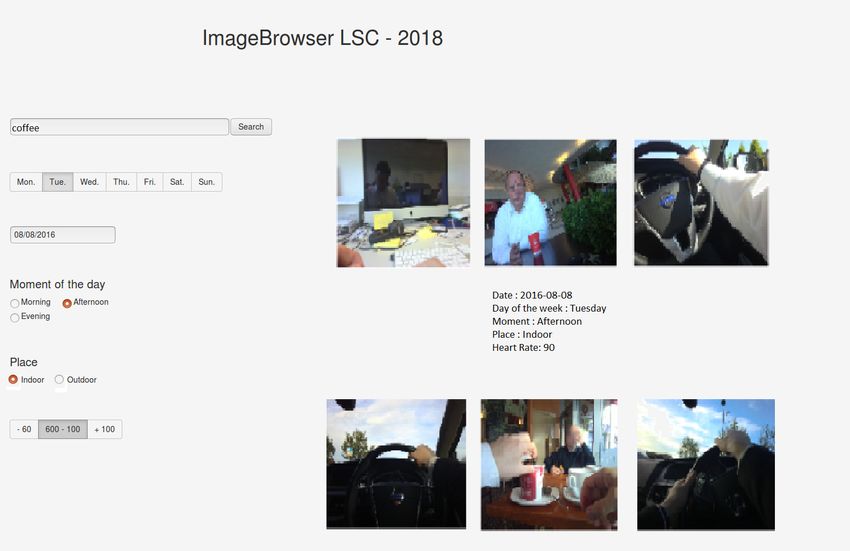
Resumen
   Esta tesis consiste en desarrollar un sistema interactivo de búsqueda ”lifelogging” para la
competición LSC 2018 que tiene lugar en el ACM ICMR 2018. Este sistema de búsqueda ha
sido creado con el fin de buscar imágenes dentro de una base de datos ”lifelog” dada para ser
mostradas junto con información escrita relacionada con estas. Junto con las imágenes buscadas
cuatro imágenes más son mostradas para ofrecer contextualización sobre la principal.

   Primeramente, el trabajo nos introduce sobre la importancia de este proyecto. Lo hace in-
troduciéndonos los principales problemas sociales y como el proyecto pretende afrontarlos. Ası́,
nos presenta el alcance del proyecto planteándonos los principales objetivos fijados. Aparte, el
trabajo nos habla sobre el estado actual de los sistemas que existen actualmente, de esta manera
permitiendo al usuario ver las principales novedades que introduce el proyecto.

   Además, una vez el planteamiento del proyecto está hecho, comienza un viaje a través de la
metodologı́a y el proceso de creación profundizando en los aspectos principales y la razón de cada
elección y decisión, siempre remarcando, también, los lı́mites que presenta .

    Adicionalmente, el proyecto concluye con la sección de resultados donde el sistema es testeado
con seis usuarios diferentes. Estos son pedidos que busquen tres imágenes diferentes con el
sistema de búsqueda. El test está dividido en dos secciones.

  Una sección cualitativa donde los usuarios son preguntados en forma de encuesta para ver la
comodidad del sistema para ellos.

    Y una cualitativa, donde se estudia la rapidez del sistema.

   Finalmente, el proyecto concluye presentándonos las éticas actuales y futuras sobre el lifelog-
ging y una conclusión final en donde se subraya las futuras mejoras.

3
Acknowledgements
   First of all, I would like to express my gratitude to my supervisor, Mr.Cathal Gurrin, whose
guidance, passion, knowledge and assistance in writing papers helped me to succeed with this
project.

   Also, I would like to thank my other supervisor, Mr. Xavier Giró, who represented my link
between Universitat Politècnica de Barcelona and Dublin City University, and also with Cathal,
making possible my collaboration with him in the project and helping me with every problem
that I had during the stay in Dublin.

    Thanks are also due to Ms. Paula Gómez for guide me on the process of building the interface.

    Finally, I would like to express my gratitude to Dublin City University for hosting me and
letting me use their installations and to Science Foundation Ireland for the financial support.

4
Declaration
I declare that this material, which I now submit for assessment, is entirely my own work and
has not been taken from the work of others, save and to the extent that such work has been
cited and acknowledged within the text of my work. I understand that plagiarism, collusion, and
copying are grave and serious offences in the university and accept the penalties that would be
imposed should I engage in plagiarism, collusion or copying. I have read and understood the
Assignment Regulations set out in the module documentation. I have identified and included the
source of all facts, ideas, opinions, and viewpoints of others in the assignment references. Direct
quotations from books, journal articles, internet sources, module text, or any other source what-
soever are acknowledged and the source cited are identified in the assignment references. This
assignment, or any part of it, has not been previously submitted by me or any other person for
assessment on this or any other course of study. I have read and understood the DCU Academic
Integrity and Plagiarism at
https : //www4.dcu.ie/sites/def ault/f iles/policy/1%20%20intgritynplagiarsmvpav3.pdf
and IEEE referencing guidelines found at https : //loop.dcu.ie/mod/url/view.php?id = 448779.
Name: Adrià Alsina Torra Date: May, 2018
5Contents
1 Introduction 10
1.1 Object . . . . . . . . . . . . . . . . . . . . . . . . . . . . . . . . . . . . . . . . 10
1.2 Scope . . . . . . . . . . . . . . . . . . . . . . . . . . . . . . . . . . . . . . . . 11
1.3 Methods and procedures . . . . . . . . . . . . . . . . . . . . . . . . . . . . . . 11
2 State of the art and context 13
2.1 Lifelogging . . . . . . . . . . . . . . . . . . . . . . . . . . . . . . . . . . . . . . 13
2.2 ACM ICMR AND LSC 2018 . . . . . . . . . . . . . . . . . . . . . . . . . . . . 14
2.2.1 ACM ICMR . . . . . . . . . . . . . . . . . . . . . . . . . . . . . . . . . 14
2.2.2 LSC 2018 . . . . . . . . . . . . . . . . . . . . . . . . . . . . . . . . . . 15
2.3 Interactive retrieval engine . . . . . . . . . . . . . . . . . . . . . . . . . . . . . 16
3 Approach to a search engine 17
4 Methodology 18
4.1 The Back-End . . . . . . . . . . . . . . . . . . . . . . . . . . . . . . . . . . . . 18
4.1.1 LSC 2018 Dataset . . . . . . . . . . . . . . . . . . . . . . . . . . . . . . 18
4.1.2 Data Selection and Enrichment . . . . . . . . . . . . . . . . . . . . . . . 19
4.1.3 Database . . . . . . . . . . . . . . . . . . . . . . . . . . . . . . . . . . . 20
4.1.4 Flask as an intermediate server . . . . . . . . . . . . . . . . . . . . . . . 22
4.1.4.1 The queries . . . . . . . . . . . . . . . . . . . . . . . . . . . . 23
4.1.5 Ranking Engine . . . . . . . . . . . . . . . . . . . . . . . . . . . . . . . 25
4.2 The Front-End . . . . . . . . . . . . . . . . . . . . . . . . . . . . . . . . . . . . 26
4.2.1 React JS - Multi-Faceted Query Interface . . . . . . . . . . . . . . . . . 26
5 Results 29
5.1 Qualitatively - UI feedback . . . . . . . . . . . . . . . . . . . . . . . . . . . . . 29
65.2 Quantitative - Search Speed . . . . . . . . . . . . . . . . . . . . . . . . . . . . 31
5.3 Goals achieved . . . . . . . . . . . . . . . . . . . . . . . . . . . . . . . . . . . . 32
6 Budget 33
7 Ethics 34
8 Conclusions 35
A Using the System in the competition 38
B Paper for LSC 2018 39
7List of Figures
2.1 Evolution of wearable cameras. . . . . . . . . . . . . . . . . . . . . . . . . . . . 13
4.1 Common images from the dataset with its conceptual data. . . . . . . . . . . . 19
4.2 Database schema. . . . . . . . . . . . . . . . . . . . . . . . . . . . . . . . . . . 21
4.3 Net design
. . . . . . . . . . . . . . . . . . . . . . . . . . . . . . . . . . . . . . . . . . . . 22
4.4 User Interface design.
. . . . . . . . . . . . . . . . . . . . . . . . . . . . . . . . . . . . . . . . . . . . 28
5.1 Images selected for the test. . . . . . . . . . . . . . . . . . . . . . . . . . . . . 29
5.2 Average results of the quantitative test done with the users. . . . . . . . . . . . 31
5.3 Comparative graph between time spend and number of images displayed. . . . . 32
8List of Tables
4.1 Relationship between the moment of the day and the hour range. . . . . . . . . 20
5.1 Questionnaire with the average feedback of the users. . . . . . . . . . . . . . . . 30
6.1 Budget of the project . . . . . . . . . . . . . . . . . . . . . . . . . . . . . . . . 33
9Chapter 1
Introduction
1.1 Object
Searching for a specific music on iTunes to a movie on Netflix or even a gift on Amazon.
Searching, browsing and retrieving multimedia from a large database are the challenges that
billions of people face everyday. It is possible for the users to find the particular information they
are looking for with just by entering a text description or tag.
The same happens with the images. Early systems [22] relied on image metadata such as a
set of keywords or tags, or textual descriptions of the image content. That’s why, as if it were
text, people can search also for specific images by entering textual queries.
The problem appears when there is no metadata, tags or textual descriptions associated with
the images. Then, the retrieve of images becomes a task impossible to do in an automatic way.
This means that the only way to search for an image automatically is analyzing the content of
every image.
For obtaining these descriptors, computer vision algorithms are used. This algorithms obtain
textual data summarizing the content of an image to a numerical vector called image representa-
tion. Also, retrieving images for the conceptual things and not for its metadata, tags or textual
descriptions avoid the problem of having subjective descriptions and also having to manually
generate them.
The aim of the project deals with these needs. The main objective is to create an inter-
active lifelog search engine developed for the LSC 2018 search challenge at ACM ICMR 2018.
Specifically, the search engine has to be optimized to combine the retrieve of images since the
conceptual words obtained from this computer vision algorithms, with the retrieve of information
about external aspects associated with these images obtained from sources other than images.
Studies by Petrelli and Whittaker[17] in 2010 of digital family memorabilia (such as photos,
videos,scanned images, and email) showed that digital archives are rarely accessed. In the same
study,[25] people was asked to select the objects mnemonic significance in their homes within
large collections of digital past recorded data. Less than 2 percent of the objects they reported
were digital. Other work has found that users with large amounts of digital photos never access
to the majority of them.[28]
While this lack of interest in digital data doesn’t imply that all digital archives have little value,
it raises questions about their utility in reminding or reviewing the past[25]. Some researchers
have argued that this is a simple lack of new access tools (such as desktop search) that could
facilitate exploitation of digital archives and lifelog.[21]
Thus, this project was faced with important challenges related with social aspects. So, the
design of a good User Interface means that a good operation of it has to go together with a user
10friendly system.
This studies helped establishing the main goals:
• Understand the image retrieval problem and study the wide range of research on it.
• Design and build a User Interface, with all the functionalities needed, that interacts with a
server.
• Select the useful information and build a database where the User Interface can make
queries and search for information.
• Create an intermediate server that works as a link between the User Interface and the
database server.
• Evaluate the system with some users and think about possible improvements.
1.2 Scope
This project has been done with some specifications given by LSC 2018.
LSC 2018 provided a dataset that consists of a wide array of multimodal data of an individual’s
life experience captured via wearable and software sensors. This dataset, formed by images and
written data, represents the baseline of the project, coulding be totally or partially used or even
enlarged. With this given data we can establish the main requirements that the search engine
have to satisfy:
• Create this User Interface as a web-page form.
• Find and implement the best way to let the user introduce the queries in an easy way.
• Be able to display the correct images that correspond with user’s search in an easy way to
understand.
• Contextualize the images also displaying two previous and post images, and textual infor-
mation.
• Let the user select the searched images which submits to the LSC server for validation.
1.3 Methods and procedures
This project arises as a collaboration opportunity with The Insight Center for Data Analytics
in DCU. The idea came up from Cathal Gurrin, the supervisor from this center, and LSC 2018
workshop.
Therefore, the built interface will merge knowledge of lifelogging, ergo working with a big
amount of data, with web programming. Given any user’s request the system produces a list of
images and contextual text that are relevant to the query, ordered by a score1 .
1
See 4.1.5 for more information about the score algorithm.
11On one side, the proposed system has to implement a quick database server, that lets make
full text search [26]. MySQL was choose for this task.
On the other side, the UI system is developed with JavaScript code in ReactJS. Interacting
with a Python server in Flask that works as a intermediate-server in which the retrieval engine is
incorporated.
12Chapter 2
State of the art and context
2.1 Lifelogging
Lifelogging is a new concept and has only recently attracted the attention of the research
community [12]. One standard definition of lifelogging states that it is ”the action or practice
of making a continuous record of one’s daily activities by means of a digital device or computer
application”.
One of the first lifeoggers known was Robert Shields, who recorded in a written diary during
25 years – between 1972 and 1997 – his everyday life in intervals of 5 minutes, what actually
means a diary of 37,5 million words. Fortunately, in recent years the data is usually captured
automatically by wearable technology or mobile devices, but it was not till 1994 that appeared
the first person to do it.
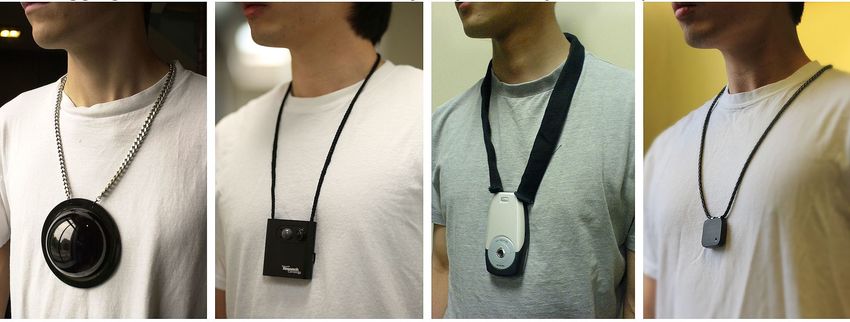
It was Steve Mann who started recording all this data with live first-person video, using the
wearable camera that you can see left in the Figure 2.1.
Nowadays, the growing research interest in lifelogging has been facilitated by the market-availability
of a range of lifelogging and quantified self devices that can digitally capture a wide range of life
activities, from more sophisticated wearable cameras for all-of-lifelogging to the more targeted
health and wellness devices commonly referred to as quantified self devices [14]. Coming with
these changes we can find Gordon Bell who represents an important icon in lifelogging community.
Figure 2.1: Evolution of wearable cameras.
With such a range of lifelogging devices, one can easily gather, in an automated manner, a wide
range of data about the life experience of the individual, such as image data from smartphones
or wearable cameras, audio recordings, location data or biometric data, to name only a few.
Like any activity, lifelogging has different stages. Gurrin et al. [9] identified five stages in
lifelogging: capture, storage, processing, access and publication.
• Capture: In this stage, the lifelogging device captures lifelogs in an automatic and con-
13tinuous fashion. The captured lifelogs are temporarily stored at the internal storage of the
device.
• Storage: Captured lifelogs from the device are either stored in a computer storage or
uploaded to a cloud storage. Stored lifelogs remain in the storage medium in a potential
permanent state until they are discarded.
• Processing: After stored, in case of images, lifelogs are analyzed using image processing
algorithms for extracting inner semantics which then can be used for temporal–spatial
clustering, event segmentation and object/people detection and recognition. In other cases,
when the information is less complex, like when the information is originating from health
devices, this step is omitted.
• Access: The lifelogger has the ability to access the captured and analysed lifelogs using
a User Interface (UI). The UI generally organizes the processed lifelogs in order to present
them in a meaningful way. For example, the UI can display the lifelogs based on spatio-
temporal attributes or for similar content using advanced visualization mechanisms. [3, 2].
• Publication: In this last step, either the lifelogger shares or delegates the task to another
person to share her lifelogs with other people.
Also, Gurrin et al. identifies four different actors in the process of lifelogging, specially when are
used wearable cameras [9].
• The Lifelogger: A lifelogger is the entity which utilises a lifelogging device to capture and
store lifelogs. Normally, it is assumed that a lifelogger is a person, even though it is find
debates that also consider inanimate objects such as a robotic device as lifeloggers [11].
• The Bystander: A bystander is any person who is captured (intentionally, incidentally
or accidentally) in a lifelog of a different person. The particular thing is that theres no
interaction with the bystander. Examples of bystanders are strangers in an environment,
family members, friends, colleagues, etc.
• The Subject: A subject is any person who is captured (intentionally or incidentally) in a
lifelog of the lifelogger during their interaction.
• The Host: It is the entity which bears the responsibility of storing a lifelog of the lifelogger.
It can be the same lifelogger, when the lifelog is stored in a hard disk or local setting. Or
an external entity like a could, if the lifelog is stored in a remote cloud.
2.2 ACM ICMR AND LSC 2018
2.2.1 ACM ICMR
Setting up in 2011 on the Italian city Trento and celebrating this year their 7th edition in
Yokohama (Japan), according to the Chinese Computing Federation Conference Ranking, ACM
ICMR has become the premier scientific conference for multimedia retrieval worldwide and the
fourth highest conference worldwide in the wide area of multimedia and graphics.
14It was created with the mission to display scientific achievements and innovative industrial prod-
ucts in the field of multimedia retrieval by bringing together researchers and practitioners.
The different sessions encourage the discussion related with the current state of the art, directions
for the future, large-scale media evaluations, and demonstrations of current technology.
The main objectives of ICMR are the following:
1. To provide a setting for the presentation and discussion of high-quality original research
papers in all aspects of multimedia retrieval.
2. To provide a forum for the exchange of ideas between researchers and practitioners in the
field.
3. To provide a range of complementary events such as panel sessions, exhibitions, workshops,
and large-scale media evaluations.
4. To provide suitable facilities for informal networking and exchange of ideas between dele-
gates.
2.2.2 LSC 2018
For the first time, the annual ACM ICMR 2018 conference is organizing a participation work-
shop called Lifelog Search Challenge (LSC). LSC is born with the intention to become an annual
live lifelog search competition, where international researchers evaluate and demonstrate their
multimodal interactive lifelog search engine on a shared dataset in front of an audience.
In order to participate, the competitors must prepare a scientific paper (Annex B) that de-
scribes their interactive search engine and how it operates. From all the papers presented LSC
uses a review process to select the ones who finally participate in the workshop.
As a primordial part of the competition, each team has to build an exploratory multimedia search
tool that allows for retrieval, interactive browsing, exploration, or navigation in a multimedia
without any restriction in terms of the allowed features.
For building this lifelog search engine LSC provides a dataset1 that consists of wide array of
multimodal data of an individual’s life experience captured during one month via wearable and
software sensors.
All these previous work ends at the day of the workshop. The format of the workshop is
divided in two parts:
• The first part consists in an oral presentation of each team about the approaches taken to
develop their interactive lifelog search system.
• After, every participating group takes part in a real-time search competition in which teams
compete to solve fifteen known-item search tasks in the shortest time possible. Every search
done for every teams search engine is updated to a server and qualified with a score. At
the end the team with the highest score is the one who wins the competition.
1
For a full explanation of the dataset look section 4.1.1.
152.3 Interactive retrieval engine
Without there having been similar tasks in the past, there are not many interactive retrieval
engines that were developed for lifelog data previously.
The seminal MyLifeBits [8] project at Microsoft, architect and created by Jim Gemmell of
Microsoft Research and Roger Lueder also developed a lifelog retrieval engine based on an under-
lying database system, which is generally regarded as the first lifelog retrieval system. This uses
Gordon Bell’s2 document archive as well as his current activities as a vehicle for the research,
the documents represents a large amount of data originating from articles, books, music, photos,
and video as well as everything office documents, email, digital photos or even later was included
information from particular applications related with health and wellness. It has at its heart a SQL
Server database that can store content and metadata for a variety of types including contacts,
documents, email, events, photos, songs, and videos.
The LEMoRe [5], an interactive lifelog retrieval engine, developed in the context of the Lifelog
Semantic Access Task (LSAT) of the the NTCIR-12 challenge [10]. LEMoRe integrated classical
image descriptors with high-level semantic concepts extracted by Convolutional Neural Networks
[23], powered by a graphical user interface that uses natural language processing to process a
user’s query, using a SQL server ordered by its time, date and user.
Finally, Doherty et al. [6], developed an interactive event-driven lifelog browser for visual lifelog
data that segmented days into events, based on analysis of visual and sensor data, organizing and
linking events together in a single diary-style interface. Extending this work, an interactive faceted
lifelog search engine[7] was developed that allowed the user to select a number of contextual
factors in order to find an event of interest from an archive that spanned a number of years.
Building on experiences from this past work, is developed the experimental search engine
which forms the main contribution of this project.
2
https://gordonbell.azurewebsites.net/
16Chapter 3
Approach to a search engine
A search engine is defined as a ”program that searches for and identifies items in a database
that correspond to keywords or characters specified by the user”.
Before building a search engine is needed to make an approach, considering some questions and
trying to respond them:
• How often must be update the data? The database is the one fixed by LSC. This data
can be increased or used partially in the beginning but once the system is done no one can
increase it .
• What must it search, in what context? It has to search for the lifelog data provided
for LSC 2018. From this dataset a database with different kind of data related with some
images and also to information of the user at the moment the image was taken is done.
• How much data must it search? The database is formed by information about more or
less 40,500 images divided in ten different fields. It means more than 405,000 cells with
different information.
• Would it like search to work offline? There are two server environments to choose
from: local and remote. A local server is hosted locally on an own computer while a
remote server is hosted elsewhere. The system is devised for working in the localhost so
the server is hosted locally, it means that can work without Internet connection, letting be
a quick Desktop Browser.
Also a good search engine must display the information ordered by its importance, the doc-
uments that match more with the queries have to appear before the once that match less with
the queries. Thus, the responses of the queries have to be ranked.
This pre-established appearance makes that the search engines must have implemented full text
search.
Full text search is the technique for examine all the fields of the database and search for a specific
word or a collection in order to find the most relevant documents. The results are ranked by its
relevance.
For working good this full text search needs some flexible functionality to find relevant results.
The most important are:
• Stemming: Is the process of reducing inflected words to their word stem. So for fisher it
matches results like fish, fishing or fished.
• Stopword handing: Search engines need to avoid irrelevant results caused by matching
common words such as a and the.
Also a good search engine interface should provide additional features on the input side like
autocomplete or autosuggested as the main once.
The image browser doesn’t accomplish with all these things. It can support stopwords but not
stemmer while it doesn’t support autocomplete or autosuggested.
17Chapter 4
Methodology
4.1 The Back-End
The back-end, or the ”server-side”, is basically how the site works, updates and changes. This
refers to everything the user can’t see in the browser, like databases and servers 1 .
Lifelogging involves multiple sensors and generates a big amount of data. LSC provides this
dataset obtained from a lifelogger that represents the baseline of the project.
For working with all this is needed to store it to a database. To create a useful database its needed
to divide the task in different steps. Firstly, must be understand and later selected, enriched and
stored.
4.1.1 LSC 2018 Dataset
The LSC lifelog dataset consists of a wide array of multimodal data of an individual’s life
experience captured via wearable and software sensors. The dataset was gathered over a period
of 27 days by a single individual and it includes:
• Multimedia data: There are more or less one or more images of every minute 27 days
user life stored. It represents about 1,500 images per day taken by a wearable camera. So,
if there are 27 days of data it means that the database is about 40,500 images. These are
Point of View (PoV) images and with them can be interpreted the different actions the
lifelogger was doing those days. These images are accompanied by the output of a concept
detector, created with Computer Vision algorithms, which identifies the dominant visual
concepts in every image with their score. This images are previous annonymised pixelating
the subjects or the bystanders face and also important information like personal messages
from the mobile phone. In addition, is included a music listening history of the lifelogger
with the exact moment that the lifelogger was listening each music.
1
https://www.pluralsight.com/blog/film-games/whats-difference-front-end-back-end
18Figure 4.1: Common images from the dataset with its conceptual data.
• Biometric data: It is formed for biometric data like heart rate, galvanic skin response,
calorie burn and steps stored almost every minute of the day. Also there are some data
about blood pressure and blood sugar daily.
• Human activity data: Consists of information about the semantic locations visited, the
physical activities, the daily mood and a diet log made of manual logging of photos.
• Computer Usage: Represents a vector of every minute stored data filtered using blacklists,
anonymity and then stemmed.
4.1.2 Data Selection and Enrichment
Working with a big amount of data can be useless sometimes. As bigger is the database as
slower will be the system. For this reason is important to from all the data given select the useful
one. This is the first step, and for doing it is needed to be clear about how the search interface
is and which kind of queries the user wants to do. This made select some data.
On one hand, from multimedia data, working with the images is selected. The images represent
the engine of the browser and the final result displayed to the user. In order to let the search
engine understands the images is important to provide it the conceptual information of every
image.
On the other hand, the music listening history is discarded considering as useless information due
to the fact that there are few stored information about that.
Because the search engine is not only created to select images for its content if not also for
what represents each image in lifelogger’s life it works with this other kind of information.
About biometric data to work with heart rate is selected because is what gives more information
about the lifelogger. Depending on the heart rate can be deduced if the lifeloger was resting,
doing a normal activity or being physically active.
Finally, it’s useful to know where or what the user was doing at the moment the image was
taken for this reason it works with the location and the physical activity of the lifelogger at the
19moment the picture was taken. For the activity there are words like driving, walking or transport.
Also, some new data is created from the given once.
The system lets the user make queries for the exact day of the week or the exact moment of the
day. So, from the different dates given is created a small program in Matlab to change the dates
to the exact day of the week, like Monday, Tuesday. . .
Also with the same program the exact hour and minute was exchanged to the exact moment of
the day (Morning, Afternoon, Evening, Night) taking into count the following table 4.1.
Moment of the day Hour range
Morning 5 am - 11:59 am
Afternoon 12 pm - 5 pm
Evening 5:01 pm - 9 pm
Night 9:01 pm - 4:59 am
Table 4.1: Relationship between the moment of the day and the hour range.
4.1.3 Database
Is important to store all this data to a high performance server-side database that lets the
user make queries in an easy way. The election of the database is very important; here is where
the system has to make the queries. This is the engine of our browser.
For that is divide the database in two parts.
First of all ,it is used a MySQL server-side database. MySQL is an open-source relational
database management system that now a days is used by many of the best organizations like
Facebook, Google or Adobe.
For this system is also the best option for working due to its easy-use, free server system, fast
speed and consistent data structures.
Also MySQL is very scalable, thing that lets increase the database for a possible future.
Even so, the main fact to use MySQL is that supports in an easy way full text search2 .
In this database is needed to store information about exactly 40679 images from the dataset.
This information is divided in ten different fields. These fields are created due to the information
that is stored is useful to display or to make queries. The fields are the following once:
• path: Where the path of the image is stored. This is what the database returns after the
user makes the query to allow the interface display the search image.
• date: The date when the image was taken in YYYY-MM-DD format. Is needed to display
in the interface in the information-of-the-image box.
2
Look Chapter 3 for more information about it.
20• hour: The hour when the image was taken in digital format HH:MM. Like the date is
displayed in the information-of-the-image box.
• moment: Stores the information previously created related with the moment of the day
when the image was taken.
• place: Stores the information about the place where the user was in the moment of the
image. Not always there is information about that.
• activity: Related with the activity the user was doing. The kind of words stored here are
walking or transport to name just a few.
• heart rate: Storing the heart rate of the lifelogger. It is also important because it is
displayed in the information-of-the-image box.
• h levels: The heart rate data is segmented into three categories; resting (for heart rate
levels from 0 to less than 60), normal (between 60 and 100 bpm), and physically active
(more than 100). This field is needed for searching in the database from the queries done
in the interface.
• words: All the conceptual word related with the images are stored here. This field is only
used to match the conceptual queries with the correct image.
Firstly, this database was design just creating 40679 rows representing every image and 10
columns representing each field. However, inspirited in LEMoRe work and taking some ideas from
there, the design from the following schema 4.2 has been implement. This schema is created
in relation with the queries that the user can introduce to the UI. In comparison with the first
schema the second one is designed splitting the database in five different tables letting make
more precise queries, an create a more fast search engine. These tables are grouped taking into
account the relation of the fields and the kind of queries that the UI lets to introduce.
Figure 4.2: Database schema.
Also this new schema, lets reduce the number of rows in some fields, that in the beginning
were storing empty cells.
Probably the most difficult thing to store are the images. The images represent a big amount
of data and storing them in the database would increase a lot the size of the database fact that
decrease the speed of the system.
Thus, the best solution for the management of the images seems to be to store the images into
an intermediate server.
214.1.4 Flask as an intermediate server
This intermediate server is created with Flask.
Flask is a micro web framework written in Python, initially released in 2010. It is classified as
a microframework because it does not require particular tools or libraries. It has no database ab-
straction layer, form validation, or any other components where pre-existing third-party libraries
provide common functions. However, Flask supports extensions that can add application features
as if they were implemented in Flask itself.
For its easy started and good performance Flask is becoming very popular. Actually, some well
known applications like Pinterest or LinkedIn are using it.
Flask is also used because works with Python language. Python is a high-level and dynamic
programming language that focuses on code readability. It is characterized by improving pro-
grammer’s productivity.
This server is placed between the UI and MySQL server as in Figure4.3 working together with
the UI in localhost but in different ports. This lets use this intermediate server in two different
ways.
On one hand, this server is used for making the queries to the database. Working with Flask
lets use the Python library MySQLdb that allows interacting with MySQL in an easy way. The
normal PHP queries3 can be made thanks to that library.
Figure 4.3: Net design
This queries have to be made in order to obtain the paths of the images that satisfy the needs
of the user. Thus, the intermediate server has to receive the queries introduced from the UI and
translate them to make the proper queries to the database.
Because the UI also display the images from the previous and following actions the server creates
not only one query if not three different ones.
Finally, it has to return the different paths and data from the searched images.
On the other hand, as introduce before is where the images are stored letting decrease the
size of the database. Thus, the path that the server is sending to the UI is also pointing this
server.
3
To know about the queries see4.1.4.1
224.1.4.1 The queries
The main query is split in different part. In these two parts the queries are divided in two
types. One type is applied in the fixed search filter options and another type in the free-text
search bar.
For the fixed search filter options are applied simple SQL queries. This queries consists in an
easy structure.
SELECT col name FROM tbl name WHERE col name = ’search parm’;
This kind of queries will return just the id of the images from the ones that match with the
search word. Thus, because each query just can search inside one table is needed to ideate an
ingenious search structure.
The search operates like an inverse funnel. First it searches for the more diverse information,
that makes start the search for the narrow part of the funnel, making discard the search in a lot
of cells. This is why searches in the Date t table firstly. Then it searches in to the M oment t
table due to it is splits in four types(Morning, Afternoon, Evening and Night), followed by the
Heart t that just has three types (low, normal ,high) and represents the less diverse information.
In the case that not all the possible inputs are introduce and the user just wants to search
for the moment, for example, the first search step is omitted and searches directly in the second
table, in other words that is the M oment t. Also the third step search is omitted.
But if all the inputs of the UI are introduced it works like a chain. The first step search returns
the id’s of the images that satisfy the queries and this id’s together with the moment input origin
from the UI are introduced to the second query. This last step is also reproduce in the third
search but with the heart level information.
From these searches is obtained a vector with just the ids of the images that satisfy the whole
queries.
Input: date, moment, heart level
if date then
| Search for images that satisfy date and return ids vector.
if moment then
| Search for images that satisfy moment and update the ids vector.
if heartlevel then
| Search for images that satisfy heartlevel and update the ids vector.
However for the free text search bar is implemented Full Text Search. To this second queries is
passed the ids vector obtained from the queries made before.
Using Full Text Search to the queries needs the proper way to do it.
23Starting off the queries can only be made with CHAR, VARCHAR and TEXT columns. There
are three types of Full Text Search that can be used with MySQL.
• Natural Language Mode: The natural language search interprets the search string as a
phrase in natural human language. This mode implements standard enhancements, such
as stopword removal.
• Boolean Mode: Interprets the search using special query language. The queries are made
using the words to search but also can contain operators that specify requirements such that
a word must be present or absent in matching rows.This mode also implements stopword
removal.
• With Query Expansion: Is a modification of a natural language search. The search is
used performing a natural language search. Later the words from the most relevant rows
returned by the search are added to the search string and the search is done again. The
final query returns the rows from the second search.
In the project case working with Natural Language Mode is selected.
Working with Query Expansion was the first idea. It seems to be a very useful and smart way to
work. However it was discarded for this project.
Query Expansion is more thought for searching inside text with its own context. For example, if
the user searches for database using this mode can search also for ”MySQL” or ”Oracle”, if the
text talks about these two types of databases.
In the case of this project sometimes the words are not related between them. This fact created
that the queries where almost the same as using Natural Language Mode. Thus, as Natural
Language Mode works faster the first option it was discarded.
The main query structure used for doing Natural Language Queries is the following one:
SELECT col name to reurn, MATCH(col name search) AGAINST (’words to search’) as
score FROM table name WHERE MATCH(col name search) AGAINST(’words to search’) >
0 ORDER BY score DESC;
This query structure is more complex and lets make more relevant searches filtering by the
relevance score of the result. The relevance score4 quantifies how good of a match it is for the
search term, where 0 is not relevant at all.
First of all, the MATCH() portion of the command specifies which section of columns are
indexed using Full Text Search. The AGAINST() portion specifies which word are performing
a Full Text Search. asscore portion labels the last column of the output as score. From these
scores thanks to the last portion shows only rows with nonzero relevance scores. And finally, with
the last portion ORDER BY score DESC sorts the results by relevance from the most relevant to
the less.
Therefore, if two words are introduce in the search bar. The query looks for both in the database.
If one image has both words it has the highest score but if has just one it has also a score so it
appears in the final paths vector. Only the paths that has no one of the words doesn’t appear in
the final result.
4
The score algorithm is explained in4.1.5
24Thus, at the end is obtained a final vector with the path of the 50 first images and some tex-
tual data also needed ordered by the relevance that the words introduced in the free-text search
bar have in the database filter by some topics that are also introduce using the fixed search filter
options, as is commonly employed for interactive retrieval systems [27]. The reason why this
vector only returns the first 50 images is explained in 5.2
From the final vector is selected the different information and is transformed to eight different
json lists, one for the paths and seven for the textual information, and is the one that is send to
the UI to display the images and the text.
However, also are send two more json list objects with the contextual images, one for the two
previous images and another one for the two post images from the main one. These images are
obtained using the scores and ids of the main images.
Given the passive nature of lifelog data capture, a naive approach would be to simple select the
previous occurring images to be shown on the screen. However, lifelog data tends to be very
repetitive, so it is used another system to display these images.
The method consists in doing the same query as in the main image with the difference that in
this new queries are also passed the ids of the main images obtained and their scores.
With these ids and scores the system looks for the images that are before and after the main
one and have a different score. Once it is find this image together with the following one are
returned in json form. In this case just the path is returned, because the information about the
image is not needed to display in the UI.
Additionally, is considered the case that the main image doesn’t have images from a different
score before or after. In this case the previous and following from the main are displayed.
Also, the case of the two first and last images of the database is considered. In this case, due to
there aren’t previous or post images the main image is displayed twice or once, respectively.
At the end three different json lists are returned for the images together with seven more json
lists for each textual parameter that are displayed in the UI.
4.1.5 Ranking Engine
The ranking engine is the most important part of this search engine. It is needed to store all
the images from the main one to the less important one to let the user find the search image in
an easy and fast way. This ranking engine is only applied in the Free-Text search bar.
It integrates TF-IDF ranking. TF-IDF represents the product of two statistics, term frequency
and inverse document frequency. TF-IDF is a statistical approach to information retrieval that
is intended to reflect how important a word is in our database, so the words that appear less in
our database have a higher score than words that appear more often.
TF is expressed like:
T F = (log(dtf ) + 1)/sumdtf ∗ U/(1 + 0.0115 ∗ U )
Where dtf is the number of times the term appears in the document.
sumdtf is the sum of(log(dtf ) + 1)’s for all terms in the same document.
25U is the number of unique terms in the document.
IDF is expressed like:
IDF = log((N − nf )/nf )
Where N is the total number of documents and nf is the number of documents that contain
the term.
Since the annotations for the LSC dataset are generated automatically by content analysis
tools, the natural variability in human text does not occur in the LSC collection. Hence, con-
cepts such as term frequency weighting of terms are unlikely to play any significant role in the
ranking process because there are no same words in the same cell or ”document”. However, the
inverse document frequency concept from information retrieval is important in that it allows for
the higher ranking of concepts and the use of TF-IDF ranking includes the inverse document
frequency weighing in the IDF component.
4.2 The Front-End
The front-end is everything involved with what the user sees, including design and some
languages like HTML and CSS.
The front-end has to be design thinking in the user. It has to be easy to understand and also it
has to provide rapid querying and efficient browsing of results.
A good front-end can be the difference between a system that the user will use often or not.
4.2.1 React JS - Multi-Faceted Query Interface
It is selected to work with ReactJS for building the UI.
ReactJS is an open-source JavaScript library which is implemented for many of the most well
known companies like Facebook, Instagram, Netflix, Yahoo or even WhatsApp for its speed,
scalability and simplicity.
Speed and simplify are achieved thanks to their two phases character. It when the user introduces
queries to the UI ReactJS doesn’t change the view, it as a first phase updates and saves the
internal state of the component. After that it updates the view with a new render method. This
is called unidirectional data flow, meaning that the data just flows in one direction from state to
views, leaving the trip back.
Also, ReactJS works faster thanks to how deals with DOM5 . Normally, browsers need to check
all the CSS and redisplay operations on the website. However, ReactJS can work using a Virtual
DOM[19], without needing to modify the DOM.
The User Interface is designed taking in count an already done web page interfaces for faceted
search systems (e.g. hotel booking or fight booking).
5
Document Object Model is a HTML document created by the browser when a page is loaded.
26It consists in two main sections, as in Figure 4.4.
On the left side, the query panel is displayed which contains the faceted and free-text query
elements. On the right side is the result display panel, where the different images and text
related with the main image appears.
Given the fact that the number of unique annotated terms in the collection could be very large
(especially in terms of visual concepts and locations), it replaces the typical drop-down list with a
free-text search box on the query panel. This search box matched against content related about
conceptual things of the images and also place and activity data sources and is hoped to simplify
the use of the system for the user. In additional to the free-text search, it is added some more
faceted search filter options:
• Day-of-the-week selector. Consists in a button group filter that lets the user search
content by the day the event represented in the topic occurred.
• Dropdown calendar selector to choose and exact date. It has an additional check button
to choose to disable the function.
• Moment-of-the-day selector. A checkbox group to filter content that occur at certain
time of the day.
• Checkbox place selector that allows filtering into indoor/outdoor.
• Heart-rate button group selector to choose the various degrees of physical activity of
the lifelogger.
Highlighting the visual context of the image by borrowing from concepts previously used in
interactive video retrieval systems[4], the visual context of each ranked image is displayed by
the highlighting of two previously occurring and following images. So, in total are displayed five
images, placing bigger, in the middle, the main one and smaller the contextual ones.
The interface lets the user click on all the images and select to send each image to LSC server.
Before sending the image to the server an alert panel is displayed to confirm the submission of
the image, avoiding possible errors.
27Figure 4.4: User Interface design.
Also, an extra thing added in the interface is a text box in the right side where are displayed
few important things about the moment the image was taken, such as temporal, location and
activity data.
28Chapter 5
Results
Finally, to sum up with the thesis it is done a assessment of the system presenting some results.
For doing this assessment it was asked to six different people familiarize with computers and
technology in general to test the system. This test consists in using the system to browse for
three different images 5.1. This images are selected to be no common images and to have specific
information in them. This things make easier the search for users that are not specialized with
the system. Together with this images was attached some information related with the moment
to let the user search the information using the other selection items.
Figure 5.1: Images selected for the test.
From this test is obtained two kind of assessment. Qualitatively and Quantitatively.
5.1 Qualitatively - UI feedback
As it was introduce is important to build a user friendly system. As much as the system works
good if it doesn’t do it in a comfortable way nobody will use it.
For this reason a first qualitatively way to assess the system is done.
After using the system to search for the three images the user was asked to fill a questionnaire.
This questionnaire is made up of seven questions all of them related on how the user feels with
the UI. And the comprehension of the different information that is displayed in the screen.
This questionnaire was asked to answer for the user giving to each question a punctuation between
1 and 5, being 1 a strongly disagree and 5 strongly agree.
From these punctuations given, the final table 5.1 is done with the average punctuation for
every question.
29Questions Punctuation
1 I like how the Interface lets me introduce the queries. 4.3
2 I think the way the images are displayed is intuitive and 4.6
with a good design.
3 I think the text displayed is a good idea to give more 4.8
information about the main image.
4 I like how the text is displayed. 3.8
5 I think the system works good. 4.5
6 I think the system is useful. 3.7
7 I would use one system like this in a future. 3.5
Table 5.1: Questionnaire with the average feedback of the users.
With this questionnaire has been tried to asked to the user about the main functionalities to see
how comfortable are they with the Interface and to try to know the loose points of the Interface.
Also, in the questionnaire are added two more questions about what the user thinks about this
kind of systems and lifelogging in general.
From this questionnaire and some feedback that user gives during the test some conclusions
about the functionality of the system can be make:
The query section provides facilities and an easy way to make queries. However, some users
think that more options could be added in this section related with the activity or the place using
a drop-down list with the common places or activities.
In relation with the images the users agree giving a good punctuation an pointing that maybe
is the strong point of the Interface. However, it is point that a bigger separation between images
could represent a good improvement.
In regard to the text the users agree saying that is a good idea to provide more information
with the text section. However, the users also agree saying that the design could be better,
placing the text below the main image or even placing text for also the contextual images.
Finally, about the usability the users think that works good and could be very useful for some
situations related to the lack of memory about actions done in the past or for remembering good
moments or situations.
However, for the users lifelogging is a hard thing to think about. The majority of users agree with
the fact that wearing a wearable camera can attempt to the privacy of the different subjects and
bystanders. Also, some of they think that taking the routine of wearing every day the different
devices can be difficult, with the inconvenient that not hearing these devices one day can affect
representing a lose of information and memories of one day.
A part of these previous things from the feedback of some users can be extract that a better
design of the UI could really attract more the user to work with it. Adding more colors or even
30some logos.
The UI is created not taking into account some aspects related with the design. Is more focused
in the efficiency of the system.
5.2 Quantitative - Search Speed
For the Quantitative assessment the six different users were asked to search for the three
images as fast as they could. Then, the time they spend to do each of the queries has been
calculated in three different phases.
First the time spend for making the query, then the time for displaying the images and finally
the time for searching the good image from the other once and clicking the button to submit it.
In this last phase, its add the extra time that the user needs in the case that in the first search
don’t succeed and have to realize a second search.
In the following Figure 5.2 is showed the average time of the six users for each search.
Figure 5.2: Average results of the quantitative test done with the users.
From the previous Figure is conclude that the query section gives a fast input way to introduce
the queries to the system. Actually is the phase where users spend less time.
After in the second phase its seen an increase of time, actually users take around twice from the
first phase. It represents around 18.67 seconds to display 50 images. For the competition can be
a large amount of time.
A comparison to see the relation between number of images displayed and time is done 5.3.
Concluding that as less images as fast is the system, thus, it could be studied to reduce the
number of images displayed to achieve a fast display of the images, taking into account that it
could hinder the search.
31Figure 5.3: Comparative graph between time spend and number of images displayed.
Finally, the third phase is probably the slowest part, some times, as there are many similar
actions, finding the one that interests to the user is not as easy at it should be. Actually, in this
phase is where its find more difference of time. However, all the users succeed with the search
of the test images.
Also, sometimes the alert panel placed when an image is selected to send can represent a small
amount of time spend.
5.3 Goals achieved
Regarding the results obtained, it seems clear that the main purposes have been accomplished.
The main goals of the project were:
• To understand the problem. It has been done making a study of the state of art of
lifelogging and the previous similar works in Chapter 2. Also, an introduction to a search
engine is done in Chapter 3.
• To build a UI with some require functionalities. This UI is created letting the user
introduce the desire queries, displaying the images in an understanding way. And finally
with a contextualization in form of two previous and post images and text. Finally, also
these images can be submitted in LSC server.
• Design a database. A fast query database has been build. Letting the user make quickly
searches.
• Build an intermediate server. It has been crated to work as a link between the database
and the UI.
• Assessment of the system. Finally the system has been test with some users and some
conclusions have been obtained.
32You can also read