Geospatial Analysis and the Internet of Things - MDPI
←
→
Page content transcription
If your browser does not render page correctly, please read the page content below
International Journal of
           Geo-Information

Article
Geospatial Analysis and the Internet of Things
Andreas Kamilaris 1, *          and Frank O. Ostermann 2
 1    Department of Computer Science, University of Twente, 7522 NB Enschede, The Netherlands
 2    Department of Geo-Information Processing, University of Twente, 7514 AE Enschede, The Netherlands;
      f.o.ostermann@utwente.nl
 *    Correspondence: a.kamilaris@utwente.nl

 Received: 1 June 2018; Accepted: 3 July 2018; Published: 10 July 2018

 Abstract: As the Internet of Things (IoT) penetrates our everyday lives, being used to address
 a wide variety of real-life challenges and problems, the location of things becomes an important
 parameter. The exact location of measuring the physical world through IoT is highly relevant to
 understand local environmental conditions, or to develop powerful, personalized and context-aware
 location-based services and applications. This survey paper maps and analyzes the IoT based on its
 location dimension, categorizing IoT applications and projects according to the geospatial analytical
 methods performed. The survey investigates the opportunities of location-aware IoT, and examines
 the potential of geospatial analysis in this research area.

 Keywords: Internet of Things; geospatial analysis; location; survey

1. Locating the Internet of Things
      The Internet of Things (IoT) includes technologies and research disciplines that enable the Internet
to reach out into the real world of physical objects [1]. IoT-based projects are increasing in number
and scope for various application domains such as smart homes [2], urban environments [3] and
smart agriculture [4]. Internet-enabled things are equipped with sensors, measuring with high
precision the state of the physical world such as temperature, humidity, radiation, electromagnetism,
noise, chemicals, etc. Moreover, the rise of multi-sensory mobile phones offers advanced sensing
capabilities, such as measuring proximity, acceleration and location; recording audio/noise;
sensing electromagnetism; or capturing images and videos [5].
      An important characteristic of the measurements performed by Internet-enabled things (i.e., sensors,
mobile phones, cameras, etc.) is the geographic location of each measurement. For location-based
services, geographic information is crucial in understanding the local environment [6], enabling the
development of powerful context-aware, personalized applications [7,8], especially in relation to mobile
phone computing [9]. Location sensing has been facilitated in recent years because of the evolvement of
various outdoor (as well as indoor) positioning technologies and techniques [10].
      As the physical or artificial environments are generally complex and characterized by a wide
variety of parameters, a rich collection of measurements in space and time is necessary to model and
understand these ecosystems [11]. Hence, sensory-based IoT information needs to be aggregated,
stored and analyzed for more elaborate and holistic reasoning and inference. For example, a route
planner application needs input from various traffic sensors placed around a city [12], combining this
information with air quality or weather forecasting to give more complete and personalized
recommendations to the user [13,14].
      To exploit this variety of IoT measurements in type, space and time, geospatial analysis is used to
provide answers and insights to complex queries and research questions [15]. This paper examines the
relationship between geospatial analysis and the IoT, and identifies current trends and future research

ISPRS Int. J. Geo-Inf. 2018, 7, 269; doi:10.3390/ijgi7070269                      www.mdpi.com/journal/ijgi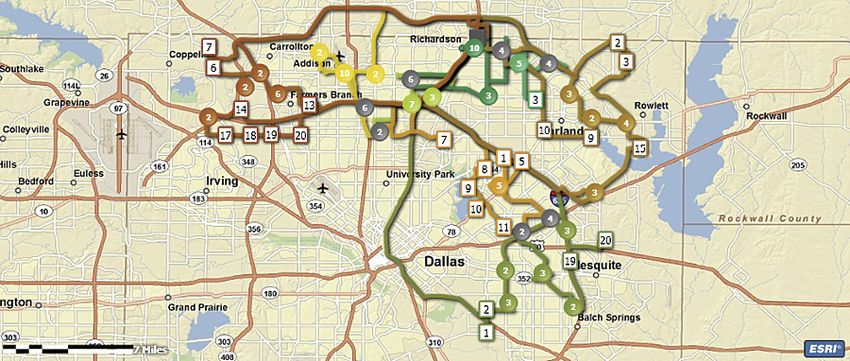
ISPRS Int. J. Geo-Inf. 2018, 7, 269                                                                  2 of 22

directions and applications. It analyzes the IoT focusing on location, examining the various geospatial
analysis techniques employed. Our contribution lies in investigating the potential of location-aware
IoT for geospatial analysis, studying the possibilities of research in this intersection. Although IoT data
are often geospatial, there has been little (conscious) interaction between the two domains, i.e., IoT
and geoscience. This paper expands the preliminary work on the topic published in [16], presenting
a more elaborate survey of geo-enabled IoT projects, categorized according to the type of geospatial
analysis used. The guiding questions for this work are:

1.    What is the role of IoT in geospatial research at the moment with respect to analysis methods,
      applications, and geographic scales?
2.    What are the IoT characteristics with respect to location and geospatial data, i.e., device/data
      types, reliability and accuracy, security and privacy, device settings and deployment aspects?
3.    What are the challenges and opportunities of using IoT for geospatial research in the future?

     We start by determining what the current usage of IoT is, with respect to geospatial research
as reported in the literature. We examine IoT usage with respect to geographic analysis methods
and application domains. Next, we present the characteristics of IoT devices being used (including
reliability and accuracy, privacy and security), the type of data they create, and the standards in
operation (e.g., with respect to interoperability). Finally, we identify challenges and opportunities,
discussing current trends in IoT research and likely future directions.

2. Methodology
     In the context of this paper, things are defined as physical sensors or mobile phones with
sensing equipment. Stationary measurements (e.g., from weather stations) are also included, as well
as incidents of events at some particular physical location (e.g., crime or disease occurrence).
Physical location is considered any location tagged with geographic coordinates (i.e., latitude and
longitude) or an unambiguous place name that has a geographic footprint. It is assumed that
geo-referenced objects have spatial properties, modeled as vector or raster data [16].
     We began our investigation with a keyword-based search for related work using Web of Science
and Google Scholar, as well as the Google search engine, using relevant keywords such as “Internet
of Things”, “Pervasive Computing”, “Geospatial Analysis”, and “Geographical Information Systems
(GIS)”, as well as combinations of these keywords, and various keywords of well-known analytical
methods used in geoscience.
     We opted for this approach because the research domains of geographic information science and
IoT are still relatively separated, with publication patterns focusing either on one direction or the
other, but not on their intersection. Papers not written in English were excluded. Improvement of
works presented by same authors were counted as one. Through this search, 97 papers were initially
identified. Each paper, application, case study or initiative was checked for relevance based on its
abstract or summary. By reading the abstract, we tried to identify if a paper complied to the following
two criteria:

1.    Used an IoT infrastructure applied in some real-world application.
2.    Used some geospatial analytical method or technique based on GIS, in order to address some
      geospace-related problem.

     For some papers, we needed to read through the whole paper to examine whether they were
aligned with our criteria, because reading the abstract/summary alone was not enough.
     Papers that passed these two criteria were then categorized according to the “Analytical Methods”
categorization as performed by the “Geographic Information Science and Technology Body of
Knowledge” [17]. This categorization was selected because it represents well the methods employed for
analysis in the related work identified. The seven specific categories selected are “Geometric Measures”,
“Basic Analytical Operations”, “Basic Analytical Methods”, “Network Analysis”, “Data Mining”, “Analysis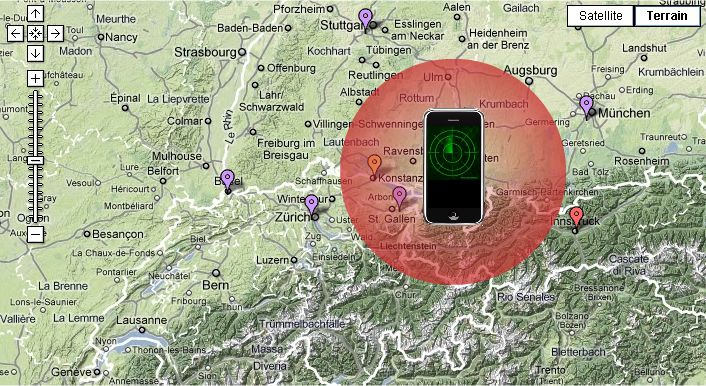
ISPRS Int. J. Geo-Inf. 2018, 7, 269                                                                      3 of 22

of Surfaces”, and “Geostatistics”. The last two categories have been combined into one in Section 3,
because of the similarity between interpolation and kriging as observed in the surveyed papers.
     Afterwards, each category was analyzed individually, examining all 97 papers identified at the
previous stage for their relevance, by reading them in detail. By reading the papers thoroughly,
the research questions as defined in Section 1 were addressed for each paper separately. From the
97 papers, 55 were considered highly relevant, i.e., belonged to the IoT research area and performed
some meaningful geospatial analysis. The identified analytical methods and geospatial analysis
techniques, together with the relevant IoT applications discovered for each technique, are presented in
Section 3, while the remaining research questions are discussed in Section 4.

3. Analytical Methods and Applications
     This section addresses the first guiding question of our inquiry and presents the six different types of
geospatial analysis discovered, as well as the IoT projects and initiatives using these analysis techniques.
The IoT projects identified cover a variety of application areas such as tourism, utility networks, disaster
monitoring, health and disease detection, transportation, logistics, wildlife monitoring, agriculture, crime
prediction, sports and gaming, and the physical environment.

3.1. Geometric Measures
     This is the most basic form of geospatial analysis, dealing with distances and proximity of points,
adjacency and connectivity. Because of their basic and fundamental nature, geometric measures find
numerous applications in mobile location-based services [9,18,19]. These applications range from
transportation to health, and from agriculture to sports. Figure 1 summarizes different application
domains of IoT in mobile computing, together with the sensors and IoT devices employed at each
case. Location-based sensing is an important element in almost all of these application domains,
especially the ones of social interactions with people, transportation, health, agriculture, sports,
participatory sensing and interaction between humans and physical things.

               Figure 1. The eco-system of location-based mobile phone IoT applications (Source: [9]).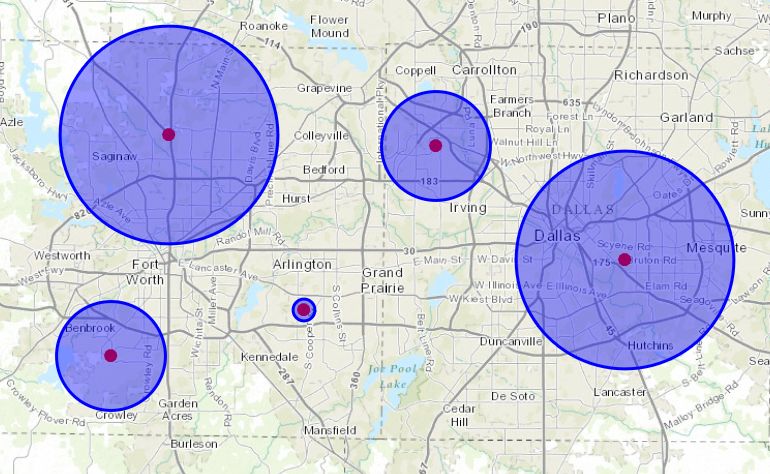
ISPRS Int. J. Geo-Inf. 2018, 7, 269                                                                4 of 22

      Distance and proximity have been considered in context-aware tourism recommendations [20]
or location-based marketing [19], where marketing services could be offered to tourists and citizens
based on their current location, e.g., nearby offers in restaurants and shops. Relevant application areas
include mobile dating (geo-social services), such as Grindr (https://www.grindr.com/) and Okcupid
(https://www.okcupid.com/), as well as gaming, such as the popular Pokemon Go (Niantic, Inc.
https://pokemongolive.com/es/). Moreover, distance and proximity are also highly relevant for
managing infrastructures, e.g., in water utilities, for diagnosing problems in water distribution
networks [21].
      UrbanRadar [13,14] is an example of a location-based mobile application that interacts with IoT
sensors deployed in the vicinity of the user, using online, global sensory directories to indirectly
locate these nearby sensors. The concept of UrbanRadar is depicted in Figure 2. This approach
can be combined with participatory or crowdsourced sensing for making environmental-related
observations or for identifying emergency events [22,23]. Examples include photographing diesel
trucks to understand community exposure to air pollution [24], or measuring the personal exposure of
citizens to noise in their everyday environment [25].
      In addition, adjacency is useful in disaster monitoring and response, such as monitoring landslide
displacements [26] and deep-ocean tsunami occurrences [27].

                         Figure 2. The concept of UrbanRadar mobile application (Source: [13]).

     Further, the exact locations of events and the distances between them and other locations of
interest are crucial for health geography and epidemiology studies, such as detection of infectious
diseases [28]. The HealthMap project [29] analyzes such incidents to improve consumer education
around disease risk at the local level and to encourage proper prevention practices. It offers various
relevant services such as searching for locations offering flu vaccines or tracking geographic and
temporal trends in infectious diseases among travelers, immigrants, and refugees.

3.2. Basic Analytical Operations
      In geographic information science, basic analytical operations include buffering, overlays,
neighborhood-based analysis and map algebra. In the IoT scope, mostly buffering and overlaying
have been recorded.
      Buffering is the process of creating zones around selected features, within a predefined distance
from these features. An example of point buffering is shown in Figure 3, where red dots represent the
features and blue circles the buffer zones. Overlay is a GIS operation that superimposes multiple data
sets (representing different themes) together for the purpose of identifying relationships between them.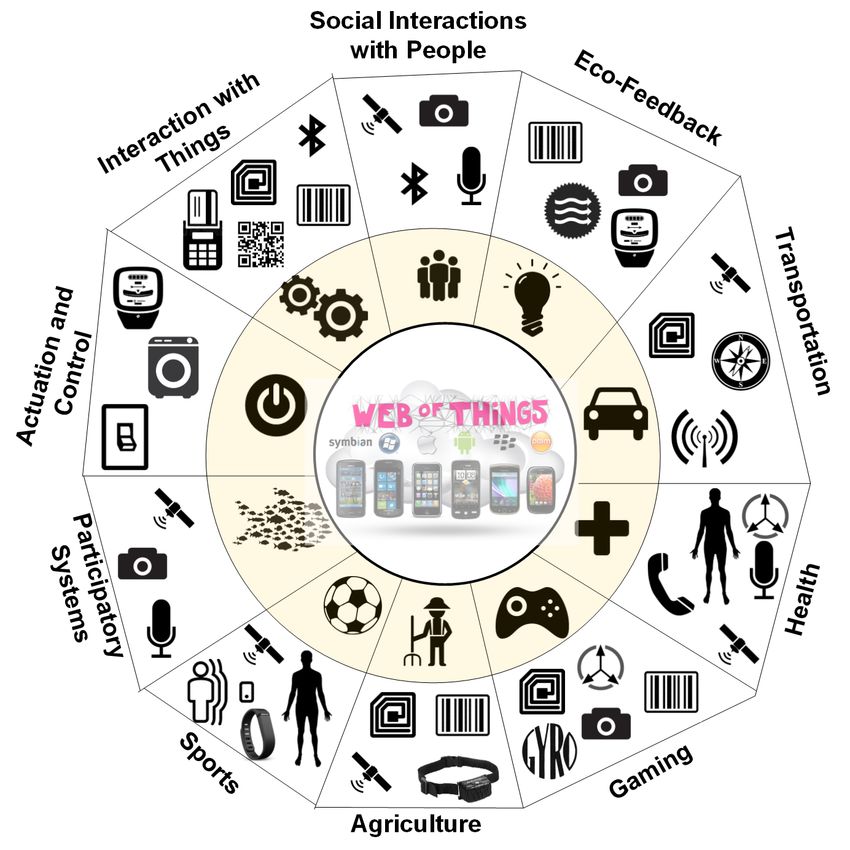
ISPRS Int. J. Geo-Inf. 2018, 7, 269                                                                  5 of 22

The type of intersection used in the overlay operation is one of the nine possible operations described
by Egenhofer [30], i.e., union, touch, overlap, etc.

                             Figure 3. An example of buffering analysis (adapted from [31]).

     Buffering has been observed in flooding models, for calculating the expected excess rainwater [32]
and in assessing the risks of forest fire [33]. A combination of buffering and overlays has been used
in assessing the devastation potential of earthquakes [34], in calculating the greenhouse emissions
produced by livestock agriculture [35] and in tsunami emergency evacuation-planning scenarios [36].

3.3. Basic Analytical Methods
      Basic analytical methods involve spatial analysis of point patterns and clusters, kernels and density
analysis and estimation, cartographic modeling and models of spatial processes. In geospatial IoT research,
mostly density analysis has been observed. Density analysis takes known quantities of some phenomenon
measured at each location or area and examines the spatial relationship of the locations of the measured
quantities [31]. Density surfaces show where point or line features are concentrated. An example is
illustrated in Figure 4, visualizing the density of crime incidents in the city of Chicago [31].

                              Figure 4. An example of density analysis (adapted from [31]).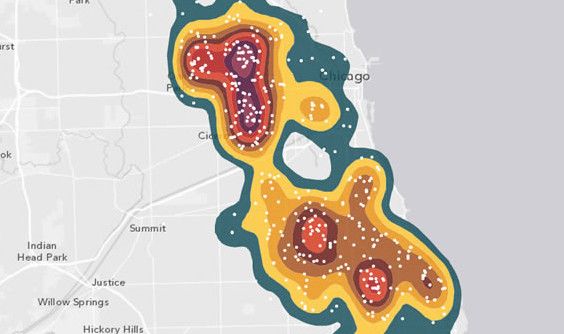
ISPRS Int. J. Geo-Inf. 2018, 7, 269                                                                  6 of 22

     Density analysis has been used in tourism recommendations [37], discovery of attractive areas
using collections of geo-tagged photos [38], identifying groundwater potential zones in hard rock
terrain [39], monitoring the seasonal variation of physicochemical parameters of an urban water
stream [40] and the analysis of how alcohol outlets affect the possibility of violence, in association with
specific socio-demographic groups [41].
     A particularly common output of density analysis is a heat map, where each raster cell is assigned
a density value and the entire layer is visualized using a temperature gradient metaphor, as shown in
the example of Figure 5. More vivid colors usually represent high concentration of measurements or
large values of some measured quantity.

                             Figure 5. An example of heat map analysis (adapted from [31]).

     Heat maps in IoT have been used for traffic flow visualization [42], for optimizing public
transportation by analyzing taxi rides [43] and for predictive policing [44], where police departments
and emergency institutions analyze past and real-time data to identify crime or violence hot-spots,
and manage their physical resources. In addition, heat maps are commonly used in mobile sports
tracking applications [45], for understanding greenhouse emissions form livestock agriculture [35],
for visualizing urban air quality [46] and in modeling traditional and genetic biodiversity [47].
Finally, an interesting application of heat maps based on kernel density estimation was for the
monitoring of dengue fever [48].

3.4. Network Analysis
      Network analysis can be used in graph measures, least-cost shortest path problems and flow
modeling. In this sense, it is closely related to distance and proximity analysis. Network analysis
can be used to solve transportation problems that would be very challenging to solve otherwise.
Examples of classical transportation problems that require network analysis include finding closest
facilities (see Figure 6), discovering optimal service areas, calculating multi-point vehicle routing,
performing location allocation, doing time-dependent analysis and creating a origin–destination cost
matrix [31]. Route planning is a sub-category of network analysis, which is about finding optimal
means of traveling between two or more given locations (i.e., vector points), based on criteria such as
fastest or shortest path, cheapest route, etc.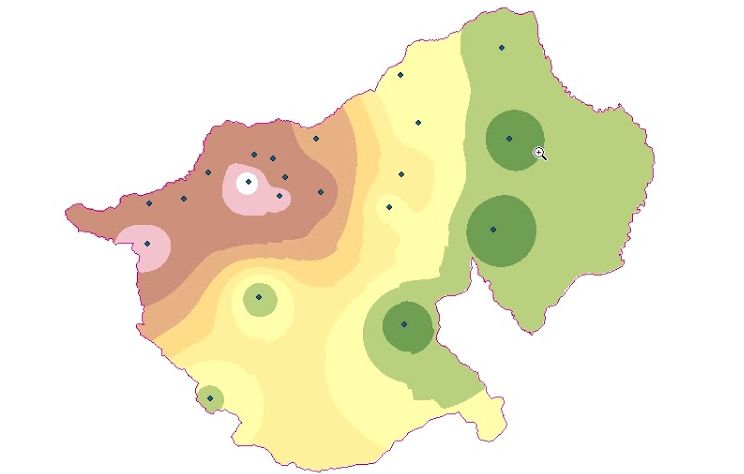
ISPRS Int. J. Geo-Inf. 2018, 7, 269 7 of 22
Figure 6. An example of network analysis related to finding closest facilities (adapted from [31]).
IoT projects using network analysis involve BALLADE (http://sensorsandsystems.com/tuning-
the-ballade-geospatial-infrastructure-for-plug-in-electric-vehicles/), an e-mobility initiative for managing
networks of intelligent geo-located charging stations for plug-in electric vehicles. Network analysis was
also used in [49], for studying the role of landscape connectivity in assembling exotic plant communities,
observing that invasive species can spread more easily in fragmented landscapes than native species, which
may make communities more homogeneous over time. Finally, network analysis has been employed in
agriculture, for estimating the impact of livestock agriculture and especially animal manure on the physical
environment [50].
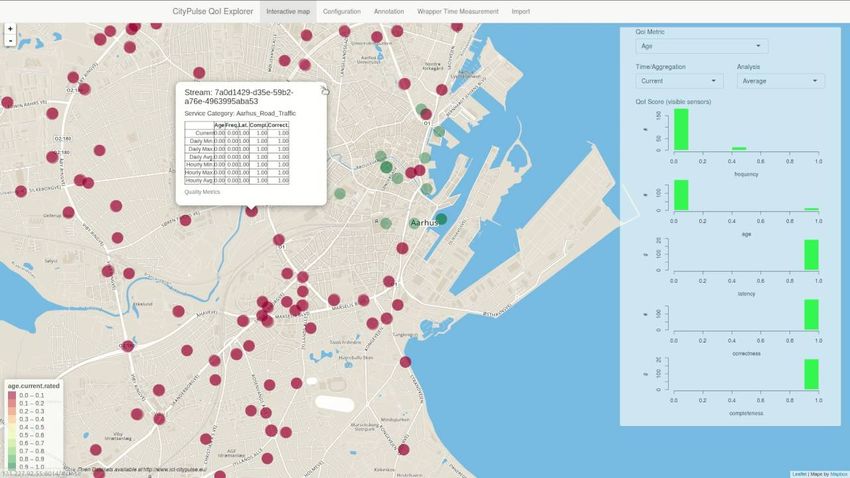
The CityPulse project developed an IoT-enabled route planning demonstration [12], which takes
into account real-time traffic conditions at the city of Aarhus, Denmark and considers various user
preferences. A snapshot of the demo is shown in Figure 7. In addition, UPS implemented a system
called ORION [15], which is powered by GIS technology. The system acts as a logistics command center,
weighing the stops a driver must make against variables such as timed deliveries and fuel usage.
Figure 7. A snapshot of the CityPulse route planner demonstration (Source: [12]).
ApparkB (https://www.areaverda.cat/es/operar-con-el-movil/qusapparkb/) directs the user to
open parking spots in Barcelona while tourist guide services navigate the users to suggested nearby
attractions [51]. Finally, a demonstration of optimized municipal solid waste recycle managementISPRS Int. J. Geo-Inf. 2018, 7, 269 8 of 22
based on IoT technology, is described in [52], while SmartBin (https://www.smartbin.com/) offers
intelligent remote monitoring solutions for collection of waste and recycling.
3.5. Data Mining
Data mining is about discovering patterns from large datasets. Spatial data mining is the application
of data mining techniques to spatial data. Spatial data mining follows the same functions as data mining,
with the end objective to find patterns in geography, extracting knowledge from geospatial data [53].
Multiple geo-located objects may be involved, being dynamic in space and/or time. Their characteristics,
trajectories and behavioral patterns in space and time can become aggregated and clustered, classified and
associated, for more advanced and complete analytics and accurate numeric predictions.
An example is the MobEyes project [54], which performs urban monitoring by means of a vehicular
sensor network, using opportunistic dissemination of road information to vehicles. Other examples
involve smarter traffic lights for optimizing traffic management [55] and a smarter road system [56],
allowing road authorities to obtain a broader view of the problems that can occur on the transportation
network they manage.
Besides urban transportation management, aggregated location sensing has been employed in the
analysis of behavior and interest of visitors in different types of cultural heritage-related visits [57],
as well as in logistics [15], for tracking vehicle location, mechanical systems and condition of cargo,
and for monitoring drivers’ habits and performance.
Furthermore, large-scale location measurements are important in management of construction
sites and operations, by means of real-time monitoring of the position of assets and materials for
day-to-day management and planning [15]. Infrastructure asset management was performed in [58],
targeting location-based services in smart cities. Electric utilities such as the Seattle City Light employ
real-time aggregated location measurements to produce accurate outage reports, achieve situational
awareness, logistics support, and advanced analytics [15]. Interesting applications are the ones
concerning animal monitoring, such as using collar tags to recognize the activity of goats [59],
or employing ultra-low power sensors for sustainable wildlife monitoring [60]. Domestic animal
monitoring is important for assessing their overall welfare and detecting early enough possible
diseases. Wildlife monitoring is useful for protecting wild animals against poachers or for estimating
life threads due to changing weather and climate conditions, or disaster scenarios.
Finally, crowdsourced geo-tagged information has been used for assessing in real time earthquake
hazards, and to facilitate and coordinate emergency response [61].
3.6. Analysis of Surfaces and Geostatistics
Analysis of surfaces and geostatistics deal with interpolation of surfaces and kriging.
Spatial interpolation is the process of using various points with known values to estimate values
at other unknown points, creating a continuous surface of values. Interpolation methods are
directly based on the surrounding measured values or on specified mathematical formulas that
determine the smoothness of the resulting surface. Various deterministic methods exist for performing
spatial interpolation [62], such as inverse distance weighting (IDW), a natural neighbor technique,
a trend-based method, and the spline technique. Shepard interpolation was used for estimating the
Grand Canyon height map and a high-risk flooding map [63]. An example of spatial interpolation
is provided in Figure 8, where point altitude meters (i.e., black dots) are used to create an elevation
surface of some area.ISPRS Int. J. Geo-Inf. 2018, 7, 269 9 of 22
Figure 8. An example interpolation (adapted from [31]).
Interpolation has been used for diverse topics such as studying vector-borne diseases [64]
(i.e., composite regression with variable selection and thin-plate spline algorithm) and malaria [65]
(i.e., Bayesian interpolation), for estimating the level variations of the sand layer of sandy beaches
or dunes, for creating dynamic 3D maps of the area under study in real time [66], as well as for
understanding fish-school characteristics around artificial reefs [67] (i.e., IDW algorithm).
On the other hand, kriging belongs to a family of interpolation methods using geostatistical
techniques, based on statistical models that include autocorrelation, i.e., the statistical relationships
among the measured points. In the context of IoT, kriging has been used for estimating zinc
concentrations, in order to assess contamination at the sidements of the Lake Ontario [68], and for
considering irrigation water suitability [69]. It has also been used for the modeling of air temperature
and precipitation [70].
Both interpolation and kriging techniques were applied in [71] to assess contamination of soil
by heavy metals, using IDW, local polynomial, ordinary kriging and radial basis functions (RBF).
Ordinary kriging and RBF were more accurate than the other methods. Both interpolation and kriging
were also used in [72], for deploying site-specific soil fertility maps, employing IDW and ordinary
kriging. Prediction efficiency showed that ordinary kriging outperformed IDW. Therefore, in both
cases [71,72], findings show that kriging is a more accurate technique than interpolation.
3.7. Discussion of Analysis Methods
Our review has indicated six major analytical methods of geospatial analysis and geographical
information science used in IoT research. For each technique, various IoT-based projects and initiatives
using this technique have been identified. Table 1 maps the different IoT research areas identified,
together with the geospatial analytical method used, according to the surveyed work. As the table shows,
geometric measures and basic analytical methods were the ones mostly used, while the IoT areas of health
and disease detection, transportation, wildlife monitoring, agriculture and environmental research were
the ones that used the largest variety of the different geospatial analytical methods recorded.ISPRS Int. J. Geo-Inf. 2018, 7, 269 10 of 22
Table 1. IoT research areas and geospatial analytical methods.
IoT Area Geometric Measures Data Mining Basic Analytical Operations Basic Analytical Methods Network Analysis Surface Analysis & Geostatistics
Tourism x x - x - -
Utility networks x x - - x -
Disaster monitoring x - x - - x
Health and disease detection x x - x - x
Transportation x x - x x -
Logistics and assets - x - - x -
Wildlife monitoring - x - x x x
Agriculture x - - x x x
Crime prediction - - - x - -
Sports and gaming x - - x - -
Environment - - x x x xISPRS Int. J. Geo-Inf. 2018, 7, 269 11 of 22
Although each paper has been categorized in the most representative category it belongs,
the majority of identified research work involved (additionally) some type of basic geometric measures
(i.e., distance, adjacency, connectivity, and proximity) or basic analytical operations (i.e., buffering,
overlays, and map algebra). In relation to map algebra, some of the surveyed projects employed
spatial relationships such as within or nearby of some raster area, especially tourism services [20,51]
and cultural heritage-related visits [57]. Fusion of information from various sources was also observed,
combined with geospatial analysis, such as the case of predicting the future direction of an on-going
fire [73]. Analysis of time series and trajectories has also been adopted, in projects related to
logistics [15], or wildlife and animal monitoring [59,60].
4. IoT for Geospatial Research
The following subsections take up our second guiding question and discuss different aspects of
the analysis of related work, in respect to IoT devices, data transmission standards, data sources and
types used, scope of analysis, reliability of devices and their measurements, as well as security and
privacy of information.
4.1. IoT Devices and Sensors
A wide variety of IoT devices has been employed in the surveyed work, including RFID tags [52,58],
barcodes and QR codes [9], and open hardware platforms such as Arduino [40,66]. Mobile phones and
their embedded sensors (i.e., cameras and microphones) have been used in many studies [13,19,45,57,65],
especially in studies dealing with participatory sensing and crowdsourcing [22,23,25,61], and tourism
services [20,51]. The majority of studied papers, especially those where mobile phones were used,
also harnessed GPS sensing for acquiring exact user location.
Moreover, ultrasonic water sensors [21]; pollution sensors [13]; infrared (IR) cameras [63];
temperature, humidity and pressure sensors [46]; geocubes, meteorological and hydrological
sensors [26]; buoy, pressure and water column heights sensors [27]; temperature, dissolved oxygen and
pH sensors [40]; and 3D accelerometer and gyroscope sensors and animal collar tags [59,60] have been
recorded. Asset management was facilitated by means of combining RFID tags and Global Navigation
Satellite System (GNSS) receivers [58], with GNSS being used also in [66].
Transportations systems make use of vehicular sensors for road safety [54], smart traffic lights and
road sensors [55], air quality, traffic conditions, sensors for parking availability [12], and traffic systems
in general [56]. For enhanced experiences in museums and cultural heritage areas, smart glasses and
wearable devices have been used [57]. Satellites as imaging sensing devices have been harnessed
in problems related to biodiversity [47,49], livestock agriculture and environmental impact [35,50],
forest fire risk assessment [33], vulnerability assessment [34] and disaster relief [61] in earthquakes,
disease monitoring [64,65], for identifying groundwater potential zones [39] and in tsunami evacuation
planning [36] (LiDAR imagery).
Furthermore, meteorological stations (i.e., air, temperature and precipitation) were used for
climatological modeling [70] and for the control of diseases [64], while radar data were also used
for recording precipitation in flood forecasting [32]. In studies relevant to analysis of surfaces and
geostatistics, groundwater sample sensors were harnessed for detection of heavy metals [69], surface soil
sampling [71], and sampling for zinc contamination [68]. Spectrophotometers were also used in [69],
while acoustic data, conductivity, temperature, and depth sensors have been recorded in [67].
Not many papers revealed information whether the IoT devices were placed for long-term or
only temporarily to get some measurements or perform sampling. Long-term sensor deployment
was observed in water monitoring systems [21,40], in air quality monitoring [46], in monitoring
landslide displacements [26] (using low-power 10-Watt solar panels), in deep-ocean tsunami
measuring [27] (battery-powered with four-year lifetime), in vehicular sensor networks and
transportation systems [12,42,54,55], in weather monitoring stations [70] and in wildlife monitoring [60].ISPRS Int. J. Geo-Inf. 2018, 7, 269 12 of 22
Apparently, long-term deployments were provisioned for complete systems (e.g., transportation) or in
environments where sensor replacement was expensive or difficult.
An interesting matter from the IoT perspective is sensor discovery, i.e., how sensors are
discovered automatically from their peers, in cases of IoT-based wireless sensor networks [74,75].
Unfortunately, only few papers revealed such information. An online directory platform called
Pachube was used in [13] for sensor registration on the web, and CityPulse used a dedicated web
platform as sensor directory [12]. A web platform called OnTAPP was also used during the monitoring
of dengue fever [48]. Natural language processing and text data mining were used in [29], to discover
content (indirectly) through the web. Short- and long-range broadcasting were employed in [60], for
wildlife monitoring. Finally, the application programming interfaces (API) of Flickr and Panoramio
were harnessed for exploration and analysis of attractive areas [37,38].
4.2. Mobile vs. Static IoT Devices
Another interesting aspect was whether the IoT sensors were used statically or they were mobile,
moving in space capturing different spatial measurements in different times. Apparently, mobile
phones and their sensing capabilities were used as mobile sensors [9,19], such as crowdsensing
applications [22–25,61] and tourist guide applications [20,51]. Cars with installed sensors can be
considered mobile devices, such as taxis [43], the MobEyes vehicles [54] and waste recycling vehicles [52],
as well as collar tags placed on animals [59,60]. Mobile infrastructure assets were considered in [58].
On the other hand, sensors were placed statically in cases of monitoring some phenomenon
or potential disaster, such as landslides [26], flooding [21,32], tsunami [27,36], forest fire [33] and
earthquakes [34]. Static sensors were also used to monitor water streams [40], measure air quality [46],
the height and volume variations on sandy beaches [66] and car traffic [12]. Static sensors were
employed in all papers related to surface analysis (i.e., interpolation) and geostatistics (i.e., kriging),
where samples were taken from specific sites, creating unified raster zones by estimating unknown
values in between the sampling.
Finally, a combination of mobile and static sensors was used in smart traffic light systems [55],
and in cultural exhibitions and museums [57].
4.3. IoT Data Transmission Standards
From the IoT projects where mobile phones were employed, Wi-Fi [13,51] and/or
telecommunication protocols were used, such as 3G/4G [19] and GPRS/UMTS [20,66], or even
SMS/MMS messages [61,65]. Bluetooth was also used, together with mobile phones [9,25,57].
Closed systems, probably wired ones for reasons of security, were used in transportation
systems [12,56] and smart traffic lights [55]. On the other hand, custom-made IoT sensors made use of
the IEEE802.11 wireless transmission standard, such as ultrasonic water sensors [21] and vehicular
sensors [54], or a combination of GPRS/Wi-Fi at an air quality sensory system [46]. Moreover, a
low power wide area network was observed in [59], for recording animal activity and in [63],
for video transmission from IR cameras. In particular for wildlife animal monitoring, a combination of
Bluetooth low energy (BLE) and LoRa was proposed. For landslide displacements monitoring [26],
geocube sensors were selected, measuring meteorological and hydrological parameters based on
a 2.4 GHz wireless protocol. The ZigBee protocol was used in the wireless sensor network
of [66]. Satellite communications were involved in deep-ocean tsunami measuring [27] and asset
management [58].
Some papers did not involve any wired/wireless transmissions, recording the sensory
measurements at the measuring spot, and this was the case in the majority of the papers dealing
with surface analysis and geostatistics (e.g., [68–71]).ISPRS Int. J. Geo-Inf. 2018, 7, 269 13 of 22
4.4. Data Sources and Types
Besides geo-located information, various different data sources were used for enriching the
geospatial analysis performed. In 13 papers (23%), data were acquired directly from datasets
created/developed in previous projects and research efforts, originating from ground sensors recording
traffic flow data [42], taxi ride data [43], or soil fertility data [72]. Other sources involved mobile
phone-based crowdsourcing [45,48], or satellites [33,35,36,49,50,58].
Some authors supplemented their data using web-based sources such as online news,
expert-curated discussion, validated official reports [29], unofficial online reports [48], road data,
medical facility, information, demographics, and other core operational information for disaster relief
scenarios [61], as well as geo-tagged photos [37,38].
Offline data were also used, such as governmental data repositories [35,47], topographic sheets [69]
and surveys [65,67], as well as information of hospital discharges for violent assaults [41].
Map layers prepared in previous research works were harnessed as well, including digitized
vector maps [39], digital thematic maps [34], digital soil maps [35], and digital elevation models and
maps [47,64,70].
The nature of data was mostly text (i.e., data measurements from IoT sensors),
images (i.e., from mobile phone cameras, satellites, spectrophotometers and fixed cameras in
transportation systems), sound (i.e., from mobile phone microphones), video (i.e., from mobile phone
cameras and fixed cameras in transportation systems and farms for animal monitoring [59]) and
time-series text-based data (i.e., from mobile phones and vehicular sensors for taxi rides [43]).
4.5. Data Sharing and Interoperability
An interesting aspect is whether some authors have provisioned to use data types and approaches
which promote content sharing and reuse. Only few research papers followed this path, such as
COMPASS [20], employing semantic web technologies (i.e., OWL) for enhancing the tourism-related
data, allowing easier data reuse and understanding. Semantic web technologies and the principles
of Linked Open Data (LOD) were used also in [57], for facilitating collaborative analytics of cultural
heritage data. The CityPulse project created convincing demonstrations in different smart city
scenarios, involving semantically-annotated data [12] and analysis/reasoning based on semantic
web technologies (i.e., OWL, RDF, and SPARQL).
Moreover, the web-based geospatial toolkit for the monitoring of dengue fever [48] tried to
promote data reuse by means of exposing data collected by using common data formats such as CSV
and KML, while the air quality measuring platform presented in [46] selected JSON as a universal
format for data exchange. Data were stored in a MySQL database in [66], and then made available any
time and anywhere through the Internet.
The work in [61] refers to a lack of compatibility between OpenStreetMaps and Google’s Map
Maker, which made crowdsourced content during the Haitian earthquake difficult to understand.
Interoperability among IoT-based services, either at platform- or device-level is a relevant topic
here too. From the few cases recorded, COMPASS [20] used WS-* web services for interacting with
tourism-related services and getting relevant data. Further, the concepts of the Web of Things [76]
were followed in [13], for deploying RESTful API for interacting with real-world services dealing
with geo-located data, being able to easily combine these services towards creating urban mashups [14].
Finally, the air quality platform in [46] developed a plug-and-play architecture for easier adaptation to
new software modules and data formats, using web services for interacting with the platform. The rest
surveyed papers did not reveal any information about data sharing or device/service interoperability.
4.6. Scope of Analysis
An interesting research question was whether the analysis performed was local (i.e., at the
specific location where the IoT sensors were physically placed) or more global (i.e., to detect events atISPRS Int. J. Geo-Inf. 2018, 7, 269 14 of 22
a certain regional scale). Only 15 papers (27%) used measurements at the spot, without generalizing.
Examples include tourism recommendations [20,51]; monitoring water levels [21], tsunami [27],
landslides [26] or even human diseases [29] at specific locations; or travel planning [52].
Table 2 summarizes the cases where IoT-based sensors and their measurements were used
to generalize and make larger-scale reasoning from the limited number of point measurements.
These cases were categorized according to the IoT method used. Six different methods were defined,
while the seventh one is a combination of the other six. Participatory sensing, fixed IoT sensor
installations, satellite imagery and ground sensor sampling constitute the most popular IoT-based
methods for generalizations. It was also observed that the method of ground sensor sampling was
associated with the geospatial analysis techniques of interpolation and kriging.
Table 2. IoT-based methods for generalization of analysis.
IoT-Based Method Examples of Generalizations
Detecting emergency events at city scale [23], promoting neighborhood
identity and local services [24], creating a noise map of a city [25],
Participatory sensing detecting outbreaks of dengue fever [48], developing heat maps from
cyclists used for better city planning [45], producing a global spatial
distribution of malaria risk [65].
Proactively performing urban traffic monitoring [54], travel planning
Vehicular networks and transportation systems based on real-time traffic information [12].
Urban decision-making assistance [13], wildlife monitoring and
understanding of herd behavior [60], monitoring the area levels of air
pollution [46], creating air temperature and precipitation maps [70],
Fixed IoT sensors
understanding fish-school characteristics around artificial reefs [67],
estimating the level variations of the sand layer of sandy beaches or
dunes [66].
Understanding how invasive species respond to landscape configuration
relative to native species [49], assessing how the livestock agriculture
affects the physical environment [35,50], modeling forest fire risk
Satellite imagery zones [33], earthquake risk assessment [34], planning of tsunami
evacuation [36], creating digital maps with information about bacteria
habitats [47], delineating groundwater potential zones in hard rock
terrain [39].
Estimating the Grand Canyon height map [63], generating high-risk
floodplain maps [63], creating soil fertility maps [72], assessing the
Ground sensor sampling spatial variation of groundwater quality and producing salinity hazard
maps [69], assessing the heavy metal pollution in soils [71], estimating
the zinc contamination concentrations around a lake [68].
Estimating traffic from historical traffic flows [42], optimizing routes of
public transportation based on taxi rides [43], exploring and analyzing
Web-based IoT datasets attractive areas [38], associating assault rates to measures of population
and place characteristics [41].
Assessing damage in Haiti by earthquake and facilitating emergency
Combination of IoT methods response [61], infrastructure asset management [58].
Relevant to the scope of analysis is the question of whether there have been observed temporal
trends and findings in the use of IoT in geospatial context for longer term. An interesting time-related
challenge observed was about how the nature and composition of fish communities varies in time
daily and seasonally around artificial reefs [67]. Furthermore, time series data allowed creating maps
of potholes in streets, and pollution and noise around a city [25], with classification as day vs. night,
or in different seasons, to observe seasonal changes [22]. It was also possible to monitor travel and
activity patterns to understand daily routines of commuters, predicting traffic [12,42,56] and estimating
the impact of climate change, i.e., how the change of season varies geographically affecting different
ecosystems [24,70].
Continuous measurements allowed studying phenomena such as the temporal variations of
landslides [26], the evolution of disease outbreaks [29,48] and spatial risk prediction [65], the activity
and behaviour of wild animals [59,60], the behaviour of invasive species relative to native species
in biodiversity-related projects [49], and the seasonal impact of livestock agriculture on the physicalISPRS Int. J. Geo-Inf. 2018, 7, 269 15 of 22
environment [50]. Historical time series-based observations were critical for the forecasting of disasters
such as flooding [32] and fire [33].
Finally, the time dimension in combination with spatial sensing allowed the acquisition of
knowledge of mobile phone users’ profiles, history needs and preferences [19], to provide better
recommendations by remembering the user’s actions in previous days, and proposing tourist
attractions to visit [20]. Time and space allowed the P-DBSCAN platform to derive attractive places
automatically based on photo density by tourists [38], and to analyze places and events by using
collections of geo-tagged photos [37].
4.7. Reliability
The reliability of IoT devices and the accuracy of their measurements is an important topic,
however most authors did not provide any relevant details. Reliability is essential in healthcare and
health monitoring applications [9]. The need for trust in participatory sensing is underlined in [22].
In crowdsourcing, sometimes the data are incomplete, such as at the noise map application [25],
where the source of noise (e.g., train and airplane) was missing. Lack of complete and accurate
crowdsourced information complicated rescue and recovery efforts during the Haitian earthquake [61].
Absence of high-quality detailed surveillance data was existent in most malaria-endemic countries [65].
Lack of accuracy was a dominant issue in interpolation/kriging scenarios, where missing
data created certain percentages of errors when averaging/interpolating [56,71]. Uncertainty in
soil heavy metal pollution assessment was observed in [71]. The authors in [56] claimed that
high-quality data assessment is required. This need to meet data quality objectives (DQOs) was stressed
in [46], during the design of an air quality platform. Sensors needed to be evaluated for indicative
measurements, examining a list of parameters that affect the electrochemical sensor responses.
Dealing with missing data was an issue also in [32], towards precise flood forecasting for
the River Meuse. Further, inaccurate data occurred in [43], when analyzing taxi rides. Not all
entries were accurate, while some rides went to impossibly far away places, took way too long, or were
charged with immensely high fares. The analysis of crime potential in [41] focused upon one unique
measure of violence, making the assumption that victims appear in hospital after a violent assault,
while this might have not been exclusively the reason in real life. Absence of detailed data makes this
assumption necessary.
Calibration of the sensors is important in many cases, and it was a necessary procedure in the
pollution sensors used in [13]. The authors needed to send the sensors back to the manufacturer
for accurate calibration. The problem with faulty readings is that it is sometimes hard to detect, if
ground-truth information is not available to compare with. Another general problem with calibration
is that extreme values are more difficult to predict than mean values [70]. Elaborate calibration of the
high-quality tsunami measuring equipment took place in [36], while instrument calibration of the
Arduino-based sensor modules was done also in [40].
Some reliability problems occurred during installation of the sensors at the field. The geocubes
used to monitor landslide displacements in [26] experienced loss of observations due to a lack of
sealing and improper solar panels used as energy sources. The sensors used to assess irrigation water
well suitability were forced to become immediately sealed after sensing [69], because exposure to air
affected the measurements. In addition, the GNSS receivers used in [58] experienced low accuracy and
weak GNSS signals in high building-density areas, and suggested a tag location principle technique to
improve this accuracy. Sealing and insulation of the sensor devices was performed in [66] to protect
them from the marine environment, the hot summer temperatures and the presence of corrosive
elements such as sand and seawater.
Finally, accuracy issues may appear also in remote sensing, due to the resolution of satellite-based
imagery used. The satellite sensor used in [64] recorded a surface temperature averaged over
an 8 km × 8 km area, with an estimated RMSE error of 2.3–4.0 ◦ C.ISPRS Int. J. Geo-Inf. 2018, 7, 269 16 of 22
4.8. Security and Privacy
Security in this context covers IoT devices, their services, the data measured by their sensors
and the platforms involved for data collection. The aspect of security is particularly important in
participatory sensing, since malicious individuals may intentionally pollute the sensing data [22].
Since access to IoT devices is sometimes difficult due to security restrictions of local domains
(e.g., firewalls, use of NAT or mobile network routers), relay infrastructures such as Yaler
(https://www.yaler.net) have been proposed in [9]. The need for secure network and encryption
technologies is stressed in [19]. Encryption and digital signatures are considered critical in urban
monitoring based on vehicular sensor networks [54]. Security of the IoT air quality platform used for
data collection in [46] has been addressed by means of a sensor observation service (SOS-T).
Privacy of IoT devices and their data is also a sensitive issue [77], and multiple privacy threats
have been reported in mobile RFID applications [9] and mobile location-based services [19]. The Social
Access Controller (SAC) has been mentioned in [9], as an authentication proxy between (mobile) users
and IoT devices. In respect to participatory sensing, aspects of intellectual property and regulation are
discussed after the lessons learned from the case study of the Haitian earthquake [61]. The AnonySense
architecture is proposed in [22], for supporting the development of privacy-aware applications based on
crowdsensing, and for privacy protection recommendations. At the noise map application [25], the user
has the option to decide whether to make his measures public and thus contribute to the collective
noise mapping. In addition, in the application targeting the monitoring of dengue fever [48], users are
expected to follow their organizations’ rules and geo-mask the geospatial data accordingly. Finally, in relation
to sports-tracking data [45], a privacy-preserving diversity method (ppDIV) has been employed for
deriving heat maps, adopting an approach based on k-Anonymity for privacy preservation.
5. The Future of Geospatial Analysis and IoT
This section discusses the last guiding question of our inquiry, which is about challenges and
future projections for IoT and geoscience, based on the surveyed work and the observations made by
the authors during this process.
5.1. Challenges
Challenges of geospatial analysis in IoT projects include the cost of IoT equipment, data
storage needs, the requirement of (sometimes real-time) event processing and computational
analysis of geospatial big data, and the use of databases that natively support spatial data types.
The latter is becoming a less important issue nowadays, since almost all traditional relational
databases (e.g., MySQL and PostgreSQL) offer spatial capabilities, while non-traditional NoSQL
databases are also becoming spatially-enabled (e.g., Neo4J, MongoDB, and CouchDB). In addition,
real-time analysis of geospatial big data can be performed by tools such as Microsoft StreamInsight
(https://msdn.microsoft.com/en-us/library/ee362541(v=sql.111).aspx) and ArcGIS GeoEvent Server
(https://enterprise.arcgis.com/en/geoevent/).
Other open research challenges involve the absence of accuracy on generalizations, especially
interpolations [72], the need for standardization of spatial data and infrastructures [78] and the
inclusion of semantic web concepts to sensor discovery [79], to turn the Web into a location-aware
Web [6], where the Web could become an information system where location-related information can
be more easily shared across different applications.
In terms of geo-data interoperability, interestingly, the impact of the Open Geospatial Consortium
(OGC) standards (http://www.opengeospatial.org/standards), such as the Sensor Observation Service
(SOS) as part of the OGC Sensor Web Enablement (SWE) suite [80], seems to have been low thus
far (i.e. based on the authors’ research on mentions over time in Google Search trends and citations
in literature databases such as Scopus). While there are several transmission standards to support
IoT network interoperability (e.g., MQTT, LWM2M, CoAP, and ZigBee), there are no popular andISPRS Int. J. Geo-Inf. 2018, 7, 269 17 of 22
widely-used standards that support data interoperability, except the OGC SWE. However, SWE was
designed when sensors were still comparatively large devices with wired power supply, It has not
been designed for resource-constrained, battery-dependent IoT devices [81]. Some of the surveyed
works adopted XML as a data transmission standard [48], but it has large bandwidth requirements and
it generally fails to describe adequately the semantics of information. Jazayeri et al. [82] proposed the
new SensorThings standard, which is part of SWE, thus inheriting the SWE conceptual model enabling
sensors to be self-contained and self-describable, by using a more lightweight code-base and JSON as
data exchange format (as used also in [46]). The SensorThings API ( http://www.opengeospatial.org/
standards/sensorthings) is designed to be RESTful and support (with extension) MQTT and CoAP.
A first part (on sensing) has already been adopted as OGC standard, and a second part (on tasking) is
in the public commenting phase. Although Jarayeri et al. showed that SensorThings uses bandwidth
efficiently and also runs well on memory-constrained devices, time will tell whether the uptake by the
IoT manufacturers and community will be bigger than the SOS. In parallel, it would be very interesting
to see the evolution of semantic web technologies and LOD in the geo-data world [12,20,57].
Finally, an open challenge for future IoT researchers and geospatial analysts is to be able to easily
combine multiple heterogeneous datasets to develop 4D models that would enable users to view
conditions over time. This approach would provide the ability to better detect and measure changes,
with significant benefits in applications such as construction, logistics, earthworks, agriculture and
land administration.
5.2. Projections for the Future
Based on the overall analysis performed, some IoT application domains seem to have largest
opportunities for applying geospatial analysis, as well as larger potential impact than others.
Geospatial mapping based on participatory sensing is becoming a popular approach to create maps of
(mostly) urban surfaces, in relation to noise, pollution, areas of interests, etc. [22], but also in cases
of disaster reporting, such as the case of the Haiti earthquake [61]. Urban emergency maps could
be created based on crowdsensing from users’ mobile phones, creating risk distribution maps that
allow better assessment of dangers and allocation of available resources [23]. Urban sensing could be
harnessed in the future also for personalized assistance while commuting [13]. Data mining and basic
analytical operations are employed here.
An important area of application would be to better understand and assess the impact of
climate change [24] in different geospatial settings and areas around the world, taking lessons
learned from one area and examining potential impacts on another. Environmental sustainability is
a relevant issue, with early examples focusing on assessing and mitigating the environmental impact
of livestock agriculture [50] and on understanding biodiversity and its risks in landscape changes [49].
Basic analytical methods, analysis of surfaces and geostatistics are mostly used for this type of analysis
and research.
Moreover, transportation in the forms of route planning [43,52], traffic estimation [42], smarter and
more optimized transportation systems [56], as well as driving safety [54] would be heavily affected
by better IoT infrastructures and more efficient geospatial analysis. The demonstrations of CityPulse
indicate the future shape of route planning, considering users’ quality of experience and real-time
urban, traffic and environmental conditions, as well as the preferences and habits of the users [12].
Network-based analytical methods are the ones used in this case.
Finally, it is important to mention some recent European projects, funded by the European
Commission (EC), which combine geospatial analysis and IoT principles to solve different real-world
problems (besides the BALLADE and CityPulse EU projects introduced earlier in Section 3).
The IoBee project (http://io-bee.eu) aims to monitor bees, providing bee health/threat/mortality
status information at regional and national scales, giving regional and national authorities a
powerful tool to understand at a higher level the impacts and risks imposed by the presence
of a disease or pest. By complying with OGC standards, the project encourages beekeepers,ISPRS Int. J. Geo-Inf. 2018, 7, 269 18 of 22
researchers and public authorities to be active participants in colony surveillance programmes.
The Resolute project (http://www.resolute-eu.org/) focuses on enhancing resilience in transport
systems, defining a resilience model for the next-generation of collaborative emergency services and
decision making processes.
6. Conclusions
This paper presents a review of research projects and scientific papers based on the Internet of
Things, in which geospatial analysis has been employed. Six different geospatial analysis methods
have been identified, presented together with 55 relevant IoT initiatives adopting some of these
techniques. Analysis is performed in relation to the type of IoT devices used and data transmission
standards, data types employed, scope of analysis, reliability of measurements, security and privacy,
and interoperability among IoT devices, services and data. Challenges and future projections in
geospatial analysis at the IoT research area are also discussed.
In general, geospatial analysis offers large potential for better understanding, modeling and
visualizing our natural and artificial ecosystems, using IoT as a pervasive sensing infrastructure.
This paper scratches the surface of this potential, providing some representative examples of how the
future research in this domain is expected to move forward.
Author Contributions: A.K. and F.O.O. designed the research, analyzed the data, organized the content and
presented the paper together.
Funding: This research received no external funding.
Conflicts of Interest: The authors declare no conflict of interest.
References
1. Gershenfeld, N.; Krikorian, R.; Cohen, D. The internet of things. Sci. Am. 2004, 291, 76–81. [CrossRef]
[PubMed]
2. Kamilaris, A.; Pitsillides, A.; Yiallouros, M. Building energy-aware smart homes using web technologies.
J. Ambient Intell. Smart Environ. 2013, 5, 161–186.
3. Kamilaris, A.; Pitsillides, A.; Prenafeta-Boldu, F.; AlI, M. A web of things based eco-system for
urban computing—Towards smarter cities. In Proceedings of the 24th International Conference on
Telecommunications (ICT), Limassol, Cyprus, 3–5 May 2017.
4. Kamilaris, A.; Gao, F.; Prenafeta-Boldu, F.; Ali, M. Agri-IoT: A semantic framework for Internet of
Things-enabled smart farming applications. In Proceedings of the IEEE World Forum on Internet of
Things (WF-IoT), Reston, VA, USA, 12–14 December 2016.
5. Lane, N.; Miluzzo, E.; Lu, H.; Peebles, D.; Choudhury, T.; Campbell, A. A survey of mobile phone sensing.
IEEE Commun. Mag. 2010, 48. [CrossRef]
6. Wilde, E.; Kofahl, M. The locative web. In Proceedings of the First International Workshop on Location and
the Web (LOCWEB ’08), Beijing, China, 22 April 2008; pp. 1–8.
7. Ereth, J. Geospatial Analytics in the Internet of Things. 2018. Available online: https://www.eckerson.com/
articles/geospatial-analytics-in-the-internet-of-things (accessed on 5 July 2018).
8. Bisio, R. How Spatial Data Adds Value to the Internet of Things. 2018. Available online:
http://internetofthingsagenda.techtarget.com/blog/IoT-Agenda/How-spatial-data-adds-value-to-the-
internet-of-things (accessed on 5 July 2018).
9. Kamilaris, A.; Pitsillides, A. Mobile phone computing and the Internet of Things: A survey. IEEE Internet
Things (IoT) J. 2016, 3, 885–898. [CrossRef]
10. Zeimpekis, V.; Giaglis, G.; Lekakos, G. A taxonomy of indoor and outdoor positioning techniques for mobile
location services. ACM SIGecom Exch. 2002, 3, 19–27. [CrossRef]
11. Kamilaris, A.; Kartakoullis, A.; Prenafeta-Boldú, F. A review on the practice of big data analysis in agriculture.
Comput. Electron. Agric. Int. J. 2017, 143, 23–37. [CrossRef]
12. Puiu, D.; Barnaghi, P.; Tönjes, R.; Kümper, D.; Ali, M.I.; Mileo, A.; Parreira, J.X.; Fischer, M.; Kolozali, S.;
Farajidavar, N.; et al. Citypulse: Large scale data analytics framework for smart cities. IEEE Access 2016,
4, 1086–1108. [CrossRef]You can also read