Exchange of information and bank deposits in international financial centres - Pierce O'Reilly Kevin Parra Ramirez Michael A. Stemmer - OECD
←
→
Page content transcription
If your browser does not render page correctly, please read the page content below
OECD Taxation Working Papers No. 46

Exchange of information
 and bank deposits in Pierce O'Reilly
 Kevin Parra Ramirez
 international financial Michael A. Stemmer
 centres
 https://dx.doi.org/10.1787/025bfebe-en

1 OECD Taxation Working Papers Exchange of Information and Bank Deposits in International Financial Centres Pierce O’Reilly Kevin Parra Ramirez Michael A. Stemmer EXCHANGE OF INFORMATION AND BANK DEPOSITS IN INTERNATIONAL FINANCIAL CENTRES © OECD 2019 PUBE
OECD Working Papers should not be reported as representing the official views of the OECD or of its
member countries. The opinions expressed and arguments employed are those of the author(s).
Working Papers describe preliminary results or research in progress by the author(s) and are published to
stimulate discussion on a broad range of issues on which the OECD works. Comments on Working Papers
are welcomed, and may be sent to the Centre for Tax Policy and Administration, OECD, 2 rue André-
Pascal, 75775 Paris Cedex 16, France (ctp.contact@oecd.org).
This working paper has been authorised for release by the Director of the OECD Centre for Tax Policy and
Administration, Pascal Saint-Amans.

 Please cite as:
 O’Reilly, P., K. Parra Ramirez and M. A. Stemmer (2019), "Exchange of Information and Bank Deposits in International
 Financial Centres", OECD Taxation Working Papers, No. 46, OECD Publishing, Paris, https://doi.org/10.1787/025bfebe-en.

This document and any map included herein are without prejudice to the status of or sovereignty over any
territory, to the delimitation of international frontiers and boundaries and to the name of any territory, city
or area.

Note by Turkey:
The information in this document with reference to “Cyprus” relates to the southern part of the Island. There
is no single authority representing both Turkish and Greek Cypriot people on the Island. Turkey recognises
the Turkish Republic of Northern Cyprus (TRNC). Until a lasting and equitable solution is found within the
context of the United Nations, Turkey shall preserve its position concerning the “Cyprus issue”.
Note by all the European Union Member States of the OECD and the European Union:
The Republic of Cyprus is recognised by all members of the United Nations with the exception of Turkey.
The information in this document relates to the area under the effective control of the Government of the
Republic of Cyprus.

© OECD 2019

 The use of this work, whether digital or print, is governed by the Terms and Conditions to be found at
 www.oecd.org/termsandconditions.
3 Acknowledgements The authors would like to thank Pascal Saint-Amans for initiating and supporting the collaboration with the Banque de France. Moreover, the provision of data and valuable comments by staff at the Bank for International Settlements during the writing process are gratefully acknowledged. This paper has greatly benefited from support, comments and suggestions provided by David Bradbury and Bert Brys at the OECD and by Delegates of Working Party No. 2 on Tax Policy Analysis and Tax Statistics of the OECD Committee on Fiscal Affairs. The authors wish to thank participants for comments at the 9th Annual IRS/TPC Joint Research Conference and the OECD CTPA Tax Policy Seminar. The authors would also like to thank Marc-Alain Bahuchet, Sebastian Beer, Monica Bhatia, Maria Borga, Anzhela Cédelle, Ruud de Mooij, Donal Godfrey, Sarita Gomez, Peter Green, Niels Johannesen, Äsa Johansson, Philip Kerfs, Laurence Lelogeais, Giorgia Maffini, Zayda Manatta, Bethany Millar-Powell, Valentine Millot, Tom Neubig, Lyndsay Smyth, Stéphane Sorbe, Alastair Thomas, Hervé Thoumiand and Gabriel Zucman for highly valuable comments and input. Thanks also to Violet Sochay for administrative support and Hazel Healy and Carrie Tyler for assistance with the publication. EXCHANGE OF INFORMATION AND BANK DEPOSITS IN INTERNATIONAL FINANCIAL CENTRES © OECD 2019

5 Table of contents Acknowledgements 3 Summary 7 1 Introduction 9 1.1 The literature on exchange of information and international financial centres 9 1.2 Paper outline 12 2 Assessing changes in IFCs using cross-border banking statistics 14 2.1 Stylised facts of deposits in BIS reporting countries 18 2.2 Stylised facts on the expansion of the EOI network 22 3 Investigating the impact of EOI on cross-border bank deposit holdings 26 3.1 Key hypotheses and methodological approach 26 3.2 Main results for liabilities of IFCs with respect to non-IFCs 28 3.3 Accounting for multicollinearity 33 4 Robustness checks 40 4.1 The effect of EOI across jurisdiction pairs 40 4.2 The potential impact of voluntary disclosure and amnesty programmes 40 4.3 Differing definitions of international financial centres 42 5 Conclusion and future research 44 References 45 Annex A. Further tables 48 EXCHANGE OF INFORMATION AND BANK DEPOSITS IN INTERNATIONAL FINANCIAL CENTRES © OECD 2019

7 Summary This paper presents the results from new work to assess the impact of increasing tax transparency and exchange of information (EOI) on cross-border financial activity using bank deposit data. Since 2009, there has been a dramatic increase in tax transparency around the world, stemming from the implementation of new standards of exchange of information on request (EOIR) and automatic exchange of information (AEOI). Examining cross-border financial activity in light of these initiatives can help assess whether these standards have strengthened tax compliance. The paper focuses on one aspect of international financial activity: cross-border bank deposits1, using a dataset from the Bank for International Settlements (BIS), which provides bilateral data on bank deposits for up to 47 jurisdictions from 2000 to 2019. It evaluates the changes in these deposits in response to increasing tax transparency and EOI. The analysis focuses on bank deposits of non-banks (which include non-bank financial institutions, general government, households, and corporations).2 In particular, this paper presents the following results: Bank deposits in International Financial Centres (IFCs) from non-bank counterparties increased substantially over the period from the early 2000s to 2008, reaching a peak of USD 1.7 trillion in the second quarter of 2008.3 Since then, these deposits have fallen substantially, by USD 410 billion or 24% by the first quarter of 2019. A large part of this reduction came in the immediate aftermath of the financial crisis – deposits fell by 13% following the start of the crisis, from the second quarter of 2008 to the second quarter of 2011. The decrease has continued since then by a further 11%. The extent to which this decline can be attributed to decreased tax evasion in response to tax transparency and EOI, reduction in base erosion and profit shifting (BEPS) activity, or other (potentially also non-tax) factors, cannot be established with precision. However, the analysis of the changing financial holdings against the signature of the EOI agreements suggests that tax transparency and EOI play a material role in these changes. The reduction has varied across jurisdictions: while some have seen substantial reductions, others have experienced an increase in cross-border bank deposits. The paper presents a regression analysis of the impact of EOI on bank deposits, following the approach of Johannesen and Zucman (2014[1]), but with a longer time series and an expanded number of reporting jurisdictions. A contribution of this paper is that it accounts for EOIR relationships established through the Multilateral Convention on Mutual Administrative Assistance on Tax Matters (the MAC), and for the widespread adoption of the Standard for Automatic Exchange of Financial Account Information (AEOI). These represent material changes in the global tax transparency and EOI landscape since the Johannesen and Zucman (2014[1]) study was carried out. 1 Details of the definition of bank deposit used in the study are discussed below in footnote 10. 2 Details of the definition of non-banks used in the study are discussed below in footnote 11. 3 The definition of IFCs is based on that of IMF (2000[18]), as discussed below in Box 3. EXCHANGE OF INFORMATION AND BANK DEPOSITS IN INTERNATIONAL FINANCIAL CENTRES © OECD 2019
8 Signature of an agreement that enables EOIR between an IFC and a non-IFC is associated with an average reduction in bank deposits in the IFC with respect to the non-IFC counterparty of between 9% and 10% from the first signatures in 2009 until 2014, depending on the specific model used in the regression analysis. This is consistent with earlier findings in the literature, including Johannesen and Zucman (2014[1]) and Menkhoff and Miethe (2019[2]). Commencement of AEOI in 2017 and 2018 is associated with a further reduction in bank deposits of 22%. When also accounting for the Foreign Account Tax Compliance Act (FATCA), the association declines to about 17%. The paper concludes with an assessment of potential future uses of international investment data for exploring the impact of tax transparency and EOI. This includes further analysis of foreign portfolio investment data or other assets hitherto not covered under EOI to hide wealth such as art or real property. EXCHANGE OF INFORMATION AND BANK DEPOSITS IN INTERNATIONAL FINANCIAL CENTRES © OECD 2019

9 1 Introduction 1. In 2009, in response to widespread international concern about tax evasion, the G20 declared that ‘the era of bank secrecy is over’. 4 Since then there has been a dramatic expansion in tax transparency worldwide. At present, over 150 jurisdictions have committed to implement the standard of exchange of information on request (EOIR) and 130 jurisdictions now participate in the Convention on Mutual Administrative Assistance in Tax Matters (the MAC), which provides an international legal basis for all types of exchanges, with more countries joining each year. More than 100 jurisdictions have committed to exchanging information related to offshore accounts automatically and over 90 have already commenced exchanges. These new initiatives have marked a step change in the global commitment to tax transparency. 2. These changes have brought with them significant interest among stakeholders in understanding the impact of exchange of information (EOI), to both assess its effectiveness and identify strategies that could improve its functioning. These stakeholders include member jurisdictions of the Global Forum on Transparency and Exchange of Information for Tax Purposes (the Global Forum), the private sector, non- governmental organisations and the public. This paper provides results using cross-border banking statistics to provide an assessment of the impact of EOI. 3. There is a growing literature using international financial statistics to assess offshore activity and tax evasion, as well as stocks of potentially hidden wealth. There is also a literature using international investment data to assess the impact of EOI. In many instances, however, studies have suffered from a lack of available data in both investments and treaties signed, as well as from challenges in accurately assessing whether changes, discrepancies, or asymmetries in these data reflect offshore activity and changes in this activity, or whether they represent measurement error or other factors. Using unique data, this paper provides a comprehensive assessment of the impact of EOI on cross-border bank deposits. 1.1 The literature on exchange of information and international financial centres 4. The literature on the impact of EOI is small but growing. 5 Using data on cross-border financial liabilities in international financial centres (IFCs) has been a key means of assessing the impact of EOI. In an early paper, Johannesen and Zucman (2014[1]) showed that bank liabilities in IFCs had not declined significantly since the expansion of EOI in 2008, following the G20 declaration that the era of bank secrecy was over. While they did find evidence that some low-tax jurisdictions did experience a fall in bank deposits in the aftermath of the signature of new EOIR agreements, these authors argued that the lack of a broad decline in deposits in IFCs suggested that taxpayers responded to EOIR by transferring deposits to other non-exchanging IFCs: [… so far,] treaties have led to a relocation of bank deposits between tax havens but have not triggered significant repatriations of funds … A comprehensive network of treaties providing for automatic exchange of 4 G20 Leaders Statement, London, UK. http://www.oecd.org/newsroom/44431965.pdf 5 This literature is more extensively summarised in Menkhoff and Miethe (2019[2]) and well as in OECD (2018[30]). EXCHANGE OF INFORMATION AND BANK DEPOSITS IN INTERNATIONAL FINANCIAL CENTRES © OECD 2019
10 information would put an end to bank secrecy and could make tax evasion impossible (Johannesen and Zucman, 2014[1]). At the time this paper was published, the network of EOIR relationships was far from comprehensive (see Section 2 below). 5. Since the publication of the Johannesen and Zucman (2014[1]) paper, the tax transparency environment has continued to evolve, and several papers have used more up to date data to assess the impact of continuing developments. Each of these studies has found that EOIR and AEOI are, to varying degrees, associated with reductions in bank deposits in IFC jurisdictions. Figure 1 compares the studies cited above and shows the different estimates of the extent to which EOIR and AEOI have led to a decline in IFC deposits. Table 1 compares the above studies in terms of their varying sample sizes, time periods covered, and different jurisdictions defined as IFCs. 6. Menkhoff and Miethe (2019[2]) repeat and extend the analysis of Johannesen and Zucman (2014[1]) by analysing both inflow and outflow deposits held in the non-IFC and IFC jurisdictions. They find that EOIR is associated with a significant, but declining impact in the bank deposits held in IFC jurisdictions from non-IFCs after the signature of an EOIR agreement. They also find mirroring but lagged reactions to deposits in non-IFC jurisdictions from IFCs. Finally, they find a significant impact on IFC deposits from activation of AEOI agreements under the Common Reporting Standard (CRS). Casi, Spengel and Stage (2018[3]) carry out a difference-in-differences analysis, with a sole focus on AEOI and a sample limited to the years from 2014 to 2017. They argue that this reduced sample allows them to better focus on the impact of AEOI, and find that AEOI is associated with a statistically significant reduction in bank deposits in IFCs. Beer, Coelho and Leduc (forthcoming[4]) extend this analysis by assessing EOIR, AEOI and Foreign Account Tax Compliance Act (FATCA) with a longer time period covered and an increased IFC sample similar to Johannesen and Zucman (2014[1]). Finally, Ahrends and Bothner (2019[5]) employ a difference-in-differences model to estimate successfully the impact of AEOI on non-IFC deposits. 7. In addition to the papers focusing on the impact of EOI on bank deposits, several other papers in the literature analyse the effects of EOI on other forms of financial assets. Hanlon, Maydew and Thornock (2015[6]) and De Simone, Lester and Markle (2019[7]) focus on the response of portfolio holdings of IFCs in the United States in the aftermath of the implementation of FATCA, and find that the implementation of FATCA agreements between the United States and IFCs is associated with reduced portfolio investment from those IFCs in the United States. Heckemeyer and Hemmerich (2018[8]) assess the response of portfolio holdings of IFCs in securities markets in OECD countries. They find that EOIR is associated with reduced portfolio investment in securities markets in OECD countries by IFC jurisdictions participating in EOI. Kemme, Parikh and Steigner (2017[9]) find similar results, albeit with more modest effects of the expansion of EOI on portfolio activity. 8. Other papers have analysed the impact of EOI in using other data. Omartian (2016[10]) employs data from international data leaks to argue that EOI is associated with declines in company incorporations in IFCs. Johannesen et. al. (2018[11]) use Internal Revenue Service (IRS) tax administration data and find that expanded enforcement initiatives in the United States have resulted in approximately 60,000 individuals disclosing offshore accounts with a combined value of around USD 120 billion, corresponding to around USD 0.7- 1.0 billion in additional tax revenue. 9. Against this background, this paper makes several contributions to the literature. First, it expands on the work of Johannesen and Zucman (2014[1]) by employing a larger sample in terms of time and country coverage than is available to other researchers. Second, unlike other papers in the literature, this paper accounts for the impact of the rapid expansion in EOI networks that has occurred through the signature of the MAC since 2010. By jointly testing for EOIR signatures, the impact of the announcement by jurisdictions of their commitment to implement AEOI and the commencement of exchanges under AEOI, it provides a comprehensive assessment of EOI impact and shows that the size of the banking sector in IFCs has been EXCHANGE OF INFORMATION AND BANK DEPOSITS IN INTERNATIONAL FINANCIAL CENTRES © OECD 2019
11 substantially limited by the expansion of the EOI network. Finally, it highlights the overall decrease in deposits in IFCs as evidence that EOI has improved tax compliance. Figure 1. Estimates of the decrease in IFC deposits associated with EOI in the literature EOI impact expressed in percentage decline of deposits in IFCs based on baseline estimations in the respective articles Note: The EOI effects on deposits expressed in percentages have been recalculated where necessary based on the formula 100 * exp(estimated coefficient) - 1. This transformation accounts for log-linear specifications in the estimated models of the respective articles. Source: Authors’ calculations based on the relevant literature cited. EXCHANGE OF INFORMATION AND BANK DEPOSITS IN INTERNATIONAL FINANCIAL CENTRES © OECD 2019
12 Table 1. The existing literature employs different sample lengths and IFC lists Articles Sample IFC sample length Johannesen and Q4 2003 – Austria; Belgium; Cayman Islands; Chile; Cyprus; Guernsey; Isle of Man; Jersey; Zucman (2014) Q2 2011 Luxembourg; Macau, China; Malaysia; Panama; Switzerland Casi, Spengel and Q4 2014 – Guernsey; Hong Kong, China; Isle of Man; Jersey; Macau, China Stage (2018) Q3 2017 Ahrends and Bothner Q1 2009 – Austria; Belgium; Chile; Guernsey; Hong Kong, China; Isle of Man; Jersey; (2019) Q4 2017 Luxembourg; Macau, China; Switzerland Menkhoff and Miethe Q1 2003 – Belgium; Chile; Guernsey; Ireland; Isle of Man; Jersey; Luxembourg; Switzerland (2019) Q4 2017 Beer, Coelho and Q1 1995 – Austria; Bahamas; Bahrain; Belgium; Bermuda; Chile; Netherlands Leduc (forthcoming) Q2 2018 Antilles/Curaçao6; Cyprus; Guernsey; Hong Kong, China; Isle of Man; Jersey; Luxembourg; Macau, China; Panama; Singapore; Switzerland Source: Based on the relevant literature cited. 1.2 Paper outline 10. The remainder of this paper proceeds as follows. Section 2 focuses on a specific data source of cross-border financial activity: Locational Banking Statistics (LBS) available from the Bank for International Settlements (BIS). It provides some stylised facts about the data and notes the overall decline in deposits of banks in IFCs held by non-bank counterparties over the last ten years. It also describes the expansion of EOI over this period. 11. Section 3 provides results of a regression analysis on the impact of EOI agreements between two jurisdictions on cross-border bank deposits.7 The results suggest that when an IFC jurisdiction signs or commits to an EOI agreement with a non-IFC jurisdiction, the stock of bank deposits in that IFC with respect to counterparties in non-IFC jurisdictions decreases. Statistically significant results are found for the commencement of AEOI exchanges. The results also suggest that the impact of EOIR changes over time. Initial EOIR agreements signed in the aftermath of the commencement of peer review in 2009 had a strong impact. However, the impact of each additional agreement has been more muted, potentially due to the increasingly multilateral nature of the EOIR network. 12. These results show the impact of tax transparency on bank deposits in IFCs, which suggests that secrecy is one of the features attracting wealth to these jurisdictions. Following an EOI agreement, tax authorities can obtain access to banking information. This means that the risks of engaging in tax evasion increase for holders of undisclosed bank deposits. The drop in offshore holdings in the aftermath of the EOI agreements suggests that EOI is successful in reducing bank deposits that were concealed from tax authorities in IFCs. 13. Section 4 concludes with a series of robustness checks that examine the results in Section 3 in more detail. It provides further evidence that the decline in bank deposits in IFCs associated with expanded EOI is linked to tax evasion by demonstrating that the decline is not present in non-IFCs. It assesses whether the results in Section 3 vary depending on the definition of IFCs and compares the 6 In the BIS LBS, data for Netherlands Antilles are succeeded by data for Curaçao. See BIS (2017), BIS locational banking statistics: explanation of the data structure definitions https://www.bis.org/statistics/dsd_lbs.pdf. 7 For the purposes of this paper, an EOI agreement includes all types of agreements enabling EOI, such as the MAC, bilateral tax treaties containing an article for exchange of information or bilateral tax information exchange agreements (TIEAs). EXCHANGE OF INFORMATION AND BANK DEPOSITS IN INTERNATIONAL FINANCIAL CENTRES © OECD 2019
13 impact of EOI with the impact of voluntary disclosure programmes implemented domestically in various jurisdictions. Section 5 concludes the paper with suggestions for possible future research in this area. EXCHANGE OF INFORMATION AND BANK DEPOSITS IN INTERNATIONAL FINANCIAL CENTRES © OECD 2019
14 2 Assessing changes in IFCs using cross-border banking statistics 14. Bank deposits are a key component of cross-border investment activity. The BIS publishes quarterly data on bank liabilities in the LBS, including both deposits and banks’ other holdings of securities aggregated at the jurisdiction level. For example, in the case of France, it publishes total deposits held by French residents in foreign banks and total deposits held by foreign residents in French banks. 15. As discussed in Section 1.1, data on banking activity have been used repeatedly to study the impact of EOI (Johannesen and Zucman, 2014[1]; Huizinga and Nicodème, 2004[12]; Menkhoff and Miethe, 2019[2]). There are several reasons for this. Access to banking information that is “foreseeably relevant” for tax purposes is specifically provided for under EOIR agreements. Furthermore, information on bank deposits held abroad is one of the information categories covered by the AEOI Standard. This means that, to the extent that there are changes in cross-border investment activity because of EOI, bank deposits should be one of the assets most directly affected. 16. Moreover, banking data is among the best-quality data available on international financial activity. In recent years, the BIS has made substantial amounts of data publicly available to researchers. These data include bilateral information for reporting jurisdictions, which are data on assets held in the reporting jurisdiction by a resident of a counterparty jurisdiction. The coverage of the BIS data is further described in Box 1. 17. This paper, like others in the literature, focuses on bank deposits of non-bank actors and, in particular, on bank deposits in IFCs held by non-bank residents of non-IFCs (i.e., the category of ‘loans and deposits’ in Table 2). This is discussed further in Box 2. Focusing on non-bank deposits involves excluding banks’ deposits with respect to other banks and their own affiliates abroad, as banks’ lending to each other on the inter-bank market is unlikely to be impacted substantially by EOI expansion. 18. The non-bank category includes households, corporates, general government, non-corporate enterprises such as trusts, and other non-financial institutions (e.g., charities and foundations). Even though this is a narrower category than all bank liabilities, even this category is broad and presents a number of challenges from the perspective of accurately assessing the impact of EOI. While some entities may be used by individuals to evade taxes, others may be engaged in legitimate business purposes. An important caveat to the analysis is that various types of non-bank actors may respond to EOI differently, which influences the results presented in the analysis below. 19. A few additional limitations of the BIS LBS are noteworthy. The data are recorded as end-of-quarter observations and as such constitute stocks. These data thus only provide a snapshot of deposits at a given point in time and cannot provide details of flows over periods compared to flow variables. Moreover, the deposit data are collected on the basis of immediate rather than ultimate ownership. EXCHANGE OF INFORMATION AND BANK DEPOSITS IN INTERNATIONAL FINANCIAL CENTRES © OECD 2019
15 Box 1. Coverage of the BIS data The BIS public locational banking statistics There are 47 reporting jurisdictions in the public BIS file. Of these, 29 jurisdictions have bilateral counterparty data in the public file, including: Australia; Austria; Belgium; Brazil; Canada; Chile; Chinese Taipei; Denmark; Finland; France; Greece; Guernsey; Hong Kong, China; Ireland; Isle of Man; Italy; Jersey; Korea; Luxembourg; Macau, China; Mexico; Netherlands; Philippines; South Africa; Spain; Sweden; Switzerland; the United Kingdom and the United States. Restricted BIS data provided to the Banque de France Of the 29 jurisdictions reporting in the public file, seven provide time series extensions in the restricted sample of the BIS. 14 further jurisdictions have provided restricted but close to full bilateral data to the BIS for various time periods. However, the data supplied pertain to varying dates. The confidential bilateral data reported to the BIS are not accessible and hence not used in the paper. EXCHANGE OF INFORMATION AND BANK DEPOSITS IN INTERNATIONAL FINANCIAL CENTRES © OECD 2019
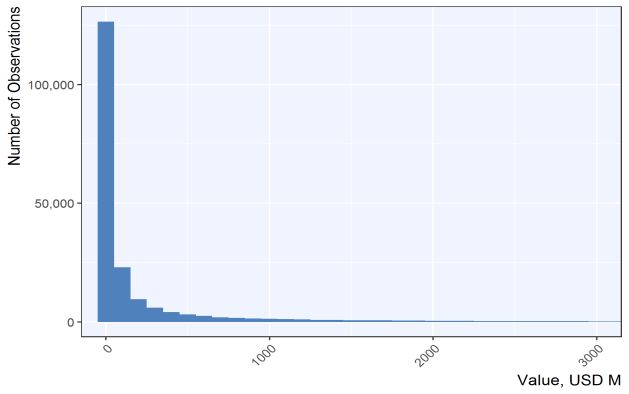
16 Table 2. Variables available in locational banking statistics Measure Balance Type of Currency Currency type of Type of Counterparty Position type sheet instrument denomination reporting reporting sector position country institution Stocks Total All instruments All currencies All currencies All reporting All sectors Cross-border liabilities banks Break adjusted Total Debt Swiss Franc Foreign currency Foreign Banks, total9 All changes claims securities8 branches Debt securities, Euro Domestic Foreign Banks, related Local short-term currency subsidiaries offices Loans and Pound Sterling Unclassified Domestic Banks, central Unallocated deposits10 currency banks banks Other Japanese Yen Non-banks, instruments total11 Unallocated by US Dollar Non-bank instrument financial institutions All other currencies Non-financial sectors Unallocated Unallocated by currencies sector Note: Data series highlighted in bold are the focus of the analysis in this paper. Source: Authors’ calculations based on BIS LBS. Box 2. Bank deposits and bank liabilities One issue in examining the impact of EOI on financial activity in IFCs is choosing the most appropriate outcome variable for the analysis. In assessing the impact of EOI on asset holdings in or through IFCs, a goal should be to analyse those financial assets that would be impacted by EOI, i.e. those financial assets that are likely to be held by potential tax evaders. Bank deposits held by individuals are one clear example of an asset class that may be impacted by EOI. This can be the case whether they are held directly or as part of structures designed to conceal beneficial ownership. There is early evidence of the importance of bank deposits in the academic literature on tax evasion. Using data on Swiss bank liabilities, Zucman (2013[13]) estimates that bank deposits form approximately 25% of global hidden wealth. Using data from the Italian voluntary disclosure programme for hidden assets, Pellegrini, Sanelli, and Tosti (2016[14]) find that while bank deposits are the most commonly 8 Banks’ holdings of debt securities are defined as comprising assets in all negotiable short and long-term debt instruments (see Box 2). 9 Generally defined as institutions whose business it is to receive deposits and/or close substitutes for deposits, and to grant credits or invest in securities on their own account. Within the scope of the BIS locational banking statistics only, official monetary authorities including the BIS and the ECB are also regarded as banks. Can refer to banks’ head offices or affiliates. Money market funds, investment funds and pension funds are excluded from this category (Bank for International Settlements, 2013[16]). 10Deposits comprise all claims reflecting evidence of deposit, including non-negotiable certificates of deposit (CDs), which are not represented by negotiable securities (see Box 2). 11All entities (including individuals but excluding official monetary authorities) other than those defined as “banks”. A BIS definition of a bank is provided in footnote 9. General government and public corporations are part of the non- bank sector (Bank for International Settlements, 2013[16]). EXCHANGE OF INFORMATION AND BANK DEPOSITS IN INTERNATIONAL FINANCIAL CENTRES © OECD 2019
17 repatriated asset class, they comprise 13.5% of total disclosed wealth. A more recent study by Alstadsaeter, Johannesen and Zucman (2018[15]) allocates a wealth equivalent of about 10% of global gross domestic product (GDP) to IFCs. The definition of bank deposits versus bank liabilities While bank deposits are often an asset class discussed in the literature and media on tax evasion, it is important to understand how they are defined in the data used in this study. In the BIS LBS Reporting Guidelines, bank deposits are defined as “all claims reflecting evidence of deposit – including non- negotiable certificates of deposit (CDs) – which are not represented by negotiable securities.” This includes “[f]unds received by banks from non-residents in any currency or from residents in foreign currency on a trust basis. The BIS reporting guidelines also note that “[f]unds lent or deposited on a trust basis in banks’ own name, but on behalf of third parties, with non-residents in any currency or with residents in foreign currency, represent international assets which also fall into the category of loans and deposits”. Bank deposits also include working capital between related banks (Bank for International Settlements, 2013[16]). The other major component of banks’ overall liabilities in the BIS LBS is banks’ holdings of securities. Banks’ holdings of securities are defined as “comprising assets in all negotiable short and long-term debt instruments (including negotiable CDs, but excluding equity shares, investment fund units and warrants) in domestic and foreign currency issued by non-residents and all such instruments in foreign currency issued by residents. Banks’ holdings of debt securities should include those held in their own name and those held on behalf of third parties as part of trustee business” (Bank for International Settlements, 2013[16]). Bank deposits and bank liabilities in international financial centres Data is available in the BIS LBS for both bank liabilities and bank deposits, with differing degrees of detail. This study focuses on bank deposits alone, omitting securities from consideration. There are several reasons for this. First, the reporting quality of information for securities is uneven. Some countries do not collect or report high-quality data on securities as a part of bank liabilities in the BIS data, which means that it is difficult to compare those countries that do include securities in their overall figures of bank liabilities with those countries that do not. A key reason for this is that it is challenging for banks to know the counterparty country and sector of the holders for tradable securities. Second, bank deposits (as opposed to broader bank liabilities) may offer a better proxy of the taxpayer activity that EOI tries to address. This is because securities held in banks in IFCs may be held there not on behalf of individual households who may be hiding wealth, but on behalf of mutual funds or other asset management companies who locate in IFCs due to regulatory or other considerations. Several of the IFCs with large bank liabilities in the BIS data, such as Bermuda, Luxembourg or the Cayman Islands, are well-known centres for asset management activity.12 Where mutual funds or hedge funds buy and sell assets, they may hold these assets on deposit with banks, who act as custodians of behalf of the funds. It is likely that these kinds of bank liabilities will be less responsive to the expansion of EOI when compared to bank deposits held by individual taxpayers, or held by these taxpayers through companies. This means that a broader definition of bank liabilities inclusive of securities may function less well as a proxy for overall assets being hidden in IFCs relative to focusing on bank deposits alone. 12 These stylised facts are discussed further in Section 2.1. EXCHANGE OF INFORMATION AND BANK DEPOSITS IN INTERNATIONAL FINANCIAL CENTRES © OECD 2019
18 2.1 Stylised facts of deposits in BIS reporting countries 20. Zucman and Johannsen (2014[1]) highlighted the lack of decline in IFC deposits relative to non- IFC deposits in the aftermath of the financial crisis as evidence of the limited impact of EOI. However, as the sample period used in their paper concludes in 2011, it does not take into account the significant further development of the network of exchange relationships after 2011, nor the widespread adoption of the AEOI standard. Since 2011, there has been a change in the overall trend of IFC deposits as compared to non- IFC deposits. In particular, while both IFC and non-IFC deposits declined in the years after the financial crisis, non-IFC deposits have since surpassed pre-crisis levels, while IFC deposits have continued to decline.13 This could suggest that the immediate post-crisis contraction in bank deposits, which affected both IFCs and non-IFCs, was a result of the crisis itself. However, the contraction in IFC deposits (especially those in European and Caribbean IFCs) in more recent years while there has been an expansion in non-IFC deposits points to the potential impact of EOI. 21. Figure 2 shows bank deposits aggregated across IFCs and non-IFCs (in USD millions). Whereas the upper panel displays foreign-owned deposits in all IFCs, the lower panel presents IFC cross-border deposits excluding the Cayman Islands, Hong Kong, China and Macau, China, as discussed below. 22. The broad trends in the data are similar in both charts. Following a peak in 2008, the level of bank deposits declined in both IFCs and non-IFCs. Bank deposits in non-IFCs began a return to pre-crisis levels from 2010 onwards and have recently even surpassed the 2008 peak. However, they continued to decline steadily in IFCs, albeit more gradually when excluding the Cayman Islands. 23. Deposits including all reporting IFC jurisdictions rose substantially in the period since the early 2000s and rose even faster in the period immediately before the global financial crisis, reaching a peak in Q2 2008 (USD 2.5 trillion).14 Since then, deposits of banks in IFCs in respect of non-banks have fallen substantially, by USD 1.055 billion or 42%. Amid an overall declining trend, however, periods of stronger decreases appear. A large part of the total reduction occurred during and in the immediate aftermath of the global financial crisis, where deposits fell by 14% between the second quarter of 2008 and the second quarter of 2010. During the subsequent two years, IFC deposits experienced an even steeper decline of about 12% (from Q2 2010 to Q2 2012) and suffered from another decrease of around 17% during Q2 2013 and Q4 2015. The decrease has continued in recent years by a further 18% since Q1 2016. 24. Figure 2 also presents results with the Cayman Islands Hong Kong, China and Macau, China, omitted from the set of IFCs. This is because there is a particularly strong reduction in bank deposits in the Cayman Islands. Bank deposits in the Cayman Islands have historically been driven by a strong share of bank deposits from financial institutions in the United States (Fichtner, 2016[17]).15 It is likely that domestic regulatory changes in the United States (e.g. the Dodd-Frank Act), have led US financial institutions to significantly reduce bank account activity in the Cayman Islands. Given that this reduction may be driven, at least in significant part, by factors other than changes in the tax transparency environment, separate results are presented for the rest of the sample as well. When excluding the Cayman Islands, the overall downward trend of IFC deposits is more modest. After the peak in Q1 2008 (USD 1.7 billion), deposits fell by USD 410 billion, an equivalent of 24%. However, the overall decline also disguises periods of stronger and weaker declines. During and directly after the financial crisis, IFC deposits decreased strongly by 23% 13 The definition of IFCs is discussed further in Box 3. 14 Reporting IFC jurisdictions are discussed in Box 3 and are highlighted in bold. 15 “Historically, overnight sweep accounts in OFCs such as the Cayman Islands developed because Regulation Q prohibited US banks from paying interest on demand deposit accounts. Regulation Q was repealed in 2011 and this may partly explain the drop in Cayman LBS from US$1800 billion in 2011 to about US$1400 billion” (Fichtner, 2016[17]). EXCHANGE OF INFORMATION AND BANK DEPOSITS IN INTERNATIONAL FINANCIAL CENTRES © OECD 2019
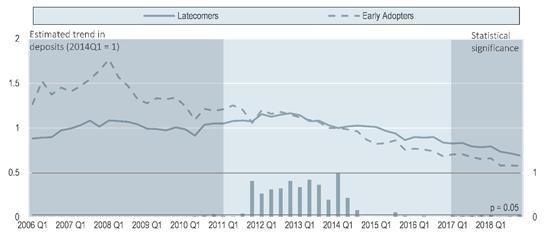
19 between Q1 2008 and Q2 2010. The period between Q2 2011 and Q2 2012 was marked by another decrease of around 8%. Since 2013, deposits have dwindled rather slowly but steadily by around 11%. 25. While cross-border deposits have been stable over time in some IFC jurisdictions, others have experienced an increase around the time of the global financial crisis and a subsequent decrease, which has continued through to the present. Since Q1 2008, declines have been evident in Guernsey, the Isle of Man, and Jersey as well as in the Bahamas and the Cayman Islands. By contrast, Bahrain; Hong Kong, China; Macau, China; Panama and Singapore have experienced an increase in cross-border deposits over time, though in the case of Macau, China and Panama this increase has levelled off in recent years. In Switzerland, a sharp decline in deposits (of just over USD 100 billion) can be noted between June and September of 2013 (the G20 endorsed the AEOI standard in September 2013 and Switzerland announces the US-Swiss Bank Program in August 2013).16 17 16 The US-Swiss Bank Program was announced jointly by US and Swiss authorities on August 29, 2013 to resolve potential criminal liabilities of Swiss banks in the United States. Eligible Swiss banks had to advise US authorities of suspected tax-related criminal offenses linked to undeclared US-related accounts. To date 82 Swiss banks benefit from non-prosecution agreements (https://www.justice.gov/tax/swiss-bank-program). 17 This shift may also have been driven by changes in the reporting of trustee deposits. EXCHANGE OF INFORMATION AND BANK DEPOSITS IN INTERNATIONAL FINANCIAL CENTRES © OECD 2019
20 Figure 2. Changes in cross-border bank deposits (2006-2019) The upper panel shows cross-border deposits in non-IFCs and IFCs, the lower panel cross-border deposits in non- IFCs and IFCs excluding the Cayman Islands; Hong Kong, China; and Macau, China. Note: Data are provided for non-bank counterparties only. Data are aggregated across currencies, sectors, reporting institutions, and instrument type. Source: Authors’ calculations based on BIS LBS. Box 3. Definitions of international financial centres The definition of what constitutes an international financial centre is a controversial and challenging subject. In the academic literature, a wide variety of lists have been used, based on a wide variety of criteria. These criteria are often subjective. From the perspective of the assessment of EOI on bank deposits, the ideal focus would be on those jurisdictions that specialise in international banking. This presents an important caveat, as different IFCs may have different specialisations. For example, some IFCs may specialise in insurance activity, some as a centre for hedge fund and mutual fund activity, some in banking activity, some in trust activity, and so on. Assessing the impact of EOI requires a nuanced understanding of the differences across IFC profiles, and therefore of the varying ways the expansion of EOI will affect different IFCs. EXCHANGE OF INFORMATION AND BANK DEPOSITS IN INTERNATIONAL FINANCIAL CENTRES © OECD 2019
21 The list of IFCs used in this study is based on a list of 46 jurisdictions defined by the IMF (2000[18]). This IMF report defines an offshore financial centre (OFC) as follows: “[A] centre where the bulk of financial sector activity is offshore on both sides of the balance sheet (i.e., the counterparties of the majority of financial institutions’ liabilities and assets are non-residents), where the transactions are initiated elsewhere, and where the majority of the institutions involved are controlled by non-residents. OFCs are usually referred to as: Jurisdictions that have relatively large numbers of financial institutions engaged primarily in business with non-residents; Financial systems with external assets and liabilities out of proportion to domestic financial intermediation designed to finance domestic economies; and More popularly, centres which provide some or all of the following services: low or zero taxation; moderate or light financial regulation; banking secrecy and anonymity.” Of the jurisdictions on this IMF list, many smaller centres do not report bank liability data to the BIS. Those who do report to the BIS are the Bahamas, Bahrain, Bermuda, the Cayman Islands; Netherlands Antilles/Curaçao; Cyprus; Guernsey; Hong Kong, China; Ireland; the Isle of Man; Jersey; Luxembourg; Macau, China; Malaysia; Panama; Singapore; and Switzerland. Reporting of bilateral liability and deposit information is even more patchy and has been discussed in Section 2.1. In this paper, the analysis relies on an amended list of IFCs based on the IMF OFC definition. The full list is as follows: Andorra; Anguilla; Antigua and Barbuda; Aruba; Bahamas; Bahrain; Barbados; Belize; Bermuda; British Virgin Islands; Cayman Islands; Cook Islands; Costa Rica; Netherlands Antilles/Curaçao; Cyprus; Dominica; Gibraltar; Grenada; Guatemala; Guernsey; Hong Kong, China; Isle of Man; Jersey; Lebanon; Liechtenstein; Luxembourg; Macau, China; Malaysia; Malta; Marshall Islands; Mauritius; Monaco; Montserrat; Nauru; Niue; Palau; Panama; Saint Kitts and Nevis; Saint Lucia; Saint Vincent and the Grenadines; American Samoa; San Marino; Seychelles; Singapore; Switzerland; Turks and Caicos Islands; United Arab Emirates; Uruguay; and Vanuatu.18 Countries in bold are those that report to the BIS. In the headline results in Section 2.1, the analysis focuses on a decline in deposits in those IFCs from the list above that report to the BIS since 2006, in order to work with a balanced panel and avoid the effect of new reporting countries. The headline results are reported as declines in IFC deposits from non-bank counterparties in all countries including all IFCs. In the headline results, the sample excludes the Cayman Islands, based on the particular nature of the US-Cayman Islands relationship outlined in Section 2.1. For confidentiality reasons, it is not possible to report the overall aggregated decline in deposits with just the Cayman Islands-US series removed, so the entire Cayman Islands series is removed together with Hong Kong, China and Macau, China in Figure 2. In the regression analysis in Section 3, the sample is different, as not all jurisdictions that provide aggregated data provide bilateral data that can be used in the regression analysis. The panel used in the regression analysis is unbalanced. The analysis relies on a regression for all available country-pairs where there are sufficient quarters with and without EOI to estimate the effects. One exception is that in this sample, the US-Cayman Islands series is removed, but the series between Cayman Islands and other jurisdictions are kept in the sample. This means that the sample underlying the headline decline 18 In the BIS LBS, the following jurisdictions report on an aggregated basis or as part of other reporting jurisdictions. Anguilla, Antigua and Barbuda, British Virgin Islands, Cook Islands, Monaco, Montserrat, Niue, Saint Kitts and Nevis, and American Samoa. Given this aggregation, these IFC jurisdictions cannot be analysed separately. For further information, see BIS (2017), BIS locational banking statistics: explanation of the data structure definitions https://www.bis.org/statistics/dsd_lbs.pdf. EXCHANGE OF INFORMATION AND BANK DEPOSITS IN INTERNATIONAL FINANCIAL CENTRES © OECD 2019
22 of 410 billion reported in Section 2.1 and the sample underlying the association with EOIR and AEOI are slightly different. Section 4.3 contains a robustness analysis of the main results in the paper to the inclusion of different IFCs subject to data availability. 2.2 Stylised facts on the expansion of the EOI network 26. Figure 3 shows the expansion of EOI of various forms over the course of the last ten years (see Box 4 for further discussion). There is a steady increase in the global number of bilateral EOIR relationships from 2009 to 2018 (the blue dashed line). However, more striking than the increase in total EOIR relationships is the extent to which this increase is driven by MAC signatures. The number of global MAC- based EOIR relationships expands dramatically post-2012. The chart also shows the dramatic expansion in AEOI – first following the commitment of G20 countries to exchange information automatically in September of 2014, with increasing commitments over the course of 2014. 27. Figure 4 shows the expansion of EOIR in IFCs over the period from 2008 to 2018. The figure shows, for each jurisdiction, the number of EOI relationships of all kinds (under tax information exchange agreements (TIEAs), double tax conventions (DTCs), European Union Directives, the MAC, or any other relevant transparency agreements). The blue line shows the number of EOI relationships that existed for each jurisdiction under the MAC. The flat blue lines in many jurisdictions, followed by sharp rises, serve to highlight the date of MAC signature. It is important to highlight that in some countries MAC signature comprises a larger share of the total EOIR relationships than in others. It is clear, for example, that Switzerland had a large EOIR network prior to MAC signature. This means that many of the EOIR relationships established by Switzerland under the MAC already existed under other agreements. However, for other jurisdictions such as Montserrat for example, it can be noted that agreements under the MAC constitute the vast majority of the EOIR relationships in which the jurisdiction participates. 28. Consideration of the impact of the MAC is particularly important, as this has not been taken into account by previous studies. To our knowledge, none of the major studies in the literature on the impact of EOI have accounted for the relationships generated by the MAC signature in the analysis. Johannesen and Zucman (2014[1]) write that a ‘comprehensive multilateral agreement would prevent tax evaders from transferring their funds from haven to haven.’ The MAC performs exactly this function. EXCHANGE OF INFORMATION AND BANK DEPOSITS IN INTERNATIONAL FINANCIAL CENTRES © OECD 2019
23 Figure 3. Number of bilateral EOI relationships Note: Data on bilateral EOIR agreements post-2017 are preliminary and subject to revision. “EOIR agreement signed” refers to the signature of any agreement that establishes an EOIR relationship, including TIEAs, DTCs, and the MAC itself. To avoid double-counting, agreements that establish an EOIR relationship where one was already in place are not included (e.g. instances where two countries sign a DTC that provides for EOIR where a TIEA already provided for EOIR between the two countries). Source: Data on information exchange agreements provided by the Global Forum. EXCHANGE OF INFORMATION AND BANK DEPOSITS IN INTERNATIONAL FINANCIAL CENTRES © OECD 2019
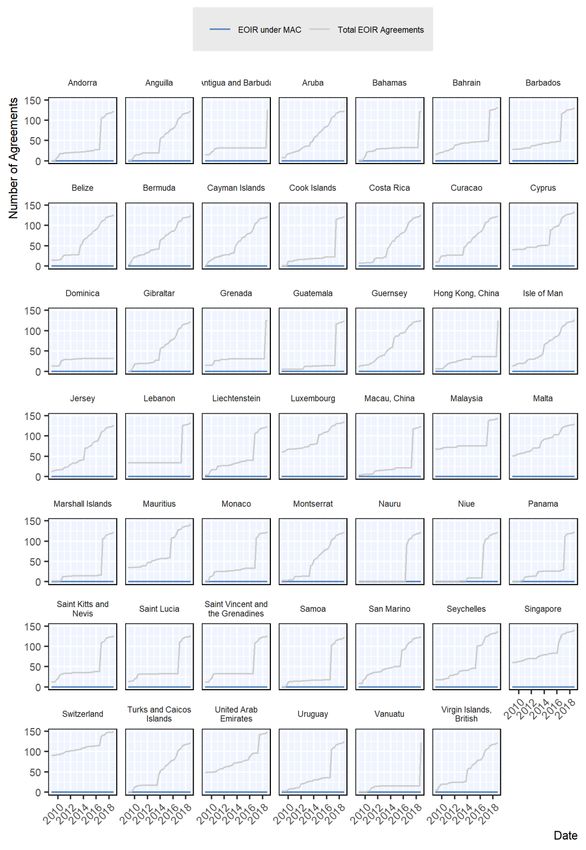
24 Box 4. A timeline of the expansion of tax transparency April 2009: The London G20 summit Communique states that the G20 agree, “to take action against “non-cooperative jurisdictions, including tax havens. We stand ready to deploy sanctions to protect our public finances and financial systems. The era of banking secrecy is over”. September 2009: Global Forum on Transparency and Exchange of Information for Tax Purposes, which earlier comprised OECD countries working with Financial Centres, restructured and membership opened up to all those who commit to the standard of exchange of information on request (EOIR) and agree to undergo a peer review to assess its implementation. 2010-2011: The Convention on Mutual Administrative Assistance in Tax Matters developed jointly by the OECD and the Council of Europe in 1988 and amended by Protocol in 2010. Opened for signature to non-OECD and non-Council of Europe countries in 2011. 2010: The US Foreign Account Tax Compliance Act enters into law. September 2013: The G20 Leaders endorse the OECD proposal for a global model of AEOI and invite the OECD, working with G20 countries, to present such a new single standard for AEOI. August 2014: The Global Forum puts in place a commitment process to enable its members to publicly commit to a timetable to implement the new AEOI Standard. All Global Forum members, other than developing countries that do not house a financial centre, asked to commit to begin automatically exchanging information in accordance with the Standard, reciprocally and with appropriate partners, by 2017 or 2018. September 2014: The full AEOI Standard endorsed by the G20 Finance Ministers at their meeting in Cairns. October 2014: The Global Forum announces commitments to implementation of AEOI, with exchanges to commence by September 2017 or September 2018. October 2014: The first jurisdictions sign the CRS MCAA at the sidelines of the Global Forum Plenary Meeting in Berlin. 2015: Commitments to the new AEOI Standard announced by Bahrain, Panama, Cook Islands, Nauru and Vanuatu subsequent to the Panama Papers Data Leaks. September 2017: The first exchanges take place under the new AEOI standard. End of 2018: Exchanges taking place under the AEOI Standard now cover 90 jurisdictions. EXCHANGE OF INFORMATION AND BANK DEPOSITS IN INTERNATIONAL FINANCIAL CENTRES © OECD 2019
25 Figure 4. EOIR agreements and MAC agreements over time Total number of EOIR agreements signed by each jurisdiction Note: The list of IFCs is based on IMF (2000[18]). Source: Data on information exchange agreements provided by the Global Forum. EXCHANGE OF INFORMATION AND BANK DEPOSITS IN INTERNATIONAL FINANCIAL CENTRES © OECD 2019
26 3 Investigating the impact of EOI on cross-border bank deposit holdings 29. The previous section highlighted that there have been substantial reductions in the size of bank deposits in certain IFCs reported to the BIS. A challenge in assessing the impact of EOI is attempting to identify the extent to which these reductions are a result of EOI or of other factors. There are several aspects to consider. First, changes in bank deposits will be impacted by non-tax factors such as the attractiveness of a jurisdiction’s investment and legal environments, its overall economic growth and recent or impending regulatory changes. Second, even if changes in bank deposits are tax-driven, they may not be due to changes in EOI. For example, in as much as deposits in IFCs potentially represent hidden wealth, it is possible that these deposits have been reduced as a result of other forms of tax enforcement such as targeted audits. In addition, the major data leaks in recent years may have provided information to tax authorities to address tax evasion. 30. In addition, the extent to which offshore bank deposits represent hidden wealth is by no means clear. From a tax perspective, assets held offshore may be fully compliant with tax rules. Where this is the case, these deposits would be expected to be unresponsive to EOI. Changes in IFC bank deposits may also respond to other contemporaneous tax factors including changes in the tax environment of the IFC and the home jurisdiction of the capital owner. These could include changes in statutory rates or changes in tax rules, such as those that might result from implementing the OECD/G20 BEPS package, or temporary voluntary disclosure programmes to incentivise disclosure of funds hidden abroad. Disentangling these various effects constitutes a significant challenge. 31. There is complementary evidence that there has been significant disclosure of previously undisclosed assets, discussed further in Section 4.2. Since the widespread adoption of EOI, an estimated 500,000 individuals have disclosed offshore assets through voluntary disclosure programmes and around EUR 95 billion in additional tax revenue has been identified as a result of voluntary compliance mechanisms and offshore investigations. 19 The fact that these sums were in large part disclosed through voluntary disclosure programs (see Section 4.2) set up in advance of the commencement of AEOI in 2017 points to a relationship between taxpayer behaviour and EOI. However, it is important to recognise that the assets held in foreign jurisdictions that were disclosed may not have been repatriated. These assets could have stayed in foreign jurisdictions. This means that, while quantitative evidence of the link between EOI and reductions in cross-border bank deposits in IFCs is important, it is only one part of the overall picture. 3.1 Key hypotheses and methodological approach 32. While the decline in overall bank deposits in IFCs provides some suggestive evidence of the impact of EOI, it does not fully analyse the impact of EOI at a bilateral level. It is useful to turn to regression analysis to investigate further, whether the advent of EOI can be associated with changes in bank deposits. 19 http://www.oecd.org/tax/oecd-secretary-general-tax-report-g20-leaders-june-2019.pdf EXCHANGE OF INFORMATION AND BANK DEPOSITS IN INTERNATIONAL FINANCIAL CENTRES © OECD 2019
27 The key expectation is that, to the extent that some fraction of deposits of banks in IFCs have historically existed for the purposes of tax evasion, the expansion of EOIR and the introduction of AEOI should have made holding assets in EOI jurisdictions riskier.20 The expected response is that taxpayers would remove their assets from IFCs that commit to, sign or implement EOI agreements with non-IFCs.21 This leads to the following hypothesis: H1: An EOIR agreement between a given IFC and a given non-IFC triggers a reduction in bank deposits held in the IFC by residents of the non-IFC. 33. This hypothesis is tested using the following general regression equation: ( ) = + + (1), where denotes the bank deposits held in jurisdiction i by residents of jurisdiction j in quarter q. This paper focuses on deposits in countries that are IFCs. 2223 It relies on an unbalanced panel of 16 IFCs based on the earlier list with sufficient bilateral deposit relations available. 24 The IFCs included are Bahrain; Bahamas; Bermuda; Netherlands Antilles/Curaçao; Cayman Islands; Cyprus; Guernsey; Hong Kong, China; Isle of Man; Jersey; Luxembourg; Macau, China; Malaysia; Panama; Singapore; and Switzerland. is a dummy variable that denotes whether any kind of EOI relationship exists in quarter q between jurisdictions i and j. 34. This paper examines the two main forms of EOI that have expanded in recent years: EOIR and AEOI. The independent variable for EOIR is the signature of a bilateral or multilateral agreement providing for EOIR. Such an agreement could be a bilateral agreement such as a DTC, a TIEA, or any other relevant multilateral transparency agreement, such as when two jurisdictions sign the MAC. As stated above, signatures of the MAC have particularly expanded during the post-2012 period and have accounted for the majority of EOIR relationships since then. 35. The independent variable for AEOI is either a public commitment to exchange information automatically or the commencement of AEOI under the CRS, or signature of a FATCA Intergovernmental Agreement (IGA).25 All three different approaches to assessing the impact of AEOI are tested below. 20 The approach here follows closely that of Johannesen and Zucman (2014[1]), as well as subsequent examinations of this issue by Casi, Spengel and Stage (2018[3]) and Menkhoff and Miethe (2019[2]). These papers, in turn, build on Huizinga and Nicodème (2004[12]), who used only one year of data as opposed to a panel approach. 21 This may occur at the time of announcement, signature, ratification or entry into force. 22 This excludes confidential bilateral data that is not available. 23 This is not to discount the fact that deposits in non-IFC jurisdictions could respond to EOI as well. Section 4 examines potential deposit reactions between non-IFCs and non-IFCs as well as between IFCs and other IFCs. The issue of “inward” deposit flows is explored further in Menkhoff and Miethe (2019[2]). 24 Each IFC has on average 74 different bilateral deposit relations per year-quarter. To profit most from the data available, an IFC-non-IFC pair has been included when at least four quarters of data were available either side of the relevant EOI independent variable. While earlier studies such as Johannesen and Zucman (2014[1]), Casi, Spengel and Stage (2018[3]) or Beer, Coelho and Leduc (forthcoming[4]) also used unbalanced panels, others like Ahrends and Bothner (2019[5]) or Menkhoff and Miethe (2019[2]) employed balanced panels largely at the expense of IFC coverage. 25 Dates for the commencement of AEOI are taken from Automatic Exchange of Information Implementation Report 2018 (Global Forum on Transparency and Exchange of Information for Tax Purposes, 2018[27]), page 3. AEOI agreements are activated on a bilateral basis and exchanges are also bilateral, which is not taken into account in this analysis. Jurisdiction-pairs are coded 1 if both jurisdictions have begun exchanging information under the CRS or under FATCA, and zero otherwise. However, this does not necessarily mean that they are exchanging with each other. EXCHANGE OF INFORMATION AND BANK DEPOSITS IN INTERNATIONAL FINANCIAL CENTRES © OECD 2019
You can also read