Fiscal Space for Children: An Analysis of Options in Eswatini - February 2018 - UNICEF
←
→
Page content transcription
If your browser does not render page correctly, please read the page content below
Fiscal Space for Children:
An Analysis of Options in
         Eswatini

       February 2018
Table of Contents

List of abbreviations                                                                  5

Preface                                                                                7

Executive Summary                                                                      9

1   Introduction and methodology                                                       11
    1.1       The objective of the Fiscal Space Analysis (FSA)                         11
    1.2       Methodology – priority expenditure                                       11
    1.3       Methodology - the fiscal-space analysis                                  12
    1.4       Data limitations                                                         13
    1.5       Organization of the FSA part                                             13

2   Eswatini’s macroeconomic and fiscal context                                        15
    2.1       Longer-term national economic trends                                     15
          2.1.1   Economic growth and recent developments                              15
          2.1.2   Structure and characteristics of the national economy                16
          2.1.3   Socio-economic trends                                                17
    2.2       Recent macroeconomic developments                                        18
          2.2.1   International trade (and its consequences for the fiscal accounts)   19
          2.2.2   Inflation and exchange rate                                          20
    2.3       Recent fiscal performance                                                22
          2.3.1   Government financial performance                                     22
          2.3.2   Revenue performance                                                  23
          2.3.3   Current expenditure performance                                      24
          2.3.4   Implications for priority expenditure                                27

3   Priority expenditure trends and policy challenges                                  29
    3.1       Priority-expenditure composition and recent evolution                    29
          3.1.1   Priority-expenditure components and fiscal space in recent years     29
          3.1.2   Recent evolution of priority expenditure                             31
    3.2       Sectoral issues in priority expenditure                                  32
          3.2.1   Education                                                            32
          3.2.2   Health                                                               33
          3.2.3   Social welfare                                                       35

4   The base scenario                                                                  39
    4.1       Base scenario and fiscal space “mapping”                                 39

5   Alternative scenarios                                                              43
    5.1       Options to increase fiscal space                                         43
    5.2       Alternative scenarios and projections compared with the base scenario    44
          5.2.1   Increasing tax and non-tax revenue                                   44
          5.2.2   Decreasing non-priority expenditure                                  49
          5.2.3   Improving efficiency of priority sector spending                     50
          5.2.4   Other options for enhancing fiscal space                             51
    5.3       Risks to fiscal space and their impact                                   53
          5.3.1   Weak economic growth                                                 53
          5.3.2   Decrease in SACU transfers                                           54

                                                                                            2
Table of Contents

6   Conclusions                                                                                           57

7   References                                                                                            59

Appendix 1:       Fiscal space projections                                                                61

                                         Fiscal Space for Children: An Analysis of Options in Swaziland        3
List of abbreviations
AGOA Africa Growth and Opportunity Act
ARV Anti-retroviral
CIT Corporate Income Tax
CBS Central Bank of Eswatini
CPI Consumer Price Index
CMA Common Monetary Area
DPMO Deputy Prime Minister’s Office
DSW Departments of Social Welfare
ECCDE Early Childhood Care and Development
FAR Fiscal Adjustment Roadmap
FPE Free Primary Education
FSA Fiscal Space Analysis
FY Financial Year
GDP Gross Domestic Product
IFC International Finance Corporation
IMF International Monetary Fund
MVAF Motor Vehicle Accident Fund
NHSSP National Health Sector Strategic Plan
NDS National Development Strategy
NPF National Pension Fund
OVC Orphaned and Vulnerable Children
PIT Personal Income Tax
SACU Southern African Customs Union
SARB South African Reserve Bank
SRA Eswatini Revenue Authority
U5M Under 5 Mortality
VAT Value Added Tax
Fiscal Space for Children: An Analysis of Options in Swaziland 5Preface
The project team would like to thank the Representative and the staff of UNICEF Eswatini who
provided valuable support to the project. We also extend our sincere appreciation to officials from
the Eswatini Ministry of Finance, the Deputy Prime Minister’s Office and all the line ministries who
participated in this process. We are indebted to the officials within these ministries who made
themselves available at short notice to share their insights and experiences with the project team.
We also take this opportunity to mention the stakeholders from the non-profit sector and the political
parties, who gave of their time to share their thoughts with us. Finally, we express our gratitude to
UNICEF ESARO for their support and help throughout this project.
Fiscal Space for Children: An Analysis of Options in Swaziland 7Executive Summary
Large fiscal deficits in several recent years will put pressure on Eswatini’s ability to expand fiscal
space for child-related priorities in the coming years. These deficits resulted from a combination of
unstable revenues alongside expansionary fiscal policies and in particular an increasing wage bill.
Revenues have been unstable due to Eswatini’s exposure to its larger neighbour South Africa. This
exposure results from long-standing economic ties to South Africa; in particular Eswatini’s reliance
on volatile Southern African Customs Union (SACU) revenues and its currency’s (the Lilangeni) peg
to the Rand. Continuing political and economic policy uncertainty in South Africa thus creates
significant downside risk for the country. A large and expanding public wage bill in Eswatini limits its
ability to respond to volatile revenues. While current debt levels are still relatively low, fiscal deficits
need to be brought under control in the medium term.
This report defines (child-related) “priority” expenditures as that within the sectors of education,
health and social welfare. Expenditures on education and health have been increasing consistently
since FY2011/12, in line with broader expansionary fiscal policy over the period. Social welfare
expenditure has been more volatile, largely due to instability in the Elderly Grant. Total priority
expenditure per capita has declined significantly in US dollar terms from US$916 in FY2012/13 to
US$604 in FY2016/17, although this reduction is almost exclusively the result of the substantial
devaluation of the South African rand (and hence the Lilangeni) relative to the US dollar.
Education receives approximately 60% of priority expenditure, and is dominated by spending
towards primary education. This spending has supported the implementation of the Free Primary
Education Act of 2010, but also results from the high repetition and drop-out rates throughout
primary grades. 70% of secondary school aged learners are still in primary school. These low
throughput rates are a major impediment to the country’s growth. Throughput rates are impacted by
a lack of qualified teachers, the limited public funding towards early childhood development,
inadequate funding of secondary education, the impacts of high (though stabilising) rates of HIV
and the lack of sufficient social welfare transfers to support learners to stay in school. More broadly,
social welfare expenditure should be better targeted towards the poor through the introduction of
effective means testing and case management, alongside expanded child grants.
Several scenarios have been modelled to estimate the fiscal capacity available to increase priority
expenditure. The baseline scenario, which assumes the continuation of recent trends, suggests that
priority expenditures in categories relevant for children would average 12.1 percent of GDP
between the years FY17-18 to FY21-22. Over these same years, in real terms, total priority
expenditures for children averages US$581.7 per child at FY16-17 prices and rates. Under the
base-scenario assumptions the projected flows of priority expenditures for children produce a fiscal-
space financing “gap” that would have to be covered with internal financing. In this scenario the
required internal-financing flow averages 13.6 percent of GDP over the projection years.
One option through which fiscal space can be expanded is through increasing tax and non-tax
revenue. Two scenarios are modelled in this regard. The first assumes an improvement in the
administration of CIT (Corporate Income Tax) and PIT (Personal Income Tax), under the
assumption that the Eswatini Revenue Authority (SRA) is effective in increasing tax compliance
rates over the medium term. In addition, it assumes an increase priority expenditure through an
increase in the elasticity of staff size within the respective priority sectors. The second assumes an
increase in the fuel levy and the imposition of a higher VAT (Value Added Tax) rate on alcohol and
tobacco products. The government of Eswatini has proposed tax revisions for these items in the
Fiscal Space for Children: An Analysis of Options in Swaziland 9past. As the exact proposed revision rates were not available, it is assumed that the size of the fuel
levy increases faster than GDP growth; with the rate of growth incrementally increasing to three
times GDP by end-FY22. Simultaneously, the VAT rate on alcohol and tobacco products gradually
increases to 18% over the projection period (from the standard rate of 14%). While it would likely
not be appropriate to initiate significant tax increases in the current macro-economic environment,
there could be room in the short to medium term for a number of targeted taxation efforts. Such
increases were shown to have relatively small impacts on total government revenue, but could still
be significant to support targeted investments in priority expenditure.
The next scenario assumes that fiscal space is bolstered through increased GDP growth as a result
of enhanced sugar production due to normalisation of weather conditions, maximised crop yields
and strong demand contributing to a strong performance in the sector. The scenario assumes an
average growth rate of 4.2% over the projection period: with growth rising incrementally to a high of
5.0% in FY2021-22; relative to 2% in the baseline scenario. As the National Development Strategy
(NDS) does not explicitly set out GDP growth targets, the Economic Recovery Strategy’s 5% target
is therefore used.1 Additional revenues from increased GDP growth is allocated towards priority
expenditure; resulting in average priority expenditure per child increasing by $22.52 to $602.67.
Another scenario considers redirecting non-priority expenditure to priority sectors, by way of
reducing the proportion of funds expended on defence and police. Currently, the ministries of
defence and police account for 6% and 5% of the budget respectively. This scenario assumes
spending in these areas is halved over a 5 year period and that all the resultant savings are re-
allocated to priority sectors. Relative to the base scenario, per capita priority expenditure is $44.82
higher and priority expenditure as a percentage of GDP 1 percentage point higher. This is a
significant increase, highlighting the potential impact if existing budgets can be reallocated.
Finally, improving budget execution rates in priority sectors is another feasible option for expanding
fiscal space. In 2016/17 government was able to execute 77% of their budget; with the execution
rate for recurrent and non-recurrent expenditure being 85% and 50% respectively.2 As recurrent
expenditures have a fairly high execution rate; this scenario focused on increasing non-recurrent
expenditure. In particular it assumes that non-recurrent expenditure in priority sectors doubles
within 5 years. In this case, the average spending on priority expenditure per child increases slightly
by $12.42 relative to the base scenario. However as this amount is fully allocated to non-recurrent
priority expenditure this is still a significant change; as total non-recurrent priority in this scenario
increases by E222 million or 0.39% of GDP.
Less viable options to increase fiscal space include reducing external debt service through
agreements with creditors, and increasing external debt disbursements. In general, non-
concessional external debt should not be used to fund education and health expenditure. The basic
reason is that the yields from education and health expenditure come only in the long term, beyond
the terms typical of non-concessional external debt. For similar reasons, internal term debt should
not be used to fund recurrent education and health expenditure.
Given Eswatini’s demographic profile and the high number of Orphans and Vulnerable Children
(OVC) in the country, it is critical that both the total amount allocated towards priority sectors is
increased and the effectiveness of priority spending is enhanced. Therefore some combination of
the above scenarios should be considered. While fiscal space is somewhat limited currently,
effective investment in priority sectors is essential if the country is to move onto a stable longer term
growth and development trajectory for the benefit of all its citizens.
1
(AFDB, 2012).
2
Data provided by UNICEF.
10 Fiscal Space for Children: An Analysis of Options in Swaziland1 Introduction and methodology
1.1 The objective of the Fiscal Space Analysis (FSA)
This report analyses the Kingdom of Eswatini government’s recent and future financial capacity to
carry out expenditure on which children depend for their human development and general welfare.
This financial capacity is understood to be the “fiscal space” underlying such expenditure. The
fiscal-space analysis has been carried out using a fiscal-projection model in Excel.
1.2 Methodology – priority expenditure
This report refers to expenditure categories regarded as beneficial to children as “priority”
expenditure. For Eswatini, such priority expenditure categories for children are defined as three
“institutional” expenditure categories: (i) education; (ii) health; and (iii) social welfare.
The composition of the government’s priority expenditures for children is, inevitably, somewhat
arbitrary. Government expenditure classified as “priority” includes aspects that are unrelated, or
only loosely related, to children’s welfare, such as higher education expenditure or expenditure on
an old age grant. At the same time, some expenditure categories classified as non-priority are
highly relevant to children, notably, for example, in the water and sanitation sector. This is
especially important to bear in mind when considering possible scenarios to enhance priority
expenditure by reducing non-priority expenditure. Future analyses of this kind may work with
different definitions of priority expenditures for children. Even so, the methodological approach used
in this study could work in the same way. That is, the methodological approach in itself is a core
recommendation.
It is also important to bear in mind that fiscal space discussions concern only expenditure carried
out by government within its budget. Government expenditure on education and health plainly
constitutes the bulk of the resources dedicated to education and public health in Eswatini. Much of
this expenditure is in categories that only the government carries out, or could carry out.
Nevertheless, non-governmental expenditure in these sectors is also significant. Especially in the
health and social welfare sectors, some important programmes are funded by private and NGO
entities, some of which receive donor support. These would not be included in the government
budget. The present focus, however, is expenditure in the priority sectors that flows through
Eswatini’s fiscal accounts and hence are recorded “on budget.” 3
A final note refers to one of the key measures used in the FSA in order to examine and compare
both historical spending and the variation in priority expenditure under different scenarios, namely
priority spending per child. This measure takes the total spending in the priority expenditure
categories and divides this by the total number of children aged 18 or younger in Eswatini.
However, the figures on per-child priority spending should be treated with caution since only a
proportion of total expenditure at the institutional level benefits children directly. 4
3
While it would be possible to carry out the kind of analysis this chapter describes using an enhanced set of accounts going
beyond the official budget accounts, it may prove challenging to identify and incorporate all relevant expenditure programs
and funding sources.
4
For instance, the old age grant, child grant and school feeding programme together constitute approximately 2.66% of
GDP of which the old age grant is responsible for the majority of this amount. However, in the absence of reliable
historical data that is disaggregated to this level, it is not possible to isolate data strictly focussed on children in all
Fiscal Space for Children: An Analysis of Options in Swaziland 111.3 Methodology - the fiscal-space analysis
To analyse fiscal space for priority expenditure, the methodology first sets from the “identity” that
governs the relationship of priority spending with its underlying fiscal space.
This identity states that total expenditure (comprising current, non-interest, interest, and capital
expenditure) less the sum of total revenue and external grants is equal to the overall deficit, which
is in turn equal to the net flow of external and internal financing. If total expenditure is broken down
into the three categories of (1) priority and (2) non-priority non-interest expenditure and (3) interest
expenditure, this identity can be rearranged for any year as shown in the box.
The “below-the-line” accounts taken together constitute fiscal space for the priority-expenditure
flow. For a retrospective analysis – that is, for analysis of fiscal performance in historical years –
this structure can be applied directly to show how the below-the-line flows (the retrospective fiscal
space) combined to finance the priority expenditure flows. Section 1.3 describes the historical
quantitative analysis for Eswatini, for the years FY2012/13-
Fiscal identity
FY2016/17.
Priority expenditure
=
For the projection analysis, the accounting identity is applied in
Tax and non-tax revenue
a different way. For each projection year, the priority-
+ External grants
expenditure flow is projected on the basis of programming
- Non-priority expenditure
assumptions, encompassing the various determinants of
- External debt service
recurrent and non-recurrent expenditure in the education,
- Internal interest expenditure
health, and social welfare categories. Similarly, the below-the-
+ External debt disbursements
line accounts, except for the net internal financing flows, are
+ Net internal financing flows
projected on the basis of programming assumptions. The total
net internal financing flow for each year is then calculated
residually, to ensure that the accounting identity is satisfied.
For any projection year, this net internal financing flow is the fiscal space “gap”, that is, the
difference between the projected priority-expenditure flow and the projected financing requirements.
If this gap is “too large,” then the programming assumptions, taken together, would be considered
unfeasible. The criteria for “too large” include the limits on the government’s capacity to borrow in
domestic financial markets and the implied increase in the government’s debt-GDP ratio. In general
policy-makers want to keep net internal borrowing flow exceed 2 to 3 per cent of GDP in coming
years, to avoid having the internal-debt burden rise as a percentage of GDP.
The projection exercise is formulated by applying various assumptions, together constituting a
“scenario” to the historical data base. The relatively simplified, illustrative projection exercise
applies scenarios to historical data (as discussed in Appendix 1). Each scenario comprises
programming assumptions for the years FY2017-18 to FY2021-22, covering:
• world economic conditions;
• basic Eswatini macroeconomic variables;
• merchandise exports and imports;
• tax and non-tax revenue;
• external grants to the government;
• government expenditure in the priority and non-priority categories; and
instances. The projection exercise therefore takes all expenditure at an institutional level into account. It can be argued
that even though all this expenditure is not directly focussed on children, it still has significant secondary benefits to them.
12 Fiscal Space for Children: An Analysis of Options in Swaziland• external and internal debt.
For each scenario, some of the assumptions are set as simple numbers (growth rates, percentages
of GDP, etc.). Many of the assumptions, however, are constructed from other assumptions. For
example, the growth rates of real GDP and of the price level are numbers that the analyst chooses
based on projections by either the World Bank or IMF. It is straightforward to combine these
assumptions into an assumed growth rate for nominal GDP.
1.4 Data limitations
This analysis is based on budgetary data covering actual figures (budget outturn) for Fiscal Years
(FY) 2012/13- 2016/17. The main data source is the Ministry of Finance. Additional data sources
include the Central Bank of Eswatini (CBS), UNICEF, as well as the World Bank/IFC and the IMF.
Despite a substantial data-collection effort, the quantitative analysis presented in the sections below
is subjected to an important caveat. Namely, data on spending in the priority-expenditure categories
is limited. Functional level breakdown of data was not available in more detail, in particular,
associated expenditures classified under the economic budget classification could not be obtained.
Thus, as noted before, for the modelling exercise, which looks into aspects such as increases in
staff levels, priority expenditure categories were taken to be those of the main government
institution responsible for the respective area. Since detailed data were not available for more
detailed expenditure categories, it was not possible to produce more refined definitions and
calculations for scenarios involving relevant sub-categories.
1.5 Organization of the FSA part
The remainder of this report is organized as follows. Chapter 2 summarizes Eswatini’s present
macroeconomic and fiscal circumstances. It also analyses the budgetary process and the general
efficiency of the fiscal framework. Chapter 3 looks at the recent evolution of priority expenditure
flows in the categories of priority expenditure and outlines some specific challenges in the various
areas relevant for expenditure on children. Chapters 4 and 5 discuss various options available to
policy makers to enhance fiscal space with an illustrative projection exercise for the priority
expenditure flows and fiscal space that would fund them for the years FY2017/18-FY2021/22. The
exercise consists of a base scenario (Chapter 4), comprising a broad range of macroeconomic and
fiscal policy assumptions, and various alternative scenarios (Chapter 5). Chapter 6 presents the
main findings from the analysis. Further projection details are included in Appendix 1.
Fiscal Space for Children: An Analysis of Options in Swaziland 132 Eswatini’s macroeconomic and fiscal context
2.1 Longer-term national economic trends
2.1.1 Economic growth and recent developments
Figure 2.1 below shows Eswatini’s average growth trend during the twenty five years leading up to
20155. As shown, Eswatini has experienced tepid growth, with real GDP growth gradually declining
in each period, reaching negative levels between 2011 and 2015.
Figure 2.1 Real GDP growth in Eswatini, 1995-2015
Source: World Bank, WDI.
Average growth figures fell marginally between 1995 and 2000. This was the result of a
combination of factors including investment diversion from Eswatini to South Africa – following
South Africa’s economic freedom in 19946 – and contractions in the Swazi agricultural sector due to
severe drought conditions. The subsequent period saw a modest recovery in growth, to an average
nominal growth rate of 3.6% (and 1.5% in real terms) in 2005, supported by improved weather
conditions, as well as improved performance in the manufacturing sector (textiles) following market
access to the United States through the African Growth and Opportunity Act (AGOA) in 20017.
Although average growth rates remained unchanged in the following period, the long lasting effects
of the global financial crisis, together with a gradual shift away from private-investment8 in Eswatini,
lower average growth below 3% after 2010. Growth has continued to slow beyond 2015, due to the
effects of El Nino, as well as the continued weak global economic landscape. The chart also shows
a negative trend in real GDP growth; reflecting significant inflationary effects which give rise to a
decline in purchasing power, as well as rising interest rates over the observed period. Inflationary
trends and monetary policy are discussed further in Section 2.2.2.
5
Averages calculated for the 5 year period to each plotted year (average growth 1991 – 1995, etc.).
6
(IMF, 2003).
7
Eswatini began benefitting from the AGOA in 2001 when the Swazi Government voluntarily accepted the AGOA eligibility
criteria (Tralac, 2015).
8
“ An important determinant of the slowdown in growth in the 1990s and 2000s has been lower investment, and a
shift away from private investment-led growth.” From 2000 to 2009 public investment in percent of GDP rose from 5.7
percent to 10.4 percent, while private investment declined from 12.6 to 5.5 percent of GDP. The declining share of private
investment resulted from the loss of attractiveness of Eswatini as a destination for investment, the end of some preferential
trade agreements, and fierce competition from other textile producers. ( (IMF, 2010, p. Appendix II).
Fiscal Space for Children: An Analysis of Options in Swaziland 15The effects of the global financial crisis in 2008, as well as the global economic downturn have had
considerable effects on Eswatini, mainly through the manufacturing industry which saw significant
contractions over the period (-4.5% in 2009).9 Meanwhile, extreme weather conditions have had
pronounced effects on the agricultural sector, which contracted by 11% in 2016.10
2.1.2 Structure and characteristics of the national economy
As a percentage of GDP, the output of the services sector has gradually increased over time from
46% in 1990 to just over 50% in 2014. During this same period, the industrial sector’s share
remained constant at just over 40%. The consistency of the industrial sector’s contribution to GDP
might be under threat however with Eswatini losing its preferential access to the US market after its
AGOA eligibility was revoked in 2015. Efforts towards tendering for readmission into AGOA have
been made by the government, through strengthening reforms, in particular the passing of the
Public Order Bill.11 Nevertheless, it is unlikely that readmission would be granted until such time
that amendments to the Industrial Relations Act and the Terrorism (as additional preconditions for
eligibility) have been effected.12
Meanwhile agricultural output as a percentage of GDP has declined significantly over the years,
almost halving, to 6% by 2014. Eswatini’s agricultural economy is largely constituted of subsistence
farming (70%) which contributed an estimated 11% of total agricultural output13. While agriculture
contributes less than 10% of overall GDP, the effect of the recent drought conditions (reaching a
peak in 2015 and 2016) is compounded by the high proportion of subsistence farmers –
heightening the risk of food security in the country.
Figure 2.2 Sector contribution to GDP (%)
Source: World Bank, WDI.
The impact of the global economic downturn together with severe weather conditions have been
pronounced for Eswatini as a small middle-income country. These and other economic factors,
compounded by continued weak health and education outcomes, have meant that the country’s
strategic vision of becoming First World country by 2022, is unlikely to be achieved.
9
(Ministry of Economic Planning and Development, 2009).
10
(World Bank, 2017).
11
The Public Order Bill was passed to replace the Public Order Act (1963), with amendments made to meet the
recommendations and benchmarks specified by the US in a bid for qualification for AGOA. (Tralac, 2017).
12
The US highlighted the need for Eswatini to make amendments to the Industrial Relations Act, especially sections that
relate to civil and criminal liability to union leader during protest actions as well as amendments to the Suppression of
Terrorism Act and the Public Order Act. (Tralac, 2016).
13
(USDA, 2016).
16 Fiscal Space for Children: An Analysis of Options in Swaziland2.1.3 Socio-economic trends
Eswatini’s government recognises that in addition to the country’s weak macroeconomic landscape,
socio-economic factors have further exacerbated the country’s growth performance.14 The
macroeconomic environment has also made it difficult to achieve significant improvements in socio-
economic outcomes – despite the exerted efforts by the government.
Eswatini is characterised by high rates of inequality, unemployment, HIV incidence, and poverty.
Roughly 70% of Eswatini’s population falls within the labour force band (15 – 64 years of age), with
28.1% (41.7% using a broad definition) of this population classified as unemployed. This socio-
economic profile significantly constrains the government’s ability to increase tax revenues. In
particular, while technically 72% of the population are classified as employed, it is not necessarily
the case that this entire employed population is accounted for from a tax perspective. A large
majority of individuals fall within informal employment, working as subsistence farmers, and local
tradesmen.
Eswatini has been faced by rising HIV prevalence rates over the years (far outstripping other
diseases in terms of incidence)15. Official statistics estimate an adult HIV incidence rate of 26%
(amongst 15 to 49 year olds). The combination of high unemployment and rising mortality rates
amongst adults has contributed to rising child dependency rates, which is unsurprising given that
that more than half of the population are classified as children16 (see Figure 2.3 below). Adding
further pressure to the government, is the rising number of orphaned and vulnerable children
(OVC), which was estimated as 20% of the child population in 2015.17
Figure 2.3 Population profile and growth
Source: The Kingdom of Eswatini.
Note: Compounded Annual Growth Rate (CAGR).
The proportion of the population classified as poor stood at 63% in 2010, down from 69% a decade
earlier.18 High levels of unemployment, increased dependency on the older population, as well as
heightened food security risks in recent years, have jointly hindered progress towards poverty
reduction, despite modest progress over the years. According to the World Bank, 4 out of 10
individuals live off less than US$1.90 a day, and 6 out of 10 less than US$3.10 a day.
14
(CSO, 2010, p. 1).
15
(Health, 2015, p. 7).
16
Using UNICEFS classification.
17
(Whiteside, et al., 2016).
18
(CSO, 2010, p. 8).
Fiscal Space for Children: An Analysis of Options in Swaziland 17Although a relatively small country, Eswatini’s topographical layout poses a major challenge in
terms of distribution of and access to basic services in many parts of the country; with 76.5% of the
population living in rural areas19. Moreover, limited access to quality health care and basic nutritious
meals heightens public health challenges; while consistently low enrolment rates in secondary
schools remain an issue for educational attainment and skills development.20
As highlighted above, the rising trend in unemployment and the considerable effects of HIV AIDS
on young adults (particularly through rising mortality rates) have increased children dependency,
while the increasing number of OVCs within the country is likely to require more resources from the
government in the coming years. Additional resources would also be required if access to basic
services in rural areas is improved.
2.2 Recent macroeconomic developments
Table 2.1 below provides a summary of Eswatini’s basic macroeconomic indicators for the fiscal
years FY2012/13-FY2016/17.
Table 2.1 Selected macroeconomic indicators, FY12-13 0 FY16/17 (US$ millions)
FY12-13 FY13-14 FY14-15 FY15-16 FY16-17
Gross domestic product* 41,290.0 41,716.1 44,841.9 45,211.6 44,261.6
Per-capita:
Gross domestic product* 38,499.7 40,898.6 40,750.1 39,424.4 36,311.6
Non-government consumption** 28,926.6 29,346.6 29,261.1 29,373.5 29,596.7
Per cent of GDP:
Gross fixed capital formation 5.1% 5.6% 6.2% 6.3% 6.1%
Fiscal balance 4.0% 0.8% -1.3% -5.5% -13.2%
Merchandise-trade balance -8.2% -2.0% 0.3% 0.7% -1.7%
Growth rate:
Consumer prices (December) 6.6% 5.1% 4.8% 7.8% 6.0%
Exchange rate (December) 20.8% 17.1% 2.8% 39.2% -16.1%
Source: Ministry of Finance.
As shown in the table above, GDP per capita has declined since FY2013/14 – signifying an overall
decline in productivity within the economy. This suggests that the country’s real economic growth
performance has not been sufficient to support the average population growth rate of 1.4% (see
Figure 2.3 above) over the last 10 years.
Notwithstanding global economic conditions and severe weather conditions, Eswatini’s economic
performance has also been affected by its strong economic and historical association with South
Africa – which has exposed it to a number of risks. Together with Lesotho, Namibia, and South
Africa, Eswatini falls under the Common Monetary Area (CMA). Established in 198621, this
monetary union was established primarily with the view of complementing the free trade
mechanism throughout the Southern African Customs Union (SACU). As such, each of these
respective economies have a fixed currency peg to the South African Rand, making their currencies
19
(The Kingdom of Swaziland, 2015, p. 1).
20
(CSO, 2010) Net enrolment in senior secondary school (Forms 4 to 6) is less than 15%. (Ministry of Education and
Training, 2015).
21
The CMA has its roots established in the Rand Monetary Area (RMA) 1974, which was later revised in 1986, to form what
is now known as the CMA (IMF, 2007).
18 Fiscal Space for Children: An Analysis of Options in Swazilandsusceptible to South Africa’s exchange rate performance. The Rand has depreciated substantially
against the dollar for a long period of time. As a result, the Swazi Lilangeni depreciated by 16% in
FY2016/17 alone.
While Eswatini’s government has not explicitly set out a medium term growth target, considerable
risks in South Africa are likely to weigh on the medium term outlook. In particular, rising political and
economic policy uncertainty in South Africa is set to result investment outflows, placing further
pressure on the rand. The World Bank and IMF each project Eswatini’s growth to average just
under 2% between 2018 and 2022.
2.2.1 International trade (and its consequences for the fiscal accounts)
Figure 2.4 below presents a breakdown of Eswatini’s trade profile in terms of origin of exports, and
destination of imports. It clearly shows that South Africa remains Eswatini’s major trading partner,
accounting for an average of 85% and 66% of imports and exports respectively. This is mainly due
to the structural arrangement within SACU, in which South Africa makes the largest economic
contribution to the union (both in terms of imports and exports). The union’s dependence on South
Africa’s large economic contribution consequently places the customs pool at risk to fluctuations
associated with South Africa’s growth performance.
So not only does South Africa’s economic performance affect Eswatini’s economic growth in
general, it also has a direct impact on the government’s fiscal position. South Africa’s projected low
growth outlook is set to substantially reduce the customs pool over the medium term. According to
the current revenue sharing formula, given the size of its economy and the proportion of imports
relative to the member countries, Eswatini consistently receives approximately 8 per cent of the
revenue pool.
Figure 2.4 shows that Eswatini’s export growth has typically outpaced imports in recent years,
supporting a modest adjustment from a trade deficit to surplus. Nevertheless, South Africa’s
protracted low growth environment is likely to place some downward pressure on Eswatini’s export
growth, while the Swazi government’s infrastructure development approach is likely to give rise to a
strong demand of capital goods; placing pressure on imports. All of which would likely reverse recent
improvements in the trade balance.
Figure 2.4 Trade profile (by source)
Source: ITC - Trade Map.
Note: Where; ‘X’ represents Exports, ‘M’ represents Imports, and ‘ROW’ represents Rest of the World.
While Eswatini is considered a soft commodity exporter, its export profile is quite diverse. Receipts
from sugar, Eswatini’s primary commodity export, contribute a small amount to total government
Fiscal Space for Children: An Analysis of Options in Swaziland 19revenues. Trade thus has a limited impact on Eswatini’s fiscal accounts. This is particularly true
when comparing it to a hard22 commodity exporter such as Nigeria, in which exports are highly
concentrated in oil (70% of exports), and where oil-revenues contribute a significant amount to total
government revenues (more than 60%). Thus, the impact of lower global commodity prices (hard
and soft) has had a limited impact on Eswatini’s fiscal accounts relative to Nigeria – given its
diverse trade composition.
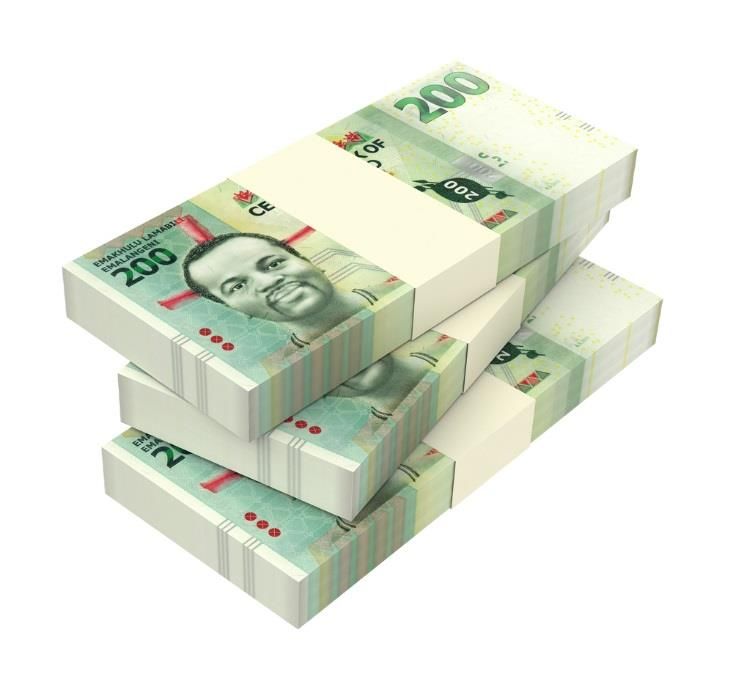
2.2.2 Inflation and exchange rate
Given the currency arrangement within the CMA, monetary policy is effectively guided by the South
African Reserve Bank’s (SARB) policy. Figure 2.5 below presents inflationary trends within the
CMA as well as the trend in Eswatini and South Africa’s key monetary policy rates. Inflationary
trends over the last decade can be summarised in 3 phases:
• Phase I: Effects from the global financial crisis saw inflation within the region rise to
heightened levels last seen in the early 2000s;
• Phase II: The period between 2010 and 2015 saw inflation peak at 9.6% in 2012, off the back
of rising administered prices within the region. The initial oil price downturn in 2015 contributed
to a moderation in inflation in the subsequent years;
• Phase III: The low oil price environment continued to provide some reprieve to oil importers.
Effects of lower fuel prices, and the associated translation into the transport component of the
CPI basket lowered inflationary pressures. Nevertheless, rising food prices, off the back of
severe drought conditions, offset the disinflationary effects from the transport component to
overall CPI, giving rise to higher inflation.
The SARB’s monetary policy has been consistent with its objective of guiding and maintaining
inflation within a 3 – 6% target band, and thus an interest rate hike cycle was instituted in Phase I.
However, with the delicate balance of promoting economic growth – the SARB adopted a fairly
accommodative monetary policy stance in Phase II, followed by a tightening cycle in Phase III.
Figure 2.5 Inflation and Central Bank Rates
Source: World Bank, WDI.
22
Classified as mined or extracted natural resources.
20 Fiscal Space for Children: An Analysis of Options in SwazilandGenerally speaking, Eswatini’s inflationary trend has been much higher than its peers within the
CMA. This is unlike Lesotho, where inflation trends closer to South Africa, and often trends lower.
Over and above high import inflation from South Africa, high administered prices 23 relative to its
peers, has been the main driver of this trend. Eswatini’s stubbornly high inflation has had a number
of effects on its policy rate more recently. CMA countries (excluding SA) typically seek to maintain
their policy rates at par, if not below the SARB’s, in order to limit capital outflows, Eswatini’s high
inflation has in effect warranted the current positive interest rate differential against the SARB. This
is the first time since 1999 that monetary policy rates have been placed higher than the SARB.
While there is a degree of flexibility, the policy direction ultimately follows from the SARB. This will
remain the case for as long as the exchange rate is pegged and the high trade composition with
South Africa remains – which gives rise to exchange rate and inflationary pressures. The SARB
reduced rates by 25 basis points in July 2017, while the CBS maintained rates at 7.25% citing
concerns around inflation. With the recent inflation reduction to 5.6% in September 2017, there may
be a motivation for the CBS to execute a rate cut. Nevertheless, the delicate balance between
growth and inflationary pressure is likely to see a continuation of an accommodative monetary
policy over the medium term.
With considerable inflation risks out of South Africa (due to a weak exchange rate outlook over the
medium term), it is unlikely that there will be a significant downward repo rate in the short term. As
a result, consumption is likely to remain somewhat constrained, while the private sector may retain
a bias towards investing in interest-bearing accounts as opposed to business expansion. This will
have a direct effect on unemployment rates as businesses storing cash are unlikely to expand their
employee numbers. Therefore the impact of South Africa’s monetary policy on Eswatini is
substantial. On a longer term basis however, the IMF projects limited inflationary risks to South
Africa and Eswatini (see Figure 2.6 below).
Figure 2.6 IMF Inflation forecast
Source: IMF.
23
Electricity, Public transport, Bread Indices.
Fiscal Space for Children: An Analysis of Options in Swaziland 212.3 Recent fiscal performance
2.3.1 Government financial performance
Eswatini’s government finances have come under scrutiny in recent years, with the effects of the
global financial crisis resulting in the country’s fiscal crisis in 2010.24 Despite a modest recovery in
the government financial performance in recent years – following efforts to strengthen the country’s
fiscal performance through the establishment of the Fiscal Adjustment Roadmap (FAR) in 2010 –
the IMF has argued that the current expansionary policy has become unsustainable25.
Figure 2.8 below presents a summary of Eswatini’s government revenue and expenditure growth
between FY2010/11 and FY2016/17. Revenue saw a sharp decline of 24.5% in FY2010/11, due to
a collapse in SACU revenues as regional trade slowed. This decline coincided with only a minor
decline in expenditure (of -1.6%) in the corresponding period, prompting the country’s fiscal crisis.
This period gave rise to a significant increase in domestic debt, which rose from E0.40bn to
E1.24bn between FY2009/10 and FY2010/11. With the exception of FY2012/13, where a windfall of
SACU revenues gave rise to a significant increase in total government revenues, growth in
expenditure has outpaced that of revenues over the years. This misalignment between revenue and
expenditure growth has resulted in fiscal balance deteriorating each year (shown in Table 2.1
above).26
Figure 2.7 Government fiscal performance - FY2010.11 to FY2016/17 (as a % of GDP)
Source: Ministry of Finance.
24
(United Nations, 2012, p. 6).
25
(Placeholder1) (IMF, 2017).
26
(IMF, 2015, p. 8).
22 Fiscal Space for Children: An Analysis of Options in SwazilandFigure 2.8 Growth in Government Expenditure and Revenue
Source: Ministry of Finance.
2.3.2 Revenue performance
Eswatini’s revenue is mainly funded from Personal Income Tax (PIT), Company Income Tax (CIT),
Value-Added Tax (VAT) and transfers from the Southern African Customs Union (SACU). Figure
2.9 presents the composition of government revenues in the nine years leading to FY2016/17.
Between FY2010/11 and FY2015/16 there was a positive trend in total government revenues
(including grants) in nominal terms. However as a percentage of GDP government revenues have
been declining. Revenues fell to 30.8% of GDP in FY2016/17, from 32.2% and 34.4% in FY2015/16
and FY2012/13 respectively largely due to declines in SACU transfers. Figure 2.9 also clearly
shows the rise and fall of total government revenues due to the volatile nature of SACU transfers.
Figure 2.9 Composition of government revenues
Source: Ministry of Finance (historical), IMF (projection).
While the SACU is undoubtedly a beneficial arrangement for Eswatini, the reliance on these highly
volatile flows poses a risk to overall fiscal stability. As highlighted earlier, South Africa’s medium-
term economic outlook remains fairly negative. This creates a high level of risk to the size of the
customs pool, as South African trade levels significantly exceed that of other SACU members.
Eswatini receives just under 8% of the pool’s revenue, but makes a significantly lower contribution
than this in terms of trade.27
27
(SACU, 2016).
Fiscal Space for Children: An Analysis of Options in Swaziland 23South Africa’s Ministry of Finance projects an increase in SACU payments28 from R39.4bn in
FY2016/17 to R56bn in FY2017/18. All else equal Eswatini is thus likely to receive approximately
R7.5bn29 up from R5.2bn in FY2016/17. Nevertheless, even with a projected rise in SACU
revenues in the current fiscal year, the reliance on this single item will continue to impact the
country’s overall fiscal standing: Eswatini will remain highly susceptible to shocks in periods of
significantly lower SACU revenues. A more fiscally prudent approach should likely be adopted in
the use of SACU revenues. Whereas additional SACU revenues (i.e. increased amounts years with
higher revenues) are currently often allocated to capital projects,30 such revenues could be spent
on child-focused sectors.
Beyond SACU transfers, CIT, PIT and VAT are the most significant internal tax instruments in
Eswatini; the main rates of which are given in Table 2.2. The most recent figures show that PIT
made up 22.8% of government revenues in FY2016/17, with VAT and CIT contributing 16.5% and
11.2% respectively. The relative contribution of each item has however fluctuated in each fiscal
year due the instability of SACU transfers: In periods with relatively high31 SACU transfers these the
sum of these three taxes account for approximately 35% of government revenue, but exceeds 50%
in the periods with low32 SACU transfers. Nevertheless, each item has increased in nominal terms –
specifically from FY2013/14, where possible efficiency gains may have been realised as a result of
the establishment of the Eswatini Revenue Authority (SRA) in 2011.33
Table 2.2 Eswatini main tax rates
Tax instrument Specifications Rate
Corporate income tax rate* Domestic and foreign companies 28%
Specified basic commodities 0%
Value-Added Tax (VAT) rate*
Other commodities 14%
Income < 60 000 Lilangeni 20%
Income > 60 000 < 80 000 Lilangeni 25%
Personal income tax rate**
Income > 80 000 < 100 000 Lilangeni 30%
Income > 100 000 Lilangeni 33%
Source: (EY, 2014).
As it stands, Eswatini receives limited budgetary support in the form of grants. As a percentage of
GDP, grants currently stand at 1.2%. Grants have typically been allocated to the capital budget and
not the recurrent budget. Most of these grants are allocated to specific sectors, with the African
Development Bank being one of the largest contributors.34
2.3.3 Current expenditure performance
While government revenues have been relatively stable since 2012/13, expenditure has been rising
rapidly. This is true not only in nominal terms, but relative to GDP as well – reflecting the
28
This constitutes roughly 60% of SACU revenue pool- as it includes the portion paid out by South Africa to Botswana,
Lesotho, Namibia and Swaziland (BLNS).
29
Swaziland’s proportion of the revenue pool is relatively constant (13.5% of SACU payments from South Africa to BLNS |
8% of total revenue pool).
30
As stated in the Q1 Budget Performance Report FY2017/18, construction activity is expected to increase due to higher
SACU receipts expected for the year. (Ministry of Economic Planning and Development, 2017, p. 9).
31
For the following fiscal years: 2012/13, 2013/14, 2015/16.
32
In the following fiscal years: 2010/11, 2011/12, 2014/15, 2016/17.
33
(SRA, 2017).
34
(Ministry of Economic Planning and Development, 2017, p. 11).
24 Fiscal Space for Children: An Analysis of Options in Swazilandgovernment’s expansionary fiscal policy. Total government expenditure as a percentage of GDP
doubled in about 6 years, from 24.8% in FY2010/11 to just over 40% in FY2016/17.
Government expenditure consists of recurrent expenditure (80%), and non-recurrent expenditure
(20%), mainly capital. After Lesotho, Eswatini has the highest wage bill amongst the CMA
countries,35 with roughly 40% of recurrent expenditure being allocated to public sector employee
wages. Figure 2.10 shows the wage bill being fairly stable from 2010/11 to 2012/13 a sharp rise
from 2013/14 onwards. This reflects the government policy from 2010 to 2013 to both freeze
vacancies and implement no cost of living wage adjustments. In 2013 this policy was ended36 and
the rise between 2013/14 and 2016/17 appears to largely reflect the above inflation salary
adjustments to catch up after the period of no cost of living increases.37 Having compensation of
employees as the largest cost component reduces government’s ability to effectively manoeuvre in
case of significant decreases in revenues; often resulting in the misalignment between expenditure
and revenue growth trends noted earlier. Government again instituted a policy of not offering cost of
living adjustments in 2017, but maintaining such a policy could be difficult given significant union
pressure.
Figure 2.10 also shows a rising trend in the proportion of grants, increasing from 11% of total
expenditure in FY2010/11 to 20% in FY2016/17. This sharp rise results from the introduction of the
Free Primary Education (FPE) Act in 2011, which provides grants, teaching and learning materials,
teachers, infrastructure and meals to primary schools.
Figure 2.10 Composition of government expenditure
Source: Ministry of Finance (historical), IMF (projection).
The budget execution rate is also an area of concern, with spending outturn typically exceeding
budgetary outlays. For example, expenditure exceeded outlays by E500m (2.4%) in FY2016/17 –
largely due to the public sector salary review effective April 2016 38 – placing further pressure on
the fiscal position.
Over and above the highlighted expenditure items, the sharp decline in SACU revenues in
FY2016/17 added considerable strain on the government’s finances, resulting in the “accumulation
of arrears to government suppliers” (Ministry of Finance, 2017, p. 7). Although the size of arrears is
not clear, the risks associated with the accumulation of arrears are well document within the area of
35
(IMF, 2017, p. 53).
36
From interviews conducted with the Ministry of Public Service.
37
(IMF, 2017).
38
(Ministry of Finance, 2017, p. 15).
Fiscal Space for Children: An Analysis of Options in Swaziland 25public finance management. For one, accumulation of arrears undermine the true reflection of a
government’s fiscal position, often masking the actual size of the deficit.39
While the government has noted the need to reduce its fiscal deficit, which stood at 9.9% in
FY2016/17 from 5.5% in the previous year, it appears likely to maintain an expansionary fiscal
policy over the medium term; particularly as the result of implementing a number of capital
investment projects.40 The 2017/18 capital budget grew by 45% from the previous year – from
E3.8bn to E5.6bn – and capital investments are budgeted to remain at this higher level in
subsequent years.41
While Eswatini does not have a clearly formulated medium term fiscal policy framework, there has
been consistent rhetoric espousing an expansionary fiscal policy across budgetary statements in
recent years. The rising trend in public debt is thus likely to continue over the medium term. Public
debt stock stood at just over 20% in FY2016/17, and while it is unlikely to breach the country’s self-
imposed ceiling of 35%, the increasing borrowing trajectory is set to pose a risk to debt
sustainability. However, it is important to note that Eswatini current debt levels and debt trajectory
are way below international safe threshold levels for emerging markets, which the IMF puts at 70%
of GDP. Eswatini’s exposure to South Africa, with its consistently depreciating currency and
considerable downside risks over the medium term, introduces the risk of rising debt servicing cost
– particularly for external debt. Moreover, the risk of further ratings downgrades in South Africa, and
the associated risk of investment outflows, could result in higher Swazi interest repayment rates –
adding pressure to domestic debt servicing costs. Moody’s, the credit ratings agency, recently
issued Eswatini with a first-time issuer rating of B2 with a negative outlook, citing concerns over the
country’s low growth, weak institutional governance and fiscal accounts.42
Figure 2.11 Total public debt stock (% of GDP)
Source: Ministry of Finance.
The options for effectively managing the risks associated with raising debt through domestic and
external markets are also fairly limited. While there is the option of drawing down on the country’s
reserves, this creates the risk of depleting international reserves while also having to maintain an
import cover ratio of at least 3 months. Such a depletion would create a challenge to maintain the
required reserves to manage its currency at par with the rand (as per the CMA requirements).
39
(IMF, 2014, p. 6).
40
(IMF, 2017).
41
(Ministry of Finance , 2017).
42
(Moody's, 2017).
26 Fiscal Space for Children: An Analysis of Options in SwazilandThe medium-term outlook is likely to pose two key risks to public debt and overall fiscal
sustainability. Firstly, the poor economic outlook as well as the political instability in South Africa
creates the risk of continuing weakening in the Lilangeni – which in turn would cause the cost of
external debt to rise. Secondly, as government revenue does not seem to react significantly to
economic growth, without direct intervention in the tax system through new instruments or improved
efficiency, it will be difficult for Eswatini to address its annual fiscal deficit. The same is true if the
government does not reign in continually growing government expenditure.
2.3.4 Implications for priority expenditure
This preceding sections have clearly outlined a number of risks associated with Eswatini’s fiscal
standing. The first, being the dependence on the volatile nature of SACU transfers. The second
being the large wage bill, and the third being accumulation of arrears. While the government’s
pursuit of an expansionary fiscal policy has perhaps been warranted in the recent economic
conditions, a more sustainable fiscal strategy needs to be adopted. Unless the country is able to
implement adequate reductions in expenditure in periods of lower SACU revenues, or increased
savings in times of high revenues, the fiscal deficit and the debt levels will continue to increase.
While debt is unlikely to rise beyond the ceiling of 35% in the short term, rising debt and debt
servicing costs is still likely limit the government’s ability to significantly strengthen its investments
towards priority areas. Investments should thus be targeted towards not only the areas of greatest
need, but also those areas that can help put the country on a path to higher economic growth. All
three identified priority sectors (education, health and social welfare) are essential to the success of
the country. Section 1 will thus aim to highlight such areas in priority sectors that would not only
benefit citizens in the short term, but also the country as a whole in the longer term.
Fiscal Space for Children: An Analysis of Options in Swaziland 273 Priority expenditure trends and policy
challenges
3.1 Priority-expenditure composition and recent evolution
3.1.1 Priority-expenditure components and fiscal space in recent years
This section briefly contextualises priority spending within the broader fiscal environment in the
country. To this end, Table 3.1 below summarises the trends in priority expenditure between
FY2012/13 and FY2016/17 - expressed as a percentage of GDP. Priority expenditure has
increased over this period, reaching 11.15% in FY2016/17, from just under 10% four years prior.
This trend is consistent with the Eswatini Government Programme of Action (2014 -2018), which
emphasises increased investment towards education and health as two of the eight focal areas of
the plan,43 and highlights social welfare as an important part of the service delivery focal area.
Table 3.1 Priority expenditure for children and its fiscal space FY2012/13 to FY2016/17 (% of GDP)
Fiscal year FY12/13 FY13/14 FY14/15 FY15/16 FY16/17
Per cent of GDP
Total priority expenditures for children 9.90% 10.03% 10.92% 10.71% 11.15%
Total education expenditure 6.04% 5.88% 6.38% 6.36% 6.74%
Total health expenditure 3.16% 3.08% 3.74% 3.70% 3.87%
Total social development expenditure 0.70% 1.07% 0.81% 0.64% 0.54%
Overall fiscal space 9.90% 10.03% 10.92% 10.71% 11.15%
Tax and non-tax revenue (excl. external
34.43% 32.03% 33.01% 32.21% 30.85%
grants) (+)
External grants (+) 0.12% 0.49% 1.84% 0.74% 1.15%
Total non-priority non-interest
-19.69% -20.81% -24.18% -26.27% -32.84%
expenditure (-)
External-debt disbursements (+) 0.25% 0.54% 0.59% 0.48% 0.37%
External debt service (-) -1.02% -0.88% -0.76% -0.86% -1.21%
Net internal financial flows (incl.
-4.20% -1.36% 0.43% 4.40% 12.83%
internal interest) (+)
Growth rates
Total priority non-interest expenditure: 14.08% 16.15% 2.53% 2.11%
Contribution to the growth of total
priority expenditure:
Tax and non-tax revenue (excl. external
16.61% 31.44% 6.30% -18.45%
grants) (+)
External grants (+) 4.40% 14.63% -9.71% 3.60%
Total non-priority non-interest expenditure
-37.81% -49.57% -30.18% -55.32%
(-)
External-debt disbursements (+) 3.63% 0.86% -0.79% -1.08%
43
(The Kingdom of Swaziland, 2013).
Fiscal Space for Children: An Analysis of Options in Swaziland 29You can also read