QUARTERLY ECONOMIC COMMENTARY - SUMMER 2021 KIERAN MCQUINN, CONOR O'TOOLE, ILIAS KOSTARAKOS, CATHAL COFFEY, WENDY DISCH
←
→
Page content transcription
If your browser does not render page correctly, please read the page content below
MACRO
ECONOMIC
FORECASTING QUARTERLY ECONOMIC COMMENTARY
June 2021
 SUMMER 2021
 KIERAN MCQUINN, CONOR O'TOOLE, ILIAS KOSTARAKOS,
 CATHAL COFFEY, WENDY DISCH

 ENCE FOR POL
 ID IC
 EV Y
QUARTERLY ECONOMIC COMMENTARY

Kieran McQuinn

Conor O’Toole
Ilias Kostarakos

Cathal Coffey
Wendy Disch

Summer 2021
The forecasts in this Commentary are based on data available by 10 June 2021.
Draft completed on 11 June 2021.

A subscription to the Quarterly Economic Commentary costs €327 per year,
including VAT and postage.

© The Economic and Social Research Institute,

Whitaker Square, Sir John Rogerson’s Quay, Dublin 2.

ISSN 0376-7191

DOI: https://doi.org/10.26504/qec2021sum

This Open Access work is licensed under a Creative Commons Attribution 4.0
International License, which permits unrestricted use, distribution, and
reproduction in any medium, provided the original work is properly credited.
ABOUT THE ESRI
The Economic and Social Research Institute is an independent research institute
working towards a vision of ‘Informed policy for a better Ireland’. The ESRI seeks
to support sustainable economic growth and social progress in Ireland by providing
a robust knowledge base capable of providing effective solutions to public policy
challenges.

The Institute was founded in 1960 by a group of senior civil servants, led by
Dr T.K. Whitaker, who identified the need for independent and in-depth research
to support the policymaking process in Ireland. Since then, the Institute has
remained committed to independent research and its work is free of any expressed
ideology or political position. The Institute publishes all research reaching the
appropriate academic standard, irrespective of its findings or who funds the
research.

The ESRI brings together leading experts from a variety of disciplines who work
together to break new ground across a number of research initiatives. The
expertise of its researchers is recognised in public life and researchers are
represented on the boards and advisory committees of several national and
international organisations.

ESRI researchers uphold the highest academic standards. The quality of the
Institute’s research output is guaranteed by a rigorous peer review process.
Research is published only when it meets the required standards and practices.
Research quality has also been assessed as part of two peer reviews of the
Institute, in 2010 and 2016.

ESRI research findings are disseminated widely in books, journal articles and
reports. Reports published by the ESRI are available to download, free of charge,
from its website. ESRI staff members communicate research findings at regular
conferences and seminars, which provide a platform for representatives from
government, civil society and academia to discuss key findings from recently
published studies and ongoing research.

The ESRI is a company limited by guarantee, answerable to its members and
governed by a Council, comprising a minimum of 11 members and a maximum of
14 members, who represent a cross-section of ESRI members: academia, civil
service, state agencies, businesses and civil society.
THE AUTHORS
 The Commentary is edited by Kieran McQuinn and Conor O’Toole. Kieran McQuinn
 is a Research Professor and Conor O’Toole is an Associate Research Professor at
 the Economic and Social Research Institute (ESRI). Ilias Kostarakos is a
 Post-Doctoral Research Fellow, while Cathal Coffey and Wendy Disch are Research
 Assistants at the ESRI.

 Special Articles are published in the QEC in order to foster high-quality debate on
 various aspects of the Irish economy and Irish economic policy. They are subject to
 refereeing prior to publication.

The Quarterly Economic Commentary has been accepted for publication by the Institute, which does
not itself take institutional policy positions. It has been peer reviewed by ESRI research colleagues prior
to publication. The authors are solely responsible for the content and the views expressed.
Quarterly Economic Commentary – Summer 2021 | iii

TABLE OF CONTENTS
SUMMARY TABLE......................................................................................................................... IV

THE IRISH ECONOMY – OVERVIEW ............................................................................................... 1

THE DOMESTIC ECONOMY ........................................................................................................... 2

 Output ................................................................................................................................... 2

 Demand ................................................................................................................................. 9

 Traded Sector ...................................................................................................................... 19

 Investment .......................................................................................................................... 26

 Labour market..................................................................................................................... 33

 Public finances .................................................................................................................... 40

GENERAL ASSESSMENT OF THE IRISH ECONOMY....................................................................... 45

SPECIAL ARTICLE

With ‘g’ greater than ‘r’, should we be borrowing to increase Irish housing supply?
K. McQuinn ................................................................................................................................. 51
iv | Quarterly Economic Commentary – Summer 2021

SUMMARY TABLE
 2020 2021 2022
 Output (Real Annual Growth %)
 Private Consumer Expenditure -9.0 7.5 8.5
 Public Net Current Expenditure 9.8 5.0 3.0
 Investment -32.3 5.8 7.6
 Exports 6.2 13.3 8.3
 Imports -11.3 11.0 9.0
 Gross Domestic Product (GDP) 3.4 11.1 6.9
 Gross National Product (GNP) 0.6 8.5 5.7
 Domestic Demand (excl. Stocks) -19.3 6.4 7.3

 Labour Market
 Employment Levels (‘000) 1,976 2,039 2,307
 Unemployment Levels (‘000) 453 395 176
 Unemployment Rate (as % of Labour Force) 18.9 16.3 7.1

 Public Finances
 General Government Balance (€bn) -18.4 -17.3 -8.7
 General Government Balance (% of GDP) -5.0 -4.1 -1.9

Note: The employment level for 2020 is based on the COVID-adjusted level of employment at the end of each quarter published by the
 CSO along with the quarterly LFS. As a result it represents a lower bound estimate for employment in 2020. The unemployment
 rate and level are based on the monthly unemployment and the COVID-adjusted monthly unemployment series published by the
 CSO.
Quarterly Economic Commentary – Summer 2021 | 1

The Irish Economy – Overview

• The relaxation of public health restrictions in Q2 2021, in tandem with the
 continued vaccine roll-out, means the Irish economy is increasingly open for
 business. We assume a continued, and more permanent, relaxation of public
 health measures in the present year and in 2022.

• Preliminary data for 2021 demonstrate that, as with 2020, foreign-dominated
 export orientated sectors are highly influential in the economy’s growth rate
 for the year to date. Domestic sources of growth, on the other hand, have been
 impacted by the public health restrictions.

• However, with restrictions easing, both foreign and domestic sources of
 growth are likely to contribute considerably to the performance of the
 economy for the rest of the year. The export sector is set to perform
 particularly strongly in 2021, while domestic demand is expected to increase
 by 6.4 per cent in 2021 and 7.3 per cent in 2022. This means the economy is
 set to register substantial growth of 11.1 per cent in the present year. In 2022,
 the economy is forecast to increase by 6.9 per cent.

• While the pace of growth expected this year and next is encouraging, it is worth
 noting that COVID-19 has had a significant adverse impact on the domestic
 Irish economy. In a Box to the Commentary, Bergin, Garcia-Rodriguez and
 McQuinn estimate that the cost in output terms to the economy in 2020 and
 2021 was almost €24 billion, when compared with where the economy would
 have been if COVID-19 had not occurred.

• Additionally, COVID-19 is also likely to have other significant long-lasting
 impacts on the Irish economy and society. In particular, the impact on
 residential construction means that the imbalance between housing supply
 and demand is greater now than it was at the start of the pandemic. In a paper
 to the Commentary, McQuinn (2021) addresses how Government policy may
 address these issues. The paper suggests that a modest increase in
 Government borrowing is sustainable over the medium term. The increase in
 funds provided under such a policy could facilitate extra investment in key
 infrastructure in the economy such as the provision of housing.
2 | Quarterly Economic Commentary – Summer 2021

 The Domestic Economy

 OUTPUT
 Key Points

 • We expect substantial growth of 11.1 per cent in 2021.

 • A counterfactual exercise suggests that the cost in output terms due to
 COVID-19 for the Irish economy in 2020 and 2021 was approximately
 €24 billion.

 • An update of previous analysis suggests European growth rates are set to
 remain relatively stagnant over the longer term.

 With most of the public health restrictions being eased in the second quarter of
 2021, domestic sources of growth which have been constrained through the first
 half of 2021 are likely to rebound significantly for the rest of the year. Our forecasts
 now assume that a more permanent and sustained relaxation of public health
 measures is possible, and that both a) the vaccination process continues to be
 successfully rolled out for the rest of the year and b) the current vaccines continue
 to be sufficiently efficacious (against new variants for example) that social mixing
 is not constrained by restrictions or public confidences.

 A characteristic of the Irish economy during the pandemic has been the
 exceptionally strong performance of certain elements of the export-orientated
 foreign dominated sector. Initial data for Q1 2021 indicate that exports of
 pharmaceutical goods and ICT continued strongly in the present year. Overall
 exports in Q1 2021 were up by 17 per cent year-on-year.

 In this Commentary, consumption is expected to increase by 7.5 per cent while
 investment is forecast to increase by 5.8 per cent. Exports are set to increase by
 13.3 per cent for the year with imports increasing by 11 per cent. Overall, this
 results in GDP growing by 11.1 per cent in 2021. Both domestic and external
 sources of growth are expected to also perform well in 2022 with the economy set
 to increase by 6.9 per cent.

 The relative performance of the Irish economy can be assessed in comparison with
 other European countries. Figure 1 compares the actual growth performance of a
 select set of European countries in 2020 with the EU Commission forecast for the
 same countries in 2021. Interestingly, it appears the Commission assumes that the
 more significant the impact of the pandemic on an economy in 2020, the greater
Quarterly Economic Commentary – Summer 2021 | 3

 the recovery experienced by that country in 2021. 1 The Irish economy is an outlier
 in that it alone amongst all European countries witnessed positive growth in 2020
 and it is also expected to experience one of the most robust recoveries in 2021.

FIGURE 1 ACTUAL GDP GROWTH FOR 2020 AND EU FORECAST FOR 2021 (%)

 15.0

 10.0

 5.0

 0.0

 -5.0

 -10.0

 -15.0

 2020 2021

Source: QEC calculations and EU Commission.

 While the domestic economy is expected to exhibit strong growth this year and
 next, it is important to consider the impact of the pandemic on the level of Irish
 economic activity. In Box A results from Bergin et al. (2021) are used to examine
 what the cost of COVID-19 has been for the Irish economy. Using COSMO, they
 conduct a counterfactual scenario, where they project where the Irish economy
 would have been in 2021 and 2022 in the absence of the pandemic. They refer to
 this counterfactual scenario as the ‘baseline’. This baseline scenario is then
 compared with the latest forecasts of the economy in the Commentary.

1 A regression of the forecasts in 2021 on the actual growth rates in 2020 results in a negative and significant coefficient
 of 0.218.
4 | Quarterly Economic Commentary – Summer 2021

BOX A THE IMPACT OF COVID-19 ON THE IRISH ECONOMY

 In this Box we compare the actual and future performance of the Irish economy due to
 COVID-19 with how the economy would likely have performed if COVID-19 had not
 occurred. This allows us to examine the impact of COVID-19 on the Irish economy and
 allows us to answer the question: ‘where would the economy be now if COVID-19 had not
 arisen?’ This is important as it enables us to estimate the cost of the pandemic to the Irish
 economy in the short term.

 To address this issue we draw on the work of Bergin et al. (2021), which generates a no-
 pandemic baseline in order to examine the recovery path of the Irish economy after
 COVID-19. Bergin et al. (2021) use COSMO – the largescale macro-econometric model of
 the Irish economy – to generate an alternative growth path in the absence of the
 pandemic. This baseline includes a free trade agreement (FTA) between the UK and EU
 being in place by the beginning of 2021 and captures the historical and recent evolution of
 the Irish economy, with a medium-run GDP growth rate close to 3.5 per cent.

 In Table A.1 we summarise the projected growth rates for the key aggregates of the Irish
 economy for the period 2020-2022 under this baseline. Also included in the table, are the
 actual growth rates for 2020 and the latest forecasts from the Quarterly Economic
 Commentary.

TABLE A.1 ALTERNATIVE GROWTH RATES FOR THE IRISH ECONOMY (%)

 Component No-pandemic baseline Actual QEC Forecast
 2020 2021 2022 2020 2021 2022
 Private Consumption 3.1 3.7 3.2 -9.0 7.5 9.5
 Government Consumption 2.6 2.6 3.2 9.8 5.0 3.0
 Investment 23.6 6.3 6.7 -32.3 5.8 7.6
 Exports 8.3 6.9 5.6 6.2 13.3 8.3
 Imports 11.5 5.4 5.7 -11.3 11.0 9.0
 Output 9.5 7.0 5.2 3.4 11.1 6.9

Source: Bergin, Garcia-Rodriguez, Rehill and Sweeney (2021), CSO and QEC estimates.

 The significant differences in the growth rates due to the pandemic are readily apparent
 from the table. In Table A.2, for each of the components of growth, we calculate the
 percentage difference between what the level for these components would be under the
 baseline scenario and what the actual level for the components was in 2020, and what the
 forecast of the levels are in 2021 and 2022 based on the Commentary.
Quarterly Economic Commentary – Summer 2021 | 5

TABLE A.2 PERCENTAGE DIFFERENCE FOR THE COMPONENTS OF IRISH GROWTH BETWEEN
 SCENARIOS

 Component 2020 2021 2022
 Private Consumption -13.3 -9.3 -4.0
 Government Consumption 6.6 8.7 8.5
 Investment -82.6 -83.4 -81.9
 Exports -2.0 3.8 6.2
 Imports -25.7 -19.4 -15.7
 Output -5.0 -1.5 0.2

Source: QEC estimates.

 By comparing the levels under the no-pandemic scenario and under the QEC forecasts, we
 can estimate the cost in output terms to the economy of the pandemic.

 The biggest difference is for the investment category, with investment being over 80 per
 cent less under the pandemic than it would have been in the absence of COVID-19.
 Investment registered a particularly large decline in 2020. The component of growth least
 adversely impacted by COVID-19 is the export sector; certain sectors of the Irish
 pharmaceutical sector actually registered strong exports in 2020 and are forecast to
 perform particularly well both in 2021 and 2022. Government consumption is,
 unsurprisingly, the only growth component that is greater under the COVID-19 scenario.
 This reflects the increased Government expenditure on welfare payments and in the
 health sector.

 Overall, output in both 2020 and 2021 is somewhat lower due to COVID-19 than what it
 would have been if the pandemic had not occurred. Figure 1 plots the two different output
 levels from 2019 to 2022. Clearly by 2022, it is apparent that the economy is back to where
 it would have been in the absence of the pandemic. However, between 2020 and 2021 the
 loss in output terms is equivalent to approximately €24 billion in monetary terms.

FIGURE A.1 ALTERNATIVE GDP LEVELS 2019-2022 (€ BILLION)

 440
 420
 400
 380
 360
 340
 320
 300
 2019 2020 2021 2022

 GDP baseline GDP actual + QEC forecast

Source: Authors’ calculations.
6 | Quarterly Economic Commentary – Summer 2021

 References

 Bergin A., A. Garcia-Rodriguez, L. Rehill and E. Sweeney (2021). Exploring the Impact of
 COVID-19 and Recovery Paths for the Economy. Department of Finance.

 This Box was prepared by Adele Bergin, Abian Garcia-Rodriguez and Kieran McQuinn.

 Another Box in the Commentary by McQuinn and Whelan updates earlier work by
 the same authors in assessing the growth performance of the Euro Area as a whole
 and of key Member States. The analysis in the Box suggests that, notwithstanding
 the recent increases in output growth rates in the Euro Area, the relatively modest
 contribution of TFP growth and investment point to longer-term difficulties for
 European growth rates. This is compounded by the expected changes in
 demographics with significant ageing already occurring across the population in
 most European countries.

BOX B RECENT GROWTH PROSPECTS OF THE EURO AREA

 In a series of papers McQuinn and Whelan (2008; 2015; 2016; 2018) have assessed the
 growth performance of both the Euro Area as a whole and of many of the individual
 countries in it. Using a growth accounting approach, the analysis examines the
 contribution of labour, capital and total factor productivity (TFP) to output growth. Based
 on the analysis, these papers have also produced long-term forecasts for the Euro Area,
 and in general the conclusions have been quite pessimistic. This is mainly because of the
 expected ageing of the European population, with the number of people in the key working
 age set to decline significantly over the longer term. The other underlying issue which has
 negative implications for long-term growth prospects is the observed decline in total factor
 productivity. For example, TFP growth in the Euro Area over the period 2000-2013 had
 almost ground to a halt at 0.2 per cent per year. As is well known, in the Solow model,
 output per worker is determined in the long run by the rate of TFP growth.

 In this Box, we update McQuinn and Whelan (2018), which assessed European growth
 performance up to 2014, to cover the period 2014-2019. This allows us to assess whether
 there has been a pick-up in the rate of TFP growth as the European economy has gradually
 recovered from the aftermath of the great financial crisis (GFC). It is particularly
 appropriate to examine the growth potential of the Euro Area at a time when it is just
 recovering from the COVID-19 epidemic.

 The analytical framework is based on the standard assumption that output is produced
 according to a Cobb-Douglas production function:
 = 1−
 (1)

 where is real output, is capital input, is labour input (defined as total hours worked)
 and is total factor productivity. Output growth can then be expressed as:
Quarterly Economic Commentary – Summer 2021 | 7

 ̇ ̇ ̇ ̇
 = + + (1 - ) (2)

 Using data on output growth, capital growth and labour growth, TFP growth can be
 calculated. As there is no official capital stock series for the European economy, we
 construct this series ourselves. To do this we assume that the initial stock of capital in 1970
 equals the steady-state value implied by the Solow growth model in this year based on the
 trends at that point for GDP growth, the investment share of GDP and the growth rate of
 labour input. The rest of the capital stock series is then derived using the following
 definition:
 = (1 - δ) −1 + −1 (3)

 where is gross fixed capital formation. Depreciation (δ) is assumed to be 6 per cent.
 Table B.1 summarises the performance of the Euro Area and some select countries over
 the period 2014-2019. 2

 TABLE B.1 ANNUAL AVERAGE GROWTH PERFORMANCE OF SELECT EURO AREA COUNTRIES (%):
 2014-2019

 Component Output Technology Capital Total labour
 Germany 1.6 0.6 0.5 0.5
 France 1.5 0.7 0.5 0.4
 Italy 1.0 0.4 0.0 0.6
 Spain 2.8 1.0 0.3 1.6
 EA11 3 1.7 0.6 0.4 0.7

 Source: QEC estimates.

 Overall, while the results are slightly better than the forecasts for the same period in
 McQuinn and Whelan (2018), they are still underwhelming. For example, over the period
 2007-2013, output growth in the Euro Area had contracted by 0.2 per cent. Therefore, a
 more robust recovery would have been expected in the aftermath of the GFC. It is clear
 that most of the growth in the 2014-2019 period is coming from increases in labour input,
 which is unsurprising given the relatively high rates of unemployment after the financial
 crisis in 2013. However, there has not been a resurgence in TFP growth. While the 0.6 per
 cent increase in Euro Area TFP growth is an improvement on the 2000-2013 average
 mentioned earlier, it is somewhat less than the average of 1.5 per cent over the earlier
 1970-2000 time period.

 Using the same framework, output per worker growth can then be expressed as:
 ̇ ̇ ̇ ̇ ̇
 − = + ( − ) (3)

2 Note data are available for 2020, however owing to the impact of the pandemic, we have elected not to include that
 year.
3 Note the Euro Area here refers to the 11 original members of the Euro Area minus Ireland. McQuinn and Whelan (2018)
 usually use the original 12 members of the Euro Area when referring to the Euro Area aggregate. Ireland is excluded
 from these results as the distortions in the Irish National Accounts in 2015 can have a quantitative effect on the Euro
 Area aggregate.
8 | Quarterly Economic Commentary – Summer 2021

 Labour productivity growth can be characterised as a function of TFP growth and ‘capital
 deepening’ (growth in capital per unit of labour). Table B.2 summarises the results for
 output per worker growth for the same countries over the same period.

 TABLE B.2 ANNUAL AVERAGE OUTPUT PER WORKER GROWTH PERFORMANCE OF SELECT EURO
 AREA COUNTRIES (%): 2014-2019

 Component Output Technology Capital
 Germany 0.8 0.6 0.2
 France 1.0 0.7 0.3
 Italy 0.4 1.0 -0.5
 Spain 0.1 0.4 -0.3
 EA11 4
 0.6 0.7 0.0

 Source: QEC estimates.

 Again, the results are somewhat underwhelming with labour productivity in the Euro Area
 only increasing by 0.6 per cent per annum during the recovery period. It is also worth
 noting that capital deepening actually declined for two of the countries – Italy and Spain –
 over the period.

 Concluding thoughts
 An assessment of the recent contribution to growth for the Euro Area as a whole and for
 its individual countries reveals only a very modest increase in output growth. From a
 longer-term perspective, the relatively small contribution to the recovery period
 2014-2019 of TFP growth re-emphasises the concerns expressed about longer-term
 growth prospects for the area in earlier studies by McQuinn and Whelan. Coupled with
 expected trends in demographics, the prospects for growth in the Euro Area economy over
 the next few decades are unpromising.

 The negligible contribution of investment and capital to the 2014-2019 recovery as
 evidenced in the results above highlights the comments made by Schnabel (2020) who
 argued for a more imaginative role for fiscal policy in stimulating European growth
 performance in the short to medium term. This is particularly the case in a post COVID-19
 world.

 References

 McQuinn K. and K. Whelan (2018). ‘Europe’s long-term growth prospects: With and
 without structural reforms’ in Campos, N., P. De Grauwe and Ji Yuemei (Eds). The
 Political Economy of Structural Reforms in Europe, Oxford University Press.
 McQuinn K. and K. Whelan (2016). ‘The prospects for future economic growth in the Euro
 Area’, Intereconomics, Review of European Economic Policy, Vol. 51,
 November/December, No. 6, pp. 305-311.

4 See footnote 3.
Quarterly Economic Commentary – Summer 2021 | 9

McQuinn K. and K. Whelan (2015). ‘Demographics and the growth outlook for Europe’,
 Research Note, Quarterly Economic Commentary, Spring, Dublin: The Economic and
 Social Research Institute, March.
McQuinn K. and K. Whelan (2008). ‘Prospects for growth in the Euro Area’, CESifo Economic
 Studies, Vol. 54(4), pp. 642-680.
Schnabel I. (2020). ‘The shadow of fiscal dominance: Misconceptions, perceptions and
 perspectives. Schnabel is a member of the executive board of the ECB’. Speech
 available at:
 https://www.ecb.europa.eu/press/key/date/2020/html/ecb.sp200911~ea32bd8b
 b3.en.html.

This Box was prepared by Kieran McQuinn and Karl Whelan (UCD).

 DEMAND
 Key Points

 • Consumption was over 11 per cent lower in the first quarter of 2021 compared
 with Q4 2020 as public health restrictions were imposed to slow the spread of
 COVID-19.

 • The fall in consumption in Q1 2021 was larger in Ireland than that typically
 experienced by other European countries.

 • A considerable recovery in consumption is expected as households unwind
 savings balances and undertake postponed expenditure as the economy
 reopens.

 • Consumer price inflation has increased in Ireland and the Eurozone in 2021
 mainly due to energy prices.

 Household sector consumption
 Following a rapid increase in infections in December 2020 and January 2021, strict
 public health measures were reimposed during the first and into the second
 quarters of 2021 to control the spread of COVID-19 in Ireland. These measures
 required the closure of large parts of the Irish economy and society and restricted
 households’ ability to undertake consumption.

 Figure 2 presents the trend in the level (LHS) and year-on-year growth rate (RHS)
 of household consumption at constant market prices. While the largest drop in
 2020 occurred during the second quarter, all quarters in 2020 registered lower
 consumption than in 2019. As noted in the previous Commentary (McQuinn et al.,
 2021), overall consumption was 9 per cent lower in 2020 than in 2019 which
10 | Quarterly Economic Commentary – Summer 2021

 represents a very severe contraction in household spending. The decline continued
 in 2021 and consumption was lower by over 11 per cent on a year-on-year basis in
 the first quarter.

FIGURE 2 QUARTERLY PERSONAL CONSUMPTION ON GOODS AND SERVICES: CONSTANT
 MARKET PRICES AND SEASONALLY-ADJUSTED GROWTH RATES (RHS) & LEVEL (LHS)

 30,000 10%

 25,000 5%
 0%
 20,000
 -5%
 15,000
 -10%
 10,000
 -15%
 5,000 -20%
 0 -25%
 2015Q1
 2015Q2
 2015Q3
 2015Q4
 2016Q1
 2016Q2
 2016Q3
 2016Q4
 2017Q1
 2017Q2
 2017Q3
 2017Q4
 2018Q1
 2018Q2
 2018Q3
 2018Q4
 2019Q1
 2019Q2
 2019Q3
 2019Q4
 2020Q1
 2020Q2
 2020Q3
 2020Q4
 2021Q1
 Level (€) Growth Rate (Y-on-Y)

Source: Central Statistics Office.

 Given the path of consumption expenditure is highly dependent on the degree of
 public health measures in place and the number of COVID-19 infections, it is useful
 to benchmark the Irish experience with other countries. Figure 3 presents the
 annual growth rate of consumption expenditure of households for Ireland and
 selected other European countries for which data were available. 5 The figure
 presents the average and median growth rates 6 across the other countries
 (excluding Ireland) to capture the typical experience. Also presented are the
 minimum and maximum growth rates to provide an indication of the spread across
 countries. The fall in consumption in Ireland was larger in the second quarter of
 2020 than the mean and median change in other countries. This coincided with a
 more stringent set of public health restrictions being in place in Ireland than
 elsewhere during this period (O’Toole, 2020). The recovery in Q3 and Q4 of 2020
 in Ireland was notable and in line with other countries. However, as noted earlier
 for Ireland, the average and median consumption growth for other countries (year-
 on-year) was negative in all quarters of 2020 relative to 2019, indicating the
 sustained contraction from the COVID-19 pandemic across Europe.

5 Please note the figures differ from the CSO data due to differences in data definitions between the selected series in
 Eurostat and the CSO data. The countries included are as follows: Ireland, Belgium, Czechia, Denmark, Germany,
 Estonia, Greece, Spain, France, Croatia, Italy, Latvia, Lithuania, Luxembourg, Hungary, Malta, Netherlands, Austria,
 Poland, Portugal, Romania, Slovenia, Slovakia, Finland, Sweden, Iceland, Norway, and Switzerland.
6 These are unweighted, simple averages and medians across the countries. They do not take into account country size
 etc.
Quarterly Economic Commentary – Summer 2021 | 11

 In 2021, the drop in consumption in Ireland was larger than the mean and median
 of the other countries examined; the median fall was just under 4 per cent whereas
 Ireland experienced a double-digit decline.

FIGURE 3 YEAR-ON-YEAR CHANGE IN FINAL CONSUMPTION EXPENDITURE FOR SELECTED
 EUROPEAN ECONOMIES (Q4 2019 – Q1 2021)

 10%
 5%
 0%
 -5%
 -10%
 -15%
 -20%
 -25%
 -30%
 -35%
 -40%
 2019-Q4 2020-Q1 2020-Q2 2020-Q3 2020-Q4 2021-Q1

 Average Median Min Max Ireland

Source: ESRI Analysis of Eurostat data. Series: Final consumption expenditure of households, chain linked volumes (2015). Figures may differ
 between these data and the CSO National Accounts Consumption Figure reported elsewhere due to definitional differences. The
 selection of this indicator was undertaken to ensure a consistent comparison across counties with the same variable from Eurostat.

 As public health restrictions differ across sectors and activities, and many
 companies attempt to adapt to differing expenditure channels such as online or
 click and collect activities, it is informative to explore trends in expenditure activity
 across different types of goods and services that constitute overall consumption.
 Figure 4 presents Eurostat data on different types of goods and services for Ireland
 and selected other European countries. The number of countries is lower for these
 charts as fewer countries report the subcomponents of consumption to Eurostat. 7
 The data are presented for durable goods (such as vehicles or furniture),
 non-durables (such as food items and non-reusable items), semi-durable goods,
 and services.

7 The countries are: Czechia, Denmark, Germany, Estonia, France, Italy, Latvia, Luxembourg, Malta, Netherlands, Austria,
 Romania, Finland, and Sweden as well as Ireland.
12 | Quarterly Economic Commentary – Summer 2021

FIGURE 4 YEAR-ON-YEAR CHANGE IN FINAL CONSUMPTION EXPENDITURE SUBGROUPS FOR
 SELECTED EUROPEAN ECONOMIES (Q4 2019 – Q1 2021)
 Durables Non-Durables
 Average Median Average Median
 Min Max Min Max
 30% 30%
 Ireland Ireland
 20% 20%

 10% 10%

 0% 0%

-10% -10%

-20% -20%

-30% -30%

-40% -40%

-50% -50%

 Semi-Durables Services

 Average Median Average Median Min
 Min Max
 30% 30% Max Ireland
 Ireland
 20% 20%

 10% 10%

 0% 0%

-10% -10%

-20% -20%

-30% -30%

-40% -40%

-50% -50%

Source: ESRI Analysis of Eurostat data. Series: Final consumption expenditure of households, chain linked volumes (2015).
Note: Figures may differ between these data and the CSO National Accounts Consumption Figure reported elsewhere due to definitional
 differences. The selection of this indicator was undertaken to ensure a consistent comparison across counties with the same
 variable from Eurostat.

 For Ireland, the drop in consumption of durables and non-durable goods was much
 larger than in other European countries for Q3 and Q4 2020 as well as in Q1 2021.
 The fall in semi-durable goods in Ireland was more in line with other European
 countries in 2020 but larger in Q1 2021. For services, Ireland experienced a lower
 fall in consumption in Q3 and Q4 2020 and the decline in Q1 2021 was in line with
 the experience of other European countries. In general, it appears that, relative to
 other countries, the adjustment of consumption on goods in Ireland was more than
Quarterly Economic Commentary – Summer 2021 | 13

 that for services. This likely reflects the relative strictness across countries of public
 health restrictions around retail outlet openings etc.

 To provide more insight into the development of expenditure within Ireland,
 Figure 5 presents the retail sales index. The chart presents the overall retail sales
 index as well as several sub-indices. The major drop in Q2 2020 was followed by a
 marked pick-up in Q3 whereby the retail sales index was above its pre-pandemic
 level. A consistent increase in food expenditure can be observed as households
 spent more time at home. Declines in non-food items were experienced
 periodically and correlate with the public health restrictions. The re-imposition of
 Level 5 measures in October-November 2020 and again in the first quarter of 2021
 are associated with further drops in expenditure on non-food items. Overall a
 moderate increase was experienced in April 2021 as the economy began to reopen.

FIGURE 5 DEVELOPMENTS IN RETAIL SALES INDEX (ADJUSTED TO 100 IN JANUARY 2020)

 120
 110
 100
 90
 80
 70
 60
 50
 40
 2019M01
 2019M02
 2019M03
 2019M04
 2019M05
 2019M06
 2019M07
 2019M08
 2019M09
 2019M10
 2019M11
 2019M12
 2020M01
 2020M02
 2020M03
 2020M04
 2020M05
 2020M06
 2020M07
 2020M08
 2020M09
 2020M10
 2020M11
 2020M12
 2021M01
 2021M02
 2021M03
 2021M04

 All (non-motor or bars) Food Non food (excluding motor and bars) All

Source: ESRI Analysis of CSO data. This sets the retail sales index (volumes) at 100 in January 2020.

 To understand potential paths for consumption for 2021 and beyond, it is useful to
 further explore the specific changes in detailed retail sales sub-items. Figure 6
 breaks out the sub-indices by loosely defined categories of essentials (food and
 medical supplies), non-essentials and bars, and the motor trade. While all the
 essential items experienced a similar increase in spending through 2020, the
 expenditure pattern on non-essential items is highly differentiated. Expenditure on
 hardware items, household equipment, electrical goods and other items recovered
 from the initial Q2 2020 lockdown and have remained at elevated levels since this
 point, despite the imposition of different lockdown measures. This highlights the
 changed sectoral composition of the October 2020 and January 2021 lockdowns.
Source:
 0
 20
 40
 60
 80
 100
 120
 140
 0
 20
 40
 60
 80
 100
 120
 140
 160
 80
 90
 100
 110
 120
 130
 FIGURE 6

 2019M01 2019M01
 2019M01
 2019M02 2019M02
 2019M02
 2019M03 2019M03
 2019M03
 2019M04 2019M04
 2019M04
 2019M05 2019M05
 2019M05

ESRI Analysis of CSO data.
 HH Equipment
 2019M06 2019M06 2019M06

 Books etc & other
 2019M07 2019M07

 Department stores
 2019M07
 2019M08 2019M08 2019M08
 2019M09 2019M09 2019M09

 Bars
 2019M10 2019M10
 Specialised Food & Beverages

 2019M10
 2019M11 2019M11 2019M11
 Non-specialised Food and Beverages

 2019M12 2019M12 2019M12
 2020M01 2020M01 2020M01
 2020M02 2020M02 2020M02

 Hardware etc
 14 | Quarterly Economic Commentary – Summer 2021

 2020M03 2020M03 2020M03
 ‘Essentials’

 Electrical Goods
 Food

 Non-’Essentials’
 2020M04 2020M04 2020M04
 2020M05 2020M05 2020M05

 Bars and Motor (incl. Fuel)
 DEVELOPMENTS IN RETAIL SALES SUB-INDICES

 2020M06 2020M06 2020M06
 2020M07 2020M07 2020M07
 Pharma & Medicinal

 Motor trade & fuel
 2020M08 2020M08 2020M08
 2020M09 2020M09 2020M09
 2020M10 2020M10 2020M10
 2020M11 2020M11 2020M11
 2020M12 2020M12 2020M12
 2021M01 2021M01 2021M01
 2021M02 2021M02 2021M02
 Furniture and lighting
 Clothing and Footwear

 2021M03 2021M03 2021M03

 2021M04 2021M04 2021M04
Quarterly Economic Commentary – Summer 2021 | 15

 Other retail items such as sales in Department stores, clothing and footwear, and
 furniture and lighting dropped below pre-pandemic levels in the second and third
 lockdowns. The final figure presents the expenditure on bar sales and motor
 activities (including fuel). Both of these sectors experienced a dramatic decline in
 Q2 2020. A similar pattern can be discerned from the Central Bank of Ireland data
 (Figure 7) on expenditure on credit and debit cards. These data complement the
 retail sales index as they capture expenditures that may not be covered by the
 enterprises reporting to the retail survey. However, these indices are only in value
 terms, so they are not adjusted for changes in prices over the period.

FIGURE 7 INDICES FOR EXPENDITURE ON CREDIT AND DEBIT CARDS (M1 2019 – M4 2021)
 All Retail
 Retail Services Social Other Groceries/Perishables
 Clothing
200 300 Electrical Goods
180 Hardware
160 250
140
 200
120
100 150
 80
 60 100

 40
 50
 20
 0 0
 31/01/2019 31/01/2020 31/01/2021 31/01/2019 31/01/2020 31/01/2021

 Services Entertainment
240 Transport Accommodation 200 Restaurants/Dining Entertainment
 Education Health 180
220
 Utilities Professional Services
200 160
180
 140
160
 120
140
120 100
100 80
 80 60
 60
 40
 40
 20
 20
 0 0
31/01/2019 31/01/2020 31/01/2021 31/01/2019 31/01/2020 31/01/2021

Source: ESRI Analysis of Central Bank data.
16 | Quarterly Economic Commentary – Summer 2021

 These data document a strong increase in expenditure on essential goods, and very
 large declines in expenditure on accommodation, transport, restaurants and
 general social activities. The data suggest that the declines in consumption are
 highly concentrated in certain activities. It is likely that when a recovery occurs,
 consumption will be concentrated in these ‘constrained’ areas.

 Consumption forecasts

 In terms of our outlook for consumption for 2021, a number of factors are
 particularly important. In previous Commentaries, we have noted the strong
 increase in the savings ratio in Ireland and households have, in general, been
 building up excess savings during the pandemic. As the economy begins to recover,
 and the vaccine programme continues to provide a long-term route towards fewer
 public health restrictions, we expect a very strong increase in expenditure by
 households. The recovery is likely to be uneven and is set to be focused on those
 goods and services which households have been constrained from consuming. It is
 therefore likely that many of the retail sales areas which are currently operating
 well below pre-pandemic levels (bars, restaurants, clothing and footwear,
 department stores) are likely to experience notable increases in expenditure as the
 economy begins to recover. Other goods and service items which recovered
 strongly after the initial lockdown are less likely to experience a significant increase
 in consumption as restrictions ease. In our forecast for 2021, we expect
 consumption to increase by 7.5 per cent and, for 2022, we expect consumption
 growth of 8.5 per cent.

 Developments in consumer prices

 During 2020, consumer prices fell consistently as the pandemic led to a marked
 fall-off in demand for goods and services which seemed to outweigh supply
 disruptions. However, since the turn of the year inflationary pressures have
 returned to Ireland and to other European economies. In May 2021, the inflation
 rate for Ireland had increased to just under 2 per cent as it has in the broader
 Eurozone and in large economies such as Germany and France. These trends are
 depicted in Figure 8. The pick-up in inflation is of particular interest given the long-
 term price stability target of the European Central Bank which is 2 per cent. The
 deployment of non-standard monetary policy measures, which have been critical
 in eased financial conditions and financial adjustments for many countries
 following the pandemic, may come under pressure to be withdrawn or tapered if
 price pressures continue.
Quarterly Economic Commentary – Summer 2021 | 17

FIGURE 8 HARMONISED CONSUMER PRICE INDEX – YEAR-ON-YEAR % CHANGE

 3.0
 2.5
 2.0
 1.5
 1.0
 0.5
 0.0
 -0.5
 -1.0
 -1.5
 -2.0
 2020-06

 2020-07

 2020-08

 2020-09

 2020-10

 2020-11

 2020-12

 2021-01

 2021-02

 2021-03

 2021-04

 2021-05
 Euro Area Germany Ireland France

Source: Eurostat.

 While it might not be unexpected to experience an increase in inflationary
 pressures following a period of constrained industrial and consumer activity (and
 demand rebounds), understanding the extent to which these patterns may
 represent a temporary or more permanent increase in inflation is critical for
 policymakers. To provide more insight into what is driving the rise in prices,
 Figure 9 presents the trend in inflation for four subgroups of items: non-energy
 industrial goods, energy, food, and services. It is clear that part of the inflationary
 pressure is coming from a sustained rebound in energy prices which is not
 unexpected given the declines in energy prices in 2020.

 Looking forward, an important question is whether the pick-up in inflation
 becomes more persistent? At present, the ECB does not see this risk materialising.
 In its most recent Governing Council press briefing, the ECB noted the current
 increase in inflation was likely to be temporary, due to base effects and energy
 price increases. Given the economic slack in the European economy, they note
 longer term inflation trends are below their target rate. 8 Furthermore, Lane
 (2021) 9 cautioned that recent price spikes for goods and services as economies
 continue to reopen from COVID-19 restrictions do not mark a new era of high
 inflation. However, there is a risk that, even a short period of higher inflation could
 lead to raised inflation expectations which would be incorporated into wage
 bargaining and lead to increases in labour costs. Close monitoring of inflation rates,

8 https://www.ecb.europa.eu/press/pressconf/2021/html/ecb.is210610~115f4c0246.en.html.
9 For more details see: https://www.irishtimes.com/business/economy/reopening-price-spikes-do-not-mark-new-era-
 of-inflation-philip-lane-1.4570494.
18 | Quarterly Economic Commentary – Summer 2021

 and their determinants, will be needed as the Irish and European economies
 reopen.

FIGURE 9 HARMONISED CONSUMER PRICE INDEX, BY SUBCOMPONENT, Y AXIS: YEAR-ON-
 YEAR % CHANGE
 Non-Energy Industrial Goods Energy Prices

 2.0 15.0
 1.0 10.0
 0.0
 5.0
 -1.0
 0.0
 -2.0
 -5.0
 -3.0
 -4.0 -10.0

 -5.0 -15.0
 2020-06
 2020-07
 2020-08
 2020-09
 2020-10
 2020-11
 2020-12
 2021-01
 2021-02
 2021-03
 2021-04
 2021-05

 2020-06
 2020-07
 2020-08
 2020-09
 2020-10
 2020-11
 2020-12
 2021-01
 2021-02
 2021-03
 2021-04
 2021-05
 Euro Area Ireland Euro Area Ireland

 Food (Incl. alcohol and tobacco) Services

 3.5 2.5
 3.0
 2.5 2.0
 2.0
 1.5
 1.5
 1.0
 1.0
 0.5
 0.0 0.5
 -0.5
 -1.0 0.0
 -1.5
 -2.0 -0.5
 2020-06
 2020-07
 2020-08
 2020-09
 2020-10
 2020-11
 2020-12
 2021-01
 2021-02
 2021-03
 2021-04
 2021-05
 2020-06
 2020-07
 2020-08
 2020-09
 2020-10
 2020-11
 2020-12
 2021-01
 2021-02
 2021-03
 2021-04
 2021-05

 Euro Area Ireland Euro Area Ireland

Source: Eurostat.

 Given the developments in prices, our projections for consumer price inflation for
 2021 is 1.2 per cent and 1.5 per cent for 2022. However, there is a risk that these
 estimates may be low if the increase in consumption is very strong in 2021 and this
 spills over into inflation in particular items where pent-up demand may be focused.
Quarterly Economic Commentary – Summer 2021 | 19

 TRADED SECTOR
 Key Points

 • Exports grew by 5.8 per cent in Q1 2021 compared to Q4 2020.

 • The main drivers of export growth have been medicinal and pharmaceutical
 goods and ICT which have grown strongly throughout the pandemic.

 • Compared to Q4 2020, imports declined by 8.9 per cent in Q1 2020 as both
 goods and service imports declined.

 • Irish net exports were €46.3 billion in Q1 2021.

 A notable characteristic of the Irish economy during the COVID-19 pandemic has
 been the particularly strong performance of the Irish traded sector. In Q1 2021,
 Irish exports increased by 5.8 per cent relative to the final quarter of 2020. This
 was complemented with a decline in imports of 8.9 per cent over the same period.
 The joint impact of these changes was to increase Irish net exports by €15.7 billion
 compared to Q4 2020, to approximately €46.3 billion in Q1 2021.

 Exports of both goods (merchandise) and services performed well in the first
 quarter of 2021. Figure 10 shows the annual growth in seasonally-adjusted Irish
 exports by quarter. In Q1 2021 exports increased by 17.0 per cent annually. This
 was driven by the strong growth in both services and goods exports with the
 former increasing by 7.7 per cent and the latter increasing by 25.2 per cent
 compared to Q1 2020.

FIGURE 10 SEASONALLY-ADJUSTED EXPORTS: YEAR-ON-YEAR GROWTH (VOLUME, %)

 30
 25
 20
 15
 10
 5
 0
 -5
 -10

 Export of Goods Export of Services Exports of Goods and Services

Source: Central Statistics Office.
20 | Quarterly Economic Commentary – Summer 2021

 Medical and pharmaceutical products accounted for around 40 per cent of Irish
 goods exports in Q1 2020 in terms of value. Figure 11 shows that exports of this
 commodity group were up compared to the previous quarter (7.5 per cent) and
 the same period the previous year (9.2 per cent) in Q1 2021. While the strong
 growth of this commodity sector is undoubtedly positive for the Irish economy, the
 fact that this sector is dominated by a small number of multinational corporations
 leaves the Irish economy vulnerable to the performance of a relatively small
 number of companies. As mentioned in previous Commentaries, it is also
 important to note that exports of these products may be elevated due to the
 nature of the pandemic, and once the global health emergency passes it is possible
 that there will be a reduction in such exports. Between Q4 2020 and Q1 2021 the
 value of organic chemicals exports increased by 13.6 per cent but was down by
 24.8 per cent annually. The value of exported miscellaneous manufactured goods
 fell by 5.9 per cent over the same period. The value of exports of machinery and
 transport equipment declined by 5.2 per cent compared to Q4 2020 but was down
 by 28.3 per cent compared to Q1 2020.

FIGURE 11 GOODS EXPORTS BY COMMODITY GROUP (VALUE, € MILLION)

Medicinal and pharmaceutical products

 Organic chemicals

 Machinery and transport equipment

 Miscellaneous manufactured articles

 Total food and live animals

 0 2,000 4,000 6,000 8,000 10,000 12,000 14,000 16,000 18,000

 2021Q1 2020Q4 2020Q1

Source: Central Statistics Office.

 Service exports performed well over the first quarter of 2021. Computer services,
 which accounted for 61 per cent of the value of total service exports in Q1 2021,
 grew by 20.7 per cent in the year to Q1 2021 despite being down 9.4 per cent on
 Q4 2020. As shown in Figure 12 the performance of service exports is
 predominantly influenced by the performance of the computer services sector.
Quarterly Economic Commentary – Summer 2021 | 21

 On the other hand, business services, which also account for a significant
 proportion of Irish service exports (16 per cent), experienced a decline on both an
 annual and quarterly basis in Q1 2021. The value of exports in this area decreased
 by 30.1 per cent relative to Q4 2020 and by 7.4 per cent relative to Q1 2020.
 Financial services, insurance and royalties/licenses each increased annually by
 26.8, 18.4 and 39.1 per cent respectively.

FIGURE 12 SERVICE EXPORTS BY COMPONENT (VALUE, € MILLION)

 Computer services

 All business services

 Financial services

 Insurance

 Royalties/licences

 0 5,000 10,000 15,000 20,000 25,000 30,000 35,000 40,000 45,000

 2021Q1 2020Q4 2020Q1

Source: Central Statistics Office.

 Figure 13 shows annual import growth remained negative in Q1 2021 as imports
 of both goods and services declined over the period. Compared to Q1 2020,
 imports were down by 8.9 per cent, with goods imports declining 2.0 per cent and
 services declining by 11.7 per cent. Furthermore, as is evident in the Figure 13,
 Q1 2021 marks the fourth quarter in a row that imports have decreased on an
 annual basis.
22 | Quarterly Economic Commentary – Summer 2021

FIGURE 13 SEASONALLY-ADJUSTED IMPORTS: YEAR-ON-YEAR GROWTH (VOLUME, %)

 120
 100
 80
 60
 40
 20
 0
 -20
 -40
 -60
 2018Q1 2018Q3 2019Q1 2019Q3 2020Q1 2020Q3 2021Q1

 Import of Goods Import of Services Imports of Goods and Services

Source: Central Statistics Office.

 Figure 14 shows goods imports by commodity group. Machinery and transport
 equipment accounted for 42 per cent of goods imports in terms of value in
 Q1 2021. While imports of machinery and transport equipment increased by
 8.0 per cent in the year to Q1 2021, they declined by 18.8 per cent compared to
 Q4 2020. However, this quarterly decline is on the back of a relatively large figure
 for Q4 2020, some of which may be attributable to stockpiling or purchases
 brought forward in advance of Customs changes stemming from Brexit. Organic
 chemicals and medicinal and pharmaceutical products each accounted for
 approximately 10 per cent of the value of good imports in Q1 2021. Imports of
 organic chemicals increased by 6.5 per cent annually in Q1 2021 in terms of value,
 while imports of medicinal and pharmaceutical products increased by 9.1 per cent
 over the same period despite being down 14.8 per cent on Q4 2020.
Quarterly Economic Commentary – Summer 2021 | 23

FIGURE 14 GOODS IMPORTS BY COMMODITY GROUP (VALUE, € MILLION)

 Machinery and transport equipment

 Medicinal and pharmaceutical products

 Organic chemicals

 Total food and live animals

 0 2,000 4,000 6,000 8,000 10,000 12,000

 2021Q1 2020Q4 2020Q1

Source: Central Statistics Office.

 Figure 15 shows service imports by commodity group. Business services accounted
 for 40 per cent of service imports in terms of value in Q1 2021. This includes
 services such as research and development, and operational leasing. Service
 imports in this field were down substantially both quarterly (33.6 per cent) and
 annually (55.9 per cent). While imports of royalties and licences decreased by
 27.2 per cent on a quarterly basis, service imports from this category increased by
 19.9 per cent annually. Similarly, financial service imports also experienced a
 quarterly decline (14.6 per cent) and an annual increase (15.5 per cent).

FIGURE 15 SERVICE IMPORTS BY COMMODITY GROUP (VALUE, € MILLION)

 All business services

 Royalties/licences

 Financial services

 Insurance

 Computer services

 0 10,000 20,000 30,000 40,000 50,000 60,000

 2021Q1 2020Q4 2020Q1

Source: Central Statistics Office.
24 | Quarterly Economic Commentary – Summer 2021

 After lengthy negotiations, the UK officially left the EU on 31 January 2020 and
 entered the transition period. On 31 December 2020, the transition period ended,
 and the UK now trades with EU on terms agreed in the Trade and Cooperation
 Agreement signed on 30 December 2020. However, not all aspects of the trade
 deal are fully in force at present and the pathway of trade between the UK and
 Ireland throughout 2021 and beyond will likely be affected by the manner and
 timing of the trade deal’s further implementation by both the EU and the UK.

 At present there is an asymmetry in the required Customs checks on cross-border
 trade between the EU and UK. To export goods from the UK to the EU, businesses
 now need to comply with new procedures such as UK export declarations and the
 import requirements of EU Member States. Some products such as certain chilled
 meats and plant species can no longer be exported from the UK to the EU. While
 VAT and excise rules, and ‘rules of origin’ now apply on trade in both directions,
 for imports from the EU, the UK is introducing border controls in stages with full
 Customs checks not applying until January 2022. 10 While there is still a significant
 degree of uncertainty around the timing of increases in Customs checks and the
 Northern Ireland Protocol, stricter trade rules will almost certainly have a negative
 impact on trade.

 Figure 16 shows the value of Irish trade with the UK in Q1 2021. In the first quarter
 of 2021, the value of goods exports to the UK was greater than that of imports
 resulting in a goods trade surplus of €1.3 billion. In terms of value, exports of
 services to the UK were also greater than imports resulting in a services trade
 surplus of €3.6 billion. As a result, total Irish exports to the UK were greater than
 total imports resulting in an overall trade surplus of approximately €4.9 billion. 11

10 For more Information see: https://www.gov.uk/government/publications/summary-the-uks-new-relationship-with-
 the-eu/summary-the-uks-new-relationship-with-the-eu#importing-and-exporting-goods.
11 For more information see:
 https://www.cso.ie/en/releasesandpublications/er/gei/goodsexportsandimportsmarch2021/.
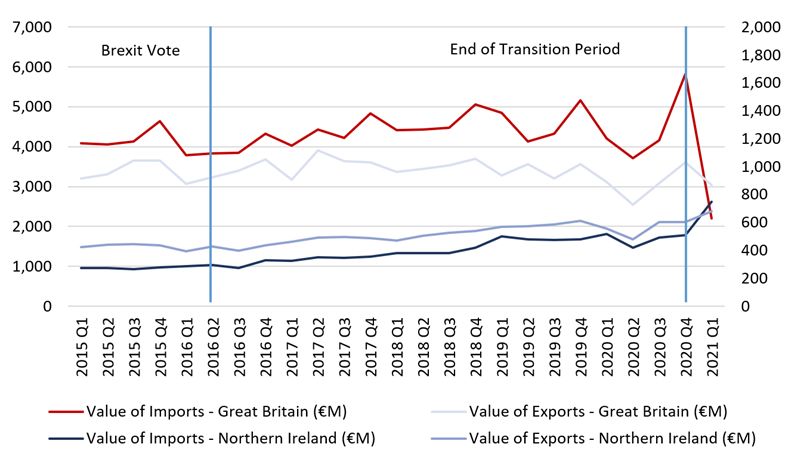
Quarterly Economic Commentary – Summer 2021 | 25

FIGURE 16 TRADE WITH THE UK IN Q1 2021 (VALUE, € MILLION)

 16,000

 14,000

 12,000

 10,000

 8,000

 6,000
 €4.9bn
 4,000 €3.6bn

 2,000 €1.3bn

 0
 Services Merchandise Total
 Exports Imports Surplus

Source: Central Statistics Office.

 Monthly goods trade data offer an insight into the impact of Brexit in the first
 quarter of 2021. Figure 17 shows the value of goods imports and exports from/to
 Great Britain (mainland UK) and Northern Ireland from January 2015 to March
 2021. While goods imports from Great Britain (GB) declined by 47.6 per cent in
 terms of value in Q1 2021 compared to Q1 2020, goods exports to GB only declined
 by 2.6 per cent over the same period. This decline in imports from GB without a
 commensurate decline in exports to GB is likely linked to the aforementioned
 asymmetry in Customs procedures between the UK and EU and has contributed to
 the increase in the Irish trade surplus documented above. The value of trade
 between Ireland and Northern Ireland also increased in Q1 2021. The value of
 goods exports to Northern Ireland increased by 22.4 per cent between Q1 2021
 and Q1 2020. The value of goods imports from Northern Ireland also increased (by
 44.2 per cent) over the same period. While the increase in imports from Northern
 Ireland represents a significant growth rate, in level terms it is dwarfed by the fall
 in imports from GB with the former worth around €82 million and the latter
 approximately €2 billion.
26 | Quarterly Economic Commentary – Summer 2021

FIGURE 17 TRADE WITH GREAT BRITAIN (LHS) AND NORTHERN IRELAND (RHS) (VALUE,
 € MILLION)

Source: QEC calculations using Central Statistics Office data.

 As the vaccine is rolled out in many countries this year and lockdowns lift, the
 economies of Ireland’s largest trading partners are expected to grow. In 2021 we
 expected both exports and imports to record positive growth with exports
 increasing by 13.3 per cent and imports increasing by 11.0 per cent annually. While
 this would constitute somewhat of a slow-down in the growth rate of exports for
 the remainder of the year compared with that observed in the first quarter, strong
 growth is still expected. We expect exports to grow by 8.3 per cent in 2022 while
 imports are expected to grow by 9.0 per cent.

 INVESTMENT
 Key Points

 • Modified investment declined by 4.8 per cent annually in Q1 2021 compared
 to a 3.8 per cent decline in Q4 2020.

 • We expect approximately 18,000 housing completions in 2021 and 21,000 in
 2022.

 • Investment forecast to grow by 5.8 per cent in 2021 and by 7.6 per cent in 2022.

 The lasting negative impact of the COVID-19 pandemic on the rate of investment
 continued during the first quarter of 2021 as public health restrictions were
 reintroduced in January. In particular, overall gross fixed capital formation (GFCF)
Quarterly Economic Commentary – Summer 2021 | 27

 declined by almost 62 per cent compared to the first quarter of 2020, while the
 quarterly change (compared to Q4 of 2020) was almost 19.5 per cent. This marks
 the fourth consecutive quarter that total investment registered negative growth.
 The significant decline is a result of the large drop in the machinery and equipment
 and intangibles categories, where investment expenditures dropped by €30 billion
 compared to Q1 2020 (-69 per cent), while investment expenditures in building and
 construction declined by 17.9 per cent.

 As has been mentioned in previous Commentaries, the overall rate of investment
 is not indicative of real investment activity in Ireland. This is due to the well
 documented distortions in the headline investment figures caused by the
 operations of large multinational firms (see FitzGerald, 2018; 2020) which mask the
 developments in underlying domestic investment behaviour. In order to obtain a
 better indication of domestic investment activity, we focus on the Modified
 Domestic GFCF series developed by the CSO, which excludes investment in
 intellectual property and aircraft related to leasing, thus removing the
 distortionary impact.

 The developments in domestic investment activity are depicted in Figure 18;
 following the 24 per cent annual decline in investment during Q2 2020, investment
 growth was negative for the rest of 2020 and for the first quarter of 2021. In
 Q1 2021 domestic GFCF declined by 4.8 per cent. Although the data for most of the
 subcomponents of modified investment were not released for this time period due
 to confidentiality reasons, the data available for the building and construction
 activity category 12 show a decline of 17.9 per cent for Q1 2021. This marks the sixth
 consecutive quarter during which domestic investment growth was negative,
 indicating the highly adverse impact of COVID-19 on investment in the Irish
 economy.

12 This category includes Dwellings, improvements and other buildings and construction. The aggregation to one category
 is necessary due to the lack of identifiable seasonality in some of the subcomponents.
You can also read


