Castration delays epigenetic aging and feminizes DNA methylation at androgen-regulated loci - eLife
←
→
Page content transcription
If your browser does not render page correctly, please read the page content below
RESEARCH ARTICLE

                                   Castration delays epigenetic aging and
                                   feminizes DNA methylation at androgen-
                                   regulated loci
                                   Victoria J Sugrue1, Joseph Alan Zoller2, Pritika Narayan3, Ake T Lu4,
                                   Oscar J Ortega-Recalde1, Matthew J Grant3, C Simon Bawden5, Skye R Rudiger5,
                                   Amin Haghani4, Donna M Bond1, Reuben R Hore6, Michael Garratt1,
                                   Karen E Sears7, Nan Wang8, Xiangdong William Yang8,9, Russell G Snell3,
                                   Timothy A Hore1†*, Steve Horvath4†*
                                   1
                                    Department of Anatomy, University of Otago, Dunedin, New Zealand;
                                   2
                                    Department of Biostatistics, Fielding School of Public Health, University of
                                   California, Los Angeles, Los Angeles, United States; 3Applied Translational Genetics
                                   Group, School of Biological Sciences, Centre for Brain Research, The University of
                                   Auckland, Auckland, New Zealand; 4Department of Human Genetics, David Geffen
                                   School of Medicine, University of California, Los Angeles, Los Angeles, United
                                   States; 5Livestock and Farming Systems, South Australian Research and
                                   Development Institute, Roseworthy, Australia; 6Blackstone Hill Station, Becks, RD2,
                                   Omakau, New Zealand; 7Department of Ecology and Evolutionary Biology, UCLA,
                                   Los Angeles, United States; 8Center for Neurobehavioral Genetics, Semel Institute
                                   for Neuroscience and Human Behavior, University of California, Los Angeles
                                   (UCLA), Los Angeles, United States; 9Department of Psychiatry and Biobehavioral
                                   Sciences, David Geffen School of Medicine at UCLA, Los Angeles, United States

*For correspondence:               Abstract In mammals, females generally live longer than males. Nevertheless, the mechanisms
tim.hore@otago.ac.nz (TAH);        underpinning sex-dependent longevity are currently unclear. Epigenetic clocks are powerful
shorvath@mednet.ucla.edu (SH)      biological biomarkers capable of precisely estimating chronological age and identifying novel
†
 These authors contributed         factors influencing the aging rate using only DNA methylation data. In this study, we developed the
equally to this work               first epigenetic clock for domesticated sheep (Ovis aries), which can predict chronological age with
                                   a median absolute error of 5.1 months. We have discovered that castrated male sheep have a
Competing interest: See
                                   decelerated aging rate compared to intact males, mediated at least in part by the removal of
page 15
                                   androgens. Furthermore, we identified several androgen-sensitive CpG dinucleotides that become
Funding: See page 15               progressively hypomethylated with age in intact males, but remain stable in castrated males and
Received: 16 November 2020         females. Comparable sex-specific methylation differences in MKLN1 also exist in bat skin and a
Accepted: 15 June 2021             range of mouse tissues that have high androgen receptor expression, indicating that it may drive
Published: 06 July 2021            androgen-dependent hypomethylation in divergent mammalian species. In characterizing these
                                   sites, we identify biologically plausible mechanisms explaining how androgens drive male-
Reviewing editor: Sara Hägg,
Karolinska Institutet, Sweden
                                   accelerated aging.

   Copyright Sugrue et al. This
article is distributed under the
terms of the Creative Commons
Attribution License, which
                                   Introduction
permits unrestricted use and       Age has a profound effect on DNA methylation in many tissues and cell types (Horvath, 2013;
redistribution provided that the   Issa, 2014; Rakyan et al., 2010; Teschendorff et al., 2010). When highly correlated age-dependent
original author and source are     sites are modeled through the use of a tool known as the epigenetic clock, exceptionally precise
credited.                          estimates of chronological age (termed ‘DNAm age’ or ‘epigenetic age’) can be achieved using only

Sugrue et al. eLife 2021;10:e64932. DOI: https://doi.org/10.7554/eLife.64932                                                    1 of 20
Research article Developmental Biology Genetics and Genomics
purified DNA as an input (Hannum et al., 2013; Horvath, 2013; Horvath and Raj, 2018;
Levine et al., 2018). For example, despite being one of the earliest epigenetic clocks constructed,
Horvath’s 353 CpG site clock is capable of estimating chronological age with a median absolute
error (MAE) of 3.6 years and an age correlation of 0.96, irrespective of tissue or cell type (Hor-
vath, 2013). Estimates generated by this and related epigenetic clocks are not only predictive of
chronological age but also biological age, allowing identification of pathologies as well as novel
genetic and environmental factors that accelerate or slow biological aging. For example, irrespective
of ethnic background, females and exceptionally long-lived individuals are found to have reduced
epigenetic aging compared to males and other controls (Horvath et al., 2016; Horvath et al.,
2015).
Lifespan in mammals (including humans) is highly dependent upon an individual’s sex, whereby
females generally possess a longevity advantage over males (Lemaı̂tre et al., 2020). Despite being
a fundamental risk factor affecting age-related pathologies, the mechanistic basis of how sex influen-
ces aging is relatively unexplored. Perhaps not surprisingly, sex hormones are predicted to play a
central role, with both androgens and estrogens thought to influence aspects of the aging process
(Horstman et al., 2012). Castration has been shown to extend the lifespan of laboratory rodents
(Asdell et al., 1967), as well as domesticated cats (Hamilton, 1965) and dogs (Hoffman et al.,
2013). Castration has also been associated with longer lifespans in historical survival reports of
14th- to 20th-century Korean eunuchs (Min et al., 2012) and men housed in US mental institutions in
the 20th century (Hamilton and Mestler, 1969), although not in castrato opera singers, somewhat
common in the 15th–19th centuries (Nieschlag et al., 1993). Conversely, estrogen production
appears to have some protective effect on aging in females, with ovariectomized mice having a
shortened lifespan (Benedusi et al., 2015) and replacement of ovaries from young animals into old
female mice extending lifespan (Cargill et al., 2003). Indeed, ovariectomy has been shown to accel-
erate the epigenetic clock (Stubbs et al., 2017), supporting predictions that estrogen production
slows the intrinsic rate of aging relative to males. In humans, natural and surgical induction of meno-
pause also hastens the pace of the epigenetic clock, while menopausal hormone therapy decreases
epigenetic aging as observed in buccal cell samples (Levine et al., 2016). Female breast tissue has
substantially advanced epigenetic age compared to other tissues (Horvath, 2013; Sehl et al.,
2017), further implicating sex hormones. Nevertheless, the effects of castration and/or testosterone
production on the epigenetic predictors of aging in males have remained unknown in either humans
or animal models prior to the current study.
Domesticated sheep (Ovis aries) represent a valuable, albeit underappreciated, large animal
model for human disease and share with humans more similar anatomy, physiology, body size,
genetics, and reproductive lifestyle as compared with commonly studied rodents
(Pinnapureddy et al., 2015). With respect to aging, sheep exhibit a remarkable female-specific life-
span advantage (Lemaı̂tre et al., 2020), and Soay sheep of the Outer Hebrides represent a corner-
stone research paradigm for longevity in wild mammal populations (Fairlie et al., 2016;
Jewell, 1997). Moreover, sheep are extensively farmed (and males castrated) in many countries,
allowing incidental study of the effect of sex and sex hormones in aging to occur without increasing
experimental animal use (Russell and Burch, 1959). Yet, exploration of the molecular aging process
in sheep is relatively underdeveloped, particularly from the perspective of epigenetics and sex.
Here, we present the first sheep epigenetic clock and quantify its median error to 5.1
months, ~3.5–4.2% of their expected lifespan. Validating the biological relevance of our sheep
model, we find age-associated methylation at genes well characterized for their role in development
and aging in a wide range of animal systems. Significantly, we observed that not only castration
affects the epigenome, but that the methylomes of castrated male sheep show reduced epigenetic
aging compared to intact male and female counterparts, a result consistent with the increased lon-
gevity of castrated Soay sheep (Jewell, 1997). Many genomic regions and genes with differential
age association between castrated and intact males were identified, some of which are known to be
regulated or bound by androgen receptor (AR) in humans and show sexually dimorphic methylation
patterns in divergent mammalian species. Taken together, these findings provide a credible mecha-
nistic link between levels of sex hormones and sex-dependent aging.
Sugrue et al. eLife 2021;10:e64932. DOI: https://doi.org/10.7554/eLife.64932 2 of 20Research article Developmental Biology Genetics and Genomics
Results
DNA methylation in blood and ear throughout sheep aging
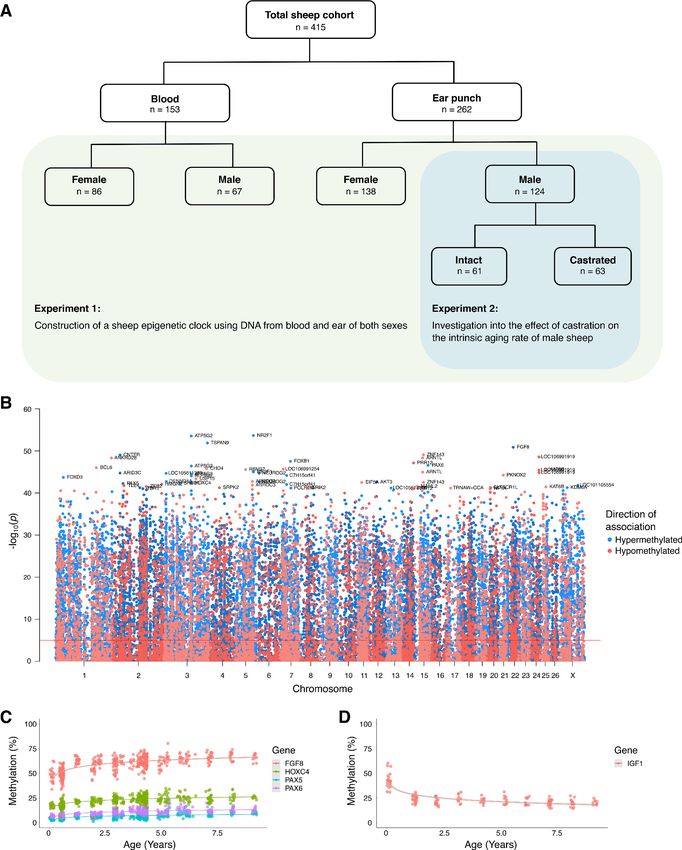
To create an epigenetic clock for sheep, we purified DNA from a total of 432 sheep of the Merino
breed (Figure 1A). The majority of DNA samples (262) were from ear punches sourced from com-
mercial farms in New Zealand, with the remaining (168) blood samples from a South Australian
Merino flock. DNA methylation was quantified using a custom 38K probe array consisting of CpG
sites conserved among a wide range of mammalian species; with 33,136 of these predicted to be
complementary to sheep sequences. Two ear samples from intact males were excluded by quality
control measures.
To initially characterize methylation data, we performed hierarchical clustering that revealed two
major clusters based on tissue source (Figure 1—figure supplement 1A). There was some sub-clus-
tering based on sex and age; however, there was no separation based on known underlying pedi-
gree variation or processing batches. Global average CpG methylation levels in ear tissue exhibited
a small progressive increase with age, though the same trend was not seen in blood (Figure 1—fig-
ure supplement 1B).
Pearson correlation coefficients (r) describing the linear relationship between CpG methylation
and chronological age ranged from 0.63 to 0.68 for all ear and blood samples (Figure 1B,
Supplementary file 1). One of the most positively correlated mapped probes was located within the
promoter of fibroblast growth factor 8 (FGF8) (Figure 1C), a well-described developmental growth
factor (r = 0.64, p=1.38E 51). Probes located within several other well-known transcription factors
(TFs) were also among those most highly correlated with age (PAX6, r = 0.62, p=2.71E 47; PAX5,
r = 0.59, p=5.75E 43; HOXC4, r = 0.59, p=4.47E 43). Indeed, when we performed ontogeny analysis,
we found that the top 500 CpGs positively correlated with age were enriched for transcription-
related and DNA binding processes (Supplementary file 2), consistent with widespread transcrip-
tional shifts during different life stages. When we stratified our data, we found considerable differen-
ces in age association with regard to tissue of origin (Figure 1—figure supplement 2); however, this
is consistent with other clock studies (Horvath, 2013; Issa, 2014). Sex and castration status also pro-
duced group-specific age association hits; however, this was comparatively less than that for tissue,
with many significantly associated sites being shared between females and males (blood, 45 shared
sites) and females, intact males, and castrated females (ear, 84 shared sites) (Figure 1—figure sup-
plement 2B, C). Interestingly, we also found a CpG (cg18266944) in the second intron of insulin-like
growth factor 1 (IGF1) that becomes rapidly hypomethylated in ear following birth before leveling
off post-adolescence (Figure 1D; r = 0.60, p=7.43E 15). We considered this a particularly encour-
aging age-associated epigenetic signal given that IGF1 is a key determinant of growth and aging
(Junnila et al., 2013; Laron, 2001).
Construction of an epigenetic clock in sheep
We established epigenetic clocks from our sheep blood and ear methylation data, respectively, as
well as a combined blood and ear clock (hereafter referred to as the multi-tissue clock) using a
penalized regression model (elastic-net regression). In total, 185 CpG sites were included in the
multi-tissue clock, which was shown to have a MAE of 5.1 months and an age correlation of 0.95
when calculated using a leave-one-out cross-validation (LOOCV) analysis (Figure 2A). Taking into
account the expected lifespan of sheep in commercial flocks (10–12 years), the error of the multi-tis-
sue clock is 3.5–4.2% of the lifespan – comparable to the human skin and blood clock at ~3.5%
(Horvath et al., 2018) and the mouse multi-tissue clock at ~5% of expected lifespan (Meer et al.,
2018; Petkovich et al., 2017; Stubbs et al., 2017; Thompson et al., 2018; Wang et al., 2017).
When blood and ear clocks are constructed separately, the ear clock outperformed the blood clock
in the LOOCV analysis (0.97 vs. 0.75 correlation, respectively, Figure 2B, C). While this may be
related to blood being a more heterogeneous tissue than ear punch, fewer samples and an overrep-
resentation of young individuals are the likely drivers of this effect.
Two human and sheep dual-species clocks were also constructed, which mutually differ by way of
age measurement. One estimates the chronological ages of sheep and human (in units of years),
while the other estimates the relative age – a ratio of chronological age of an animal to the maxi-
mum known lifespan of its species (defined as 22.8 years and 122.5 years for sheep and human,
Sugrue et al. eLife 2021;10:e64932. DOI: https://doi.org/10.7554/eLife.64932 3 of 20Research article Developmental Biology Genetics and Genomics Figure 1. Association between age and DNA methylation in sheep. (A) Depiction of sheep cohort for this study. (B) Manhattan plot of all CpGs and their correlation with chronological age. (C) Methylation levels of highly age-correlated probes within biologically relevant genes: FGF8 cg10708287 (r = 0.64, p=1.38E 51), PAX6 cg00953859 (r = 0.62, p=2.71E 47), PAX5 cg16071226 (r = 0.59, p=5.75E 43), and HOXC4 cg12097121 (r = 0.59, Figure 1 continued on next page Sugrue et al. eLife 2021;10:e64932. DOI: https://doi.org/10.7554/eLife.64932 4 of 20
Research article                                                                                Developmental Biology Genetics and Genomics

Figure 1 continued
p=4.47E 43). (D) Methylation levels of IGF1 cg18266944 in ear of females only (r = 0.60, p=7.43   15
                                                                                                       ). The p-values of the correlation were calculated
using the standardScreeningNumericTrait function in WGNCA (Student’s t-test).
The online version of this article includes the following figure supplement(s) for figure 1:
Figure supplement 1. Characteristics of the sheep study cohort.
Figure supplement 2. Correlation between methylation and age with group stratification.

                                     respectively) with resulting values between 0 and 1. The measure of relative age is advantageous as
                                     it aligns the ages of human and sheep to the same scale, yielding biologically meaningful compari-
                                     son between the two species. The dual-species clock for chronological age leads to a median error
                                     of 16.53 months when considering both species or 4.74 months for sheep only (Figure 2D, E). The
                                     dual-species clock for relative age produced median errors of 0.020 of the maximum lifespans for
                                     both species (approximately 2.45 years for human or 5.4 months for sheep) and 0.021 for sheep only
                                     (approximately 5.7 months; (Figure 2F, G)).

                                     Castration delays epigenetic aging in sheep
                                     To test the role of androgens in epigenetic age acceleration, we exploited the fact that castrated
                                     male Merino sheep are frequently left to age ’naturally’ on New Zealand high-country farms in return
                                     for yearly wool production in contrast to non-breeding males of other sheep varieties, which are usu-
                                     ally sold as yearlings for meat. Both castrated males and intact aged-matched controls were sourced
                                     from genetically similar flocks kept under comparable environmental conditions. Interestingly, intact
                                     and castrated males showed equivalent epigenetic age as juveniles; however, once they advanced
                                     beyond the yearling stage, castrates appeared to have slowed rates of epigenetic aging
                                     (Figure 3A). Indeed, when we only considered sheep beyond 18 months of age, we found
                                     that castrates had significantly reduced epigenetic age compared to intact male controls (Figure 3B,
                                     p=0.018). While the extent of age deceleration consistently increased with advancing age, mature
                                     castrates were on average epigenetically 3.1 months ’younger’ than their chronological age
                                     (Figure 3B). In contrast, DNAm age of intact males was comparable to their chronological age (0.14
                                     months age decelerated), as were females (0.76 months age accelerated), who comprised the major-
                                     ity of the samples from which the clock was constructed. Notably, the age deceleration observed in
                                     castrates was corroborated using the human and sheep dual-species clock (Figure 3—figure supple-
                                     ment 1, p=0.04).
                                         To explore the mechanistic link between androgens and epigenetic aging, we identified 4694
                                     probes with significant differences between the rate of age-dependent methylation changes in cas-
                                     trated or intact males (Supplementary file 3). A recent comparison of age-related methylation
                                     changes in the blood of human males and females revealed that almost all regions of interest
                                     appeared to be X-linked (McCartney et al., 2019). Given that there are already well-characterized
                                     differences between male and female methylation patterns on the X-chromosome as a result of
                                     gene-dosage correction (Heard and Disteche, 2006), it could be argued that X-linked age-related
                                     differences may be driven by peculiarities of methylation arising from X-chromosome inactivation as
                                     opposed to differences in androgen production per se. To test this for sheep, we examined the
                                     genomic location of our androgen-sensitive differentially methylated probes (asDMPs) and found
                                     that they are evenly distributed between individual autosomes and the sex chromosomes (Figure 4—
                                     figure supplement 1A).
                                         Interestingly, we found several sites that become progressively hypomethylated in intact males
                                     with age but maintain a consistent level of methylation throughout life in castrates and females
                                     (Figure 4A–D). Indeed, of the top 50 most significantly different asDMPs, only 2 (cg03275335 GAS1
                                     and cg13296708 TSHZ3) exhibited gain of methylation in intact males (Figure 5A). We found that
                                     many asDMPs were linked to genes known to be regulated by AR (e.g., MKLN1, LMO4, FN1,
                                     TIPARP, ZBTB16; Jin et al., 2013), and as such, were encouraged to find further mechanistic connec-
                                     tions between asDMPs and TF regulation.
                                         To do this, we examined TF binding of the human regions homologous to our asDMPs using the
                                     Cistrome dataset; although Cistrome contains data from a wide range of TFs, we noted that AR
                                     binds to over half the top 50 asDMPs (28/50), with the 14 most significant all showing AR binding

Sugrue et al. eLife 2021;10:e64932. DOI: https://doi.org/10.7554/eLife.64932                                                                           5 of 20
Research article Developmental Biology Genetics and Genomics
A Sheep Multi Tissue (n=430)
cor=0.95, MAE=0.4259
B Sheep Blood (n=168)
cor=0.75, MAE=0.3202
C Sheep Ear (n=262)
cor=0.97, MAE=0.4474
7
6 6
6
DNAm Age
DNAm Age
DNAm Age
5 3
3
4
0 0
3
0.0 2.5 5.0 7.5 3 4 5 6 7 0.0 2.5 5.0 7.5
Chronological Age Chronological Age Chronological Age
D Human&Sheep Dual Species (n=1282)
cor=0.99, MAE=1.379
E Sheep Multi Tissue (n=430)
cor=0.95, MAE=0.3958
8
75
6
DNAm Age
DNAm Age
50
4
25 2
0 Sheep Ear
0
Sheep Blood
0 25 50 75 0.0 2.5 5.0 7.5
Chronological Age Chronological Age Human
F Human&Sheep Dual Species (n=1282)
cor=0.98, MAE=0.02202
G Sheep Multi Tissue (n=430)
cor=0.98, MAE=0.02073
0.6 0.3
Relative DNAm Age
Relative DNAm Age
0.2
0.4
0.1
0.2
0.0
0.0
0.0 0.2 0.4 0.6 0.0 0.1 0.2 0.3 0.4
Relative Age Relative Age
Figure 2. Comparison of chronological age (x-axis) and epigenetic age (y-axis) for a variety of clock models trained on (A–C) sheep only or (D–G)
humans and sheep. Epigenetic age (DNAm age), correlation (cor), and median absolute error (MAE) are indicated for (A) sheep multi-tissue (ear and
blood) (cor = 0.95, MAE = 0.4259), (B) sheep blood (cor = 0.75, MAE = 0.3202), and (C) sheep ear (cor = 0.97, MAE = 0.4474) clocks. For (D–G), clocks
were created using methylation data from both humans and sheep, with DNAm age predictions displayed for (D) human and sheep (cor = 0.99,
MAE = 1.379) and (E) sheep only (cor = 0.95, MAE = 0.3958) as calculated using absolute time (years). DNAm age was also calculated relative to
maximum lifespan for (F) human and sheep (cor = 0.98, MAE = 0.02202) and (G) sheep only (cor = 0.98, MAE = 0.02073). Maximum lifespan values used
were for human and sheep, respectively, were 122.5 years and 22.8 years. Each data point represents one sample, colored based on origin.
(Figure 5A). To ensure that this was not a result expected by chance alone, we performed empirical
sampling whereby 1000 replicates of binding analysis were performed, but with 50 random CpG
sites from the methylation array at each bootstrap replicate. The observed/expected enrichment for
AR binding in the top 50 asDMPs within the Cistrome dataset was 9.9-fold (16.5%/1.67%, pResearch article Developmental Biology Genetics and Genomics
A 6 Chronological age
Intact male B 1
*
Age Acceleration (Years)
5
4
3
DNAm Age (Years)
2
1 0.5
Chronological age
4
Castrated male
5 0
4
3
2
1
-0.5
2
-1
0
0 20 40 60 Female Intact male Castrated male
Rank Sex
Figure 3. Epigenetic age deceleration in castrated sheep. (A) Epigenetic age in age-matched castrated and intact males. To equate the cohort sizes for
intact and castrated males, two age-matched castrates with DNAm age estimates closest to the group mean were excluded. (B) Age acceleration
based on sex and castration status in sexually mature sheep only (ages 18 months+ only). Castrated males have decelerated DNAm age compared to
intact males (*p=0.018, Mann–Whitney U test).
The online version of this article includes the following figure supplement(s) for figure 3:
Figure supplement 1. Age acceleration based on sex and castration status in sexually mature sheep only (age 18 months+ only) using the human and
sheep dual-species clock.
expected ratios >2 for the top 50 asDMPs, including the estrogen (ESR1) and progesterone (PR)
receptors, as well as CCAAT/enhancer-binding protein beta (CEBP) and forkhead box A1 (FOXA1)
(Figure 5B). These effects were not seen across all asDMPs - high observed/expected binding ratios
were only found in the first 150 most significant asDMPs (e.g., AR and NR3C1 in Figure 4—figure
supplement 1C, D), after which only background enrichment was seen.
While we saw similar features at other asDMPs (Figure 5—figure supplement 1), the asDMP that
was the most different in epigenetic aging rate between castrates and males, MKLN1, stood out as
being particularly interesting from a gene regulatory perspective (Figure 5C). Overlapping with this
site, and AR binding, were peaks of DNase I hypersensitivity, H3K27ac histone marks, as well as
good vertebrate conservation compared to surrounding sequences.
asDMPs are associated with body mass in juvenile males and conserved
in divergent mammalian species in a tissue-specific manner
Juvenile males in our study did not show alterations in epigenetic age according to castration status
(Figure 3A). Nevertheless, mass of these animals was recorded, and intact males were on average
heavier than castrates, implying that there are phenotypic consequences of androgen exposure even
during early puberty (Figure 6A). To explore this further, we tested if there was any relationship
between the mass of juvenile males and methylation at asDMPs. Interestingly, when examined in
windows of 100 (thus reducing noise), the most prominent asDMPs showed a negative association
with sheep mass in intact males, but a positive association in castrates (Figure 4—figure supple-
ment 2B). As less prominent asDMPs were analyzed, the significant difference between the castrate
and intact male associations was lost (Figure 4—figure supplement 2C). Together, this shows that
divergence of methylation at asDMP sites occurs early (i.e., as soon as physical traits like mass
become dimorphic between intact and castrated males) and before differences in epigenetic age
are manifested.
Sugrue et al. eLife 2021;10:e64932. DOI: https://doi.org/10.7554/eLife.64932 7 of 20Research article Developmental Biology Genetics and Genomics
A 90
MKLN1 (cg21524116) B ETAA1 (cg01822430)
90
80
Methylation (%)
Methylation (%)
70 80
60
70
50
40 60
30
0.0 2.5 5.0 7.5 0.0 2.5 5.0 7.5
Chronological Age Chronological Age
C LMO4 (cg15851301) D 80
KIAA2026 (cg00658920)
80
Methylation (%)
Methylation (%)
60
60
40
40
20
0.0 2.5 5.0 7.5 0.0 2.5 5.0 7.5
Chronological Age Chronological Age
Sex
Female
Intact male
Castrated male
Figure 4. Androgen-sensitive differentially methylated probes (asDMPs) in sheep ear. (A) MKLN1 (cg21524116, p=1.05E 27), (B) ETAA1 (cg01822430,
p=1.31E 13), (C) LMO4 (cg15851301, p=1.62E 09), and (D) KIAA2026 (cg00658920, p=2.46E 09). The p-values were calculated using a t-test of the
difference in linear regression slopes.
The online version of this article includes the following figure supplement(s) for figure 4:
Figure supplement 1. Androgen-sensitive differentially methylated probes (asDMPs).
Figure supplement 2. Mass and methylation in young male sheep.
While the discovery of androgen-dependent age-associated methylation in sheep ear appeared
striking, particularly for sites like MKLN1, we were unsure as to how widespread this phenomenon
would be. Indeed, it appeared that significant male-specific hypomethylation was not present in
sheep blood; and such compelling examples of this effect had not been reported previously in other
species (most studies of which also involved blood). To explore this further, we assessed methylation
changes in several mouse tissues using the pan-mammalian array. Again, cg21524116 in MKLN1
stood out – muscle, tail, and kidney exhibited the same male-specific hypomethylation as seen in
sheep, whereby females retain a constant level of high methylation (Figure 6A, B). Importantly, how-
ever, this same trend could not be seen in mouse blood, cerebellum, cortex, and liver. To explain
this tissue specificity, we made use of microarray expression data from mouse (Su et al., 2002) and
Sugrue et al. eLife 2021;10:e64932. DOI: https://doi.org/10.7554/eLife.64932 8 of 20Research article Developmental Biology Genetics and Genomics
A MKLN1 cg21524116
B
cg01822430
cg05771328
LINC01364 cg15851301
KIAA2026 cg00658920
SETD5 cg17489709
TEX41 cg12129962 Intact male methylation
LINC01364 cg11082332
RBM10 cg03197661 relative to castrated male 20
% of Cistrome Output Obsersved, Top 50 asDMPs
LINC01364 cg12863556
NOVA1 cg03121178 Decrease with age
BCOR cg18315252
cg09315446 Increase with age AR
SRRM2 cg07324453
CACNA1I cg06579027
CASZ1 cg06145973
LINC01894 cg14592546 Androgen receptor 15
KCNIP1 cg11035838
Fold change
CpG ID and Gene Name
PHC3 cg20017216 binding
FN1 cg07158748
SCUBE3 cg12357722
RUNX1T1 cg01090134
Observed >5
LINC01235 cg12120400
Not observed
MAP2K5 cg08979438
NOVA1 cg01675333
>2,Research article Developmental Biology Genetics and Genomics
Figure 5 continued
based upon empirical sampling at random CpGs (average of 1000 bootstrap replicates). TFs with greater than twofold variation and an absolute value
of >1% are labeled with error bars showing the range of TF binding in bootstrap sampling. Colors indicate fold-change between observed and
expected TF binding; 5 (purple) (C) Genomic view of MKLN1 containing the most significant asDMP cg21524116 illustrating
AR binding and indicators of active chromatin.
The online version of this article includes the following figure supplement(s) for figure 5:
Figure supplement 1. Gene views of key androgen-sensitive sites showing evidence for possible regulatory functions.
found that the AR is highly expressed in muscle, kidney, and (epidermis of) skin, tissues where andro-
gen sensitivity at MKLN1 was also observed (Figure 6C). In contrast, AR expression is significantly
lower in cerebellum, cortex, and liver where male-specific hypomethylation at MKLN1 is not
observed.
Currently, few datasets using the pan-mammalian array have been published that involve skin or
other tissues where AR expression is expected to be high. Nevertheless, DNA methylation levels in
skin from a range of bat species have recently been released (Wilkinson et al., 2021). We found
that at least within Phyllostomus and Pteropus genera, where sufficient numbers of male and female
samples were collected, male-specific hypomethylation of MKLN1 was present (Figure 6—figure
supplement 1). When considered alongside the mouse data, this implies that androgen-dependent
A Blood Cerebellum Cortex Liver
80 45
84
46
Methylation (%)
Methylation (%)
Methylation (%)
Methylation (%)
40 82
75
44
35 80
70 42
78
30
40
65 76
25
38 74
0.0 0.5 1.0 1.5 2.0 0.0 0.5 1.0 1.5 2.0 0.0 0.5 1.0 1.5 2.0 0.0 0.5 1.0 1.5 2.0
Age (Years) Age (Years) Age (Years) Age (Years)
B Muscle Tail Kidney C 0.5 **
70
AR Relative Expression
70
75 0.4
65
Methylation (%)
Methylation (%)
Methylation (%)
60 65
0.3
55 70
60 0.2
50
45 0.1
65 55
40 0.0
0.0 0.5 1.0 1.5 2.0 0.4 0.8 1.2 1.6 0.60 0.65 0.70 0.75 0.80 Androgen Androgen
Age (Years) Age (Years) Age (Years) Insensitive Sensitive
Male Female
Figure 6. Sex-specific methylation patterns for cg21524116 (MKLN1) in mouse tissues are linked to androgen receptor (AR) expression. In specific
tissues of mouse, probe cg21524116 (MKLN1) exhibits either (A) no sex differences or (B) male exaggerated hypomethylation during aging. (C) AR
mRNA expression is significantly higher in tissues showing male hypomethylation at MKLN1 (epidermis, kidney, skeletal muscle) compared to tissues
where MKLN1 methylation is not different between sexes (cerebellum, cortex, liver) (p=0.007; t-test).
The online version of this article includes the following figure supplement(s) for figure 6:
Figure supplement 1. Androgen-sensitive methylation patterns at cg21524116 (MKLN1) in skin of several bat species.
Sugrue et al. eLife 2021;10:e64932. DOI: https://doi.org/10.7554/eLife.64932 10 of 20Research article Developmental Biology Genetics and Genomics
alterations in DNA methylation age association exist, at least to some extent, in a wide range of
mammalian species.
Discussion
Epigenetic clocks are accurate molecular biomarkers for aging that have proven to be useful for
identifying novel age-related mechanisms, diseases, and interventions that alter the intrinsic aging
rate (Horvath and Raj, 2018). Here, we developed the first epigenetic clock for sheep and show
that it is capable of estimating chronological age with a MAE of 5.1 months – between 3.5% and
4.2% of the average sheep lifespan. Significantly, we also present the first evidence that castration
feminizes parts of the epigenome and delays epigenetic aging.
Improved survival has previously been reported in castrated sheep compared to intact males and
females, at least part of which has been attributed to behavioral changes such as reduced aggres-
sion (Jewell, 1997). Our data shows that castration also causes a delay in intrinsic aging as assessed
by the epigenetic clock, with an average reduction in epigenetic age of 3.1 months (Figure 3B).
Moreover, delayed epigenetic aging in castrates is also seen relative to intact males and females,
which is consistent with castrated males outliving intact animals of both sexes (Jewell, 1997). We
also find that the degree of age deceleration observed in castrated males is dependent on their
chronological age. For instance, the average DNAm deceleration is increased by an additional 1.2
months when considering individuals aged beyond 2.9 years. In contrast, we saw no difference
between castrated and intact males younger than 18 months. Together this implies that the effects
of androgen exposure on the epigenome and aging are cumulative. Similar findings of greater
age deceleration at later chronological ages have been observed in rodent models, with long-lived
calorie-restricted mice showing a younger epigenetic age relatively late in life, but similar epigenetic
aging rates at younger ages (Petkovich et al., 2017).
These results support the reproductive cell-cycle theory as an explanation for sex-dependent dif-
ferences in longevity of mammals (Atwood and Bowen, 2011; Bowen and Atwood, 2004). Andro-
gens and other testicular factors may be working in an antagonistic pleiotropic manner whereby
they push cells through the cell cycle and promote growth in early life to reach reproductive matu-
rity, thus also influencing the epigenome in an age-related manner. This process, however, may
become dysregulated and promote senescence at older ages, reflected in the hastening of the epi-
genetic clock observed in intact males compared to castrates. It is well known in farming practice
that where it can be managed appropriately, leaving male sheep intact or partially intact (i.e., crypt-
orchid) increases body mass (Seideman et al., 1982), something we also observed in our study (Fig-
ure 4—figure supplement 2A). This indicates greater rates of cell cycle progression, cellular
division, and tissue hyperplasia. Under this hypothesis, the effects of castration should depend on
whether animals are castrated before or after puberty. In rats, castration just after birth (i.e., prior to
puberty) causes substantial lifespan extension while castration after puberty has smaller effects
(Talbert and Hamilton, 1965), supporting the idea that male gonadal hormones have effects at
early-life stages that have deleterious consequences for survival.
Consequences of castration for increased survival and slowed epigenetic aging could also be
linked to the effects of androgens on sexual dimorphism and adult reproductive investment
(Brooks and Garratt, 2017). Life history theories predict that males in highly polygynous species,
like sheep, should be selected to invest heavily in reproduction early in life, even at the expense of a
shorter lifespan, because they have the potential to monopolize groups of females and quickly pro-
duce many offspring (Clutton-Brock and Isvaran, 2007; Tidière et al., 2015). By contrast, selection
on females should promote a slower reproductive life strategy because female reproductive rate is
limited by the number of offspring they can produce. While we show that castration slows epigenetic
aging in sheep, loss of ovarian hormone production in mice and human (through ovariectomy or
menopause) is associated with a hastening of the epigenetic clock (Levine et al., 2016;
Stubbs et al., 2017), consistent with the beneficial effects of female ovarian hormones on survival.
Thus, it appears that both male and female sex hormones differentially regulate the epigenetic aging
process in directly opposing ways, in a manner that is consistent with the life history strategies classi-
cally thought to be optimal for each sex.
Comparison of intact and castrated males also allowed us to identify several age-related DMPs
that display clear androgen-sensitivity (asDMPs, Figure 4A–D), with castrated males exhibiting a
Sugrue et al. eLife 2021;10:e64932. DOI: https://doi.org/10.7554/eLife.64932 11 of 20Research article Developmental Biology Genetics and Genomics
feminized methylation profile compared to intact counterparts at these sites. In contrast to similar
experiments performed in human blood, we found that these sex-specific CpG sites are not predom-
inantly X-linked in sheep (McCartney et al., 2019), but are instead distributed evenly throughout
the genome (Figure 4—figure supplement 1A). As yet, we do not know if castration in later life
would drive feminization of methylation patterns as we observed for early-life castration (Figure 4).
This is, however, an interesting consideration – it is possible that castration late in life would quickly
recapitulate the methylation differences seen in those castrated early in life or it may be that methyl-
ation patterns established during early growth and development are difficult to change once set on
a particular aging trajectory. This distinction may be important from a functional perspective because
early- and later-life castration can have differing effects on survival in rodents (Talbert and Hamilton,
1965). Moreover, while early-life castration has been shown to extend human lifespan, androgen
depletion in elderly men can be associated with poor health (Araujo et al., 2011).
Many of the highly significant asDMPs (i.e., 28/50, or 58%) are bound by AR (Figure 5A). When
considering TF binding compared to background levels, our data shows that particularly AR, but
also NR3C1, ESR1, FOXA1, and CEBP binding are enriched in the most significant asDMPs; all of
which share biologically integrated functions. NR3C1, which encodes the GR and has been previ-
ously linked to longevity in certain populations (Olczak et al., 2019), is an anabolic steroid receptor;
thus, it shares significant homology in its binding domain with AR and targets many DNA sequences
also bound by AR (Claessens et al., 2017). CEBP is known to directly bind AR in prostate cells
(Agoulnik et al., 2003). FOXA1 has been found to regulate estrogen receptor binding
(Carroll et al., 2005; Hurtado et al., 2011) as well as AR and GR binding (Sahu et al., 2013) in both
normal and cancer cells. Furthermore, FOXA1 aids in ESR1-mediated recruitment of GRs to estrogen
receptor binding regions (Karmakar et al., 2013). Interestingly, AR agonist treatment in breast can-
cer models reprograms binding of both FOXA1 and ESR (Ponnusamy et al., 2019), suggesting
some degree of antagonistic function between the androgen and estrogen receptors. If this is true
for asDMPs, these sites may well represent a conduit through which castrates and androgen-
deprived males take on physiologically feminized traits, including delayed aging.
Having said this, it remains a possibility that methylation levels at androgen-sensitive sites have
very little to do with biological aging and instead only diverge as time progresses due to the period
of androgen exposure or deficiency. Specifically, the changes in methylation observed between
intact and castrated males may not be adaptive at all, and rather, methylation is progressively
‘diluted’ by binding of AR to the DNA. Variable methylation at AR target genes has been reported
in humans with androgen insensitivity syndrome (AIS) when compared to normal controls
(Ammerpohl et al., 2013), supporting the notion that AR binding could influence age-associated
methylation profiles.
The most striking example of age-dependent androgen-sensitive DNA methylation loss we found
was that detected by the probe cg21524116, mapping to MKLN1 (Muskelin) (Figure 4A). Evidence
for MKLN1 androgen-dependence has previously been reported (Jin et al., 2013), and MKLN1-con-
taining complexes have been shown to regulate lifespan in Caenorhabditis elegans (Hamilton et al.,
2005; Liu et al., 2020), although no links between this gene and mammalian longevity are yet
known. Chromatin immunoprecipitation and sequencing (ChIP-seq) data demonstrates enriched AR
binding at the position of this asDMP in human, as well as exhibiting high-sequence conservation,
DNase hypersensitivity and H3K27ac marks – the latter two of which are markers of open chromatin
and indicate transcriptionally active areas (Figure 5C; Creyghton et al., 2010; Wang et al., 2008).
Significantly, we found that MKLN1 hypomethylation can be seen in skin from male bats, as well as
tail, muscle, and kidney from mice – all tissues where there is high expression of AR (Figure 6A, B).
In contrast, tissues showing no sex-dependent methylation changes in MKLN1 during aging (i.e., cor-
tex, cerebellum, and liver) show lower or silenced expression of AR. While this needs to be tested in
more species and tissues, together this implies that MKLN1 and other asDMPs represent potential
biomarkers of androgen exposure over long time periods in a broad range of mammals.
In summary, this paper describes a robust epigenetic clock for sheep that is capable of estimating
chronological age, detecting accelerated rates of aging, and contributes to a growing body of work
on epigenetic aging. In addition to demonstrating the utility of sheep as an excellent model for
aging studies, our data identify androgen-dependent age-associated methylation changes that
affect known targets of sex hormone pathways and hormone binding TFs. While these changes may
not promote aging per se, identification of loci with age-dependent androgen-sensitive methylation
Sugrue et al. eLife 2021;10:e64932. DOI: https://doi.org/10.7554/eLife.64932 12 of 20Research article Developmental Biology Genetics and Genomics
patterns uncovers novel mechanisms by which male-accelerated aging in mammals can be
explained.
Materials and methods
DNA extraction and quantitation
Sheep DNA samples for this study were derived from two distinct tissues from two strains: ear tissue
from New Zealand Merino and blood from South Australian Merino.
Sheep ear DNA source
Ear tissue was obtained from females and both intact and castrated male Merino sheep during rou-
tine on-farm ear tagging procedures in Central Otago, New Zealand. As a small piece of tissue is
removed during the ear tagging process that is usually discarded by the farmer, we were able to
source tissue and record the year of birth without altering animal experience, in accordance with the
New Zealand Animal Welfare Act (1999) and the National Animal Ethics Advisory Committee
(NAEAC) Occasional Paper No 2 (Carsons, 1998). The exact date of birth for each sheep is
unknown; however, this was estimated to be the 18th of October each year, according to the date
at which rams were put out with ewes (May 10th of each year), a predicted mean latency until mating
of 12 days, and the mean gestation period from a range of sheep breeds (149 days) (Fogarty et al.,
2005). Castration was performed by the farmer using the rubber ring method within approximately
5–50 days from birth as per conventional farming practice (National Animal Welfare Advisory Com-
ittee NZ, 2018). Mass of yearlings was recorded by the farmer for both castrated and intact male
sheep at 6.5 months of age as a part of routine growth assessment. In total, ear tissue from 138
female sheep aged 1 month to 9.1 years and 126 male sheep (63 intact, 63 castrates) aged 6 months
to 5.8 years was collected and subjected to DNA extraction (Figure 1A).
DNA was extracted from ear punch tissue using a Bio-On-Magnetic-Beads (BOMB) protocol
(Oberacker et al., 2019), which isolates DNA molecules using solid-phase reversible immobilization
(SPRI) beads. Approximately 3 mm punches of ear tissue were lysed in 200 mL TNES buffer (100 mM
Tris, 25 mM NaCl, 10 mM EDTA, 10% w/v SDS), supplemented with 5 mL 20 mg/mL Proteinase K
and 2 mL RNAse A and incubated overnight at 55˚C as per BOMB protocols. The remainder of the
protocol was appropriately scaled to maximize DNA output while maintaining the necessary 2:3:4
ratio of beads:lysate:isopropanol. As such, 40 mL cell lysate, 80 mL 1.5X GITC (guanidinium thiocya-
nate), 40 mL TE-diluted Sera-Mag Magnetic SpeedBeads (GE Healthcare, GEHE45152105050250),
and 80 mL isopropanol were combined. After allowing DNA to bind the SPRI beads, tubes were
placed on a neodymium magnetic rack for ~5 min until the solution clarified and supernatant was
removed. Beads were washed 1 with isopropanol and 2 with 70% ethanol, and then left to air dry
on the magnetic rack. 25 mL of MilliQ H2O was added to resuspend beads, and tubes were removed
from the rack to allow DNA elution. Tubes were once again set onto the magnets, and the clarified
solution (containing DNA) was collected.
DNA was quantified using the Quant-iT PicoGreen dsDNA assay kit (Thermo Fisher Scientific,
cat# P11496). 1 mL DNA sample was added to 14 mL TE diluted PicoGreen in MicroAmp optical 96-
well plates (Thermo Fisher Scientific, cat# N8010560) as per the manufacturer’s directions, sealed,
and placed into a QuantStudio qPCR machine for analysis. Samples with DNA content greater than
the target quantity of 25 ng/mL were diluted with MilliQ.
Sheep blood DNA source
DNA methylation was analyzed in DNA extracted from the blood of 153 South Australian Merino
sheep samples (80 transgenic Huntington’s disease model sheep [OVT73 line] [Jacobsen et al.,
2010] and 73 age-matched controls) aged from 2.9 to 7.0 years (Figure 1A). All protocols involving
OVT73 sheep were approved by the Primary Industries and Regions South Australia (PIRSA, approval
number 19/02) Animal Ethics Committee with oversight from the University of Auckland Animal
Ethics Committee. The epigenetic age of the transgenic sheep carrying the HTT gene was not signif-
icantly different from controls (p=0.30, Mann–Whitney U test); therefore, the data derived from
these animals was subsequently treated as one dataset (Figure 1—figure supplement 1C).
Sugrue et al. eLife 2021;10:e64932. DOI: https://doi.org/10.7554/eLife.64932 13 of 20Research article Developmental Biology Genetics and Genomics
300 mL thawed blood samples were treated with two rounds of red cell lysis buffer (300 mM
sucrose, 5 mM MgCl2, 10 mM Tris pH8, 1% Triton X-100) for 10 min on ice, 10 min centrifugation at
1800 RCF, and supernatant removed between each buffer treatment. The resulting cell pellet was
incubated in cell digestion buffer (2.4 mM EDTA, 75 mM NaCl, 0.5% SDS) and Proteinase K (500 mg/
mL) at 50˚C for 2 h. Phenol:chloroform:isoamyl alcohol (PCI, 25:24:1; pH 8) was added at equal vol-
umes, mixed by inversion, and placed in the centrifuge for 5 min at 14,000 RPM at room tempera-
ture (repeated if necessary). The supernatant was collected and combined with 100% ethanol at 2
volume, allowing precipitation of DNA. Ethanol was removed and evaporated, and 50 mL TE buffer
(pH 8) was added to resuspend genomic DNA. DNA sample concentration was initially quantified
using a nanodrop, followed by Qubit.
Data processing and clock construction
A custom Illumina methylation array (‘HorvathMammalMethyl40’) was used to measure DNA methyl-
ation. These arrays include 36k CpG sites conserved across mammalian species, though not all
probes are expected to map to every species (Arneson et al., 2021). Using QuasR (Gaidatzis et al.,
2015), 33,136 probes were assigned genomic coordinates for sheep genome assembly OviAri4.
Raw .idat files were processed using the minfi package for RStudio (v3.6.0) with noob background
correction (Aryee et al., 2014; Triche et al., 2013). This generates normalized beta values that rep-
resent the methylation levels at probes on a scale between 0 (completely unmethylated) and 1 (fully
methylated).
185 CpG sites were selected for the sheep epigenetic clock by elastic net regression using the
RStudio package glmnet (Friedman et al., 2009). The elastic net is a penalized regression model
that combines aspects of both ridge and lasso regression to select a subset of CpGs that are most
predictive of chronological age. 88 and 97 of these sites correlated positively and negative with age,
respectively. Epigenetic age acceleration was defined as residual resulting from regressing DNAm
age on chronological age. By definition, epigenetic age acceleration has zero correlation with chro-
nological age. Statistical significance of the difference in epigenetic age acceleration between each
male group (castrated versus intact) was determined using a non-parametric two-tailed Mann–Whit-
ney U test applied to sexually mature sheep only (>18 months of age).
The human and sheep dual-species clock was created by combining our sheep blood and ear
sourced data with human methylation data previously measured using the same methylation array
(‘HorvathMammalMethyl40’) (Arneson et al., 2021). This data comprises 1848 human samples aged
0–93 years and includes 16 different tissues. The clock was constructed identically to the sheep only
clock, with an additional age parameter relative age defined as the ratio of chronological age by
maximum age for the respective species. The maximum age for sheep and humans was set at 22.8
years and 122.5 years, respectively, as defined in the anAge database (de Magalhães et al., 2009).
Identification of age-associated and androgen-sensitive DMPs
Age-associated DMPs were identified using the weighted gene co-expression network analysis
(WGCNA) function standardScreeningNumericTrait (Langfelder and Horvath, 2008), which calcu-
lates the correlation between probe methylation and age. WGCNA outputs Pearson correlation as
standard; however, we repeated the analysis using Spearman correlation and good consistency was
seen generally, with regions of interest (e.g., PAX6, FGF8, PAX5, HOXC4, and IGF1) showing very
similar results. Significance values reported are uncorrected for multiple testing. Where mapped,
gene names for the top 500 positively correlated probes were input into DAVID (Dennis et al.,
2003) for functional classification analysis with the O. aries genes present on the methylation array
as background. asDMPs were identified using a t-test of the difference between the slopes of linear
regression lines applied to methylation levels across age in each sex. A difference in slope indicates
that there is an interaction between age and sex for methylation status of a particular probe.
TF binding analysis
TF binding at specific asDMPs was evaluated by entering the equivalent human probe position into
the interval search function of the Cistrome Data Browser Toolkit, an extensive online collection of
ChIP-seq data (Mei et al., 2017; Zheng et al., 2019). TFs binding CpGs of interest in human were
analyzed using a custom R script, with ChIP-seq tracks being viewed by Cistrome link in the UCSC
Sugrue et al. eLife 2021;10:e64932. DOI: https://doi.org/10.7554/eLife.64932 14 of 20Research article Developmental Biology Genetics and Genomics
genome browser alongside additional annotation tracks of interest for export and figure creation in
Inkscape. To model the background levels of TF binding, 1000 replicates of 50 random probes sites
were run in a similar manner using the Cistrome Human Factor dataset and compared to sheep
orthologs in batches of 50 asDMPs using BEDtools (Quinlan and Hall, 2010) as well as custom R
and Python scripts.
Acknowledgements
We thank Ari Samaranayaka for his guidance with portions of the statistical analyses.
Additional information
Competing interests
Donna M Bond: Director and shareholder of Totovision, a small agricultural consultancy. Reuben R
Hore: Commercial sheep famer. Timothy A Hore: is a shareholder and director of Totovision Ltd, a
small agricultural and biotechnology consultancy. Steve Horvath: is a founder of the non-profit Epi-
genetic Clock Development Foundation which plans to license several patents from his employer UC
Regents, including a patent for the mammalian assay utilised in this study (WO2020150705). The
other authors declare that no competing interests exist.
Funding
Funder Author
Paul G. Allen Frontiers Group Steve Horvath
University of Otago Timothy A Hore
The funders had no role in study design, data collection and
interpretation, or the decision to submit the work for publication.
Author contributions
Victoria J Sugrue, Data curation, Software, Formal analysis, Validation, Investigation, Visualization,
Methodology, Writing - original draft, Project administration, Writing - review and editing; Joseph
Alan Zoller, Software, Formal analysis, Visualization, Methodology; Pritika Narayan, Data curation,
Writing - review and editing; Ake T Lu, Formal analysis, Writing - review and editing; Oscar J
Ortega-Recalde, Software, Formal analysis, Writing - review and editing; Matthew J Grant, C Simon
Bawden, Skye R Rudiger, Donna M Bond, Reuben R Hore, Karen E Sears, Nan Wang, Xiangdong Wil-
liam Yang, Resources; Amin Haghani, Data curation, Software, Formal analysis, Validation, Investiga-
tion, Visualization, Methodology, Writing - review and editing; Michael Garratt, Formal analysis,
Investigation, Writing - review and editing; Russell G Snell, Resources, Data curation, Writing -
review and editing; Timothy A Hore, Conceptualization, Resources, Data curation, Formal analysis,
Supervision, Funding acquisition, Validation, Investigation, Methodology, Project administration,
Writing - review and editing; Steve Horvath, Conceptualization, Resources, Data curation, Software,
Formal analysis, Supervision, Funding acquisition, Validation, Investigation, Methodology, Project
administration, Writing - review and editing
Author ORCIDs
Victoria J Sugrue https://orcid.org/0000-0002-0427-5146
Joseph Alan Zoller http://orcid.org/0000-0001-6309-0291
Amin Haghani http://orcid.org/0000-0002-6052-8793
Karen E Sears http://orcid.org/0000-0001-9744-9602
Xiangdong William Yang http://orcid.org/0000-0003-3705-7935
Timothy A Hore https://orcid.org/0000-0002-6735-225X
Sugrue et al. eLife 2021;10:e64932. DOI: https://doi.org/10.7554/eLife.64932 15 of 20Research article Developmental Biology Genetics and Genomics
Ethics
Animal experimentation: All protocols involving OVT73 sheep were approved by the Primary Indus-
tries and Regions South Australia (PIRSA, Approval number 19/02) Animal Ethics Committee with
oversight from the University of Auckland Animal Ethics Committee. Sheep ear tissue was obtained
from females and both intact and castrated male Merino sheep during routine on-farm ear tagging
procedures in Central Otago, New Zealand. As a small piece of tissue is removed during the ear tag-
ging process that is usually discarded by the farmer, we were able to source tissue and record the
year of birth without altering animal experience, in accordance with the New Zealand Animal Wel-
fare Act (1999) and the National Animal Ethics Advisory Committee (NAEAC) Occasional Paper No 2
(Carsons, 1998).
Decision letter and Author response
Decision letter https://doi.org/10.7554/eLife.64932.sa1
Author response https://doi.org/10.7554/eLife.64932.sa2
Additional files
Supplementary files
. Supplementary file 1. Pearson correlation between age and methylation for all sheep.
.Supplementary file 2. Gene Ontology output for the top 500 probes positively associated with
age.
. Supplementary file 3. Androgen-sensitive differentially methylated probes.
. Transparent reporting form
Data availability
Data and code is available via GitHub https://github.com/VictoriaSugrue/sheepclock (copy archived
at https://archive.softwareheritage.org/swh:1:rev:b7e3088e28025ac34513778ccb23368246fc532c).
The following dataset was generated:
Database and
Author(s) Year Dataset title Dataset URL Identifier
Sugrue VJ, Zoller 2021 Castration delays epigenetic aging https://github.com/Vic- GitHub, sheepclock
JA, Narayan P, Lu and feminises DNA methylation at toriaSugrue/sheepclock
AT, Ortega- androgen-regulated loci
Recalde OJ, Grant
MJ, Bawden CS,
Rudiger SR,
Haghani A, Bond
DM, Garratt M,
Sears KE, Wang N,
Yang XW, Snell RG,
Hore TA, Horvath S
The following previously published dataset was used:
Database and Identifier
Author(s) Year Dataset title Dataset URL
Horvath S, Snell RG 2020 DNA methylation profiles from https://www.ncbi.nlm. NCBI Gene Expression
a transgenic sheep model of nih.gov/geo/query/acc. Omnibus, GSE147003
Huntington’s disease cgi?acc=GSE147003
References
Agoulnik IU, Krause WC, Bingman WE, Rahman HT, Amrikachi M, Ayala GE, Weigel NL. 2003. Repressors of
androgen and progesterone receptor action. Journal of Biological Chemistry 278:31136–31148. DOI: https://
doi.org/10.1074/jbc.M305153200
Ammerpohl O, Bens S, Appari M, Werner R, Korn B, Drop SL, Verheijen F, van der Zwan Y, Bunch T, Hughes I,
Cools M, Riepe FG, Hiort O, Siebert R, Holterhus PM. 2013. Androgen receptor function links human sexual
Sugrue et al. eLife 2021;10:e64932. DOI: https://doi.org/10.7554/eLife.64932 16 of 20Research article Developmental Biology Genetics and Genomics
dimorphism to DNA methylation. PLOS ONE 8:e73288. DOI: https://doi.org/10.1371/journal.pone.0073288,
PMID: 24023855
Araujo AB, Dixon JM, Suarez EA, Murad MH, Guey LT, Wittert GA. 2011. Clinical review: endogenous
testosterone and mortality in men: a systematic review and meta-analysis. The Journal of Clinical Endocrinology
& Metabolism 96:3007–3019. DOI: https://doi.org/10.1210/jc.2011-1137, PMID: 21816776
Arneson A, Haghani A, Thompson MJ, Pellegrini M, Kwon SB, Vu H, Yao M, CZ L, AT L, Barnes B, Hansen KD,
Zhou W, Breeze CE, Ernst J, Horvath S. 2021. A mammalian methylation array for profiling methylation levels at
conserved sequences. bioRxiv. DOI: https://doi.org/10.1101/2021.01.07.425637
Aryee MJ, Jaffe AE, Corrada-Bravo H, Ladd-Acosta C, Feinberg AP, Hansen KD, Irizarry RA. 2014. Minfi: a
flexible and comprehensive bioconductor package for the analysis of infinium DNA methylation microarrays.
Bioinformatics 30:1363–1369. DOI: https://doi.org/10.1093/bioinformatics/btu049, PMID: 24478339
Asdell SA, Doornenbal H, Joshi SR, Sperling GA. 1967. The effects of sex steroid hormones upon longevity in
rats. Reproduction 14:113–120. DOI: https://doi.org/10.1530/jrf.0.0140113, PMID: 6033299
Atwood CS, Bowen RL. 2011. The reproductive-cell cycle theory of aging: an update. Experimental Gerontology
46:100–107. DOI: https://doi.org/10.1016/j.exger.2010.09.007, PMID: 20851172
Benedusi V, Martini E, Kallikourdis M, Villa A, Meda C, Maggi A. 2015. Ovariectomy shortens the life span of
female mice. Oncotarget 6:10801–10811. DOI: https://doi.org/10.18632/oncotarget.2984, PMID: 25719423
Bowen RL, Atwood CS. 2004. Living and dying for sex. Gerontology 50:265–290. DOI: https://doi.org/10.1159/
000079125
Brooks RC, Garratt MG. 2017. Life history evolution, reproduction, and the origins of sex-dependent aging and
longevity. Annals of the New York Academy of Sciences 1389:92–107. DOI: https://doi.org/10.1111/nyas.
13302, PMID: 28009055
Cargill SL, Carey JR, Müller HG, Anderson G. 2003. Age of ovary determines remaining life expectancy in old
ovariectomized mice. Aging Cell 2:185–190. DOI: https://doi.org/10.1046/j.1474-9728.2003.00049.x, PMID: 12
882411
Carroll JS, Liu XS, Brodsky AS, Li W, Meyer CA, Szary AJ, Eeckhoute J, Shao W, Hestermann EV, Geistlinger TR,
Fox EA, Silver PA, Brown M. 2005. Chromosome-wide mapping of estrogen receptor binding reveals long-
range regulation requiring the forkhead protein FoxA1. Cell 122:33–43. DOI: https://doi.org/10.1016/j.cell.
2005.05.008, PMID: 16009131
Carsons L. 1998. Regulation of Animal Use in Research, Testing and Teaching in New Zealand - the Black, the
White and the Grey. Surveillance.
Claessens F, Joniau S, Helsen C. 2017. Comparing the rules of engagement of androgen and glucocorticoid
receptors. Cellular and Molecular Life Sciences 74:2217–2228. DOI: https://doi.org/10.1007/s00018-017-2467-
3, PMID: 28168446
Clutton-Brock TH, Isvaran K. 2007. Sex differences in ageing in natural populations of vertebrates. Proceedings
of the Royal Society B: Biological Sciences 274:3097–3104. DOI: https://doi.org/10.1098/rspb.2007.1138
Creyghton MP, Cheng AW, Welstead GG, Kooistra T, Carey BW, Steine EJ, Hanna J, Lodato MA, Frampton GM,
Sharp PA, Boyer LA, Young RA, Jaenisch R. 2010. Histone H3K27ac separates active from poised enhancers
and predicts developmental state. PNAS 107:21931–21936. DOI: https://doi.org/10.1073/pnas.1016071107,
PMID: 21106759
de Magalhães JP, Budovsky A, Lehmann G, Costa J, Li Y, Fraifeld V, Church GM. 2009. The human ageing
genomic resources: online databases and tools for biogerontologists. Aging Cell 8:65–72. DOI: https://doi.org/
10.1111/j.1474-9726.2008.00442.x, PMID: 18986374
Dennis G, Sherman BT, Hosack DA, Yang J, Gao W, Lane HC, Lempicki RA. 2003. DAVID: database for
annotation, visualization, and integrated discovery. Genome Biology 4:R60. DOI: https://doi.org/10.1186/gb-
2003-4-9-r60
Fairlie J, Holland R, Pilkington JG, Pemberton JM, Harrington L, Nussey DH. 2016. Lifelong leukocyte telomere
dynamics and survival in a free-living mammal. Aging Cell 15:140–148. DOI: https://doi.org/10.1111/acel.
12417, PMID: 26521726
Fogarty NM, Ingham VM, Gilmour AR, Cummins LJ, Gaunt GM, Stafford J, Edwards JEH, Banks RG. 2005.
Genetic evaluation of crossbred lamb production. 1. breed and fixed effects for birth and weaning weight of
first-cross lambs, gestation length, and reproduction of base ewes. Australian Journal of Agricultural Research
56:443–453. DOI: https://doi.org/10.1071/AR04221
Friedman J, Hastie T, Tibshirani R. 2009. glmnet: Lasso and elastic-net regularized generalized linear models. 1. R
Packag version. https://cran.r-project.org/web/packages/glmnet/index.html
Gaidatzis D, Lerch A, Hahne F, Stadler MB. 2015. QuasR: quantification and annotation of short reads in R.
Bioinformatics 31:1130–1132. DOI: https://doi.org/10.1093/bioinformatics/btu781, PMID: 25417205
Hamilton JB. 1965. Relationship of castration, spaying, and sex to survival and duration of life in domestic cats.
Journal of Gerontology 20:96–104. DOI: https://doi.org/10.1093/geronj/20.1.96, PMID: 14246540
Hamilton B, Dong Y, Shindo M, Liu W, Odell I, Ruvkun G, Lee SS. 2005. A systematic RNAi screen for longevity
genes in C. elegans. Genes & Development 19:1544–1555. DOI: https://doi.org/10.1101/gad.1308205,
PMID: 15998808
Hamilton JB, Mestler GE. 1969. Mortality and survival: comparison of eunuchs with intact men and women in a
mentally retarded population. Journal of Gerontology 24:395–411. DOI: https://doi.org/10.1093/geronj/24.4.
395, PMID: 5362349
Hannum G, Guinney J, Zhao L, Zhang L, Hughes G, Sadda S, Klotzle B, Bibikova M, Fan JB, Gao Y, Deconde R,
Chen M, Rajapakse I, Friend S, Ideker T, Zhang K. 2013. Genome-wide methylation profiles reveal quantitative
Sugrue et al. eLife 2021;10:e64932. DOI: https://doi.org/10.7554/eLife.64932 17 of 20You can also read